Evaluation and evolution analysis of water ecosystem service value in the yangtze river delta region based on meta-analysis
 Hongmei Shao
 Dian Long*
  Jiaqi He
 Ling Zhang
- School of Economics and Management, China University of Geosciences, Wuhan, China
Rapid economic development, industrialization and urbanization lead to environmental pollution and damage the stability of regional ecosystems. The Yangtze River Delta region is an economically developed region in China, faces the problems of water environment pollution and water ecosystem service degradation. Reasonable assessment of water ecosystem service value (ESV) is of great significance for grasping the status of regional water ecosystem services, improving water ecological environment, and realizing regional sustainable development. This study collects 119 research literature about China, including 156 observations to establish a value transfer database; specially builds a Meta-analysis model including the variables of climate conditions, environmental pollution and environmental protection, then assesses the waters ESV in the Yangtze River Delta using the model and analyzes the changes from 2009 to 2018. The study finds that the location, population density, the area of the site, average annual precipitation, literature characteristics, landscape characteristics, wastewater discharge, environmental protection expenditure, and wastewater treatment costs can affect the water ESV significantly. Based on the meta-analysis benefit transfer model to evaluate the water ESV in Yangtze River Delta region is RMB 177,126 yuan/
1 Introduction
Ecosystem services are the various benefits that humans obtain from ecosystems (Millennium Ecosystem Assessment, 2005). Human survival is inseparable from the Earth’s ecosystems and the services they provide. In the past 50 years, the scale and speed of changes to ecosystems by human activities have accelerated (Millennium Ecosystem Assessment, 2005), and ecosystem services have become degraded and unsustainable. Compared with the needs of human survival and development, ecosystem services show scarcity characteristics and become assets that need to be maintained and managed by countries or regions. Ecosystem service value evaluation is an important link and decision-making basis for ecological compensation, government green development performance evaluation, and ecosystem collaborative management. With the industrialization and urbanization, the ecosystems of inland waters have become increasingly fragile, and problems such as the reduction of inland wetlands, the decline of water quality, and the deterioration of biodiversity have occurred. Reasonable assessment of the value of water ecosystem services can help to promote the management and sustainable use of water ecosystem services.
The research of Costanza et al. (1997) provides direction for the evaluation of land ecosystem service value. Since then, many experts have carried out extensive research on the evaluation of different types of ecosystem services at different land use scales (Bodin et al., 2006; Volk et al., 2008; Maldonado et al., 2013; Smith et al., 2015; Swirepik et al., 2016; László et al., 2018). Ouyang et al. (1999) used the market value method to estimate the six categories service value of terrestrial ecosystems in China. Xie et al. (2003); Xie et al. (2008) adjusted the evaluation model proposed by Costanza et al. (1997),and developed a service value coefficient for China’s terrestrial ecosystem, which has been widely recognized and applied in China. This method is called the Ecological Service Value Coefficient Correction Method.
The water ecosystem service functions studied and evaluated include biodiversity (Broadbent et al., 2012; Mendoza, et al., 2012; Marcos and Ortega, 2014), carbon storage (Martinez-Harms et al., 2017), food production (Lawler et al., 2014; Moran et al., 2017), species habitat (Patru-Stupariu et al., 2020), recreational value (Chaikumbung et al., 2016), water quality improvement (Van Houtven et al., 2007) and other water ecosystem service functions. The assessment objects include coral reefs (Brander et al., 2007), lagoons (Enjolras and Boisson, 2010), mangroves(Brander et al., 2012a), lakes (Reynaud and Lanzanova, 2017), wetlands (Ghermandi et al., 2010; Brander et al., 2012b; Camacho-Valdez et al., 2013; Ghermandi et al., 2016) etc. The evaluation method mainly uses the evaluation model of Costanza and Xie, and also uses the market value evaluation method (Fitzpatrick et al., 2017), non-market value evaluation method (Reynaud and Lanzanova, 2017), conditional value method (Enjolras and Boisson, 2010). The same ecosystem services can be assessed using a variety of methods, so the results are largely dependent on the choice of assessment methods, and cannot be compared.
At the same time, investigating the land ecosystem status in the study area item by item and calculating its ecosystem service value are constrained by conditions such as time and cost. Moreover, a comprehensive assessment of multiple ecosystem services is more helpful for eco-environmental management than a single assessment of specific services (Taye et al., 2021). In this case, benefit transfer methods have attracted attention (Brander et al., 2006; Johnston and Rosenberger, 2010).
This method utilizes a large number of research results, selects an appropriate amount of variables, adopts statistical and metro-logical methods to construct a corresponding value transfer model, and transfers the ecosystem service value of the study site to the policy site based on this, so as to obtain the ecosystem service value of the site to be studied (Zhao and Wang, 2011). Meta-analysis which is one kind of benefit transfer method has been used to evaluate the value of land ecosystem services, including research on the value of water ecosystem services since the year of 2000. The scope of the assessment includes Europe (Brander et al., 2006), the United States (Van Houtven et al., 2007), Canada (L'Ecuyer et al., 2021), northern Mexico (Camacho-Valdez et al., 2013), Southeast Asia (Brander et al., 2012a), tropical India (Ghermandi et al., 2016), East Africa (Brander et al., 2007), developing countries (Chaikumbung et al., 2016) and the global (Enjolras and Boisson, 2010; Reynaud and Lanzanova, 2017). Researches on China include the Beijing-Tianjin-Hebei region (Zhang et al., 2016) and the city of Qingdao (Sun et al., 2018), but has not covered the Yangtze River Delta region. Most of the literatures show that the area of the study site (Brander et al., 2007; Enjolras and Boisson, 2010; Ghermandi et al., 2010; Fitzpatrick et al., 2017; Zhou et al., 2020), the location (Zhang et al., 2016), the type of water area (Ghermandi et al., 2010; Johnston and Rosenberger, 2010; Camacho-Valdez et al., 2013; Zhou et al., 2020), ecosystem services (Brander et al., 2007; Enjolras and Boisson, 2010; Ghermandi et al., 2010; Johnston and Rosenberger, 2010; Camacho-Valdez et al., 2013; Bockarjova et al., 2020), population density (Ghermandi et al., 2010; Johnston and Rosenberger, 2010; Camacho-Valdez et al., 2013; Eric et al., 2022), the per capita GDP (Ghermandi et al., 2010; Mendoza et al., 2012; Brander et al., 2012b; Johnston and Rosenberger, 2010; Zhang et al., 2015; Ghermandi et al., 2016; Taye et al., 2021), evaluation method (Brander et al., 2007; Ghermandi et al., 2010; Johnston and Rosenberger, 2010; Taye et al., 2021), publication level (Enjolras and Boisson, 2010; Ghermandi et al., 2010) and the year of publication (Enjolras and Boisson, 2010; Camacho-Valdez et al., 2013; Ghermandi et al., 2016; Taye et al., 2021) affect the value of water ecosystem services. Few literature attempt to use the landscape characteristics (Reynaud and Lanzanova, 2017; Perosa et al., 2021) and climatic conditions of the research site (Nelson et al., 2013; Li et al., 2016; Siriwardena et al., 2016; Gollany and Venterea, 2018; Scheiter et al., 2019; Balasubramanian, 2019; Kang et al., 2020) as variables in the Meta value transfer model, however, similar studies have not yet appeared in the evaluation of water ESV. The main drivers of inland water ecosystems are habitat change, climate change, overuse and pollution (Millennium Ecosystem Assessment, 2005). Therefore, the impact of climatic conditions and environmental pollution on the water ESV needs attention. In addition, the evaluation objects of related research in China are mainly large-scale areas such as lakes, wetlands and watersheds, and there is a lack of local-scale research. Without evaluating the water ecological environment of a specific area, it is impossible to provide effective opinions on the sustainable development of water ecosystem services in a specific area.
The Yangtze River Delta region with a relatively high level of economic development and population concentration in China, a recognized world-class urban agglomeration, plays a pivotal and strategic role in building China’s modernization drive and all-round opening pattern. In 2020, the GDP, total import and export, foreign direct investment, and foreign investment accounted for 24.5%, 37%, 39%, 29% in China, and the urbanization rate is about 68%. With the rapid economic development, this region is faced with the problems of water quality decline, water environment pollution, and water ecosystem degradation. It is urgent to evaluate the water ESV of the regional.
This study estimates the ESV of the waters in the Yangtze River Delta region on the basis of optimizing the Meta value transfer model, and analyzes the factors that affect the water ESV, so as to provide support for the rational use of water resources and the decision-making of water ecological protection in the Yangtze River Delta region. This study focuses on the impact of climatic conditions, environmental pollution and protection on the water ESV, and provides empirical reference for the assessment of ecosystem service value at the local scale, so as to promote the coordinated development of regional economy, society and environment.
2 Materials and methods
2.1 Study area
The Yangtze River Delta region is located at the interface between the eastern coastal areas of China and the Yangtze River Basin (Figure 1). The Yangtze River Delta region includes Shanghai, Zhejiang Province, Jiangsu Province and Anhui Province, covering an area of 358,000 km2, which accounts for 3.73% of China’s land area. The average elevation of the area is less than 200 m, and most of it is plain with flat terrain. The climate in this area is the northeast subtropical monsoon climate, which is warm and humid, with rain and heat in the same period. The annual average temperature is 13°C∼22°C, the annual precipitation is 1,000∼1,400 mm, and the seasonal distribution is relatively uniform. There are many rivers and lakes in this region, with the highest river network density in China. In 2018, the total amount of water resources was 211.91 billion m3, accounting for 7.72% of the national total. But the water resources per capita is only 940.3 m3, less than half of the national average. The rapid development of regional economy has brought huge demand for water resources and put pressure on water ecosystem services. Industrial wastewater and domestic sewage discharge are major factors in water pollution. The region realized the importance of ecological environmental protection earlier, actively explored the ecological compensation mechanism of the river basin, and took the lead in implementing the river chief system and the lake chief system. The ecological environmental protection system and policies are relatively complete. In recent years, the ecological environment in the Yangtze River Delta region has continued to improve, but there are still problems such as insufficient overall protection, water environment pollution, ecosystem fragmentation and service function degradation. Although the Taihu Lake, Huaihe River and other watersheds have achieved remarkable results, and the water quality of the main streams of the Yangtze River and Qiantang River has remained good, the water pollution of small and medium-sized rivers is still serious. Taihu Lake, Yangcheng Lake, Dianshan Lake and other key lake areas show different degrees of eutrophication trends. The protection and restoration of the ecological environment is an urgent need for the comprehensive economic integration of the Yangtze River Delta region. Therefore, evaluating the status of water ecosystem services in the Yangtze River Delta region and analyzing the main influencing factors will help to clarify the path for the coordinated development of rapid economic growth and the improvement of ecosystem service functions, promote the green and high-quality development in this region.
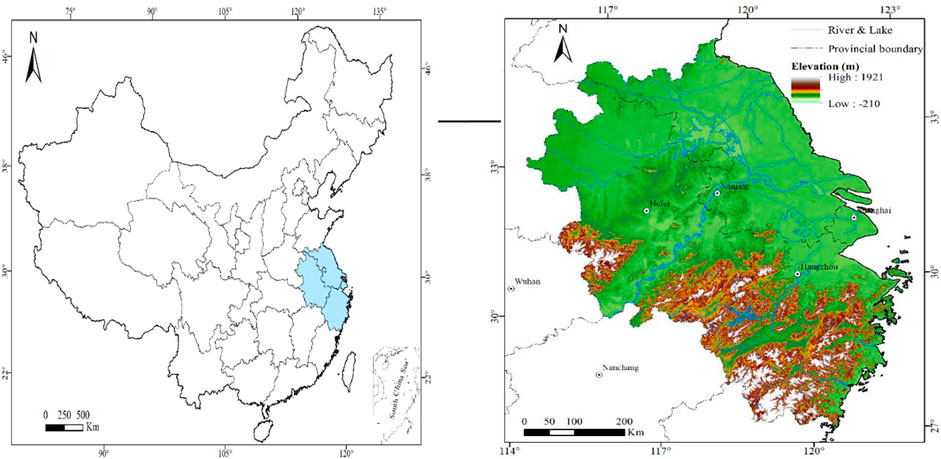
FIGURE 1. Location of the Yangtze River Delta region of China.
2.2 Data sources
Literature comes from China National Knowledge Infrastructure (CNKI), Web of Science and Google Scholar. This study search and collect the papers with keywords such as “ecological value”, “value transfer”, “water ecological value”, “meta-analysis”, “ecosystem services”, “non-market valuation”, which published about the water ecosystem services value of China after 2000.Literature meet the following requirements will be included in the value transfer database: 1) The study site is located in China; 2) The document clearly obtains the evaluation result of the water ecosystem service value; 3) The area data of the study site is available in the document or can be obtained from information channels such as statistical yearbooks. After screening, a total of 119 literature met the requirements, and 156 observations were obtained (Table1). The value transfer database included the information of the document title, author, research time, publication time, whether the document is a core journal, the location of the study site, the area of the study, unit area ecosystem service value of water, per capita GDP, population density which comes from 119 literature. Of the 119 articles, 62 were in the central and western regions, accounting for 51.2%, and 92 articles in core journals accounted for 77.31%. The assessment year range is 1986–2017.
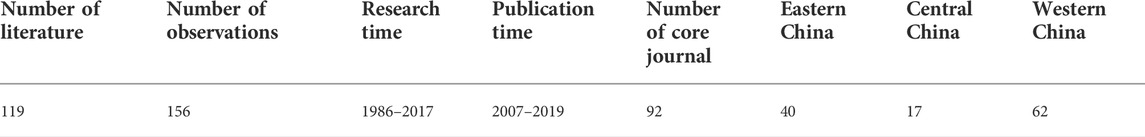
TABLE 1. Information about literature included in the value transfer database.
In order to analyze the influence of the area on the of water ESV, this paper divides the study site into three major areas, east, middle and west, according to the division standard of my country’s mainland area by the National Bureau of Statistics. The data of per capita GDP come from the Statistical Yearbook and the National Bureau of Statistics (https://data.stats.gov.cn/).Taking into account changes in currency prices, per capita GDP and the value of ecosystem services are calculated on the basis of 2010 using the regional GDP per capita index. When calculating the population density of the study site, the scope of the beneficiary population is defined as the prefecture-level administrative region where the study area is located, and data come from the statistical yearbooks of various provinces in China over the years. The characteristics of climatic conditions are expressed by the average annual precipitation, and the data are from the National Bureau of Statistics, the Ministry of Water Resources of the People’s Republic of China (http://www.mwr.gov.cn/sj/), and the China Meteorological Administration (http://data.cma.cn/). The landscape characteristics are expressed by the number of water landscapes and nature reserves set up in the provinces to which the study area belongs. The data are from the National Bureau of Statistics and China Environmental Protection Database (http://hbk.cei.cn/aspx/Left_DB.aspx?ID=5). The missing data is calculated using the average annual growth rate of the existing data. The characteristics of environmental pollution are represented by the amount of wastewater discharge. The data are from the National Bureau of Statistics and the Ministry of Housing and Urban-Rural Development of the People’s Republic of China (https://www.mohurd.gov.cn/). The missing data are calculated using the average annual growth rate of the existing data. The characteristics of environmental protection are represented by the variables of environmental protection expenditure and wastewater treatment cost, and the data are from the National Bureau of Statistics of China,the Ministry of Ecology and Environment of the People’s Republic of China (http://www.mee.gov.cn/hjzl/sthjzk/). Whether the publication is a core journal is determined according to the 2020 Peking University Chinese Core Journal Catalogue. According to the 2007 China National Standard for Land Use Classification, the water ecosystem mainly includes six typical types of rivers, lakes, reservoirs, ponds, paddy fields and ditches. The water area of the Yangtze River Delta region adopts the data of the Second China Land Survey.
2.3 Methods
2.3.1 Evaluation model based on meta-analysis
The general model of the meta-analysis (Bergstrom and Taylor, 2006) is:
In Eq. 1,
Referring to the method (Brander et al., 2012a; Salem and Mercer, 2012; Taye et al., 2021) and combining the characteristics of water ecosystem services studied in this paper, a meta-model, Eqs 2, 3, is built. The variable information is shown in Table 2. The variables of annual precipitation, wastewater discharge, environmental protection expenditure, and wastewater treatment cost are included in Eqs 2, 3 to explore the impact on the value of water ecosystem services. The numerical variables (e.g. GDP per capita, the average annual precipitation, the amount of wastewater discharge) in this study are included in the model in the form of natural logarithms, which can reduce the fluctuation of the original data (but cannot be eliminated), improve the accuracy of model fitting and reduce heteroscedasticity (Ghermandi et al., 2010). Eq. 3 contains a quadratic term for water area, which is used to analyze whether there is an area threshold for water ecosystems value (Fitzpatrick et al., 2017; Fan et al., 2020). The ecosystem service functions assessed by the literature in the value transfer database are basically the same, so ecosystem service function does not taken as a variable; Similarly, 114 of the 119 literature in the value transfer database used the Ecological Service Value Coefficient Correction Method (Costanza et al., 1997; Xie et al., 2003; Xie et al., 2008) to calculate the ecosystem service value of water in a specific area, so the evaluation method does not taken as a variable.
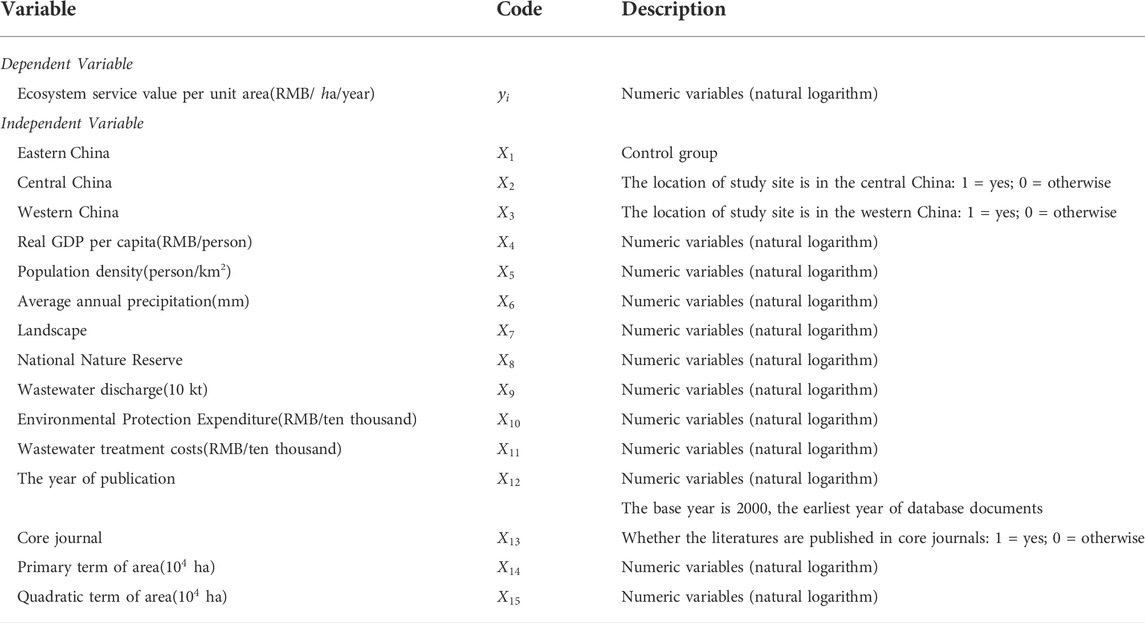
TABLE 2. Explanation of variables in Meta-regression model.
2.3.2 Validity test
Before using the Meta regression model for value transfer, in addition to the linear regression test, it is necessary to pass the validity test to avoid major transfer errors. In this paper, an error test, Paired-samples t-test, and correlation coefficient test are adopted to test the validity of the prediction model.
1) Error test. The error test reflects the effectiveness of the relative difference between the real value and the forecast value. The smaller the difference, the higher the effectiveness of the benefit transfer. The calculation formula is as follows:
In Eq. 4,
2) Paired-samples t-test. Paired-samples t-test reflects whether the mean of the difference between the real value and the forecast value is statistically significantly different. Paired-samples t-test is based on the following propositions:
Rejecting the null hypothesis
The paired-samples t-test was performed on two non-independent samples, and the statistic of the paired-samples t-test is as follows:
In the formula,
3) Correlation coefficient test. Correlation coefficient test is an effective test method used to measure the degree of correlation and trend between the forecast value and the real value. The Pearson correlation coefficient
Assuming that the Pearson correlation coefficient is zero, the validity of the value transfer requires that the real value and the forecast value are correlated, and the null hypothesis should be rejected.
3 Results
3.1 Results of the meta- regression model
In this paper, OLS (Hynes et al., 2018) is used to perform regression analysis on Eqs 2, 3. As shown in Table 3, the Adjusted R2 of model 1 is 0.8104, indicating that the model variables can explain 81.04% of the water ESV per unit area, and the Adjusted R2 of Equation (3), which includes the quadratic term of the water area, becomes lower. The primary term of area in model 1 is significantly negative (p<1%)), the coefficients of the primary term and quadratic term of area in model 2 are both negative, and the primary term of area becomes insignificant (p>5%)), indicating that there is no inflection point in the impact of water area on ecosystem service value. By comparing the results of the two models, except for the water area variable, the direction, magnitude and significance of the remaining independent variable coefficients are basically the same. Therefore, this paper chooses model 1 as the value transfer model of water ecosystem services.
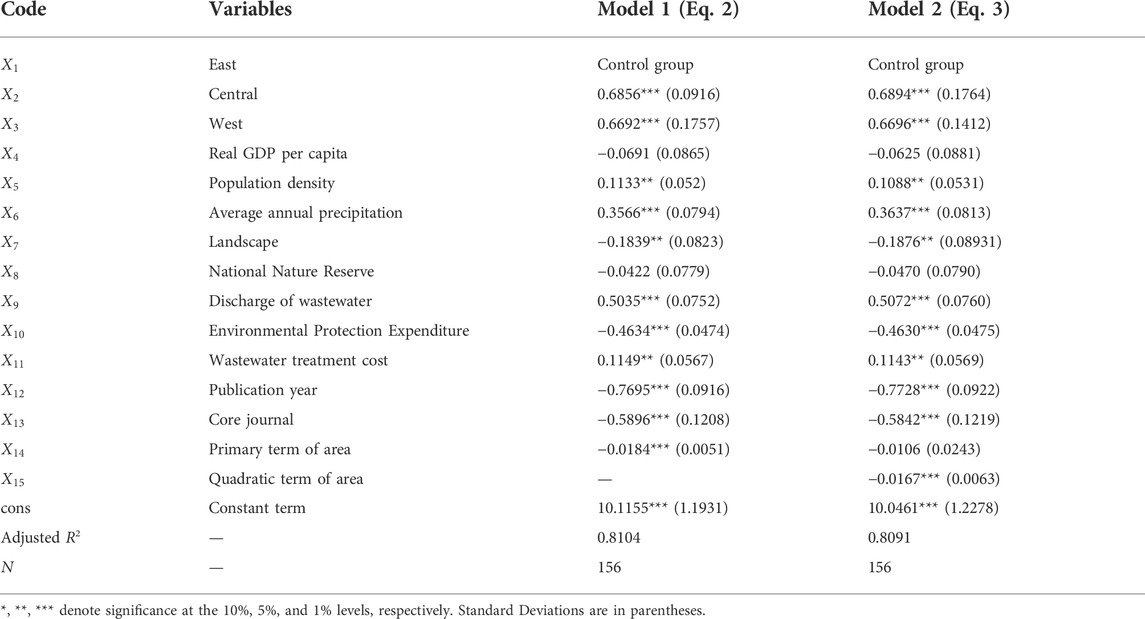
TABLE 3. Regression results of benefit transfer model in meta-analysis.
According to the p value, it can be seen that except per capita GDP and nature reserves (p>5%), other variables have significant effects. The average annual precipitation had a significant positive effect on the water ESV (p<1%). The increase in precipitation can raise the water level of the water area, and the increase in the amount of water resources can alleviate the problem of the decline of lake and drinking water quality to a certain extent. Wastewater discharge has a positive impact on water ecosystem service value, which is inconsistent with expectations. Environmental protection expenditure has a significant inhibitory effect on the service value of water ecosystems, but wastewater treatment costs have a significant positive effect, indicating that environmental protection expenditure items are relatively broad, and wastewater treatment costs directly promote the improvement of water ecological environment.
Compared with the eastern region, the central and western regions have a significant promoting effect on the service value of water ecosystems, and the impact effects are 0.6856 and 0.6692, respectively. This result is in line with the distribution characteristics of water resources in our country. The real per capita GDP has a negative impact on the service value of water ecosystems, indicating that China’s current economic development is at the expense of destroying the water ecological environment; but the p value of per capita GDP is not significant. The impact of population density on the water ESV was significantly positive. The greater the population density, the greater the potential number of people benefiting from the ecosystem services provided by the waters (Ghermandi et al., 2010; Johnston and Rosenberger, 2010; Camacho-Valdez et al., 2013). The water area has a significant negative impact on the water ecosystem service value, indicating that the water area and the unit ESV may have the phenomenon of decreasing scale (Enjolras and Boisson, 2010). When problems such as water quality decline and aquatic biodiversity reduction continue to occur in the water ecosystem, the larger the area, the lower the water ESV per unit.
Landscape settings have a significant inhibitory effect on the service value of water ecosystems. It shows that the commercial development of water resources has not done a good job of environmental protection in the scenic area, which is not conducive to the improvement of the service value of the water ecosystem. At the same time, the results showed that nature reserves did not improve the water ecosystem service value. The reason may be that the landscape variables are represented by the number of geological and geomorphological landscapes and nature reserves in the province of the study area, rather than directly reflecting the landscape characteristics of the study area.
The publication year has a significant negative impact. The research results show that the value of water ecosystem services decreases by about 0.77% per year. The reason may be that with the passage of time, the data acquisition methods and processing techniques are more rigorous, and the results obtained are more accurate, resulting in a decay effect over time. In addition, core journals report lower research values than non-core journals. Articles in core journals are subject to peer review, a process that may lead to more conservative valuations (Chaikumbung et al., 2016).
3.2 Validity test of the meta- regression model
3.2.1 Error test
In this paper, the “set aside method” is used to select the control group according to the proportion of 10% of the total sample size in the database for validity test. The control sample includes 5 policy areas in the eastern region, 2 policy areas in the central region, and 8 policy areas in the western region, 12 are core journals and 3 are non-core journals. The calculated out-of-sample error transfer range is between 2.49% and 18.07%, and the average transfer value is 5.64%. The results show that the forecast value of out-of-sample data is effective, and the model constructed in this paper passes the error test.
3.2.2 Paired-samples t-Test
Paired-samples t-test is performed on the true value and forecast value of the sample, and Table 4 is obtained.
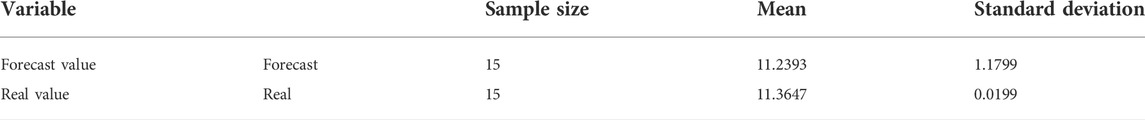
TABLE 4. Paired t-test results.
Among them, mean (diff) represents the mean of the difference, mean (forecast-real) represents the mean of the difference between the forecast value and the real value.
When
3.2.3 Correlation coefficient test
The correlation coefficient test is carried out on the real value and forecast value of the sample, and Table 5 is obtained. The coefficient between the forecast value and the actual value is between 0.5 and 0.8, which is a significant correlation, so it passes the correlation coefficient test.
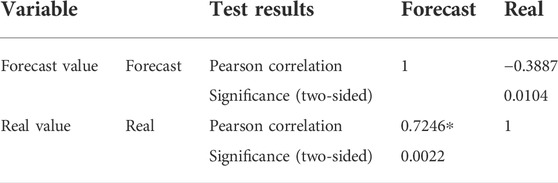
TABLE 5. Correlation coefficient test results.
3.3 Forecast results of the water ESV in the yangtze river delta region
The Yangtze River Delta region includes four provinces and cities: Shanghai, Jiangsu, Zhejiang and Anhui. The above four provinces and cities are located in the eastern region of China, so the geographical partition variables are not assigned. The year of publication is the year of writing 2021, with 2000 as the minimum base year, and the value is 22. The publication quality is expressed by the publication level, that is, whether it belongs to the core journals of Peking University. This study does not belong to the core journals of Peking University, and the value is 0.The unit area value of the water ecosystem services in the four provinces and cities in the Yangtze River Delta region from 2009 to 2018 was calculated (Table 6). In 2009 the total value of water ecosystem services in the Yangtze River Delta region was RMB1434.0423 million yuan and the value per unit area was RMB 131,292 yuan/
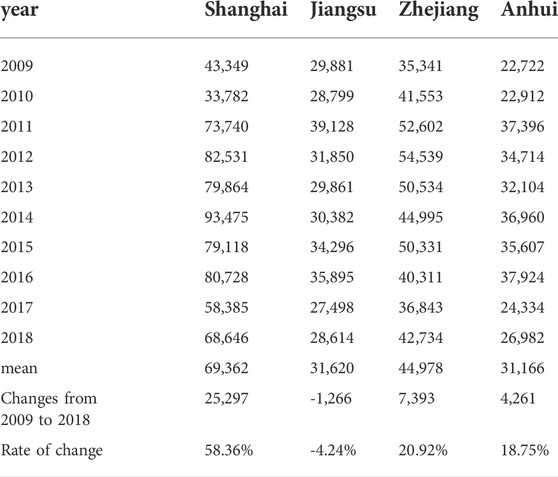
TABLE 6. The per unit area water ESV in the Yangtze river delta region (yuan/ha).
From 2009 to 2018, the total value of water ecosystem services in the Yangtze River Delta region increased in fluctuations, with an overall value-added of about 3.19481 billion yuan. As shown in Figure 2, except for Jiangsu Province, the total value of water ecosystem services in Shanghai, Zhejiang Province and Anhui Province increased in fluctuations, among which Shanghai increased the most, with an increase of about 5.59614 billion yuan; The second is Zhejiang Province, with an increase of about 4.28838 billion yuan; Anhui Province has the least increase, about 1.29057 billion yuan.
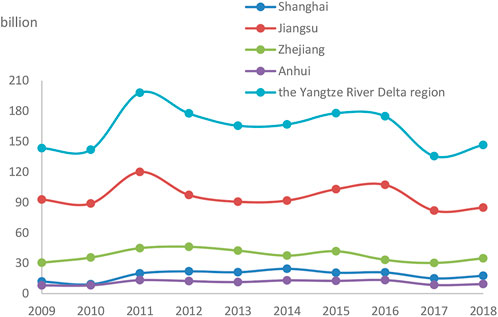
FIGURE 2. Change of the total water ESV in the Yangtze River Delta Region from 2009 to 2018.
Among the four provinces and cities in the Yangtze River Delta region, the average value of ecosystem services per unit area of water in Jiangsu Province is about 31,620 yuan/
The value per unit area is ranked from high to low as follows: Shanghai, Zhejiang province, Jiangsu province, and Anhui provinces, among which Jiangsu province and Zhejiang province have higher total water ecosystem services value, which is related to their larger water area (Figure 3); the average value of ecosystem services per unit area of Shanghai waters is about 69,362 yuan/ha, and its unit value is about 1.5–2.5 times that of other provinces and cities. The total value of ecosystem services in the waters of provinces and cities in the Yangtze River Delta region in 2018 is ranked from high to low: Jiangsu Province, Zhejiang Province, Shanghai, and Anhui Province (Figure 4).
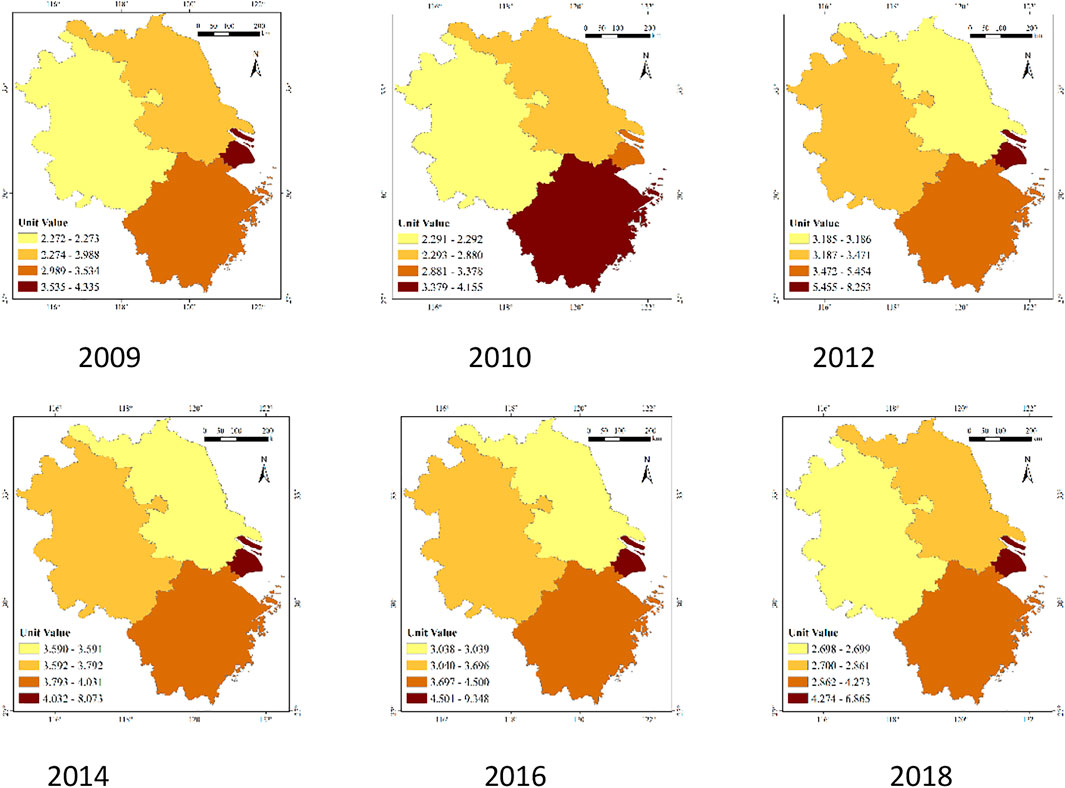
FIGURE 3. Spatial variation of the per unit area water ESV in the Yangtze River Delta Region From 2009 to 2018. Note: The Unit Value of the water ecosystem services is 10,000.
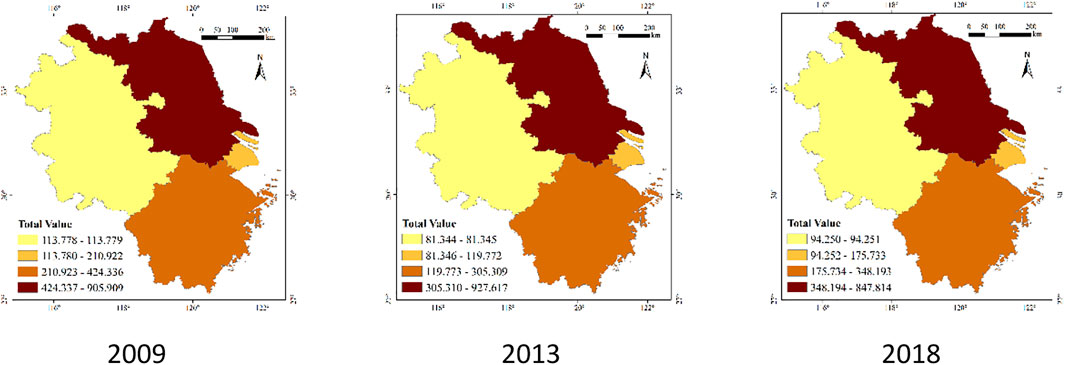
FIGURE 4. Spatial variation of the total water ESV in the Yangtze River Delta region from 2009 to 2018. Note: The unit of the total water ESV is 100 million yuan.
4 Discussion
4.1 The impact of climate change, environmental pollution and conservation variables on the water ESV is significant and worthy of attention
Climate change, environmental pollution and conservation variables are the focus of this paper. Relevant scholars have analyzed the impact of different climatic conditions on the value of ecosystem services such as forests, cultivated land, and grasslands (Nelson et al., 2013; Li et al., 2016; Siriwardena et al., 2016; Gollany and Venterea, 2018; Scheiter et al., 2019; Balasubramanian, 2019; Kang et al., 2020). This paper believes that it is particularly important to study the impact of climatic conditions on the value of water ecosystem services. In recent years, under the influence of global warming and extreme climate, the frequency and intensity of heavy rainfall will increase. The resulting increase in runoff can carry a large amount of suspended solids, nutrients, heavy metals and organic pollution in the watershed and surrounding cities into the water, it may have an impact on the ecosystem structure and function of the water. At the same time, less precipitation will also lead to water area shrinkage, poor water quality, reduction of water storage capacity, eutrophication of water bodies, and reduction of aquatic biodiversity. Combined with the characteristics of water ecosystems, this paper believes that compared with temperature, evaporation, frost-free period, etc., the impact of precipitation on the service value of water ecosystems is more intuitive. The results of this study show that the average annual precipitation has a significant positive effect on the value of water ecosystem services.
In the results of this paper, the positive impact of wastewater discharge on the value of water ecosystem services may be related to the large proportion of the central and western regions (52.1%) in the constructed value transfer database. From 2010 to 2017, the average wastewater discharge in the western region of our country was about 13,272.59 million tons, 50% of that in the eastern region. The negative impact of wastewater discharge on the water environment has a process of quantitative change to qualitative change. Only when the wastewater discharge is directly discharged without treatment and exceeds the capacity of the water area, the ecological environment of the water area will be harmed. The level of urbanization and industrialization in western China is relatively backward, and the discharge of wastewater may not exceed the water capacity, so the regression results have a positive impact. In addition, the cost of water pollution control in environmental protection expenditures can really help improve the value of local ecosystem services. From 2010 to 2017, the sub-projects of local financial environmental protection expenditure did not explicitly target the improvement of water ecological environment. The results that the inhibitory effect of local fiscal environmental protection expenditure on water ecosystem services may be related to this.
4.2 Social economy, environmental pollution and environmental protection are important factors affecting the waters EVS of the yangtze river delta region
Years, geographical divisions, publication quality, climate change, environmental protection and pollution factors have a greater impact on the value of water ecosystem services. As the data of geographical divisions, natural climatic conditions, literature publication years, and literature quality of the four provinces and cities in the Yangtze River Economic Belt are the same, the regional differences in the value of water ecosystem services per unit area are mainly affected by the characteristics of social economy, environmental pollution and environmental protection. Changes in total value are also affected by changes in water area. In the Yangtze River Delta region, Shanghai has the highest average value per unit area, per capita GDP and population density, while Anhui Province has the lowest. Although the effect of per capita GDP in the research results is negative, the economic development characteristics combined with population density have a positive effect on ESV in the waters of the Yangtze River Delta. Areas with high levels of economic development have high ESV in waters.
The Yangtze River Delta region is economically developed, and the discharge of wastewater is increasing year by year. Among them, the discharge of wastewater in Jiangsu Province is the highest, which is an important factor for the high value per unit area of Jiangsu Province. The Yangtze River Delta region attaches great importance to environmental protection. Although the total amount of wastewater discharge is high, more wastewater treatment facilities are invested, and the wastewater treatment rate and compliance rate are relatively high, reducing the degree of environmental pollution caused by wastewater discharge. To a certain extent, it can explain the positive effect of wastewater discharge on the value of the results shown in this paper. The revelation is that the government should not only focus on controlling the total discharge, but also on the quality of the discharge (the rate of compliance with wastewater treatment standards) when controlling pollution discharge. The impact of environmental pollution and environmental protection on value is relative. Studies have shown that water pollution control costs in environmental protection expenditures can really help improve the value of local ecosystem services. Although the environmental protection expenditures in the provinces and cities in the Yangtze River Delta are increasing year by year, the proportion of water-related environmental protection expenditures has always been low, resulting in a decline in the value of the unit area of water ecosystem services in the provinces and cities. In 2017 and 2018, the expenditures related to water environment protection in Jiangsu Province only accounted for 0.34% and 0.82% of the expenditures on environmental protection, less than 1%. Therefore, increasing the expenditure on water environment protection will help to increase the value of water ecosystem services. In the case of limited financial funds, governments at all levels should allocate the investment funds reasonably according to the importance of different land types, find out the main contradictions facing the current water ecological environment, carry out targeted governance, and improve the utilization efficiency of funds.
4.3 Limitation and further research
The limitations of this study exist in two aspects. First, the meta-analysis results were influenced by the samples in the value transfer database. 1) Due to the geographical factors and distribution characteristics of water resources in our country, half of the literature research sites in the database are in the western region, while the economic and social development of central and eastern China is different, resulting in the impact of per capita GDP, climate variables, and environmental pollution variables to deviate from expectations; 2) The specific ecosystem service functions involved in the literature in the database are basically the same, and 95% of them use the same type of assessment method, so this paper does not explain the impact of service function characteristics and research method characteristics; 3) The database of this article is mainly Chinese literature. Therefore, it is necessary to continuously expand and update the sample information of the database in the future to improve the interpretation accuracy of the model and establish a long-term transfer model of water ecosystem service value. Second, the data of the characteristic variables of landscape, climate change, environmental pollution and environmental protection are selected from the data of the provinces and cities where the waters are located, which cannot accurately reflect the characteristics of the research site, and affect the significance of the results and the degree of variable interpretation. In the future, more attempts will be made to explore the impact of climate variables (temperature) on aquatic ecosystem services.
5 Conclusion
In this paper, a water ecosystem service value transfer model is proposed based on meta-analysis method for evaluating the Yangtze River Delta region. Base on the previous findings, several conclusions can be outlined as follows:
First, the meta-analysis value transfer model is optimized, and the factors affecting the water EVS are more comprehensively considered. On the basis of considering factors such as per capita GDP, population density, geographical division, etc., this paper also introduces natural climatic conditions (average annual precipitation), scenic attribute factors (the number of scenic spots and nature reserves set up in the province where the study area is located), environmental pollution (wastewater discharge) and environmental protection (environmental protection expenditures and wastewater treatment costs) and other factors. Using error test, Paired-samples t-test and correlation coefficient test to test the validity of water ecosystem service value transfer model, the results show that the model is reliable and effective.
Second, the regression results of the meta-analysis model show that: 1) Variables such as the year of publication, whether it is a core journal, water area, the per capita GDP, landscape attribute variables, and environmental protection costs all have a negative impact on the service value of water ecosystems; 2) The central and western regions, population density, average annual precipitation, total wastewater discharge and wastewater treatment costs all have a positive impact on the value of water ecosystem services; 3) The impact of per capita GDP and nature reserves is not significant.
Third,the water ESV in the Yangtze River Delta region were about 177,126 yuan/ha/year, with a total value of about 16,281,893 yuan/year from 2009 to 2018 and there are differences among provinces and cities.The higher total ESV of water areas in Jiangsu and Zhejiang provinces is related to their larger water area. The higher ESV per unit area in Shanghai affected by characteristics of economic development, waste water discharge and waste water treatment costs.
The main point of this paper is to show that the meta-analysis method has the advantages of quickness, convenience and low cost in evaluating the value of ecosystem services, which is of great significance to the accounting of natural resources assets (Vedogbeton and Johnston, 2020; Grammatikopoulou and Vackarova, 2021; Kang et al., 2022). At the same time, climate change, environmental pollution and environmental protection have an impact on the value of water ecosystem services, and the current government expenditure on wastewater treatment has a positive effect. Therefore, continuously strengthening environmental governance and ecological protection will help enhance the regional value of water ecological services. For example: increasing investment in water environment pollution control, rationally allocating funds for environmental protection expenditure, increasing investment in sewage treatment technology research and construction.
Data availability statement
The original contributions presented in the study are included in the article/supplementary material, further inquiries can be directed to the corresponding author.
Author contributions
Conceptualization, HS; methodology, DL, JH; formal analysis, DL, JH, LZ; data curation, DL, JH, LZ.; writing—original draft preparation, HS, DL; writing—review and editing, HS; supervision, HS. All authors have read and agreed to the published version of the manuscript.
Funding
This research was supported by the Humanities and Social Sciences Fund of the Ministry of Education of China (Grant No.17YJC790122).
Acknowledgments
We would like to thank the reviewers for their thoughtful comments that helped improve the quality of this work.
Conflict of interest
The authors declare that the research was conducted in the absence of any commercial or financial relationships that could be construed as a potential conflict of interest.
Publisher’s note
All claims expressed in this article are solely those of the authors and do not necessarily represent those of their affiliated organizations, or those of the publisher, the editors and the reviewers. Any product that may be evaluated in this article, or claim that may be made by its manufacturer, is not guaranteed or endorsed by the publisher.
References
Balasubramanian, M. (2019). Economic value of regulating ecosystem services: A comprehensive at the global level review. Environ. Monit. Assess. 191 (10), 616. doi:10.1007/s10661-019-7758-8
Bergstrom, J. C., and Taylor, L. O. (2006). Using meta-analysis for benefits transfer: Theory and practice. Ecol. Econ. 60 (2), 351–360. doi:10.1016/j.ecolecon.2006.06.015
Bockarjova, M., Botzen, W. J. W., and Koetse, M. J. (2020). Economic valuation of green and blue nature in cities: A meta-analysis. Ecol. Econ. 169, 106480. doi:10.1016/j.ecolecon.2019.106480
Bodin, O., Tengo, M., Norman, A., Lundberg, J., and Elmqvist, T. (2006). The value of small size: Loss of forest patches and ecological thresholds in southern Madagascar. Ecol. Appl. 16 (2), 440–451. doi:10.1890/1051-0761(2006)016[0440:TVOSSL]2.0.CO;2
Brander, L. M., Bräuer, I., Gerdes, H., Ghermandi, A., Kuik, O., Markandya, A., et al. (2012b). Using meta-analysis and GIS for value transfer and scaling up: Valuing climate change induced losses of European wetlands. Environ. Resour. Econ. (Dordr). 52 (3), 395–413. doi:10.1007/s10640-011-9535-1
Brander, L. M., Florax, R. J. G. M., and Vermat, J. E. (2006). The empirics of wetland valuation: A comprehensive summary and a meta-analysis of the literature. Environ. Resour. Econ. (Dordr). 33 (2), 223–250. doi:10.1007/s10640-005-3104-4
Brander, L. M., Van, B. P., and Cesar, H. S. J. (2007). The recreational value of coral reefs: A meta-analysis. Ecol. Econ. 63 (1), 209–218. doi:10.1016/j.ecolecon.2006.11.002
Brander, L. M., Wagtendonk, A. J., Hussain, S. S., McVittie, A., Verburg, P. H., de Groot, R. S., et al. (2012a). Ecosystem service values for mangroves in Southeast Asia: A meta-analysis and value transfer application. Ecosyst. Serv. 1 (1), 62–69. doi:10.1016/j.ecoser.2012.06.003
Broadbent, E. N., Almeyda Zambrano, A. M., Dirzo, R., Durham, W. H., Driscoll, L., Gallagher, P., et al. (2012). The effect of land use change and ecotourism on biodiversity: A case study of manuel antonio, Costa Rica, from 1985 to 2008. Landsc. Ecol. 27 (5), 731–744. doi:10.1007/s10980-012-9722-7
Camacho-Valdez, V., Ruiz-Luna, A., Ghermandi, A., and Nunes, P. A. (2013). Valuation of ecosystem services provided by coastal wetlands in northwest Mexico. Ocean Coast. Manag. 78, 1–11. doi:10.1016/j.ocecoaman.2013.02.017
Chaikumbung, M., Doucouliagos, H., and Scarborough, H. (2016). The economic value of wetlands in developing countries: A meta-regression analysis. Ecol. Econ. 124, 164–174. doi:10.1016/j.ecolecon.2016.01.022
Costanza, R., dArge, R., deGroot, R., Farber, S., Grasso, M., Hannon, B., et al. (1997). The value of the world's ecosystem services and natural capital. Nature 387 (6630), 253–260. doi:10.1038/387253a0
Enjolras, G., and Boisson, J. M. (2010). Valuing lagoons using a meta-analytical approach: Methodological and practical issues. J. Environ. Plan. Manag. 53 (8), 1031–1049. doi:10.1080/09640568.2010.495553
Eric, A., Chrystal, M. P., Erik, A., Kenneth, B., and Robert, C. (2022). Evaluating ecosystem services for agricultural wetlands: A systematic review and meta-analysis. Wetl. Ecol. Manag. doi:10.1007/s11273-022-09857-5
Fan, X. S., He, P., Hou, L. P., and Meng, X. (2020). Review of international research progress on ecological threshold. Res. Environ. Sci. 33 (3), 691–699. doi:10.13198/j.issn.1001-6929.2019.10.13
Fitzpatrick, L., Parmeter, C. F., and Agars, J. (2017). Threshold effects in meta-analyses with application to benefit transfer for coral reef valuation. Ecol. Econ. 133, 74–85. doi:10.1016/j.ecolecon.2016.11.015
Ghermandi, A., Sheela, A. M., and Justus, J. (2016). Integrating similarity analysis and ecosystem service value transfer: Results from a tropical coastal wetland in India. Ecosyst. Serv. 22, 73–82. doi:10.1016/j.ecoser.2016.09.014
Ghermandi, A., Van Den Bergh, J. C., Brander, L. M., de Groot, H., and Nunes, P. A. (2010). Values of natural and human-made wetlands: A meta-analysis. Water Resour. Res. 46, W12516. doi:10.1029/2010WR009071
Gollany, H. T., and Venterea, R. T. (2018). Measurements and models to identify agroecosystem practices that enhance soil organic carbon under changing climate. J. Environ. Qual. 47 (4), 579–587. doi:10.2134/jeq2018.05.0213
Grammatikopoulou, L., and Vackarova, D. (2021). The value of forest ecosystem services: A meta-analysis at the European scale and application to national ecosystem accounting. Ecosyst. Serv. 48, 101262. doi:10.1016/j.ecoser.2021.101262
Hynes, S., Ghermandi, A., Norton, D., and Williams, H. (2018). Marine recreational ecosystem service value estimation: A meta-analysis with cultural considerations. Ecosyst. Serv. 31, 410–419. doi:10.1016/j.ecoser.2018.02.001
Johnston, R. J., and Rosenberger, R. S. (2010). Methods, trends and controversies in contemporary benefit transfer. J. Econ. Surv. 24 (3), 479–510. doi:10.1111/j.1467-6419.2009.00592.x
Kang, B. Y., Shao, Q. Y., Xu, H. K., Jiang, F., Wei, X., and Shao, X. (2020). Research on grassland ecosystem service value in China under climate change based on meta-analysis: A case study of qinghai province. Int. J. Clim. Chang. Strateg. Manag. 12 (5), 617–637. doi:10.1108/IJCCSM-06-2020-0073
Kang, N. N., Hou, L. L., Huang, J. K., and Liu, H. F. (2022). Ecosystem services valuation in China:A meta-analysis. Sci. Total Environ. 809, 151122. doi:10.1016/j.scitotenv.2021.151122
L'Ecuyer, S. C., Dupras, J., He, J., Auclair, J., Kermagoret, C., and Poder, T. G. (2021). The economic value of Canada's national capital green network. PLOS ONE 16 (1), e0245045. doi:10.1371/journal.pone.0245045
László, E., György, K. D., Zoltan, B., Kovacs, B., Nemeth, C., Kiss, P. J., et al. (2018). Habitat heterogeneity as a key to high conservation value in forest-grassland mosaics. Biol. Conserv. 226, 72–80. doi:10.1016/j.biocon.2018.07.029
Lawler, J. J., Lewis, D. J., Nelson, E., Plantinga, A. J., Polasky, S., Withey, J. C., et al. (2014). Projected land-use change impacts on ecosystem services in the United States. Proc. Natl. Acad. Sci. U. S. A. 111 (20), 7492–7497. doi:10.1073/pnas.1405557111
Li, L. B., Yang, H. M., Xu, Y., Guo, Y., and Ni, J. (2016). Forest biomass and net primary productivity in southwestern China: A meta-analysis focusing on environmental driving factors. Forests 7 (8), 173. doi:10.3390/f7080173
Maldonado, B., Caballero, J., Delgado, S. A., and Lira, R. (2013). Relationship between use value and ecological importance of floristic resources of seasonally dry tropical forest in the balsas river basin, méxico. Econ. Bot. 67 (1), 17–29. doi:10.1007/s12231-013-9222-y
Marcos, D. B., and Ortega, E. (2014). Dynamic emergy accounting of water and carbon ecosystem services: A model to simulate the impacts of land-use change. Ecol. Model. 271, 113–131. doi:10.1016/j.ecolmodel.2013.03.006
Martinez-Harms, M. J., Bryan, B. A., Figueroa, E., Pliscoff, P., Runting, R. K., and Wilson, K. A. (2017). Scenarios for land use and ecosystem services under global change. Ecosyst. Serv. 25, 56–68. doi:10.1016/j.ecoser.2017.03.021
Mendoza, G. G., Martínez, M. L., Lithgow, D., Perez-Maqueo, O., and Simonin, P. (2012). Land use change and its effects on the value of ecosystem services along the coast of the gulf of Mexico. Ecol. Econ. 82, 23–32. doi:10.1016/j.ecolecon.2012.07.018
Millennium Ecosystem Assessment (2005). Ecosystems and human well-being: Synthesis. Washington DC: Island Press.
Moran, M. D., Taylor, N. T., Mullins, T. F., Sardar, S. S., and McClung, M. R. (2017). Land-use and ecosystem services costs of unconventional US oil and gas development. Front. Ecol. Environ. 15 (5), 237–242. doi:10.1002/fee.1492
Nelson, E. J., Kareiva, P., Ruckelshaus, M., Arkema, K., Geller, G., Girvetz, E., et al. (2013). Climate change’s impact on key ecosystem services and the human well-being they support in the US. Front. Ecol. Environ. 11 (9), 483–893. doi:10.1890/120312
Ouyang, Z. Y., Wang, X. K., and Miao, H. (1999). A primary study on Chinese terrestrial ecosystem services and their ecological-economic values. Acta Ecol. Sin. 19 (5), 607–613.
Patru-Stupariu, I., Hossu, C. A., Grădinaru, S. R., Nita, A., Stupariu, M. S., Huzui-Stoiculescu, A., et al. (2020). A review of changes in mountain land use and ecosystem services: From theory to practice. Land 9 (9), 336. doi:10.3390/land9090336
Perosa, F., Fanger, S., Zingraff-Hamed, A., and Disse, M. (2021). A meta-analysis of the value of ecosystem services of floodplains for the danube river basin. Sci. Total Environ. 777, 146062. doi:10.1016/j.scitotenv.2021.146062
Reynaud, A., and Lanzanova, D. (2017). A global meta-analysis of the value of ecosystem services provided by lakes. Ecol. Econ. 137, 184–194. doi:10.1016/j.ecolecon.2017.03.001
Salem, M. E., and Mercer, D. E. (2012). The economic value of mangroves: A meta-analysis. Sustainability 4 (3), 359–383. doi:10.3390/su4030359
Scheiter, S., Schulte, J., Pfeiffer, M., Martens, C., Erasmus, B. F., and Twine, W. C. (2019). How does climate change influence the economic value of ecosystem services in savanna rangelands? Ecol. Econ. 157, 342–356. doi:10.1016/j.ecolecon.2018.11.015
Siriwardena, S. D., Boyle, K. J., Holmes, T. P., and Wiseman, P. E. (2016). The implicit value of tree cover in the U.S.: A meta-analysis of hedonic property value studies. Ecol. Econ. 128, 68–76. doi:10.1016/j.ecolecon.2016.04.016
Smith, L. S., Broyles, M. E. J., Larzleer, H. K., and Fellowes, M. D. E. (2015). Adding ecological value to the urban lawns cape. Insect abundance and diversity in grass-free lawns. Biodivers. Conserv. 24 (1), 47–62. doi:10.1007/s10531-014-0788-1
Sun, B. D., Cui, L. J., Li, W., Kang, X., and Zhang, M. (2018). A review of spatial-scale transformation in wetland ecosystem service evaluation. Acta Ecol. Sin. 38 (8), 2607–2615. doi:10.5846/stxb201704260764
Swirepik, J. L., Burns, I. C., Dyer, F. J., Neave, I. A., O'Brien, M. G., Pryde, G. M., et al. (2016). Establishing environmental water requirements for the murray–darling basin, Australia's largest developed river system. River Res. Appl. 32 (6), 1153–1165. doi:10.1002/rra.2975
Taye, F. A., Folkersen, M. V., Fleming, C. M., Maja, V. F., Mackey, B., Diwakar, K., et al. (2021). The economic values of global forest ecosystem services: A meta-analysis. Ecol. Econ. 189, 107145. doi:10.1016/j.ecolecon.2021.107145
Van Houtven, G., Powers, J., and Pattanayak, S. K. (2007). Valuing water quality improvements in the United States using meta-analysis: Is the glass half-full or half-empty for national policy analysis? Resour. Energy Econ. 29 (3), 206–228. doi:10.1016/j.reseneeco.2007.01.002
Vedogbeton, H., and Johnston, R. J. (2020). Commodity consistent meta-analysis of wetland values: An illustration for coastal marsh habitat. Environ. Resour. Econ. (Dordr). 75 (4), 835–865. doi:10.1007/s10640-020-00409-0
Volk, M., Hirschfeld, J., Dehnhardt, A., Schmidt, G., Bohn, C., Liersch, S., et al. (2008). Integrated ecological-economic modelling of water pollution abatement management options in the Upper Ems River Basin. Ecol. Econ. 66 (1), 66–76. doi:10.1016/j.ecolecon.2008.01.016
Xie, G., Lu, C. H. X., Leng, Y. F., Zheng, D., and Li, S. C. (2003). Ecological assets valuation of the Tibetan plateau. J. Nat. Resour. 18 (2), 189–196.
Xie, G., Zhen, L., Lu, C. H. X., Xiao, Y., and Chen, C. (2008). Expert Knowledge based valuation on method of ecosystem services in China. J. Nat. Resour. 23 (5), 911–919. doi:10.11849/zrzyxb.2008.05.019
Zhang, L., Li, X. J., Zhou, D. M., and Zhang, Y. R. (2015). An empirical study of meta-analytical value transfer of lake and marsh ecosystem services in China. Acta Ecol. Sin. 35 (16), 5507–5517. doi:10.5846/stxb201403250552
Zhang, Y., Liu, Y., Zhu, W., and Li, S. (2016). Ecosystem service valuation and value transfer of land use types: A comprehensive meta-analysis of the literature. Acta Sci. Nat. Univ. Pekin. 3, 493–504. doi:10.13209/j.0479-8023.2016.026
Zhao, L., and Wang, E. D. (2011). An empirical study of meta-regression benefit transfer of natural resources. Resour. Sci. 33 (1), 31–40.
Keywords: water ecosystem, ecosystem service value, meta-analysis, value transfer, the yangtze river delta region
Citation: Shao H, Long D, He J and Zhang L (2022) Evaluation and evolution analysis of water ecosystem service value in the yangtze river delta region based on meta-analysis. Front. Environ. Sci. 10:964168. doi: 10.3389/fenvs.2022.964168
Received: 08 June 2022; Accepted: 01 July 2022;
Published: 26 July 2022.
Edited by:
Qingsong He, Huazhong University of Science and Technology, ChinaReviewed by:
Peng-Fei Dai, East China University of Science and Technology, ChinaHan Wang, Guangxi University Nanning, China
Copyright © 2022 Shao, Long, He and Zhang. This is an open-access article distributed under the terms of the Creative Commons Attribution License (CC BY). The use, distribution or reproduction in other forums is permitted, provided the original author(s) and the copyright owner(s) are credited and that the original publication in this journal is cited, in accordance with accepted academic practice. No use, distribution or reproduction is permitted which does not comply with these terms.
*Correspondence: Dian Long, longdian_yyh@126.com