Quantifying the Temporal and Spatial Patterns of Ecosystem Services and Exploring the Spatial Differentiation of Driving Factors: a Case Study of Sichuan Basin, China
 Chunguang Hu
 Ziyi Wang
 Jiaming Li
 Huan Liu
 Dongqi Sun
- 1School of Architecture and Urban Planning, Huazhong University of Science and Technology, Wuhan, China
- 2Hubei Engineering and Technology Research Center of Urbanization, Wuhan, China
- 3School of Architecture and Urban Planning, Nanjing University, Nanjing, China
- 4Institute of Geographic Sciences and Natural Resources Research, Chinese Academy of Sciences (CAS), Beijing, China
- 5Disaster Prevention Research Institute, Kyoto University, Kyoto, Japan
Exploring the factors that drive the change of ecosystem services (ES) is very important for maintaining ES function and zoning ecological management, especially in the Sichuan Basin area with high spatial heterogeneity such as natural and socio-economic characteristics. Taking the Sichuan Basin in China as an example, the PCA-MGWR model was constructed to explore the temporal and spatial patterns of ES in the Sichuan Basin from 2000 to 2015. The potential driving factors including anthropogenic factors, geomorphological factors, climate factors, and vegetation factors would be analyzed by principal component analysis (PCA). To illustrate the impact of spatial dependence in the data, the multi-scale geographically weighted regression (MGWR) technology was selected to explore the spatial differentiation of the impact of these four dimensions on ES to reflect the local differences of ecosystem service driving mechanisms in more detail. The results showed that 1) from the perspective of time series evolution, carbon storage (CS) and soil conservation (SC) in ES in the Sichuan Basin showed an upward trend, while water yield (WY) showed a downward trend; from the perspective of spatial patterns, except the main urban areas of Chengdu and Chongqing, the CS service level of other regions was high; The spatial distribution characteristics of SC services were “low in the middle and high in the periphery”; the high value area of WY service was located in Northeast Sichuan. 2) Among natural factors, elevation (DEM), slope (SLO), NDVI, annual average temperature (TEM), and annual average precipitation (PRE) had a higher contribution rate to ES, while among socio-economic factors, GDP density (GDP), night light (LIG), and population density (POP) had a higher contribution rate to ES, while other factors had a lower contribution rate. 3) Combined with the PCA-MGWR model, we analyzed the comprehensive response and spatial differentiation of driving factors to ES in the Sichuan Basin and explained in detail the influence of anthropogenic factors, geomorphological factors, climatic factors, and vegetation factors and their spatial heterogeneity in ES. It is expected that the spatial differences in the impact degree of different indicators can be considered when formulating the countermeasures of ES in the Sichuan Basin, to provide theoretical support for the implementation of regional ecological management and control.
1 Introduction
Ecosystem services (ES) are ecological characteristics, functions, or processes that contribute directly or indirectly to human well-being (Costanza et al., 1997; Yang et al., 2021a; Yu et al., 2022b). The United Nations Millennium Ecosystem Assessment divides ES into four categories: support services, regulation services, supply services, and cultural services. There are complex relationships between different services (Tallis and Kareiva, 2005; Luo et al., 2021). The concept of ES as a “bridge” between natural ecosystems and human social systems serves as a foundation for improving human well-being and achieving regional sustainable development. The integrated assessment of ES is an effective hybrid that has become a frontier and research hotspot in geography, ecology, and environmental science, and it is also central to the sustainable development of ecosystems and the management of ecological resources (Costanza et al., 2017; Castillo-Eguskitza et al., 2018; Yu et al., 2021; Chen et al., 2022; Hu et al., 2022).
It is generally accepted that ES can be influenced by both natural and human factors (Burkhard et al., 2012; Burkhard et al., 2015; Zhang et al., 2020; Yang et al., 2021b). First, climate change can directly change the capacity to supply services such as food production, freshwater supply, and net primary productivity by changing ecosystem properties. In addition to climate change, elevation, slope, soil, and vegetation also contribute to changes in ES (Wolff et al., 2015; Yang et al., 2020). Human activities have both direct and indirect impacts on the ecosystem, with both beneficial and detrimental impacts. For example, the human activities of urban construction, forest, and grassland into an impermeable surface, resulting in the decline of the ability to provide ES. Payments for Environmental Services (PES) practices around the world, such as China’s “conversion of cropland to forest and grassland” and the South African government’s Working for Water program, have improved soil conservation (SC) and water yield (WY) in the region (Wei et al., 2017; Wu et al., 2019; Bing et al., 2021).
Therefore, we not only need to fully understand the spatiotemporal patterns of ES but also need to explore the driving factors of ES to develop scientifically sound ES management approaches (Geijzendorffer et al., 2015; Wei et al., 2017). Several recent studies have shown this concern, including Chen et al. (2020) the need to consider different drivers and spatial spillovers in the formulation of strategies for integrated ecosystem management and sustainable land use in urban agglomerations (Chen et al., 2020). Peng et al. (2020) discussed the impact of urbanization on the ES budget through decoupling analysis (Peng et al., 2020). Hu et al. (2021) took the Shanxi province of China as an example; this study explored the spatial differentiation of five ES and captured the main driving factors of ES change from a geospatial perspective (Hu et al., 2021).
Existing studies have shown that ES often has certain spatial heterogeneity (Li et al., 2013; Song and Deng, 2017; Zhou et al., 2018; Licheng et al., 2019; Yang et al., 2019), which will be more obvious in regions with high spatial heterogeneity in geography, society, and economy. However, most of these studies are based on global regression, mainly considering a single driving factor, without considering the comprehensive effect. Less attention has been paid to the spatial non-stationary relationship between the leading factors affecting ES. Commonly used methods such as correlation analysis and overlay analysis can only clarify the relationship between individual factors and ES and cannot quantitatively derive significant impact factors and their intensity, nor can it reveal the spatial heterogeneity of factor interaction and the possible synergistic or antagonistic effects among the factors (Jiang et al., 2022), especially when exploring multivariate driver analysis, the problem of multicollinearity between drivers often occurs (Toutenburg, 2006; Yu et al., 2022a). When there is a multicollinearity problem, the variance of the parameter estimator will be too large, the accuracy will be reduced, the significance test of the variable will be meaningless, and the influence of the explanatory variable on the explained variable cannot be correctly judged, resulting in the unreasonable value of the parameter estimator (Yu et al., 2009). Therefore, based on the PCA-MGWR method, this study combines the advantages of principal component analysis (PCA) and MGWR. Before MGWR analysis, the PCA of independent variables is carried out, and several uncorrelated principal components extracted are used as independent input variables for MGWR to analyze the spatial impact distribution of each principal component. PCA-MGWR can not only eliminate the multicollinearity problem caused by the correlation of independent variables but also explain the spatial effects of different ecosystem service factors.
To sum up, although natural-human factors have a significant impact on ES, the current research on their comprehensive consideration is still insufficient. Therefore, this study hopes to make up for the current gap. Sichuan Basin is the ecological barrier to the upper reaches of the Yangtze River. The basin has a good natural resource endowment and is one of the regions with the largest supply of ES in China (Pan and Wang, 2021). Fully understanding the spatio-temporal pattern of ES in the Sichuan Basin, and exploring the natural-human multiple impact factors, is of great importance to ensure the ecological security of the upper reaches of the Yangtze River and even the ecological security of the country.
At present, more and more attention is focused on exploring the driving force of the impact on the ES (Zhong et al., 2019; Sannigrahi et al., 2020). Relevant studies have focused on the spatial-temporal pattern of ES in Sichuan Province and its various driving factors from a statistical perspective (Liu et al., 2020; Niu et al., 2022). However, these studies generally focus on the analysis of change patterns, paying less attention to the spatial change characteristics of driving forces, and often ignoring the scale differences of different driving factors. Therefore, some studies have used the spatial regression model to test the spatial non-stationary relationship between the four driving forces on SC and WY in Sichuan Province (Huang et al., 2022). This study not only adds the measurement indicators and driving factors of ES in the Sichuan Basin but also uses the MGWR model to explore the nature and intensity of the impact of various factors on ES in the Sichuan Basin. In view of the limitations and deficiencies of previous studies, this study has the following specific objectives: (I) evaluate the ES and their temporal and spatial changes in the Sichuan Basin; (II) quantitatively assess the driving factors of temporal and spatial changes of ES in Sichuan Basin; and (III) analyze the comprehensive response and spatial differentiation of various driving factors of ES in Sichuan Basin.
2 Methodology
2.1 Study Area
Sichuan Basin lies at the intersection of the Belt and Road and the Yangtze Economic Belt (27° 68′∼ 32° 30′N, 101° 95′∼ 108° 95 E, Figure 1). Influenced by the subtropical monsoon climate, the annual average temperature is 13–20°C, and the annual average precipitation is 1,000 mm. The scope of the study includes 15 cities, including Chengdu in Sichuan and 29 districts and counties in Chongqing, with a total area of about 185,000 km2. There are many types of landforms in the region, forming various kinds of vertical climatic zones; the climatic differentiation is remarkable, the natural ecological environment is diverse, and the ecological resources are rich. In 2019, the Chengdu-Chongqing urban agglomeration had a resident population of 96 million and a regional GDP of nearly 6.3 trillion yuan. The 2021 outline for constructing the Double-City Economic Circle proposes that the Chengdu-Chongqing urban agglomeration should play an exemplary role in promoting the green development of the Yangtze River Economic Belt and the ecological protection of western China.
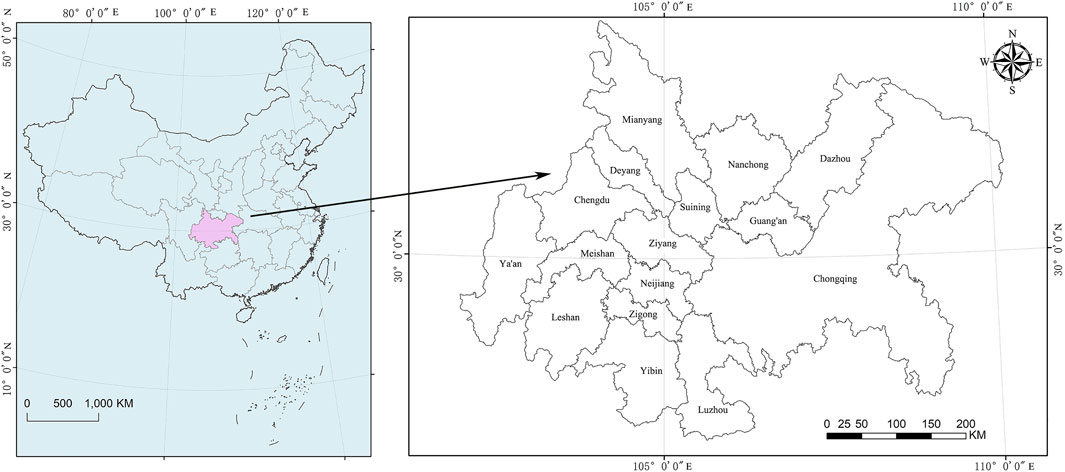
FIGURE 1. Location and administrative division of the Sichuan Basin.
2.2 Data
This study refers to the methods of previous studies and the data requirements of the InVEST model to quantify the ES (Xie and Ng, 2013; Chen et al., 2020; Zhang X. et al., 2021; Huang et al., 2022). SC is an important indicator to measure the water and soil conservation of the ecosystem. Carbon storage (CS) can directly reflect the carbon absorption and storage capacity of the ecosystem. WY is the ability of the ecosystem to retain rainwater under the joint action of plants and soil. At the same time, considering that Sichuan Basin is an important water source and protected area of the Yangtze River and the Yellow River, soil erosion is an important factor in its flood disaster. Sichuan Basin is also rich in natural resources, including forests, meadows, wetlands, and snow mountains. It is a strategic area for ecological security in Western China. Therefore, combined with the natural landform and the regional characteristics of the social economy in the Sichuan Basin, these three ecosystems can be regarded as important ecosystems for the sustainable development of resources and the environment. It involves the use of multi-source data such as land use, digital elevation model, meteorological data, soil data, watershed boundary, and social and economic data. to comprehensively evaluate the ES in the Sichuan Basin. The data sources and their descriptions are shown in Table 1.
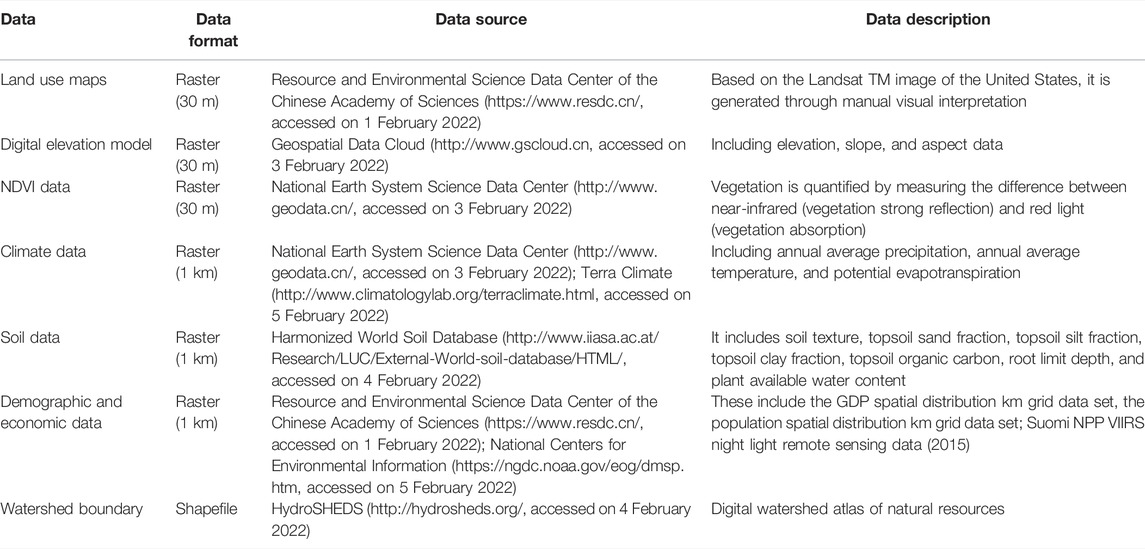
TABLE 1. Data source and its detailed description.
2.3 Quantification of Ecosystem Services
2.3.1 Carbon Storage (Carbon Storage)
Carbon sequestration services, also known as “Carbon Storage” services, are important regulatory services in ecosystems. The “carbon” module in the InVEST model is used to evaluate the CS in Sichuan Basin as the supply of carbon sequestration services. The input carbon storage data refer to previous local studies (Liu et al., 2004; Tang et al., 2018; Liang et al., 2021). The formula is as follows:
where
2.3.2 Water Yield (Water Yield)
WY refers to the ability of ES to store water resources. The Sichuan Basin is located in the middle reaches of the Yangtze River, so it is vital to assess the WY for the storage and utilization of water resources. The “water yield” module is used to quantify the supply of WY in the Sichuan Basin. This module is defined as the part of precipitation minus evapotranspiration based on the principle of water balance (Sharp et al., 2014; Sun et al., 2018). The formula is as follows:
where
2.3.3 Soil Conservation (Soil Conservation)
In this study, the modified universal soil loss equation (USLE) is used to estimate regional soil conservation and soil erosion. In sediment retention, the model takes into account the important hydrological process of plant-induced soil erosion and sediment interception, which makes the simulation results more scientific and reasonable. We used the “sediment delivery ratio” module of the InVEST model to evaluate SC service. This module uses the revised universal soil loss equation (RUSLE) to express SC, according to the difference between potential soil loss and actual soil loss (Renard et al., 2017; Rao and Xiao, 2018). The calculation formula is as follows:
where
2.4 Spatial Autocorrelation of Ecosystem Services
Spatial autocorrelation can reflect the degree of interdependence and aggregation between the attributes of a specific region and those of other regions (Hu et al., 2022). The calculation of the Moran’I equation in ArcGIS 10.5 can be used to examine spatial patterns of ES. The calculation formula is as follows:
where n is the total number of each district (county) in Sichuan Basin;
2.5 Spatial Differentiation of Driving Factors
2.5.1 Factor Identification and Data Dimensionality Reduction
First, we selected the factors associated with ES, including the four major factors: anthropogenic factors, climatic factors, vegetation factors, and geomorphological factors (Costanza et al., 2014; Zhou et al., 2018; Chen et al., 2019; Schirpke et al., 2019; Zhang Z. et al., 2021; Xu et al., 2022). To explore the overall correlation of ecosystem service impact factors, we conducted Spearman correlation research between CS, WY, and SC services and potential drivers based on SPSS 25. The final anthropogenic factors include night light, GDP density, and population density; climatic factors include annual average temperature, annual average precipitation, and actual evapotranspiration; vegetation factors include NDVI; and geomorphological factors include elevation, slope, and aspect (Table 2).
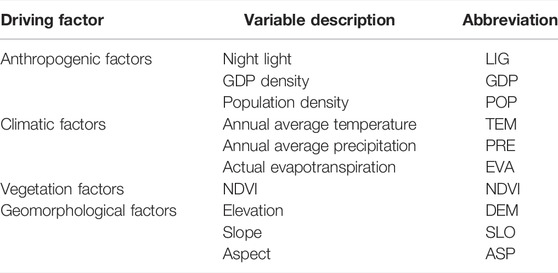
TABLE 2. Selected potential factors.
Second, to avoid the influence of multicollinearity of all variables, we mainly based on PCA to synthesize multiple related variables with the principle of as little information loss as possible and turn them into a few irrelevant variables to reduce the dimension of data, simplify the data structure and ensure that the VIF of explanatory variables is not greater than 7 (Plaza et al., 2005; Sannigrahi et al., 2020), thus to eliminate the possible influence of multicollinearity between variables (Supplementary Table SB1).
2.5.2 Local Regression Analysis
Geographically weighted regression (GWR) is a spatial regression method that can explain different local relationships among variables (Sun et al., 2020). Its greatest advantage is the ability to measure spatial variability accurately (Brunsdon et al., 1998). Although GWR captures the spatial heterogeneity of influencing factors to some extent, it is implemented under the assumption that all covariates change on the same spatial scale, and it is not enough to explain the spatial heterogeneity level of different urban landscape factors. MGWR relaxes the assumption of “same spatial scale” and allows optimization of covariate-specific bandwidths. The GWR and MGWR formulas are given in the equations:
where
3 Results
3.1 Temporal and Spatial Patterns of Ecosystem Services
From 2000 to 2015, the average values of CS and SC services increased from 5846835 t/ha and 6868780 t/ha to 5884678 t/ha and 7777234 t/ha, respectively, and the average WY decreased from 184656 m3/ha to 174054 m3/ha. The results showed that urbanization had a negative effect on the occupation of arable land, forest land, and carbon storage, and the implementation of ecological and water conservation projects had a positive effect on soil and water conservation. As far as the spatial distribution of ES was concerned (Figure 2), the CS service level was higher in all regions except Chengdu and Chongqing. The spatial distribution characteristics of SC services were “low in the middle and high in the periphery”. The high-value area of WY service was located in the northeast of Sichuan Province. On the whole, the spatial distribution of various services was different, which was closely related to the regional geographical background. In terms of the spatial change of ES, most regions showed a decrease in CS services, especially in cities and towns and their surroundings. Except for some regions of Wushan County, Chongqing, Wuxi County, and Chengkou County, SC services showed a decreasing trend, the other regions showed an increasing trend, and the decrease of WY services was mainly located in the northeast of the study area.
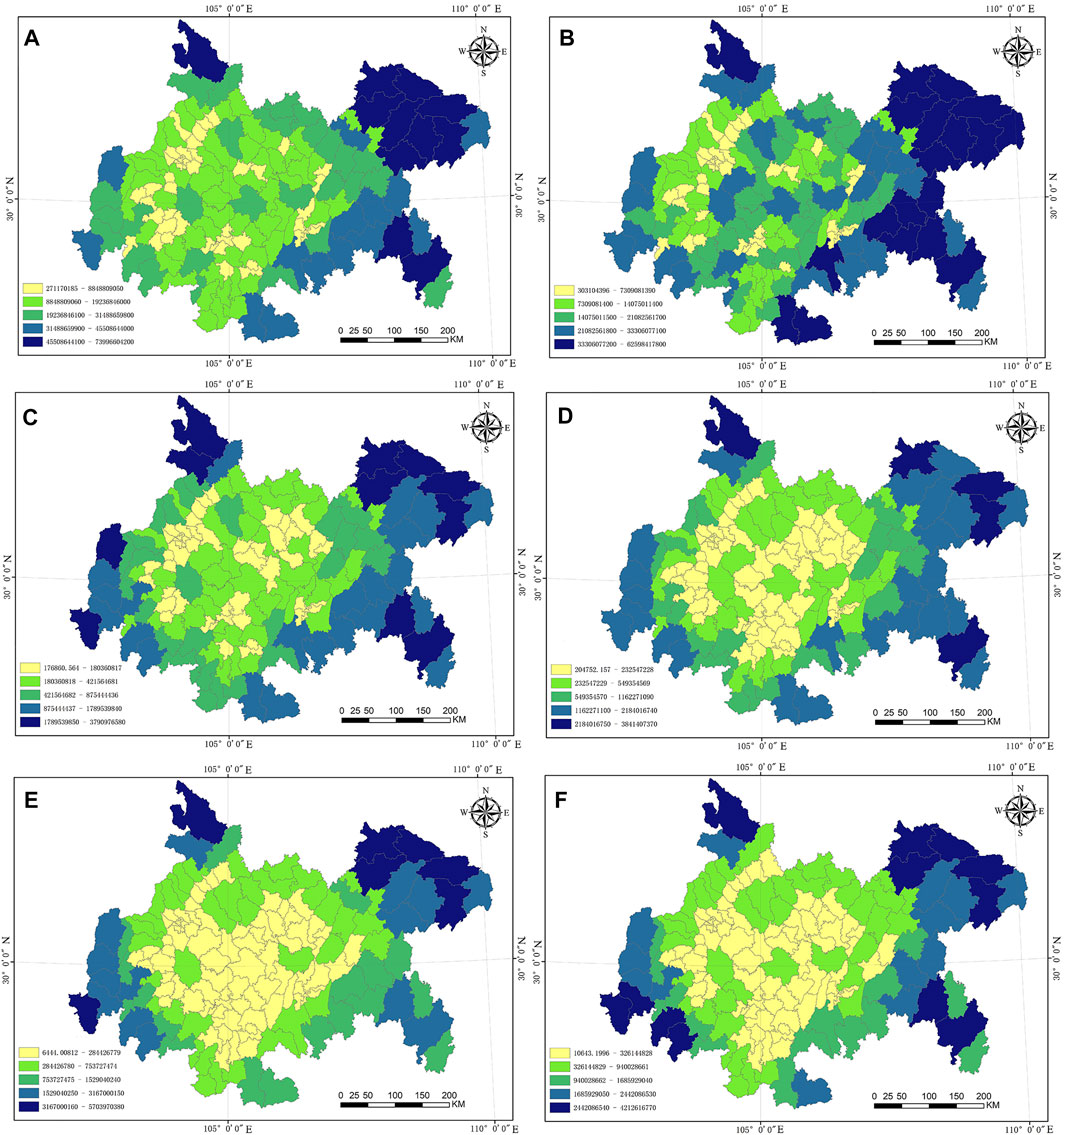
FIGURE 2. Spatial distribution of ES from 2000 to 2015. (A) 2000 annual water yield (WY); (B) 2015 annual WY; (C) 2000 annual carbon storage (CS); (D) 2015 annual CS; (E) 2000 annual soil conservation (SC); and (F) 2015 annual SC.
3.2 Spatial Autocorrelation of Ecosystem Services
Spatial autocorrelation analysis of CS, WY, and SC ES in the Sichuan Basin was conducted from 2000 to 2015 (Figure 3), in which the 2000 CS Moran’s I index was 0.359 and the standardized test Z (I) value was 10.073; in 2015, Moran ‘ s I index was 0.360 and Z (I) was 10.124, respectively, at the significance level of 0.05(p = 0); the results showed that the spatial distribution of CS showed a significant positive autocorrelation, and the state of carbon accumulation was apparent.
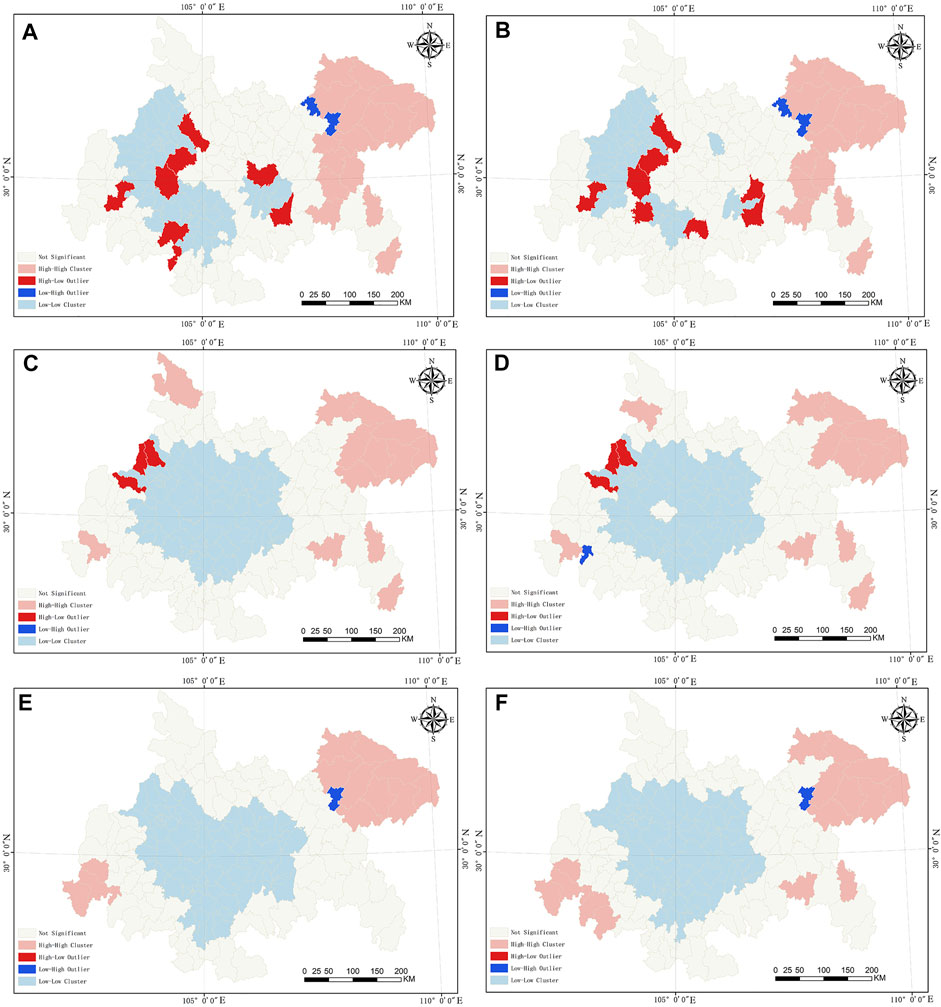
FIGURE 3. LISA agglomeration distribution of ES from 2000 to 2015 (A) 2000 annual WY; (B) 2015 annual WY; (C) 2000 annual CS; (D) 2015 annual CS; (E) 2000 annual SC; and (F) 2015 annual SC.
Moran’s I Index of WY in 2000 was 0.459, Z (I) value of the standardized test was 12.762, Moran’s I Index of WY in 2015 was 0.470, Moran’s I Index of WY in 2000 was 0.459, Moran’s I value was 12.762, Moran’s I value was 0.05, Moran’s I Index of WY in 2015 was 0.470, the Z (I) value of the standardized test was 13.017, and it passed the test at the significance level of 0.05(p = 0). The results showed that the spatial distribution of WY supply presented a significant positive autocorrelation and the aggregation was obvious.
In 2000, Moran’s I index was 0.347, Z (I) of the standardized test was 9.819, and it passed the test at the significance level of 0.05(p = 0) In 2015, Moran’s I index was 0.409, and Z (I) of the standardized test was 11.399, which passed the test at the significance level of 0.05 (p = 0) The results showed that the spatial distribution of SC supply showed a significant positive autocorrelation and aggregation.
At the same time, the local spatial autocorrelation analysis of ES, such as CS, WY, and SC from 2000 to 2015, was carried out, and the distribution chart of local indicators for spatial autocorrelation (LISA) was drawn. As shown in Figure 3, from the results of local spatial autocorrelation analysis, the low-low aggregation types of ES were mainly distributed in the central part of the Sichuan Basin, including Ziyang, Suining, Neijiang, Deyang, eastern Chengdu, and western Chongqing, while high-concentration types were mainly distributed in the eastern and western border areas of Sichuan Basin, the northern part of Chongqing, the northern part of Dazhou, the southern part of Ya’an, and the southern part of Leshan, i.e., the northern part of Chengdu, the southern part of Deyang, the northern part of Ziyang and the eastern part of Meishan. The other places had not passed the local spatial autocorrelation significance test.
3.3 Influencing Factors
3.3.1 Correlation Analysis
To explore the overall correlation of the impact factors of ES in the Sichuan Basin from 2000 to 2015, the results of the Spearman correlation between services and factors (Table 3) found that, the spatial distribution of ES capacity in the Sichuan Basin was influenced by both natural and socio-economic factors, thus showing different spatial distribution characteristics. In general, terrain factors such as TEM and EVA contributed the most, while socio-economic factors such as GDP and POP contributed less, and the contribution rate of other factors was low. Among them, POP, GDP, and LIG had a significant negative correlation with these three services. NDVI, DEM, and SLO had a significant positive correlation with these three services.
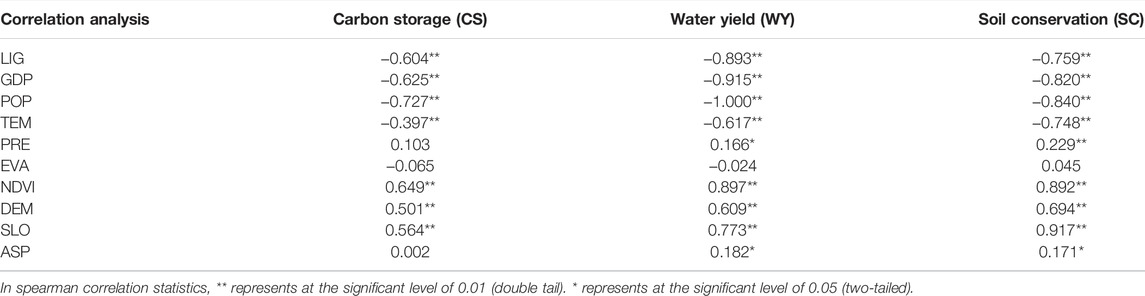
TABLE 3. Statistical description of Spearman correlation between ES and various impact factors.
3.3.2 Spatial Heterogeneity
SPSS 25 PCA was used to visualize the factors after 10 kinds of standardization, and the spatial pattern of coefficients was obtained (Figure 4), the spatial heterogeneity of different factors on WY, CS, and SC was further explored.
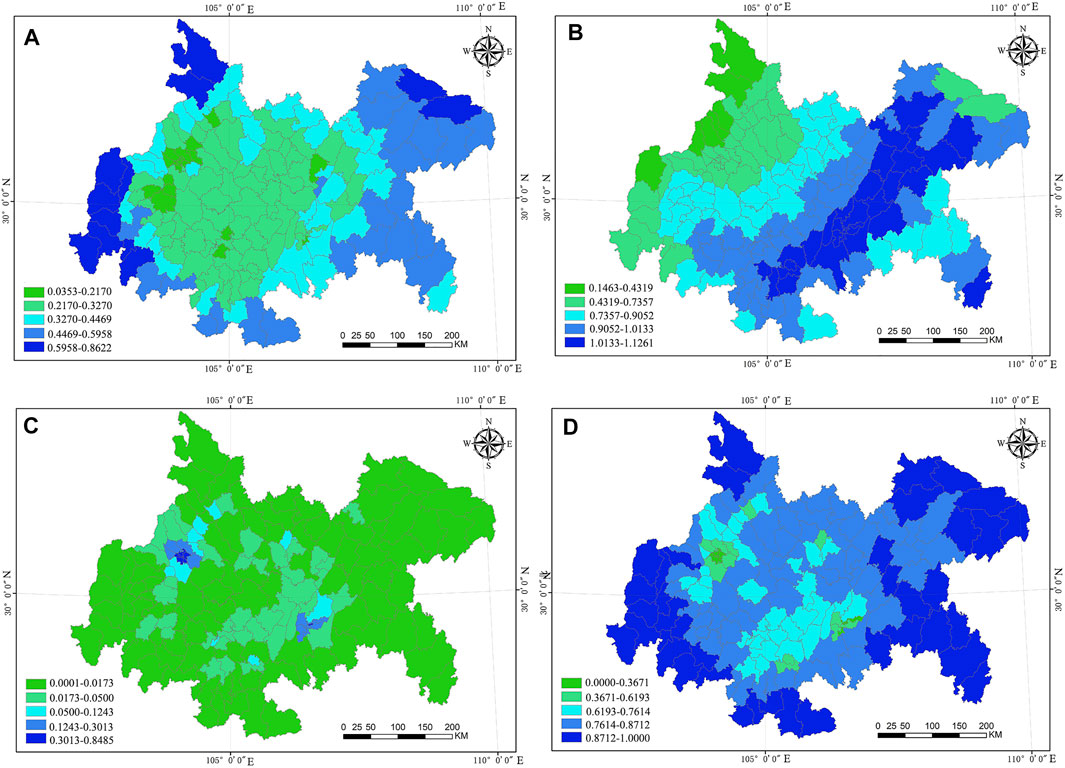
FIGURE 4. Spatial effect of four kinds of influencing factors (A). Geomorphological factors; (B) climatic factors; (C) anthropogenic factors; and (D) vegetation factors).
The spatial distribution of geomorphological factors in the Sichuan Basin had significant ring-shaped spatial features (Figure 4A). From the spatial distribution trend of influence intensity, with Ziyang, the central area of Sichuan Basin as the core, the negative driving force of topographic factors on the Sichuan Basin ecosystem was gradually increasing outwards and presented obvious ring-type distribution characteristics. The central part of the Sichuan Basin was affected by the surrounding mountainous terrain. The whole environment was closed and blocked, and the foundation of heat dissipation was poor.
The climate factors in Sichuan Basin had a negative correlation to the regional ES (Figure 4B) and had a significant gradient in the spatial distribution. In terms of the spatial distribution of the overall driving mechanism, except for the peripheral region of the Sichuan Basin, a few mountainous areas, and the central area of the Zhongliang mountain range in Jinyun, there was a strong positive correlation between driving characteristics, the climate of Chengdu-Chongqing urban agglomeration as a whole had an obvious positive effect on regional ES.
The anthropogenic factors in Sichuan Basin showed a significant negative correlation between the driving characteristics of regional ES and the spatial distribution of small patches (Figure 4C). The main driving force behind this phenomenon was that, on the one hand, the economic and industrial structure in Sichuan Basin was still in the stage of transition from primary production to secondary production and the basic demand for space and resources by industries such as industry and manufacturing led to the horizontal expansion of cities. On the other hand, the corridor of the Double-City Economic Circle in Chengdu and Chongqing was the main area of negative correlation, the spatial population density had a negative driving effect on the urban development, while a few marginal urban areas in the north showed a weak positive driving effect. From the perspective of the spatial distribution trend of driving intensity, the influence degree of the two core cities, Chengdu and Chongqing, gradually decreased outward.
The vegetation factors in Sichuan Basin showed a significant positive correlation to the regional ES and the patch spatial distribution trend (Figure 4D). As a whole, Sichuan Basin was dominated by farmland and grassland ecosystems and had prominent supply-type services. The increase in species diversity and community complexity would directly increase the stock of ES. At present, the stock of forest land ecological assets in each district of Chengdu-Chongqing urban agglomeration was insufficient, and the regulation, support, and cultural services in the core area of the central city were weak. Therefore, the enhancement and optimization of vegetation and other ecosystems had a significant effect on the enhancement of the Sichuan Basin’s overall service functions.
3.3.3 Multi-Scale Geographically Weighted Regression
The global model, GWR model, and MGWR model under the ordinary least squares method (OLS) were shown in Table 4. The result of OLS fitting showed that the VIF of all the factors was less than 7.5, which showed that there was no variable redundancy and there were no multiple linear relationships among the factors. At the same time, Jarque-Bera’s result showed that the residuals did not obey the normal distribution, the model fitting was one-sided, and the GWR model should be combined to improve the fitting accuracy.
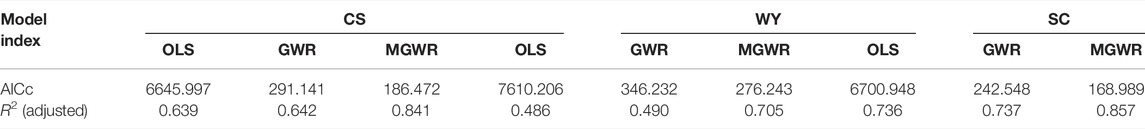
TABLE 4. Comparison of the fitting results of OLS, GWR, and MGWR.
However, the local spatial regression model based on MGWR could better reflect the impact of the aforementioned influencing factors on WY services, CS services, and SC services in specific spaces, according to the results shown in Figure 5, which showed the local R2 spatial distribution of the fitting results of the MGWR model. Figure 5A showed the impact of various factors on WY services, showing a vertical strip distribution in space, with the east being more intense, followed by the west, while the middle was less affected; Figure 5B showed the impact of various factors on CS services, showing a circular impact pattern opposite to WY services in space, that was, west > northeast > middle; Figure 5C showed the impact of various factors on SC services, showing local patches and overall axisymmetric distribution in space, and the northwest was the most affected.
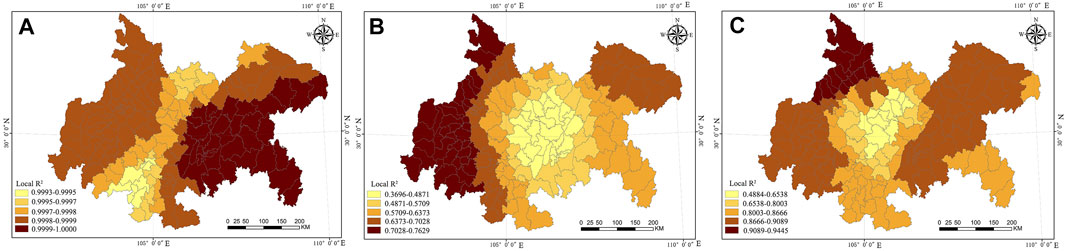
FIGURE 5. Spatial heterogeneity distribution of ES under different factors (A). WY; (B) CS; and (C) SC.
From the descriptive statistical results of the coefficients of the MGWR Model (Tables 5, 6, and 7), it could be seen that the influence of different factors and their trend of action were quite different in-service spaces. DEM had the largest effect on CS, followed by POP on WY, while LIG had the least effect on SC and the temperature had the least effect on WY. From the ratio of positive and negative effects, the same factor had different effects on different services, which indicated that there was significant spatial heterogeneity of the factors, and the MGWR model could show the characteristics of local coefficients.
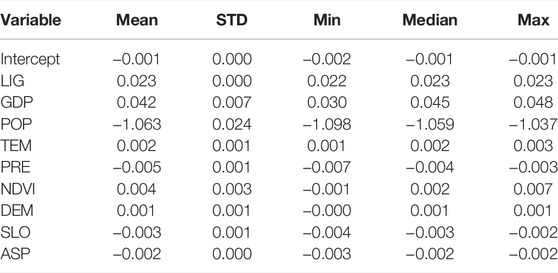
TABLE 5. Statistical description of the MGWR coefficient of WY services.
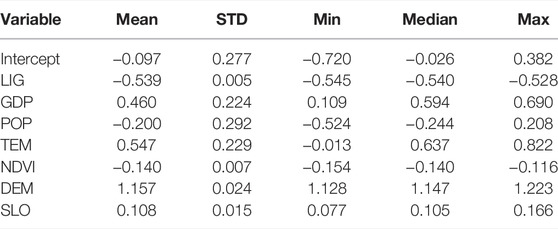
TABLE 6. Statistical description of the MGWR coefficient of CS services.
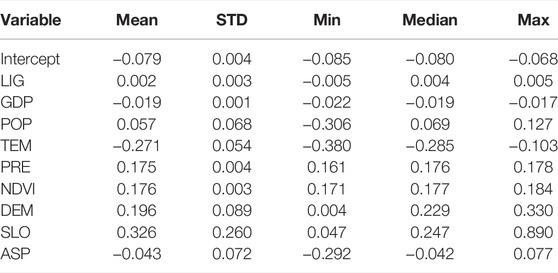
TABLE 7. Statistical description of the MGWR coefficient of SC services.
4 Discussion
4.1 Spatio-Temporal Patterns of Ecosystem Services in the Sichuan Basin
In the Sichuan Basin, one of the major suppliers of ES in China (Pan and Wang, 2021), carbon sequestration services and SC services showed an upward trend, while water production services showed a downward trend. These results were mainly attributed to the great changes in land use types in the study area. The increase in vegetation coverage led to a significant increase in CS and SC, which was consistent with previous studies (Jiang et al., 2018; Luo et al., 2019). At the same time, large-scale planting led to a significant increase in water consumption and evapotranspiration, which is the main reason for the decline of WY(Feng et al., 2016). However, the p-value of the Moran index of the three ES is 0, indicating that there is a significant positive autocorrelation at the significance level of 0.05. L-L cluster areas are mainly concentrated in the central part of the Sichuan Basin, and H-H cluster areas are distributed in the northeast and the periphery of the cities. In general, the Chengdu Plain, basin hills, and mountain areas around the basin in the east are the concentrated areas for WY supply services, while the southwest Sichuan mountains, west Sichuan mountain valleys, and northwest Sichuan Plateau in the west are the concentrated areas for CS and SC supply services.
4.2 Quantitative Attribution of the Driving Factors of Ecosystem Services in the Sichuan Basin
Combined with the results of the impact of natural and socio-economic driving factors on the correlation of ecosystem services in the Sichuan Basin, it can be found that LIG, GDP, POP, and TEM have significant negative effects on ES, indicating that the rise of these indicators will make the state of ES tense to some extent. NDVI, DEM, and SLO have significant positive effects on ES. These results are consistent with other studies but slightly different in the magnitude of the correlation coefficient (Lin et al., 2020), this is mainly due to the differences in research methods and scales, which provide a reference for enhancing ES in the Sichuan Basin research area (Sannigrahi et al., 2020; Huang et al., 2022). At the same time, according to the mean absolute value of regression coefficient of different factors, artificial factors such as LIG, GDP, and POP have a greater impact on WY services, the water production services are very sensitive to POP. CS services are sensitive to DEM and LIG. LIG, POP, and NDVI negatively affected CS services. SC services are sensitive to SLO and TEM, among which GDP, TEM, and SLO have negative effects on SC services, the rest were positive. The aforementioned results provide a basis for exploring the impact of different driving factors on ES in Sichuan Basin.
4.3 Comprehensive Response and Spatial Heterogeneity of Driving Factors to Ecosystem Services in the Sichuan Basin
Four comprehensive driving factors show different characteristics of the spatial pattern (Figure 4): geomorphological factors show the spatial characteristics of “centripetal trough”, climatic factors show the spatial characteristics of “east high west low”, anthropogenic factors show the spatial characteristics of “east-west dual-core”, and vegetation factors show the spatial characteristics of “planarization”. The contribution rate of geomorphological factors, TEM, and EVA to the three natural factors is higher, the contribution rate of GDP and POP to the three social-economic factors is higher, and the contribution rate of other factors is lower. POP, GDP, LIG, and other factors have a significant negative correlation with these three services, these variables are the main driving factors of ecosystem service changes, which are also consistent with previous relevant researchers (Wang et al., 2019; Yongxiu et al., 2020). It shows that the key to achieving coordinated development of regional ecosystems is to reduce the negative interference of human activities in the ecosystem.
Because of the regional and spatial differences in geological and meteorological conditions, the service and driving factors of CS, WY, and SC in the Sichuan Basin are characterized by spatial heterogeneity; the results of MGWR show that the AICC value of the MGWR model is smaller than that of OLS and GWR model, the adjusted R2 is larger, and the bandwidth of variables is rich, which indicates that the fitting effect of MGWR is more reliable (Oshan et al., 2019; Li and Fotheringham, 2020), and can provide reference and guidance for regional units to adopt relevant policy regulation, according to local conditions.
Specifically, there is strong spatial heterogeneity in the driving factors of WY services in the Sichuan Basin (Supplementary Figure SA1), especially in Chongqing in the east and Chengdu in the west. It further explains that the eastern and western parts of the Sichuan Basin also have higher LIG and GDP, resulting in excessive demand for water in highly urbanized areas. At the same time, the altitude of surrounding areas leads to changes in precipitation, average temperature, and vegetation coverage, thus affecting WY services in external areas (Cao et al., 2020). To sum up, the Sichuan Basin River basin, which is composed of eastern Sichuan Ridge Valley, central Sichuan hilly area, and Chengdu Plain Lake area, has an uneven water production service space due to its special topography and spatial distribution of precipitation.
There is also a strong spatial heterogeneity in Sichuan Basin’s CS services (Supplementary Figure SA2). The service capacity of CS in peripheral areas such as northern counties and western counties and cities is relatively large, the main reason is that the People’s Government of Sichuan Province has taken the lead in setting up a natural forest resources protection project leading group to implement the system of chief responsibility and management by objectives responsibility for the natural forest resources protection projects within the areas under their jurisdiction, to prohibit the cutting of natural forests, and to close down the timber trading market in the project areas, and the logging ban was quickly extended to the entire province.
The SC services in Sichuan Basin still have spatial differences (Supplementary Figure SA3). The main reason is that the hilly area in the middle of Sichuan and the Chengdu Plain of Kawanishi is the most severe area of soil erosion in the upper reaches of the Yangtze River, accounting for 21.9% of the total area of soil erosion, the area is located in the middle and lower reaches of Min River, Tuo River, Jialing River, and the Yangtze River. The ground is cut and broken, the hills undulate and the west is plain. In most places in the region, the rainfall is about 1,000 mm, and most are heavy rain. The outcropping rock is mainly composed of purple-red sandstone and mudstone, which is easy to be weathered and eroded, resulting in severe hydraulic erosion in this area. However, the SC services in the mountainous areas around the basin are better, mainly due to the low, middle, and high mountains in the region, especially the widespread distribution of carbonate rocks and the intercalation of detrital rocks among them, as well as various human actions in recent years, such as the ecological protection of the red line, less population density distribution, and other comprehensive reasons, resulting in this area SC services steadily improved.
4.4 Limitations and Future Sustainable Development Measures
In this study, we used the InVEST model to estimate the value of CS, WY, and SC. However, the Sichuan Basin ecosystem is an integrated system with a wide variety of service functions (Kang et al., 2018; You et al., 2021). In addition to the three types of services considered in this study, food production, habitat quality, pollution control, entertainment, and culture are also important to service types, which are also important directions for follow-up research. On the other hand, the supply and demand of ecosystems together constitutes the flow of ES from natural systems to social systems (Burkhard et al., 2012; Burkhard et al., 2015). However, the current research focuses on the “supply” side analysis of ES, given the lack of research on the “demand” side of ES, the synergy between supply and demand of ES should be quantified in the future.
5 Conclusion
The concept of ES has built a “bridge” between natural ecosystems and human social systems. This study evaluates the spatial and temporal patterns of ES in the Sichuan Basin from 2000 to 2015 and discusses the spatial heterogeneity of response of various driving factors to ES with the help of PCA-MGWR model. The results showed that the CS and SC services experienced an upward trend during the study period, while the WY services showed a downward trend. Especially from the perspective of spatial pattern, the carbon sequestration services in other regions except for the main urban areas of Chengdu and Chongqing were higher; the spatial distribution characteristics of SC services are “low in the middle and high in the periphery”; the high-value area of water production service is located in Northeast Sichuan. The results of the spatial regression model show that compared with the OLS model and GWR Model, the MGWR model has the best explanatory power, and there is a correlation between driving factors and ES change. In view of the differences in the driving factors on the geographical scale, this study helps to consider the spatial differences in the impact of different indicators when formulating the countermeasures for ES in the Sichuan Basin and provides more information for the refined management and zoning control of ES in the Sichuan Basin.
Data Availability Statement
The original contributions presented in the study are included in the article/Supplementary Material; further inquiries can be directed to the corresponding authors.
Author Contributions
CH: writing—original draft and data curation. ZW: data curation and software. JL: editing and supervision. HL: supervision and writing—review and editing. DS: supervision. All authors have read and agreed to the published version of the manuscript.
Funding
This work was supported by the Natural Science Foundation of China under the Grant 41971162 and the Second Scientific Investigation of the Tibetan Plateau (Grant no. 2019QZKK0406).
Conflict of Interest
The authors declare that the research was conducted in the absence of any commercial or financial relationships that could be construed as a potential conflict of interest.
Publisher’s Note
All claims expressed in this article are solely those of the authors and do not necessarily represent those of their affiliated organizations, or those of the publisher, the editors, and the reviewers. Any product that may be evaluated in this article, or claim that may be made by its manufacturer, is not guaranteed or endorsed by the publisher.
Supplementary Material
The Supplementary Material for this article can be found online at: https://www.frontiersin.org/articles/10.3389/fenvs.2022.927818/full#supplementary-material
References
Bing, Z., Qiu, Y., Huang, H., Chen, T., Zhong, W., and Jiang, H. (2021). Spatial Distribution of Cultural Ecosystem Services Demand and Supply in Urban and Suburban Areas: A Case Study from Shanghai, China. Ecol. Indic. 127, 107720. doi:10.1016/j.ecolind.2021.107720
Brunsdon, C., Fotheringham, S., and Charlton, M. (1998). Geographically Weighted Regression. J. R. Stat. Soc. D. 47, 431–443. doi:10.1111/1467-9884.00145
Burkhard, B., Kroll, F., Nedkov, S., and Müller, F. (2012). Mapping Ecosystem Service Supply, Demand and Budgets. Ecol. Indic. 21, 17–29. doi:10.1016/j.ecolind.2011.06.019
Burkhard, B., Müller, A., Müller, F., Grescho, V., Anh, Q., Arida, G., et al. (2015). Land Cover-Based Ecosystem Service Assessment of Irrigated Rice Cropping Systems in Southeast Asia-An Explorative Study. Ecosyst. Serv. 14, 76–87. doi:10.1016/j.ecoser.2015.05.005
Cao, Y., Qiao, X., Hopke, P. K., Ying, Q., Zhang, Y., Zeng, Y., et al. (2020). Ozone Pollution in the West China Rain Zone and its Adjacent Regions, Southwestern China: Concentrations, Ecological Risk, and Sources. Chemosphere 256, 127008. doi:10.1016/j.chemosphere.2020.127008
Castillo-Eguskitza, N., Martín-López, B., and Onaindia, M. (2018). A Comprehensive Assessment of Ecosystem Services: Integrating Supply, Demand and Interest in the Urdaibai Biosphere Reserve. Ecol. Indic. 93, 1176–1189. doi:10.1016/j.ecolind.2018.06.004
Chen, J., Jiang, B., Bai, Y., Xu, X., and Alatalo, J. M. (2019). Quantifying Ecosystem Services Supply and Demand Shortfalls and Mismatches for Management Optimisation. Sci. Total Environ. 650, 1426–1439. doi:10.1016/j.scitotenv.2018.09.126
Chen, W., Chi, G., and Li, J. (2020). The Spatial Aspect of Ecosystem Services Balance and its Determinants. Land Use Policy 90, 104263. doi:10.1016/j.landusepol.2019.104263
Chen, Y., Yang, J., Yang, R., Xiao, X., and Xia, J. (2022). Contribution of Urban Functional Zones to the Spatial Distribution of Urban Thermal Environment. Build. Environ. 216, 109000. doi:10.1016/j.buildenv.2022.109000
Costanza, R., d'Arge, R., De Groot, R., Farber, S., Grasso, M., Hannon, B., et al. (1997). The Value of the World's Ecosystem Services and Natural Capital. nature 387, 253–260. doi:10.1038/387253a0
Costanza, R., De Groot, R., Braat, L., Kubiszewski, I., Fioramonti, L., Sutton, P., et al. (2017). Twenty Years of Ecosystem Services: How Far Have We Come and How Far Do We Still Need to Go? Ecosyst. Serv. 28, 1–16. doi:10.1016/j.ecoser.2017.09.008
Costanza, R., De Groot, R., Sutton, P., Van der Ploeg, S., Anderson, S. J., Kubiszewski, I., et al. (2014). Changes in the Global Value of Ecosystem Services. Glob. Environ. Change 26, 152–158. doi:10.1016/j.gloenvcha.2014.04.002
Feng, X., Fu, B., Piao, S., Wang, S., Ciais, P., Zeng, Z., et al. (2016). Revegetation in China's Loess Plateau Is Approaching Sustainable Water Resource Limits. Nat. Clim. Change 6, 1019–1022. doi:10.1038/nclimate3092
Geijzendorffer, I. R., Martín-López, B., and Roche, P. K. (2015). Improving the Identification of Mismatches in Ecosystem Services Assessments. Ecol. Indic. 52, 320–331. doi:10.1016/j.ecolind.2014.12.016
Hu, B., Kang, F., Han, H., Cheng, X., and Li, Z. (2021). Exploring Drivers of Ecosystem Services Variation from a Geospatial Perspective: Insights from China’s Shanxi Province. Ecol. Indic. 131, 108188. doi:10.1016/j.ecolind.2021.108188
Hu, C., Wang, Z., Wang, Y., Sun, D., and Zhang, J. (2022). Combining MSPA-MCR Model to Evaluate the Ecological Network in Wuhan, China. Land 11, 213. doi:10.3390/land11020213
Huang, Y., Wu, Y., Niu, S., and Gan, X. (2022). Estimating the Effects of Driving Forces on Ecosystem Services and Their Responses to Environmental Conditions. Environ. Sci. Pollut. Res., 1–13. doi:10.1007/s11356-022-20867-x
Jiang, C., Zhang, H., and Zhang, Z. (2018). Spatially Explicit Assessment of Ecosystem Services in China’s Loess Plateau: Patterns, Interactions, Drivers, and Implications. Glob. Planet. Change 161, 41–52. doi:10.1016/j.gloplacha.2017.11.014
Jiang, M., Jiang, C., Huang, W., Chen, W., Gong, Q., Yang, J., et al. (2022). Quantifying the Supply-Demand Balance of Ecosystem Services and Identifying its Spatial Determinants: A Case Study of Ecosystem Restoration Hotspot in Southwest China. Ecol. Eng. 174, 106472. doi:10.1016/j.ecoleng.2021.106472
Kang, P., Chen, W., Hou, Y., and Li, Y. (2018). Linking Ecosystem Services and Ecosystem Health to Ecological Risk Assessment: A Case Study of the Beijing-Tianjin-Hebei Urban Agglomeration. Sci. Total Environ. 636, 1442–1454. doi:10.1016/j.scitotenv.2018.04.427
Li, B., Shi, P., Jin, S., Wei, W. E. I., and Zhou, J. (2013). Theory and Quantitative Methodology of Spatial Heterogeneity Analysis of Ecosystem Service Value for the Shiyanghe River Basin, Gansu, China. J. Desert Res. 33, 943–951. doi:10.7522/j.issn.1000-694X.2013.00132
Li, Z., and Fotheringham, A. S. (2020). Computational Improvements to Multi-Scale Geographically Weighted Regression. Int. J. Geogr. Inf. Sci. 34, 1378–1397. doi:10.1080/13658816.2020.1720692
Liang, Y., Hashimoto, S., and Liu, L. (2021). Integrated Assessment of Land-Use/land-Cover Dynamics on Carbon Storage Services in the Loess Plateau of China from 1995 to 2050. Ecol. Indic. 120, 106939. doi:10.1016/j.ecolind.2020.106939
Licheng, L., Chunfang, L., Chuan, W., and Pengjie, L. (2019). Supply and Demand Matching of Ecosystem Services in Loess Hilly Region: A Case Study of Lanzhou. Prog. Chem. 74, 1921. doi:10.11821/dlxb201909016
Lin, Z. Y., Xiao, Y., Rao, E. M., Shi, X. W., and Zhang, P. (2020). Relationships Among Different Types of Ecosystem Service in Southwest China. Ying Yong Sheng Tai Xue Bao 31, 978–986. doi:10.13287/j.1001-9332.202003.015
Liu, J. Y., Wang, S. Q., Chen, J. M., Liu, M. L., and Zhuang, D. F. (2004). Storages of Soil Organic Carbon and Nitrogen and Land Use Changes in China: 1990–2000. Acta Geogr. Sin. 59, 483–496. doi:10.11821/xb200404001
Liu, Y., Yang, S., Han, C., Ni, W., and Zhu, Y. (2020). Variability in Regional Ecological Vulnerability: A Case Study of Sichuan Province, China. Int. J. Disaster Risk Sci. 11, 696–708. doi:10.1007/s13753-020-00295-6
Luo, X., Yang, J., Sun, W., and He, B. (2021). Suitability of Human Settlements in Mountainous Areas from the Perspective of Ventilation: A Case Study of the Main Urban Area of Chongqing. J. Clean. Prod. 310, 127467. doi:10.1016/j.jclepro.2021.127467
Luo, Y., Lü, Y., Fu, B., Zhang, Q., Li, T., Hu, W., et al. (2019). Half Century Change of Interactions Among Ecosystem Services Driven by Ecological Restoration: Quantification and Policy Implications at a Watershed Scale in the Chinese Loess Plateau. Sci. Total Environ. 651, 2546–2557. doi:10.1016/j.scitotenv.2018.10.116
Niu, L., Shao, Q., Ning, J., and Huang, H. (2022). Ecological Changes and the Tradeoff and Synergy of Ecosystem Services in Western China. J. Geogr. Sci. 32, 1059–1075. doi:10.1007/s11442-022-1985-6
Oshan, T., Li, Z., Kang, W., Wolf, L., and Fotheringham, A. (2019). Mgwr: A Python Implementation of Multiscale Geographically Weighted Regression for Investigating Process Spatial Heterogeneity and Scale. ISPRS Int. J. Geo-Inf. 8, 269. doi:10.3390/ijgi8060269
Pan, Z., and Wang, J. (2021). Spatially Heterogeneity Response of Ecosystem Services Supply and Demand to Urbanization in China. Ecol. Eng. 169, 106303. doi:10.1016/j.ecoleng.2021.106303
Peng, J., Wang, X., Liu, Y., Zhao, Y., Xu, Z., Zhao, M., et al. (2020). Urbanization Impact on the Supply-Demand Budget of Ecosystem Services: Decoupling Analysis. Ecosyst. Serv. 44, 101139. doi:10.1016/j.ecoser.2020.101139
Plaza, A., Martinez, P., Plaza, J., and Perez, R. (2005). Dimensionality Reduction and Classification of Hyperspectral Image Data Using Sequences of Extended Morphological Transformations. IEEE Trans. Geosci. Remote Sens. 43, 466–479. doi:10.1109/tgrs.2004.841417
Rao, E. M., and Xiao, Y. (2018). Spatial Characteristics and Effects of Soil Conservation Service in Sichuan Province. Acta Ecol. Sin. 38, 8741–8749. doi:10.5846/stxb201806011217
Renard, K. G., Laflen, J. M., Foster, G. R., and McCool, D. K. (2017). “The Revised Universal Soil Loss Equation,” in Soil Erosion Research Methods (London: Routledge), 105–126. doi:10.1201/9780203739358-5
Sannigrahi, S., Zhang, Q., Pilla, F., Joshi, P. K., Basu, B., Keesstra, S., et al. (2020). Responses of Ecosystem Services to Natural and Anthropogenic Forcings: A Spatial Regression Based Assessment in the World’s Largest Mangrove Ecosystem. Sci. Total Environ. 715, 137004. doi:10.1016/j.scitotenv.2020.137004
Schirpke, U., Candiago, S., Vigl, L. E., Jäger, H., Labadini, A., Marsoner, T., et al. (2019). Integrating Supply, Flow and Demand to Enhance the Understanding of Interactions Among Multiple Ecosystem Services. Sci. Total Environ. 651, 928–941. doi:10.1016/j.scitotenv.2018.09.235
Sharp, R., Tallis, H. T., Ricketts, T., Guerry, A. D., Wood, S. A., Chaplin-Kramer, R., et al. (2014). InVEST User’s Guide (Palo Alto: The Natural Capital Project, Stanford University, University of Minnesota, The Nature Conservancy, World Wildlife Fund).
Song, W., and Deng, X. (2017). Land-use/land-cover Change and Ecosystem Service Provision in China. Sci. Total Environ. 576, 705–719. doi:10.1016/j.scitotenv.2016.07.078
Sun, X., Lu, Z., Li, F., and Crittenden, J. C. (2018). Analyzing Spatio-Temporal Changes and Trade-Offs to Support the Supply of Multiple Ecosystem Services in Beijing, China. Ecol. Indic. 94, 117–129. doi:10.1016/j.ecolind.2018.06.049
Sun, X., Tang, H., Yang, P., Hu, G., Liu, Z., and Wu, J. (2020). Spatiotemporal Patterns and Drivers of Ecosystem Service Supply and Demand across the Conterminous United States: A Multiscale Analysis. Sci. Total Environ. 703, 135005. doi:10.1016/j.scitotenv.2019.135005
Tallis, H., and Kareiva, P. (2005). Ecosystem Services. Curr. Biol. 15, R746–R748. doi:10.1016/j.cub.2005.09.007
Tang, X., Zhao, X., Bai, Y., Tang, Z., Wang, W., Zhao, Y., et al. (2018). Carbon Pools in China’s Terrestrial Ecosystems: New Estimates Based on an Intensive Field Survey. Proc. Natl. Acad. Sci. U.S.A. 115, 4021–4026. doi:10.1073/pnas.1700291115
Toutenburg, H. (2006). in Book Review: Regression Diagnostics–Identifying Influential Data and Sources of Collinearity. Editors D. A. Belsley, E. Kuh, and R. E. Welsch (New York, NY: Wiley Online Library).
Wang, Y., Zhao, J., Fu, J., and Wei, W. (2019). Effects of the Grain for Green Program on the Water Ecosystem Services in an Arid Area of China-Using the Shiyang River Basin as an Example. Ecol. Indic. 104, 659–668. doi:10.1016/j.ecolind.2019.05.045
Wei, H., Fan, W., Wang, X., Lu, N., Dong, X., Zhao, Y., et al. (2017). Integrating Supply and Social Demand in Ecosystem Services Assessment: A Review. Ecosyst. Serv. 25, 15–27. doi:10.1016/j.ecoser.2017.03.017
Wolff, S., Schulp, C. J. E., and Verburg, P. H. (2015). Mapping Ecosystem Services Demand: A Review of Current Research and Future Perspectives. Ecol. Indic. 55, 159–171. doi:10.1016/j.ecolind.2015.03.016
Wu, X., Liu, S., Zhao, S., Hou, X., Xu, J., Dong, S., et al. (2019). Quantification and Driving Force Analysis of Ecosystem Services Supply, Demand and Balance in China. Sci. Total Environ. 652, 1375–1386. doi:10.1016/j.scitotenv.2018.10.329
Xie, Y. J., and Ng, C. N. (2013). Exploring Spatio-Temporal Variations of Habitat Loss and its Causal Factors in the Shenzhen River Cross-Border Watershed. Appl. Geogr. 39, 140–150. doi:10.1016/j.apgeog.2013.01.001
Xu, Z., Peng, J., Dong, J., Liu, Y., Liu, Q., Lyu, D., et al. (2022). Spatial Correlation between the Changes of Ecosystem Service Supply and Demand: An Ecological Zoning Approach. Landsc. Urban Plan. 217, 104258. doi:10.1016/j.landurbplan.2021.104258
Yang, J., Wang, Y., Xiu, C., Xiao, X., Xia, J., and Jin, C. (2020). Optimizing Local Climate Zones to Mitigate Urban Heat Island Effect in Human Settlements. J. Clean. Prod. 275, 123767. doi:10.1016/j.jclepro.2020.123767
Yang, J., Wang, Y., Xue, B., Li, Y., Xiao, X., Xia, J., et al. (2021a). Contribution of Urban Ventilation to the Thermal Environment and Urban Energy Demand: Different Climate Background Perspectives. Sci. Total Environ. 795, 148791. doi:10.1016/j.scitotenv.2021.148791
Yang, J., Yang, R., Chen, M.-H., Su, C.-H., Zhi, Y., and Xi, J. (2021b). Effects of Rural Revitalization on Rural Tourism. J. Hosp. Tour. Manag. 47, 35–45. doi:10.1016/j.jhtm.2021.02.008
Yang, M., Zhang, Y., and Wang, C. (2019). Spatial-temporal Variations in the Supply-demand Balance of Key Ecosystem Services in Hubei Province. Resour. Env. Yangtze Basin 28, 2080–2091.
Yongxiu, S., Shiliang, L., Fangning, S., Yi, A., Mingqi, L., and Yixuan, L. (2020). Spatio-temporal Variations and Coupling of Human Activity Intensity and Ecosystem Services Based on the Four-Quadrant Model on the Qinghai-Tibet Plateau. Sci. Total Environ. 743, 140721. doi:10.1016/j.scitotenv.2020.140721
You, H., Yang, J., Xue, B., Xiao, X., Xia, J., Jin, C., et al. (2021). Spatial Evolution of Population Change in Northeast China during 1992-2018. Sci. Total Environ. 776, 146023. doi:10.1016/j.scitotenv.2021.146023
Yu, D., Peterson, N. A., and Reid, R. J. (2009). Exploring the Impact of Non-normality on Spatial Non-stationarity in Geographically Weighted Regression Analyses: Tobacco Outlet Density in New Jersey. GIScience Remote Sens. 46, 329–346. doi:10.2747/1548-1603.46.3.329
Yu, H., Xie, W., Sun, L., and Wang, Y. (2021). Identifying the Regional Disparities of Ecosystem Services from a Supply-Demand Perspective. Resour. Conservation Recycl. 169, 105557. doi:10.1016/j.resconrec.2021.105557
Yu, H., Yang, J., Li, T., Jin, Y., and Sun, D. (2022a). Morphological and Functional Polycentric Structure Assessment of Megacity: An Integrated Approach with Spatial Distribution and Interaction. Sustain. Cities Soc. 80, 103800. doi:10.1016/j.scs.2022.103800
Yu, H., Yang, J., Sun, D., Li, T., and Liu, Y. (2022b). Spatial Responses of Ecosystem Service Value during the Development of Urban Agglomerations. Land 11, 165. doi:10.3390/land11020165
Zhang, H., Feng, J., Zhang, Z., Liu, K., Gao, X., and Wang, Z. (2020). Regional Spatial Management Based on Supply-Demand Risk of Ecosystem Services-A Case Study of the Fenghe River Watershed. Int. J. Environ. Res. Public Health 17, 4112. doi:10.3390/ijerph17114112
Zhang, L., Hickel, K., Dawes, W. R., Chiew, F. H., Western, A. W., and Briggs, P. R. (2004). A Rational Function Approach for Estimating Mean Annual Evapotranspiration. Water Resour. Res. 40, 89–97. doi:10.1029/2003wr002710
Zhang, X., Li, H., Xia, H., Tian, G., Yin, Y., Lei, Y., et al. (2021). The Ecosystem Services Value Change and its Driving Forces Responding to Spatio-Temporal Process of Landscape Pattern in the Co-urbanized Area. Land 10, 1043. doi:10.3390/land10101043
Zhang, Z., Peng, J., Xu, Z., Wang, X., and Meersmans, J. (2021). Ecosystem Services Supply and Demand Response to Urbanization: A Case Study of the Pearl River Delta, China. Ecosyst. Serv. 49, 101274. doi:10.1016/j.ecoser.2021.101274
Zhong, S., Geng, Y., Qian, Y., Chen, W., and Pan, H. (2019). Analyzing Ecosystem Services of Freshwater Lakes and Their Driving Forces: the Case of Erhai Lake, China. Environ. Sci. Pollut. Res. 26, 10219–10229. doi:10.1007/s11356-019-04476-9
Keywords: ecosystem services, PCA-MGWR model, driving factors, spatial heterogeneity, Sichuan Basin
Citation: Hu C, Wang Z, Li J, Liu H and Sun D (2022) Quantifying the Temporal and Spatial Patterns of Ecosystem Services and Exploring the Spatial Differentiation of Driving Factors: a Case Study of Sichuan Basin, China. Front. Environ. Sci. 10:927818. doi: 10.3389/fenvs.2022.927818
Received: 25 April 2022; Accepted: 09 June 2022;
Published: 14 July 2022.
Edited by:
Jianhong Xia, Curtin University, AustraliaReviewed by:
Decheng Zhou, Nanjing University of Information Science and Technology, ChinaZhenhong Wang, Guizhou University, China
Copyright © 2022 Hu, Wang, Li, Liu and Sun. This is an open-access article distributed under the terms of the Creative Commons Attribution License (CC BY). The use, distribution or reproduction in other forums is permitted, provided the original author(s) and the copyright owner(s) are credited and that the original publication in this journal is cited, in accordance with accepted academic practice. No use, distribution or reproduction is permitted which does not comply with these terms.
*Correspondence: Jiaming Li, lijm@igsnrr.ac.cn; Huan Liu, huan.liu.b05@kyoto-u.jp