How Green is the Economic Complexity in the Central and Eastern European Union Countries?
 Olimpia Neagu
 Mădălin-Ioan Neagu
 Beata Gavurova
- 1Faculty of Economics, Computer Science and Engineering, “Vasile Goldiș” Western University of Arad, Romania, Doctoral School of Economic Sciences, University of Oradea, Oradea, Romania
- 2Faculty of Automation and Computer Science, Technical University of Cluj-Napoca, Cluj-Napoca, Romania
- 3Faculty of Mining, Ecology, Process Control and Geotechnologies, Technical University of Košice, Košice, Slovakia
The paper analyses the association between economic complexity and openness to trade green products in eleven Central and Eastern European Union (EU) countries over the period of 2003–2016. The study uses the “green openness index” as it is framed by the Beta Akademi Social Science Lab in order to explain the progress in the productive structure of the European economies. In a panel data approach comprising of eleven EU economies, other explanatory variables of economic complexity are included: financial development, research and development (R&D) expenditures, and number of patents. The methodological approach includes: testing cross-sectional dependence of considered variable and second generation test for stationarity check. Cointegration on long run is verified by Westerlund test and estimation of regression coefficients uses FMOLS and DOLS models. Finally the causality relationship between economic complexity and explanatory variables is tested with Dumitrescu-Hurlin test. Empirical results show that Economic Complexity Index (ECI) is positively associated with green openness index (GOP), financial development, R&D expenditures and number of patents in the examined panel of countries. A validated causality relationship is running from green trade to economic complexity and from economic complexity to financial development and number of patents. It is also revealed validated bidirectional causality between R&D expenditures and ECI. Policy implications are also provided.
Introduction
The present paper intends to explore the link between economic complexity and green economy by examining the influence on economic complexity of the green trade in the Eastern and Central European countries.
Economic complexity has gained the interest of researchers as a result of revival of industrial policy (more complex products), the growth of artificial intelligence (embedded in manufactured products) and development of endogenous growth theory (based on the assumption that growth is based on the increase of knowledge) (Hidalgo, 2021). The concept of economic complexity is based on the idea of a production function that connects economic inputs and outputs (Hidalgo, 2021) and requires productive knowledge, consisting of human and social capital and advanced production technologies. Dynamics of economic activities and their geographical distribution can be studied using techniques derived from the complexity theory, complex systems, computer sciences and networks (Observatory of Economic Complexity, OEC). In order to explain and understand international differences in development outcome, based on data on the geography of economic activities, the concept of economic complexity express the one’s country capabilities (human and social capital, institutions, technology) that generates a certain level of sophistication of exported products. The complexity of economies is generated by the complexity of locations (cities, regions, countries) and that of economic activities (products, technologies, industries) present in them (Observatory of Economic Complexity, OEC). The Economic Complexity Index introduced by Hidalgo and Hausmann (2009) summarizes factors that are ‘optimal to explain the geography of multiple economic activities’ (Hidalgo, 2021).
In the current young literature on economic complexity, a set of studies are discussing its drivers such as: high-tech exports, financial development, number of patents, foreign direct investment, human capital, institutional quality and fiscal policies, (i.e., Antonietti and Franco, 2021; Innocenti et al., 2021; Bahar et al., 2020; Khan et al., 2020; Kannen, 2020; Nguyen et al., 2020; Lapatinas, 2019, Lapatinas et al., 2019a, Lapatinas et al., 2019b; Sweet and Eterovic Maggio, 2015; Erkan and Yildirimci, 2015; Zhu and Fu, 2013) and its impact on environment (Neagu and Teodoru, 2019; Neagu, 2020; Yilanci and Pata, 2020; Ahmad et al., 2021; Rafique et al., 2021a; Ikram et al., 2021; Majeed et al., 2021; Nathaniel, 2021; Adebayo, 2022; Adebayo et al., 2022). But we know very little about channels for reducing this impact (i.e., investment in clean and environment-friendly technologies, use of renewable energy). Findings of recent studies suggest the followings: enhanced renewable energy technology budgets (Ahmed et al., 2022) for mitigating pollution induced by the increase of products complexity; more renewable energy generation and efficient use of human capital would led to the improvement of economic complexity (Rafique et al., 2021a); national policies towards products sophistication hold the potential to solve ecological problems (Ikram et al., 2021); the clean energy and renewable energy in industry is a tool for improvement of exports quality and pollution mitigation (Wang et al., 2021); policies towards products diversification induce the growth of renewable energy demand in the economy (Shahzad et al., 2021b).
Given the fact that the level of products sophistication and the required structural changes in industry are contributing to the increase of pollution, analyzing the effect of trading with green products on economic complexity would offer the opportunity to identify the potential to reduce its environmental impact. This is quite important for emerging economies that have not achieved a certain level of development along with appropriate institutional and technological factors allowing to curb the environmental pressures, as it is revealed for the case of well developed and complex economies (i.e., Can and Gozgor, 2017, Neagu, 2020; Neagu and Neagu, 2022).
The concept of green economy was coined by United Nations Environmental Programme (UNEP) within the Green Economy Initiative (GEI) (https://unep.org) launched in 2008, as an economy with reduced environmental risks and scarcities and an improved human well-being and social equity, in other words, green economy is one which is “resources efficient, low carbon and also, socially inclusive.” Over the past years the concept has became a priority for governments in many countries within the global efforts for climate change mitigation and how to shape the global economy in a more sustainable way. Green economy focused on the synergies between the economic and environmental pillars of sustainable development. As an economic current model, the green economy can be supported through incentives of investment in green energy sources and technologies, developing new industries and markets for green products as well as by promoting the resource and energy efficiency in all economic and social activities. In the context of green economy, there is no agreement on a standard definition of green products. They are generally classified as environment-friendly goods, that resulted from production using cleaner technologies or products that cause less environmental damage (World Bank, 2008). Eurostat (2009) defines environmental products as goods and services that “measure, control, prevent, restore, minimize and prevent the environmental damage (to air, water and soil).”
The paper intends to put together these two perspectives (economic complexity and green economy) in order to reveal their connections in a panel approach including eleven Central and Eastern European countries, analyzing the association between economic complexity and the openness to green trade.
The CEE countries were chosen to be examined due to several reasons: 1) a specific dynamics of economic complexity in the last decades: positive values in an ascending trend; 2) as European Union (EU) Member States they are struggling in different catching-up strategies to reduce the income and development gap compared with Western developed countries and achieve intra-EU convergence; 3) as emerging economies, they experience higher growth rates compared to Western countries and manage an expanding financial sector meant to support their development and trade openness; 4) they assumed to achieve in 2030 a reduction of CO2 emissions to 40% of the 1990 level and a share of renewable energy of 27% in the energy sources (European Union, 2018), as well as carbon neutrality targets by 2050 within the European Green Deal (Skjaerseth, 2021).
The present study is motivated by several aspects: 1) the concern of countries to increase their economic complexity, found as accurate predictor of income (Hausmann et al., 2014); 2) the newly introduced index of green trade would suggest a potential channel for more sophisticated products without generating increasing levels of pollution; 3) the emergence of green economy principles in many countries (including CEE countries) in the context of the climate change pressure, environmental degradation, natural resources depletion and international commitments of governments for sustainability and carbon neutrality.
To the best of authors’ knowledge, this is the first paper analyzing the impact of ‘green products’ on economic complexity within Central and Eastern European economies. The paper uses the index of green openness product (GOP) newly introduced by Can et al. (2022); Can et al. (2021) in order to express level of a country’s openness to green trade. The present study embraces two new paradigms of current economic context that are in the focus of recent debates of scholars, and academics: economic complexity and green economy. The paper is also placed among the very few studies dealing with the newly issued green openness index. Another contribution of the paper consists of the enriching the scarce literature on the factors enabling economic complexity, by adding a new one, that of trading with green products, in the basket of sophisticated products that give the complexity level of an economy. It is also worth to be mentioned that, apart of other studies, bidirectional causality between R&D expenditures and economic complexity is reported.
The paper is structured as follows. After introduction, the recent relevant literature is reviewed in section 2; data and methodology of the paper are exposed in section 3. section 4 describes the results and section 5 consists of discussion. The last section is dedicated to conclusions and policy implications.
A Brief Literature Review
Given the aim of the paper to explore a new driver of economic complexity, namely, trade of environment-friendly goods expressed by the green openness index, the review of current literature will discuss studies focused on the determinants of economic complexity. Nevertheless, economic complexity presumes structural changes in the economy with consequences on energy demand, resources development and allocation, and large effects on environment, economy and society. In other words, we will discuss the drivers of economic complexity along with its consequences. This approach is useful to better understand the connection between the two concepts: economic complexity and green economy.
The literature on economic complexity is ‘young’ (Hidalgo, 2021) and also, a limited number of recent studies are dedicated to the drivers of economic complexity. The following factors of economic complexity were identified: high-tech exports, intellectual property system, financial development, foreign direct investment, birthplace, Internet usage, fertility rate, institutional quality, fiscal policy (taxation), research and development (R&D) expenditures.
Erkan and Yildirimci (2015) found that a low share of high-tech exports is correlated with a reduced level of economic complexity in the case of Turkey over the period of 1993–2013.
Sweet and Eterovic Maggio (2015) found that stronger intellectual property systems would lead to higher levels of economic complexity in 94 countries from 1965 to 2005. This effect is present in countries with an initial above-average level of development and economic complexity.
Nguyen et al. (2020) investigated the impact of financial development and number of patents on economic complexity in a panel of 52 middle-income and high-income economies. They found a long-run cointegration relationship between number patents, financial development and economic complexity. They also revealed a bi-directional causality explanatory variables and economic complexity.
Foreign direct investment (FDI) was identified in some studies of the recent literature as a driver of economic complexity. FDI induced a greater level of economic complexity in a panel of 117 countries from 1995 to 2016 and specifically knowledge-intensive green field projects caused economic complexity in developed countries (Antonietti and Franco, 2021). Khan et al. (2020) identified a long-run bidirectional relationship between inward FDI and economic complexity in China from 1985 to 2017. Similar results regarding the positive impact of FDI on economic complexity were reported by Zhu and Fu (2013) in their study developed for 171 countries. Kannen (2020) found that FDI in tertiary sector has a significant positive effect on economic complexity in 63 developed and developing countries over the period of 2005–2014.
Another identified driver of economic complexity is the birth place of individuals. Thus, a higher diversity in the birth place of immigrants can boost economic complexity through an increasing diversification of the host country’s export basket (Bahar et al., 2020).
It is also proved that economic complexity is associated with the fertility change across Italian provinces (Innocenti et al., 2021) and the Internet usage (Lapatinas, 2019).
Appropriate fiscal policies are necessary for the development of sophisticated products. The level of labor taxation influences the level of complexity: economies with higher taxation tend to produce simple products. Furthermore, capital taxes have a negative impact on economic sophistication and this effect is stronger in developed countries (Lapatinas et al., 2019a).
Vu (2021) provides evidence on the positive effects of institutional quality on economic complexity for 115 economies. He suggests that institutions can affect economic complexity by promoting innovative entrepreneurship, developing productive capabilities through incentives for human capital accumulation, and the allocation of human resources towards productive activities, as previously reported by Zhu and Fu (2013). Human capital accumulation is seen also as a driver of economic complexity by Hausmann et al. (2007). Human capital and R&D investment are important sources of indigenous knowledge creation and directly contributes to the exports upgrading of countries (Zhu and Fu, 2013).
The relationship between economic complexity and environment is more studied; authors are focused on several dimensions and expressions of pollution (i.e., ecological footprint, CO2 emissions, GHG emissions) generated by economic complexity, or environmental quality measures (i.e., environmental performance index) linked to the level of sophistication of products.
Very recent studies provide evidence in support of a harmful effect of economic complexity increase on environment. For example, Adebayo (2022) found that economic complexity hinders the quality of environment in Spain using a novel wavelet coherence technique based a dataset covering the period of 1970Q1 and 2017Q4. Similar results were reported in the case of MINT economies (Mexico, Indonesia, Nigeria and Turkey) by Adebayo et al. (2022) who revealed that the increase of economic complexity led to the CO2 emissions growth over the period of 1990–2018. On the contrary, Ahmed et al. (2022) found that economic complexity has a mitigating effect on ecological footprint in for G7 countries from 1985 to 2017.
A higher economic complexity is associated with increased environmental degradation, and this poses huge challenges to be overcome by countries related to ensure the environmental sustainability (i.e., Adebayo, 2022; Adebayo et al., 2022; Ahmad et al., 2021; Ikram et al., 2021; Majeed et al., 2021; Nathaniel, 2021; Rafique et al., 2021a; Shahzad et al., 2021a; Neagu, 2020; Yilanci and Pata (2020); Neagu and Teodoru, 2019).
Moreover, the harmful impact on environment depends on the stage of development as Dogan et al. (2019) highlighted and the effect is higher in lower and higher middle income countries while in high-income economies is limited. Similar findings were reported by Ahmad et al. (2021) in emerging economies. It is also suggested that increasing the share of renewable energy sources in the energy mix would and reducing fossil fuel use will have as result decreasing levels of environmental degradation. In the context of our research, energy policies in the examined countries meant to enhance the use of renewable energy sources in industry along with pricing strategies stimulating the abandon of fossil fuels would be beneficial for the environment. This would counteract the negative impact of an increased economic complexity on the environment.
On the other hand, Romero and Gramkow (2021) proved that economic complexity can be associated with less carbon emission due to the type of technologies involved in the manufacturing process. In this line, several studies report that economic complexity can induce a raise of environmental performance (expressed through the Environmental Performance Index) (i.e., Boleti et al., 2021; Lapatinas et al., 2019b). Moreover, Ahmed et al. (2022) found that economic complexity had a positive contribution to reduce environmental deterioration expressed by ecological footprint in G7 countries from 1985 to 2017. In line with these findings, Wang et al. (2021) revealed that exports quality led to decreasing levels of CO2 emissions in the case of leading complex economies, as well as Dogan et al. (2021) in the case of 28 OECD countries for 1990–2014.
Further, there are other studies providing evidence in support of the validation of Environmental Kuznets Curve model in the presence of economic complexity as explanatory variable (i.e., Neagu and Neagu, 2022; Chu, 2021; Chu and Le, 2021; Pata, 2021; Neagu, 2019; Can and Gozgor, 2017) suggesting that it is possible to curb the environmental pressure, mainly in developed countries. In the early stages of structural transformation of economy, the economic complexity induces increasing levels of pollution until a threshold. Further, the use of advanced and cleaner production, along with economic and social factors, and an appropriate institutional framework will induce a reduction effect on environment and curb the environmental pressure.
Some recent studies are focused on the link between economic complexity and renewable energy. For example, Shahzad et al. (2021b) provide evidence on support of idea that policies towards product diversification have as result positive effects on renewable energy demand in emerging as well as developed economies (G-7 and E-7 countries) in the period of 1990–2017. They also identified a nonlinear relationship between export diversification and renewable energy. The study of Rafique et al. (2021b) revealed that economic complexity has a positive impact on renewable energy demand in G7 and E7 countries.
Finally, we identified only two studies using the newly introduced green openness index in the analysis of the association between income and environmental degradation. Can et al. (2021) tested the role of green openness index on environmental sustainability using the Environmental Kuznets Curve (EKC). They identified the validity of the EKC hypothesis in 35 OECD countries. The new introduced variable is found as an essential factor of the reduction of environmental deterioration (expressed by ecological footprint) and could be seen as useful tool to achieve carbon neutrality targets. The study of Can et al. (2022) revisits the trade-environment nexus for 31 OECD countries over the period of 2007 and 2017, provides evidence in favor of the EKC hypothesis and reveals that the presence of green products in trade reduces the ecological footprint.
Summarizing the above assertions, we can conclude that the determinants of economic complexity still remain an under-explored topic. Even the link between economic complexity and environment is in the focus of more studies, the multifaceted phenomenon of complexity in economy and environment call for further investigation and analysis. As regards to the relationship between economic complexity and renewable energy, only two studies could be mentioned as well as regarding the green trade and environment. The present paper aims to cover these gaps and to use the newly introduced index of green trade in a new, non-explored until now, analysis of its potential association with economic complexity. Thus, our research’s contributions consist of connecting the two concepts (economic complexity and green economy) and enriching the scarce literature on economic complexity drivers with a new factor (green trading).
Data and Methodology
Data
The present study aims to analyze the impact of green products on economic complexity in eleven Central and Eastern European countries (Bulgaria, Czech Republic, Croatia, Hungary, Estonia, Latvia, Lithuania, Poland, Romania, Slovakia and Slovenia) for a time span running from 2003 to 2016.
The level of the relative knowledge intensity of one’s country economy is expressed by the economic complexity index (ECI), calculated by Observatory of Economic Complexity (OEC) (Simoes and Hidalgo, 2011). The values of this index are computed based on data connecting locations to the activities that are present in them (OEC).
The Economic Complexity Index expresses the productive structure of a country by computing data regarding diversity (number of activities of a location) and ubiquity of an activity (number of location where is present) (Hidalgo and Hausmann, 2009; Hidalgo, 2021).
In the economic complexity a perspective, countries have their own capabilities to manufacture products but also, they are connected to other countries in order to ensure the capabilities they need to produce them. It results a network in which countries are connected to their available capabilities and products to the capabilities they require. Further, a product can be exported by several countries while a country can export products that are made based on capabilities deriving from other countries. It results bipartite networks connecting countries to their exported products. The mathematical representation is an ‘adjacency matrix,
The Economic Complexity Index (ECI) is computed as follows (Hausmann et al., 2014):
According to the work of Can et al. (2022), the Green Openness Index, 2022 (GOP) of a country is calculated as follows:
where:
The index is computed for the European Union (EU) countries for the period of 2003–2016 based on the items included in the OECD’s Combined List of Environmental Goods (CLEG) (introduced by Sauvage, 2014) covering 255 environmental products.
In the CLEG1 list are included basket represents a combination of three lists: the ‘Friends’ List2 issued the World Trade Organization (WTO) (WTO, 2009); a modified Plurilateral Agreement on Environmental Goods and Services (PEGS)3 list released by OECD (Sauvage, 2014); and Asia -Pacific Economic Cooperation (APEC) (APEC, 2012).
GOP time series were extracted from BETA Akademi Social Science Research Lab (section of the European Union countries).
Methodology
The following econometric model will be used in our study:
where: i denotes the country, t means time, ECI represent the Economic Complexity Index, GOP represents the Green Openness Index, FinDev is the Financial Development Index, R&D represents Research and Development Expenditures, PT is the Number of Patents;
In order to ensure the robustness of our results we will introduce a set of control variables. Thus, Eq. 3 will have the following form:
where:
Given the aim of the study to investigate the impact of green trade openness on economic complexity, our core explanatory variable is GOP. Other independent variables are introduced in the model following the results of Nguyen et al. (2020) regarding financial development and number patents as drivers of economic complexity. R&D expenditures were also included in the model due to the fact economic complexity is based on productive knowledge (human and social capital, technologies) that could be enhanced through appropriate investment in research—development and innovation activities. As control variables, gross capital formation expresses the physical resource (endowment) required in the production of goods, foreign direct investment and human capital are mentioned in several studies as enabler factors of products sophistication (i.e., Nguyen at., 2020, Zhu and Fu, 2013; Hausmann et al., 2007).
Name of variables and their sources are displayed in Table 1.
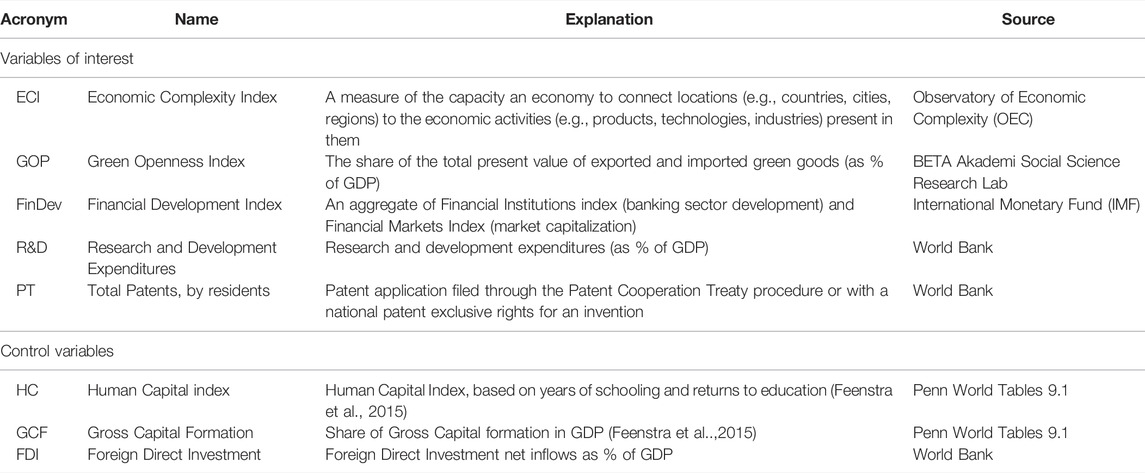
TABLE 1. Variables and their sources.
The econometric strategy will include the following the steps: 1) cross-sectional dependence test for the variables under examination; 2) if the dependency is identified, stationarity of variables will be checked using second-generation unit root tests (CIPS and PESC-ADF); 3) their long-run cointegration relationship is tested with Westerlund test; 4) we estimate the long-run parameters with panel Fully Modified Ordinary Least Squares (FMOLS) and Dynamic Ordinary Least Squares (DOLS) models; 5) we identify the direction of the causal relationship between variables with Dumitrescu and Hurlin (2012) test.
The cross-sectional dependence among variables is checked using the Pesaran (2004) CD test. The null hypothesis of no cross-sectional dependence assumes that the correlation of disturbances between different cross-sections is zero:
The test statistic is computed by:
where:
The null hypothesis of no cross-sectional dependence is rejected if the values of Prob are lower than 0.05.
When the cross-serial correlation across the panel is identified, efficiency of estimated results may decrease (Phillips and Sul, 2003). Therefore, in order to ensure reliable and accurate results, we apply second generation unit root tests (Pesaran, 2007), namely, the cross-sectionally ADF (PES-CADF) and the cross-sectional augmented IPS (Im, Pesaran, Shin, 2003) (CIPS) for variables’ stationarity testing.
The cross-sectionally Augmented Dickey-Fuller (CADF) test consists of standard Dickey-Fuller (DF) regressions augmented with cross-sectional averages of lagged levels and first difference series of the i-th cross-section in the panel (Pesaran, 2007):
where:
The CIPS test computes the average of individual CADF statistic values for individual cross-sections:
where:
The null hypothesis of homogeneous unit root states that all panel sections are non-stationary, while the alternative establishes that at least one individual section in the panel is stationary.
In order to ensure the accuracy and robustness of results in the presence of cross-sectional dependence, the Westerlund (2005) cointegration test will be applied. The test works under two assumptions of cointegration presence: in some of the panels or in all the panels. Under the first assumption (cointegration is identified in some of the panels) the auto regression (AR) parameter is panel specific while under the second option (all panels are cointegrated), the AR parameter is the same over the panels. When the p-value of the variance ratio (VR) statistic is under the chosen significance level the null hypothesis (of no cointegration) is rejected, the alternative hypothesis being accepted (cointegration is present at least in some panels or in all panels).
We use the panel fully modified ordinary least squares (FMOLS) and panel dynamic ordinary least squares (DOLS) methods developed by Pedroni (2001a, 2001b) in order to estimate the long-run parameters.
The panel FMOLS method is based on the following equation:
where:
The panel FMOS estimator is computed with the formula below:
where:
The panel cointegration coefficient is estimated considering the average of FMOLS coefficients in the cross sections.
The DOLS panel regression model (Pedroni, 2001b) is defined as follows:
This equation is estimated for each panel cross section and then the panel cointegration coefficient is computed as average of the DOLS coefficients for each section.
The panel DOLS estimator is calculated as below:
We use the test developed by Dumitrescu and Hurlin (2012) in order to identify the direction of causality between the variables.
Under the null hypothesis (of no causality from x to y):
H0:
The alternative hypothesis assumes that there are
H1:
The Dumitrescu and Hurlin test uses the average Wald statistic in association with the test of non causality hypothesis for
In the case of the null hypothesis (of non causality), each individual Wald statistic converges to a chi-squared distribution (with K degrees of freedom):
When T tends to infinity, presuming that the individual residuals
When
The homogeneous non causality hypothesis is rejected when Z-statistic is higher than the chosen critical value.
Main Findings
The descriptive outline of variables under examination is displayed in Table 2. The values of Economic Complexity Index (ECI) are positives for all considered countries and the whole period of time, indicating that these locations have a complexity that is larger than the average location. The averages values are close to 1 and maximum to 1.7 that indicates a good position of the considered countries in the international rankings of ECI where the most complex economies record values around 2.5.
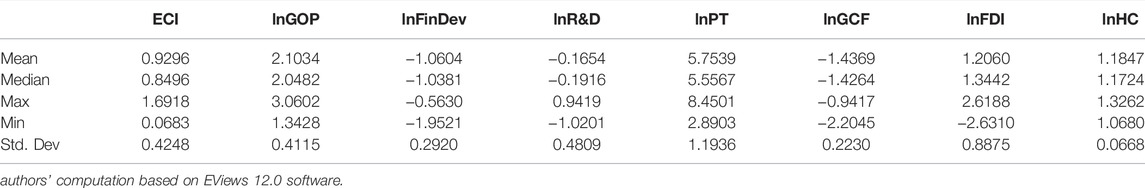
TABLE 2. Statistical description of variables.
The results of the cross-sectional dependence test are shown in Table 3. We notice that the cross-sectional dependence is identified in all variables’ series, for a statistical threshold of 5%.
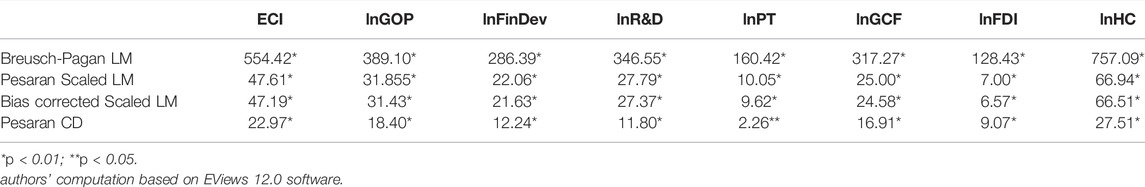
TABLE 3. Results of cross-sectional dependence test.
The statistics of both unit root tests (PES-CADF and CIPS) displayed in Table 4 indicates that the considered variables are not stationary at their level, but they are integrated at their first level [I (1)] for a statistical significance threshold of 5%.
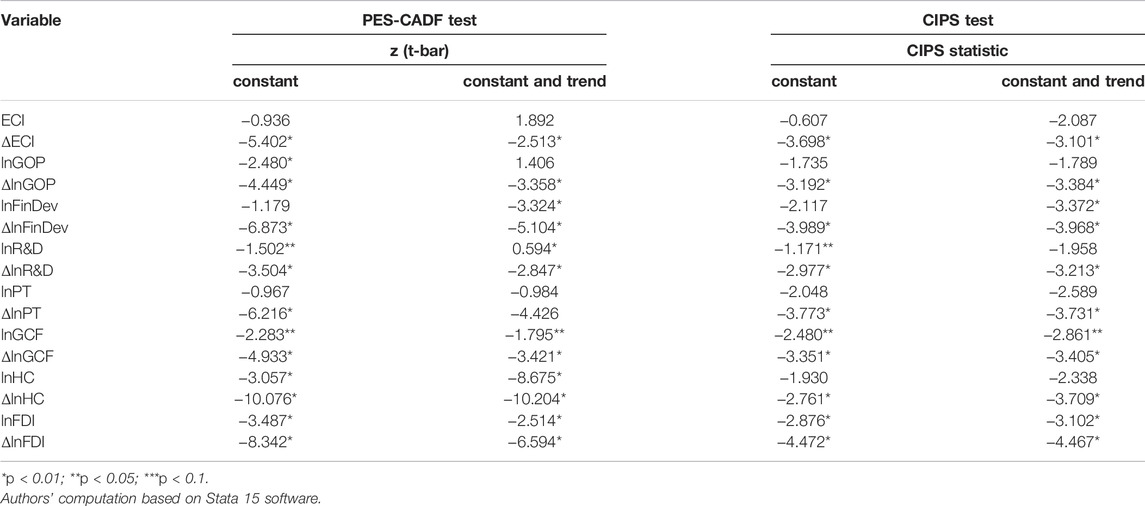
TABLE 4. Results of unit root tests.
Table 5 shows the cointegration results using the Westerlund test. The values of prob. are lower than 0.05 that indicates the presence of a cointegration relationship on the long run between the examined variables under both assumptions (“some panels are cointegrated” and “all panels are cointegrated”). We conclude that the long-run stability link exists between ECI, lnGOP, lnFinDev, ln R&D, and lnPT and also when the control variables (lnGCF, lnHC, and lnFDI) are added.
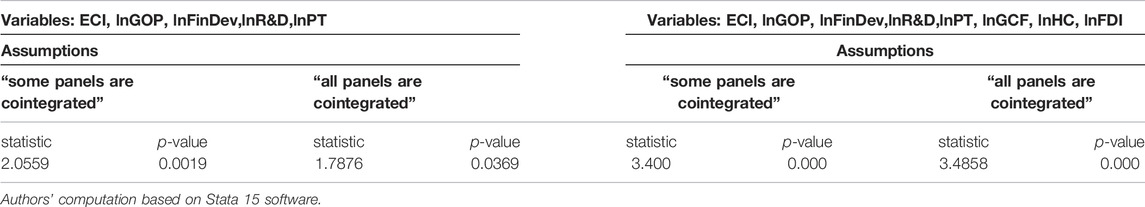
TABLE 5. Results of Westerlund cointegration test.
The estimation of the FMOLS and DOLS models illustrates positive elasticities of explanatory variables with the dependent variable. ECI is positively associated with lnGOP, lnFinDev, lnR&D, and lnPT (our variables of interest) for a statistical significance of 1% in both models (Table 6). This suggests that an increase in the level of explanatory variables (lnGOP, lnFinDev, lnR&D, and lnPT) is associated with a higher level of economic complexity. The relationship is maintained when the control variables (lnGCF, lnHC, and lnFDI) are added, indicating the robustness of the results. Gross capital formation is positively associated with economic complexity and its regression coefficient is significant. The same association is identified in the case of human capital as contributor to economic complexity, but its coefficient is significant only in the FMOLS model. Foreign direct investments are negatively associated with economic complexity in the examined period of time (2003–2016) in CEE countries. This result can be explained by the short period of time included in the analysis and also by specific factors in these countries that induce a specific dynamics of FDI hindering their contribution to the sophistication level of productive structure and traded goods.
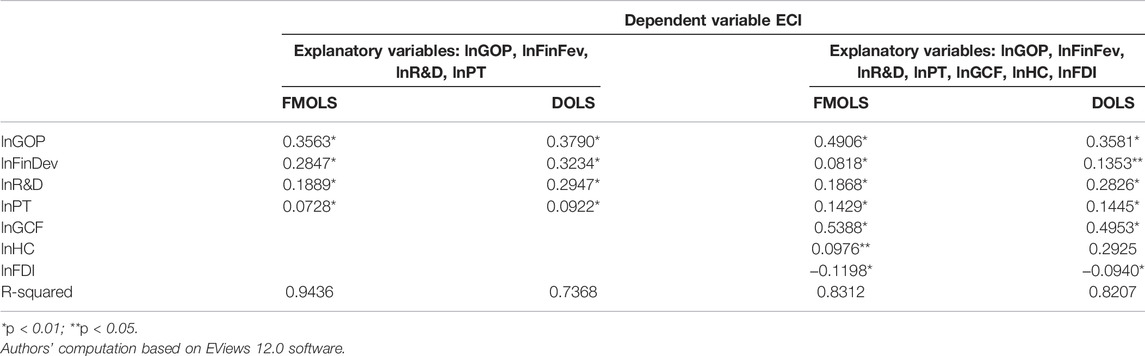
TABLE 6. Results of regression estimation.
From running the Dumitrescu-Hurlin test (Table 7) the following causal relationships were identified between the dependent variable and explanatory variables of interest: 1) bidirectional relationship between ECI and lnR&D; 2) unidirectional causalities running from lnGOP to ECI, from ECI to FDI and from ECI to lnPT.
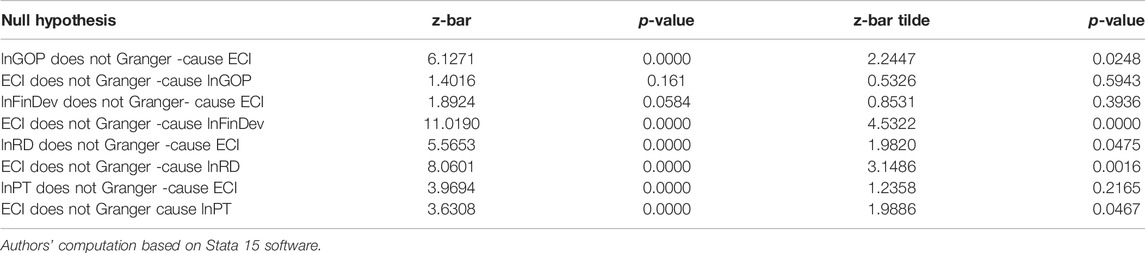
TABLE 7. Dumitrescu-Hurlin causality test.
First of all, the association between economic complexity and green openness index is of great interest for the aim of our study. The results suggest that the share of green products in the export basket may lead to a higher complexity. Moreover, research and development expenditures represent not only enablers for increasing complexity of exported goods but also, an increase in economic complexity generates a higher demand for more research and development activities, as productive capabilities. Inversely, the level of sophistication of exported products can stimulate the financial development and the increase of patents’ number in the countries under examination.
Discussion
Our empirical results reveal that the presence of green products in trade (imports and exports basket) could be considered as an enabler of the complexity level of Central and Eastern European economies. Generally, green products are based on cleaner technologies with a reduced impact on environment and also resource and energy efficient. This is also a general principle guiding the green economy. Increase of trade with green products would generate a beneficial impact on environmental quality (Gao and Zheng, 2017; Guo et al., 2017). In this way, the detrimental effect of economic complexity on environment (i.e., greenhouse gas emissions, CO2 emissions and ecological footprint) reported by some studies (e.g., Can and Gozgor, 2017; Lapatinas et al., 2019b; Neagu and Teodoru, 2019; Dong et al., 2020; Dogan et al., 2021; Romero and Gramkow, 2021; Adebayo, 2022; Adebayo et al., 2022; You et al., 2022). Can et al. (2022) reported that Environmental Kuznets Curve (EKC) is valid in a sample of 31 OECD countries over the period of 2007–2017. The variable ‘green openness index’ was found to have a positive impact on reduction of environmental degradation. They also suggest that trading green goods is a powerful tool for attaining carbon neutrality targets in the examined countries.
Our results could be linked to the findings of Shahzad et al. (2021a) who provided evidence in support of the idea that policies directed towards product diversification have positive effects on renewable energy demand in emerging as well as developed economies (G-7 and E-7 countries) in the period of 1990–2017. This issue could be further analyzed, in the context of using the green openness index linked to economic complexity.
In spite of the detrimental effect on environment, the increase of economic complexity has beneficial effect on growth (i.e., Tachella et al., 2018; Chavez et al., 2017; Özgüzer and Binatli, 2016; Cristelli et al., 2015; Poncet and de Waldemar, 2013; Bustos et al., 2012; Felipe et al., 2012) and income distribution (i.e, Lee and Vu, 2020; Hartmann et al., 2017). Thus, our findings suggest that growth of green trading would generate higher levels of income and narrowing the income gap in the examined countries.
We revealed that financial development is stimulated by the increase of economic complexity and the causality runs from ECI to financial development in CEE countries. This is different from the results of Nguyen et al. (2020) (for 52 middle-income and high-income economies) revealing bidirectional causality between financial development and economic complexity. It is also different from the findings of Ahmed et al. (2022) who identified a causality running from financial development to ECI in the case of G7 countries.
Economic complexity is found to be positively associated with the number of patents issued by residents in the examined countries, that is in line with the conclusions of Sweet and Eterovic Maggio (2015) stating that stronger intellectual property rights system could engender higher levels of economic complexity. The identified causality from ECI to number of patents is in contrast with the conclusions of Nguyen et al. (2020) who reported an inverse direction of this causal relationship.
We identified a bi-directional relationship between R&D expenditures and ECI. Increase of the R&D expenditures leads to higher economic complexity as well as, inversely, a higher level of sophistication of exported products stimulates the investment in R&D activities. Basically, economic complexity is the expression of a country’s innovative output; specifically, it embeds technological innovation and R&D investment which may generate less pollutant industrial processes and more energy efficiency. The impact of economic complexity on environment would be less detrimental if countries would adopt enhanced renewable energy technology budgets, as it is suggested by Ahmed et al. (2022). Due to the fact that green products are inducing higher levels of economic complexity, green production capabilities must be developed in order to implement green production systems (as suggested Mealy and Teytelboym, 2020) and this could be possible through enhanced investment in R&D and human capital development.
The findings of the present study reveal that: 1) a new determinant of economic complexity is validated, trading with green products, being added to those identified in the current scarce literature; 2) R&D activities, as basis for sophistication level of products, are found to be statistical significant for increase of economic complexity; 3) higher levels of economic complexity would stimulate financial development and increase of patents’ number. In light of these results, the paper’s theoretical implications could be as stated as follows: 1) the connection between economic complexity and green economy is highlighted and offers a potential area for further analysis and research; 2) it is revealed the essential role of R&D activities not only for creating the necessary capabilities for more sophisticated products but also is also for introducing advanced green technologies in the production process and to use renewable energy sources; 3) the corroboration of results to the findings of Shahzad et al. (2021b) and Rafique et al. (2021b) regarding the link between economic complexity and renewable energy, allows us to emphasize the fact that the effect of green trading on economic complexity is twofold: increasing levels of products sophistication (that generates higher level of income, according to Hausmann et al., 2014) and stimulating the renewable energy demand (that is less pollutant) and 4) given the fact that countries tend to converge to the level of income induced by the sophistication of their productive structure (Hausmann et al., 2014), analyzes of the possibilities to increase their economic complexity will be of great interest for academics, researchers and policy makers.
The present paper is a starting research on which further analyzes can be built, for example, on specific channels of economic complexity inducing less pollution in the economy and promoting green economy (e.g., green growth and economic complexity; productive knowledge in the green economy). It is also worthy to be mentioned the potential of green openness index to be used in further research on economic complexity to discover driving factors for the presence of green products in the basket of sophisticated products, as highlighted Can et al. (2022).
Conclusions and Policy Implications
The aim of the paper was to assess the association between green openness index, financial development, R&D expenditures, number of patents and economic complexity index in eleven Central and Eastern European countries. The findings show that green openness index is statistically validated as a driver of economic complexity in the considered countries over the period of 2003–2016. As reported by Nguyen et al. (2020), financial development and number of patents are positively associated with economic complexity. Moreover, the extension of financial sector and the number of patents are positively influenced by the level of sophistication of exported products.
The paper reports also another driving factor of economic complexity namely, R&D expenditures, as a proxy for investment in activities generating productive knowledge required to increase the level of sophistication of exported products. Moreover, the empirical results show that investment in R&D is stimulated by higher levels of economic complexity. In this virtuous circle, the necessary productive knowledge generated by the R&D investment serves as input for the productive structure and the evolving sophisticated productive output will stimulate the demand for more investment in R&D.
The increase of economic complexity (as a contributor to economic growth) put a new challenge for all countries: additional concern related to environmental sustainability must be placed in the center of economic and energy policies, if countries aim to increase their complexity level (Neagu, 2021). Moreover, as suggested by Rafique et al. (2021b) economic complexity may be seen as a ‘political factor stimulating the energy transformation and greener energy demand’. Specific economic policy measures must be designed regarding the selection of more green goods and services in the sophisticated products basket.
The paper’s results must be viewed in the specific context of the countries under examination. Central and Eastern European countries are experiencing an ascending trend of their economic complexity, accompanied by an accelerated economic growth and concerns related to environmental degradation resulted from intense economic activities.
Based on the above findings, policy makers from CEE countries must be focused on strategies to expand the share of the green products in their export baskets. This would generate beneficial effects for environmental quality and make progress towards reduced carbon emission economies. Given the fact that several papers revealed the negative effect of economic complexity on environment (e.g., Neagu and Teodoru, 2019; You et al., 2022), the paper highlights the fact that an increase of economic complexity based on green trade will have a lower detrimental effect on environment compared to the non-green trade.
The paper’s findings are encouraging in the examined countries the design of public policies meant to stimulate the green basis of the production process. First, orientation of R&D investment towards green and clean technologies may generate a positive effect on economic complexity accompanied with less environmental damage. The CEE countries have the example of developed countries (e.g., G7 countries) of enhanced renewable energy technology budgets as suggested by Ahmed et al. (2022). Second, specific policies are needed to extend the productive capabilities (knowledge basis, qualitative human capital, technology development) ensuring higher economic complexity (i.e., more public investment in education sector and opportunity for highly skilled human capital, especially for green development; more financial private and public support for investment in science, innovation and R&D, production based on less resources-intensive). Concrete policy measures are required in order to reduce the tariff and non-tariff barriers for green products (as highlighted by Can et al. (2021)). Development of green technologies requires intense investment in R&D and innovation activities. Extension of green technologies will help to meet the climate change targets (share of global carbon emissions). As Paramati et al. (2020) found for OECD countries, green technology is a major factor in reducing the carbon emissions.
These policies must be complemented by appropriate energy policies. A special attention must be given to the increase of renewable energy share in the energy consumption mix as well as to diversification of sources (i.e., solar, wind, biomass), through diverse policy instruments: grants and loans, and fiscal measures (incentives, subsidies, energy tax allowance or exceptions, reduced VAT, and refunds). Another direction for energy policies must be focused in an adequate energy policy mix allowing for reducing levels of carbon intensity and stimulating the transition to low-carbon economy.
Further, in order to finance, implement and enhance technological progress needed for higher economic complexity, a well developed financial sector is essential. Therefore, national policies aiming to sustaining the financial and banking sector have an important role. Credit opportunities for greener companies or green products development provided by the financial and banking sector would be beneficial for enhancing the countries’ capabilities to improve the complexity of their productive structure. Directly linked to the financial sector, the legal framework and governance quality in the examined countries it is also important. For example, a careful monitoring of environmental regulations implementation and overcome of weaknesses in governance, such as corruption, less democracy or less accountability must be included among the governamental policy objectives.
The EU Recovery and Resilience Facility (2021) provides the opportunity to shape national priorities (i.e., National Recovery and Resilience Plans) to be financed, under two general objectives: ‘green’ and ‘digital’ transition. Governments from CEE countries have the opportunity to claim, under national coherent strategies, grants and loans, based on macroeconomic results, meant to help them catch-up in terms of economic complexity, intra- EU convergence and green economy development.
As limitations of the study, we mention the short period of time considered for analysis due to the availability of time series for the newly introduced green openness index. As new time series will be computed, the analysis will be extended to new periods of time and new countries.
Data Availability Statement
The original contributions presented in the study are included in the article, further inquiries can be directed to the corresponding author.
Author Contributions
ON designed the research, collected data, analyzed them revised sections: Data, Methodology, Main Findings and Discussion. M-IN wrote and revised Introduction, Main Findings, processed and revised data with EViews and Stata 15, BG wrote and revised Introduction, Literature Review, Discussion and Conclusions.
Funding
This research was supported by the Scientific Grant Agency of the Ministry of Education, Science, Research, and Sport of the Slovak Republic and the Slovak Academy Sciences as part of the research project VEGA 1/0797/20: “Quantification of Environmental Burden Impacts of the Slovak Regions on Health, Social and Economic System of the Slovak Republic”.
Conflict of Interest
The authors declare that the research was conducted in the absence of any commercial or financial relationships that could be construed as a potential conflict of interest.
Publisher’s Note
All claims expressed in this article are solely those of the authors and do not necessarily represent those of their affiliated organizations, or those of the publisher, the editors and the reviewers. Any product that may be evaluated in this article, or claim that may be made by its manufacturer, is not guaranteed or endorsed by the publisher.
Acknowledgments
Authors are grateful to editors and reviewers for their valuable contribution.
Footnotes
1The environmental themes under consideration for the goods and services included in the CLEG list are: air pollution control, cleaner, and resource efficient production and technologies, environmentally preferable products (i.e., based on end use or disposal features), heat and energy management, environmental monitoring, analysis and assessment equipment, natural resource protection, noise and vibration abatement, renewable energy, solid and hazardous waste management as well as recycling systems, clean up or remediation of soil and water, potable water management and waste water management.
2This list includes 154 products circulated by the members of the “Friends’ Group” (Canada, the European Union, Japan, Korea, New Zealand, Norway, Switzerland, Chinese Taipei, and United States).
3The initial PEGS list was introduced by OECD in 2010, at the Summit of G-20 countries.
References
Adebayo, T. S. (2022). Environmental Consequences of Fossil Fuel in Spain amidst Renewable Energy Consumption: a New Insights from Wavelet-Based Granger Causality Approach. Int. J. Sustain. Dev. World Ecol. March 2022. (in press). doi:10.1080/13504509.2022.2054877
Adebayo, T. S., Rjoub, H., Akadiri, S. S., Oladipupo, S. D., Sharif, A., and Adeshola, I. (2022). The Role of Economic Complexity in the Environmental Kuznets Curve of MINT Economies: Evidence from Method of Moments Quantile Regression. Environ. Sci. Pollut. Res. 29, 24248–24260. doi:10.1007/s11356-021-17524-0
Ahmad, M., Ahmed, Z., Majeed, A., and Huang, B. (2021). An Environmental Impact Assessment of Economic Complexity and Energy Consumption: Does Institutional Quality Make a Difference? Environ. Impact Assess. Rev. 89, 106603. doi:10.1016/j.eiar.2021.106603
Ahmed, Z., Adebayo, T. S., Udemba, E. N., Murshed, M., and Kirikkaleli, D. (2022). Effects of Economic Complexity, Economic Growth, and Renewable Energy Technology Budgets on Ecological Footprint: the Role of Democratic Accountability. Environ. Sci. Pollut. Res. 29, 24925–24940. doi:10.1007/s11356-021-17673-2
Antonietti, R., and Franco, C. (2021). From FDI to Economic Complexity: a Panel Granger Causality Analysis. Struct. Change Econ. Dyn. 56, 225–239. doi:10.1016/j.strueco.2020.11.001
APEC (2012). 20-th APEC Economic Leaders’ Meeting 2012-Annex C: APEC List of Environmental Goods. Singapore: Asia Pacific Economic Cooperation (APEC). Available at: https://www.apec.org/meeting-papers/leadersdeclarations/2012/2012_aelm/2012_aelm_annexc.aspx.
Bahar, D., Rapoport, H., and Turati, R. (2020). Birthplace Diversity and Economic Complexity: Cross-Country Evidence. Res. Policy, 103991. (in press). doi:10.1016/j.respol.2020.103991
Boleti, E., Garas, A., Kyriakou, A., and Lapatinas, A. (2021). Economic Complexity and Environmental Performance: Evidence from a World Sample. Environ. Model Assess. 26, 251–270. doi:10.1007/s10666-021-09750-0
Bustos, S., Gomez, C., Hausmann, R., and Hidalgo, C. A. (2012). The Dynamics of Nestedness Predicts the Evolution of Industrial Ecosystems. PloS One 7 (11), e49393. doi:10.1371/journal.pone.0049393
Can, M., Ahmed, Z., Mercan, M., and Kalugina, O. A. (2021). The Role of Trading Environment-Friendly Goods in Environmental Sustainability: Does Green Openness Matter for OECD Countries? J. Environ. Manag. 295, 113038. doi:10.1016/j.jenvman.2021.113038
Can, M., Ben Jebli, M., and Brusselaers, J. (2022). Can Green Trade Save the Environment? Introducing the Green (Trade) Openness Index. Environ. Sci. Pollut. Res. (in press). doi:10.1007/s11356-022-18920-w
Can, M., and Gozgor, G. (2017). The Impact of Economic Complexity on Carbon Emissions: Evidence from France. Environ. Sci. Pollut. Res. 24, 16364–16370. doi:10.1007/s11356-017-9219-7
Chavez, J. C., Mosqueda, M. T., and Gomez-Zaldivar, M. (2017). Economic Complexity and Regional Growth Performance: Evidence from the Mexican Economy. Rev. Regional Stud. 47, 201–219. doi:10.52324/001c.8023
Chu, L. K. (2021). Economic Structure and Environmental Kuznets Curve Hypothesis: New Evidence from Economic Complexity. Appl. Econ. Lett. 28, 612–616. doi:10.1080/13504851.2020.1767280
Chu, L. K., and Le, N. T. M. (2021). Environmental Quality and the Role of Economic Policy Uncertainty, Economic Complexity, Renewable Energy, and Energy Intensity: the Case of G7 Countries. Environ. Sci. Pollut. Res. 29, 2866–2882. doi:10.1007/s11356-021-15666-9
Cristelli, M., Tacchella, A., and Pietronero, L. (2015). The Heterogeneous Dynamics of Economic Complexity. PloS One 10 (2), e0117174. doi:10.1371/journal.pone.0117174
Dogan, B., Saboori, B., and Can, M. (2019). Does Economic Complexity Matter for Environmental Degradation? an Empirical Analysis for Different Stages of Development. Environ. Sci. Pollut. Res. 26 (31), 31900–31912. doi:10.1007/s11356-019-06333-1
Doğan, B., Driha, O. M., Balsalobre Lorente, D., and Shahzad, U. (2021). The Mitigating Effects of Economic Complexity and Renewable Energy on Carbon Emissions in Developed Countries. Sustain. Dev. 29, 1–12. doi:10.1002/sd.2125
Dong, Z., Chen, W., and Wang, S. (2020). Emission Reduction Target, Complexity and Industrial Performance. J. Environ. Manag. 260, 110148. doi:10.1016/j.jenvman.2020.110148
Dumitrescu, E.-I., and Hurlin, C. (2012). Testing for Granger Non-causality in Heterogeneous Panels. Econ. Model. 29 (4), 1450–1460. doi:10.1016/j.econmod.2012.02.014
Erkan, B., and Yildirimci, E. (2015). Economic Complexity and Export Competitiveness: the Case of Turkey. Procedia - Soc. Behav. Sci. 195, 524–533. doi:10.1016/j.sbspro.2015.06.262
European Union (2018). Renewable Energy Directive, European Union Information Website. Available online: https://energy.ec.europa.eu/topics/renewable-energy/renewable-energy-directive-targets-and-rules_en (accessed on January 30, 2022).
Eurostat (2009). The Environmental Goods and Services Sector - a Data Collection Handboook, Eurostat Methodologies and Working Papers. Luxembourg: Office for Official Publication of the European Communities.
Feenstra, R. C., Inklaar, R., and Timmer, M. P. (2015). The Next Generation of the Penn World Table. Am. Econ. Rev. 105 (10), 3150–3182. (accessed on January 30, 2022). doi:10.1257/aer.20130954
Felipe, J., Kumar, U., Abdon, A., and Bacate, M. (2012). Product Complexity and Economic Development. Struct. Change Econ. Dyn. 23, 36–68. doi:10.1016/j.strueco.2011.08.003
Gao, X., and Zheng, H. (2017). Environmental Concerns, Environmental Policy and Green Investment. Int. J. Environ. Res. Public Health 14, 1570. doi:10.3390/ijerph14121570
Green Openness Index (2022). Social Science Research Lab (GOP). Available from: https://www.betaakademi.com/green-openness-index.
Guo, L. l., Qu, Y., and Tseng, M.-L. (2017). The Interaction Effects of Environmental Regulation and Technological Innovation on Regional Green Growth Performance. J. Clean. Prod. 162, 894–902. doi:10.1016/j.jclepro.2017.05.210
Hausmann, R., Hwang, J., and Rodrik, D. (2007). What You Export Matters. J. Econ. Growth 12 (1), 1–25. doi:10.1007/s10887-006-9009-4
Hausmann, R., Hidalgo, C. A., Bustos, S., Coscia, M., Simoes, A., and Yildirim, M. A. (20142014). The Atlas of Economic Complexity: Mapping Paths to Prosperity. MIT Press. Retrieved October 1, 2021 from: https://s3.amazonaws.com/academia.edu.documents/30678659/HarvardMIT_AtlasOfEconomicComplexity_Part_I.pdf?A.
Hartmann, D., Guevara, M. R., Jara-Figueroa, C., Aristarán, M., and Hidalgo, C. A. (2017). Linking Economic Complexity, Institutions, and Income Inequality. World Dev. 93, 75–93. doi:10.1016/j.worlddev.2016.12.020
Hidalgo, C. A. (2021). Economic Complexity Theory and Applications. Nat. Rev. Phys. 3, 92–113. doi:10.1038/s42254-020-00275-1
Hidalgo, C. A., and Hausmann, R. (2009). The Building Blocks of Economic Complexity. Proc. Natl. Acad. Sci. U.S.A. 106 (26), 10570–10575. doi:10.1073/pnas.0900943106
Ikram, M., Xia, W., Fareed, Z., Shahzad, U., and Rafique, M. Z. (2021). Exploring the Nexus between Economic Complexity, Economic Growth and Ecological Footprint: Contextual Evidences from Japan. Sustain. Energy Technol. Assessments 47, 101460. doi:10.1016/j.seta.2021.101460
Im, K. S., Pesaran, M. H., and Shin, Y. (2003). Testing for Unit Roots in Heterogeneous Panels. J. Econ. 115, 53–74. doi:10.1016/S0304-4076(03)00092-7
Innocenti, N., Vignoli, D., and Lazzeretti, L. (2021). Economic Complexity and Fertility: Insights from a Low Fertility Country. Reg. Stud. 55, 1388–1402. doi:10.1080/00343404.2021.1896695
Kannen, P. (2020). Does Foreign Direct Investment Expand the Capability Set in the Host Economy? A Sectoral Analysis. World Econ. 43 (2), 428–457. doi:10.1111/twec.12869
Khan, H., Khan, U., and Khan, M. A. (2020). Causal Nexus between Economic Complexity and FDI: Empirical Evidence from Time Series Analysis. Chin. Econ. 53 (5), 374–394. doi:10.1080/10971475.2020.1730554
Lapatinas, A., Kyriakou, A., and Garas, A. (2019a). Taxation and Economic Sophistication: Evidence from OECD Countries. PLoS ONE 14, e0213498. doi:10.1371/journal.pone.0213498
Lapatinas, A., Garas, A., Boleti, E., and Kyriakou, A. (2019b). Economic Complexity and Environmental Performance: Evidence from a World Sample. Germany: MPRA Paper, University Library of Munich, 92833. Available from: https://mpra.ub.uni-muenchen.de/92833.
Lapatinas, A. (2019). The Effect of the Internet on Economic Sophistication: An Empirical Analysis. Econ. Lett. 174, 35–38. doi:10.1016/j.econlet.2018.10.013
Lee, K.-K., and Vu, T. V. (2020). Economic Complexity, Human Capital and Income Inequality: a Cross-Country Analysis. Jpn. Econ. Rev. 71, 695–718. doi:10.1007/s42973-019-00026-70
Majeed, M. T., Mazhar, M., Samreen, I., and Tauqir, A. (2021). Economic Complexities and Environmental Degradation: Evidence from OECD Countries. Environ. Dev. Sustain 24, 5846–5866. doi:10.1007/s10668-021-01687-4
Mealy, P., and Teytelboym, A. (2020). Economic Complexity and the Green Economy. Res. Policy, 103948. (in press). doi:10.1016/j.respol.2020.103948
Nathaniel, S. P. (2021). Economic Complexity versus Ecological Footprint in the Era of Globalization: Evidence from ASEAN Countries. Environ. Sci. Pollut. Res. 28 (9), 64871–64881. doi:10.1007/s11356-021-15360-w
Neagu, O. (2020). Economic Complexity and Ecological Footprint: Evidence from the Most Complex Economies in the World. Sustainability 12 (21), 9031. doi:10.3390/su12219031
Neagu, O. (2021). Economic Complexity: a New Challenge for the Environment. Earth 2 (4), 1059–1076. doi:10.3390/earth2040063
Neagu, O., and Neagu, M.-I. (2022). The Environmental Kuznets Curve Revisited: Economic Complexity and Ecological Footprint in the Most Complex Economies of the World. Stud. Univ. „Vasile Goldis” Arad – Econ. Ser. 32 (Issue 1/2022), 78–99. doi:10.2478/sues-2022-0005
Neagu, O., and Teodoru, M. (2019). The Relationship between Economic Complexity, Energy Consumption Structure and Greenhouse Gas Emission: Heterogeneous Panel Evidence from the EU Countries. Sustainability 11, 497. doi:10.3390/su11020497
Neagu, O. (2019). The Link between Economic Complexity and Carbon Emissions in the European Union Countries: A Model Based on the Environmental Kuznets Curve (EKC) Approach. Sustainability 11, 4753. doi:10.3390/su11174753
Nguyen, C. P., Schinckus, C., and Su, T. D. (2020). The Drivers of Economic Complexity: International Evidence from Financial Development and Patents. Int. Econ. 164, 140–150. doi:10.1016/j.inteco.2020.09.004
Observatory of Economic Complexity (OEC). (Available from: https://oec.world/en/resources/methods).
Özgüzer, G. E., and Binatli, A. O. (2016). Economic Convergence in the EU: A Complexity Approach. Working Papers No. 1503. Izmir: Izmir University of Economics. http://eco.ieu.edu.tr/wp-content/wp1503.pdf
Paramati, S. R., Mo, D., and Huang, R. (2021). The Role of Financial Deepening and Green Technology on Carbon Emissions: Evidence from Major OECD Economies. Finance Res. Lett. 41, 101794. doi:10.1016/j.frl.2020.101794
Pata, U. K. (2021). Renewable and Non-renewable Energy Consumption, Economic Complexity, CO2 Emissions, and Ecological Footprint in the USA: Testing the EKC Hypothesis with a Structural Break. Environ. Sci. Pollut. Res. 28, 846–861. doi:10.1007/s11356-020-10446-3
Pedroni, P. (2001a). “Fully Modified OLS for Heterogeneous Cointegrated Panels,” in Advances in Econometrics, Volume 15: Nonstationary Panels, Panel Cointegration and Dynamic Panels. Editors B. H. Baltagi, T. B. Fomby, and R. Hill, 93–130. Available from: https://www.emeraldinsight.com/doi/abs/10.1016/S0731-9053(00)15004-2 (Accessed January 14, 2022).
Pedroni, P. (2001b). Purchasing Power Parity Tests in Cointegrated Panels. Rev. Econ. Statistics 83 (4), 727–731. (Accessed January 15, 2022). doi:10.1162/003465301753237803
Pesaran, M. H. (2007). A Simple Panel Unit Root Test in the Presence of Cross-Section Dependence. J. Appl. Econ. 22, 265–312. doi:10.1002/jae.951
Pesaran, M. H. (2004). General Diagnostic Tests for Cross Section Dependence in Panels, Cambridge Working Papers in Economics No. 0435. Cambridge, MA, USA: University of Cambridge, Faculty of Economics. Available online: https://www.repository.cam.ac.uk/handle/1810/446 (Accessed on August 2, 2021).
Phillips, P. C. B., and Sul, D. (2003). Dynamic Panel Estimation and Homogeneity Testing under Cross Section Dependence. Econ. J. 6 (1), 217–259. doi:10.1111/1368-423x.00108
Poncet, S., and de Waldemar, F. S. (2013). Complexité économique et croissance. Rev. Économique 64 (3), 495–503. doi:10.3917/reco.643.0495
Rafique, M. Z., Doğan, B., Husain, S., Huang, S., and Shahzad, U. (2021b). Role of Economic Complexity to Induce Renewable Energy: Contextual Evidence from G7 and E7 Countries. Int. J. Green Energy 18 (7), 745–754. doi:10.1080/15435075.2021.1880912
Rafique, M. Z., Nadeem, A. M., Xia, W., Ikram, M., Shoaib, H. M., and Shahzad, U. (2021a). Does Economic Complexity Matter for Environmental Sustainability? Using Ecological Footprint as an Indicator. Environ. Dev. Sustain 24, 4623–4640. doi:10.1007/s10668-021-01625-4
Recovery and Resilience Facility (2021). Regulation (EU) 2021/241 of the European Parliament and of the Council of 12 February 2021 Establishing the Recovery and Resilience Facility. Brussels: Official Journal of the European Union, L57/17. Available at: https://eur-lex.europa.eu/legal-content/RO/TXT/?uri=CELEX%3A32021R0241.
Romero, J. P., and Gramkow, C. (2021). Economic Complexity and Greenhouse Gas Emissions. World Dev. 139, 105317. doi:10.1016/j.worlddev.2020.105317
Sauvage, J. (2014). “The Stringency of Environmental Regulations and Trade in Environmental Goods,” in OECD Trade and Environment Working Papers, 2014/03. doi:10.1787/5jxrjn7xsnmq-en
Shahzad, U., Fareed, Z., Shahzad, F., and Shahzad, K. (2021a). Investigating the Nexus between Economic Complexity, Energy Consumption and Ecological Footprint for the United States: New Insights from Quantile Methods. J. Clean. Prod. 279, 123806. doi:10.1016/j.jclepro.2020.123806
Shahzad, U., Lv, Y., Doğan, B., and Xia, W. (2021b). Unveiling the Heterogeneous Impacts of Export Product Diversification on Renewable Energy Consumption: New Evidence from G-7 and E-7 Countries. Renew. Energy 164, 1457–1470. doi:10.1016/j.renene.2020.10.143
Simoes, A. J. G., and Hidalgo, C. A. (2011). “The Economic Complexity Observatory: An Analytical Tool for Understanding the Dynamics of Development,” in Workshops at the Twenty-Fifth AAAI Conference on Artificial Intelligence. (Available from: https://oec.world/en/resources/about.
Skjærseth, J. B. (2021). Towards a European Green Deal: The Evolution of EU Climate and Energy Policy Mixes. Int. Environ. Agreements 21 (1), 25–41. doi:10.1007/s10784-021-09529-4
Sweet, C. M., and Eterovic Maggio, D. S. (2015). Do Stronger Intellectual Property Rights Increase Innovation? World Dev. 66, 665–677. doi:10.1016/j.worlddev.2014.08.025
Tacchella, A., Mazzilli, D., and Pietronero, L. (2018). A Dynamical Systems Approach to Gross Domestic Product Forecasting. Nat. Phys. 14, 861–865. doi:10.1038/s41567-018-0204-y
United Nations Environment Programme Green Economy. Available from: https://unep.org/explore-topics/green-economy/.
Vu, T. V. (2021). Does Institutional Quality Foster Economic Complexity? the Fundamental Drivers of Productive Capabilities, EconStor Preprints 234103. Kiel: ZBW-Leibniz Information Centre for Economics. (RePEC:zbw:esprep:234103).
Wang, Z., Ben Jebli, M., Madaleno, M., Doğan, B., and Shahzad, U. (2021). Does Export Product Quality and Renewable Energy Induce Carbon Dioxide Emissions: Evidence from Leading Complex and Renewable Energy Economies. Renew. Energy 171, 360–370. doi:10.1016/j.renene.2021.02.066
Westerlund, J. (2005). New Simple Tests for Panel Cointegration. Econ. Rev. 24, 297–316. doi:10.1080/07474930500243019
World Bank (2008). International Trade and Climate Change, Economic, Legal, and Institutional Perspectives. Washington. doi:10.1596/978-0-8213-7225-8
WTO (2009). Continued Work under Paragraph 31 (Iii) of the Doha Ministerial Declaration – Non-paper by Canada, the European Communities, Japan, Korea, New Zealand, Norway, the Separate Customs Territory of Taiwan, Penghu, Kinmen and Matsu, Switzerland, and the United States of America’, JOB(09)/132, 9 October 2009. Geneva: WTO. Available from: http://data.parliament.uk/DepositedPapers/Files/DEP2010-1380/DEP2010-1380.doc.
Yilanci, V., and Pata, U. K. (2020). Investigating the EKC Hypothesis for China: the Role of Economic Complexity on Ecological Footprint. Environ. Sci. Pollut. Res. 27, 32683–32694. doi:10.1007/s11356-020-09434-4
You, W., Zhang, Y., and Lee, C.-C. (2022). The Dynamic Impact of Economic Growth and Economic Complexity on CO2 Emissions: an Advanced Panel Data Estimation. Econ. Analysis Policy 73, 112–128. doi:10.1016/j.eap.2021.11.004
Keywords: economic complexity, green openness index, financial development, patents, R&D expenditures
Citation: Neagu O, Neagu M-I and Gavurova B (2022) How Green is the Economic Complexity in the Central and Eastern European Union Countries?. Front. Environ. Sci. 10:910454. doi: 10.3389/fenvs.2022.910454
Received: 01 April 2022; Accepted: 14 April 2022;
Published: 26 May 2022.
Edited by:
Muhlis Can, BETA Akademi-SSR Lab, TurkeyReviewed by:
Tomiwa Sunday Adebayo, Cyprus International University, TurkeyUmer Shahzad, Anhui University of Finance and Economics, China
Copyright © 2022 Neagu, Neagu and Gavurova. This is an open-access article distributed under the terms of the Creative Commons Attribution License (CC BY). The use, distribution or reproduction in other forums is permitted, provided the original author(s) and the copyright owner(s) are credited and that the original publication in this journal is cited, in accordance with accepted academic practice. No use, distribution or reproduction is permitted which does not comply with these terms.
*Correspondence: Olimpia Neagu, neagu.olimpia@uvvg.ro