High-Speed Rail Opening and Green Innovation—Evidence From China
 Xiaolin Yu
 Kai Wan
- 1School of Business and Management, Zhongnan University of Economics and Law, Wuhan, China
- 2School of Economics, Shanghai University, Shanghai, China
Significant progress has been achieved in the construction of transportation infrastructure in China, where a high-speed rail network of considerable scale and high operational speed has been formed. Against the backdrop of China’s current keynote on “carbon peaking” and “carbon neutrality,” the high-speed rail as a modern, green mode of transport, has become a key force in promoting green technological innovation and maintaining sustainable economic development. This paper focuses on the relationship between the opening of high-speed rail and urban green innovation and the mechanisms behind it. This study utilized panel data on Chinese cities from 2000 to 2018, taking the opening of high-speed rail as a quasi-natural experiment. It focuses on the impact and mechanism of the opening of the high-speed railway on urban green innovation by using the double-difference space Durbin model. Findings indicate that high-speed rail plays a significant role in promoting urban green innovation and that the spatial spillover effect is substantial. The results of the heterogeneity test indicate that high-speed rail can enhance urban green innovation in non-resource-based cities. The impact mechanism of high-speed railways on urban green innovation mainly comes from the flow of innovative personnel and capital, a strategy of local governments to strengthen environmental regulations and improve regional advantages. This paper also indicates that high-speed rail has an inverted U-shaped trend in promoting urban green innovation, and the optimal radius is 200 km from the nucleus city.
Introduction
Since 2008, rapid progress has been made in China’s high-speed rail (HSR) construction. As of 2020, China’s railway fixed asset investment totaled 781.9 billion yuan, and the total high-speed rail mileage reached 37,900 km, one of the largest networks to be constructed in the world. According to the State Council’s “Medium and Long-term Railway Network Planning,” by 2025 China’s HSR network will complete the leap from “four verticals and four horizontals” to “eight verticals and eight horizontals”. The construction of HSR has dramatically brought about the space-time compression effect, improved the traffic accessibility between cities, and promoted the connection between cities.
With rapid economic growth over the past 3 decades, the problems of resource depletion, environmental pollution, and continuous ecosystem degradation have increased sharply (Udemba et al., 2020), and environmental pollution has become a major obstacle limiting China’s sustainable economic development (Mele and Magazzino, 2020). At the same time, the Fifth Plenary Session of the 18th Central Committee puts forward the five development concepts of “innovation, coordination, green, openness, and sharing,” emphasizing the role of green innovation. Under the current dual background of China’s vigorous promotion of transportation infrastructure construction and the emphasis on green innovation, the transportation accessibility brought about by HSR could significantly improve the level of urban green innovation. If so, what mechanisms have made the most significant impact? Which type of city has a more noticeable effect? Furthermore, does HSR have an optimal radius for the city’s green innovation level? Exploring these issues will help to measure the positive impact of HSR on urban green innovation and promote the high-quality development of China’s economy.
With the rapid development of high-speed railways, useful discussions on the relationship between the opening of HSR and economic growth have been made by scholars, but no unanimous conclusions have been formed. Among them, Qin (2017) argued that the opening of HSR will bring about a “siphon effect,” leading to a negative effect on non-central cities and areas close to central cities. Baum-Snow et al. (2020) found that the economic development of manufacturing and service industries in central cities was significantly boosted by an increase in the improvement of traffic accessibility. However, this has led to a dampening effect on the development of peripheral cities, thus widening the regional economic gap to some extent, a conclusion also confirmed by Li et al. (2021).
The research results of some scholars show that HSR makes a significant contribution to economic growth. Alder et al. (2016) argued that the opening of HSR can lead to the development of the local economy. They further compared the positive and negative effects of the opening of HSR on employment, wages, and economic growth, and found that the opening of HSR has a positive effect on promoting economic growth. Magazzino and Mele (2021), analyzed data from China and found that around 79% of economic growth comes from transport infrastructure. However, a boost is more pronounced in the short term due to regional differences in demand and preferences for transport. In addition, subsequent studies have pointed out that the economic benefits of the opening of HSR originate from diversified aspects. The opening of HSR greatly reduces business travel time (Deng et al., 2021), changes the allocation of resources in the labor market, and accelerates the flow of knowledge between regions (Dong et al., 2020). It strengthens the capacity utilization of enterprises, the production capacity of regions (Lu and Li., 2022), and facilitates cross-regional trade of goods (Donaldson, 2018). These positive external spillover effects of the opening of the HSR are recognized by scholars, indicating positive implications for economic growth.
Despite these indications, research on the relationship between the opening of HSR and urban green innovation is still relatively scarce, with some scholars’ studies supporting the environmental benefits of HSR from the perspective of human capital mobility and industrial recontraction. On the one hand, the time-space compression effect generated by the opening of HSR can reduce information asymmetry (Chen and Hall. 2011) and increase opportunities for face-to-face communication between people, thus promoting cross-city R&D collaboration (Wang et al., 2022) and laying the foundation for green urban development (Lin and Jia., 2022). On the other hand, HSR not only operates in a low-energy mode (Song et al., 2016), which significantly reduces CO2 emissions in cities through transport substitution (Jia et al., 2021), significantly enhancing transport accessibility (Wang et al., 2018), which in turn leads to a spatial, distributional and hierarchical structural shifts in cities (Fang, 2021). Ultimately, this contributes to an increase in urban green productivity (Kong et al., 2021).
Previous literature has mostly affirmed the economic and environmental benefits of the opening of HSR, indicating the importance and contribution made by this study. Yet, other studies have only focused on the potential flow of human capital, knowledge spillovers, and industrial reconstruction that may be generated by HSR. The discussion tends to end there, ignoring whether the opening of HSR could have further impacts on urban green innovation after these phenomena have been generated. Moreover, it is worth noting that when examining basic conditions in China, the local government plays a vital role in the economic activities of a region (De Luca and Atuahene-Gima., 2007). The flow of innovation factors triggered by the opening of the HSR may bring about imitation and competition among local governments in terms of green innovation activities, thus having an important impact on the level of green innovation in cities. Ignoring the role of local governments would be detrimental to a comprehensive examination of the impact effects of the opening of the HSR. Unfortunately, however, how the opening of HSR affects urban green innovation from the perspective of local government behavior has only been explored by a few scholars to date, which provides an opportunity for this paper to conduct further study.
Three significant contributions are made in this paper: (1) based on the “core-periphery” model of new economic geography (Krugman, 1993), this paper combines the parameter setting methods of gravitation and repulsion in the physical model to describe the “centripetal force” and “centrifugal force” generated by HSR. It explains the relationship and the mechanism between HSR and urban green innovation and shows that there is an optimal radius for the impact of HSR on urban green innovation. Ours is the first attempt to examine this in existing literature. (2) This paper expands literature on urban green innovation, with the influencing factors of green innovation in terms of environmental regulation, R&D investment, industrial structure optimization, and upgrading, international capital, technology transfer, and institutional environment are mostly analyzed (Feng and Chen., 2018; Hsu et al., 2021; Qi et al., 2021). On the other hand, this paper explores the influencing factors of green innovation from the perspective of HSR opening and provides a meaningful supplement to the existing literature. (3) The paper also expands literature on green innovation. To date, existing literature has largely analyzed the influencing factors of green innovation in terms of environmental regulation, international capital, technology transfer, and the construction of national-level urban agglomerations, where this paper explores the influencing factors of green innovation from the perspective of HSR. In addition, the paper combines the “Green List of International Patent Classification” published by the World Intellectual Property Organization (WIPO) and data from the State Intellectual Property Office to identify urban green patent data. It uses the dual-differential spatial Durbin model to verify the relationship between HSR and urban green innovations, aiming to avoid errors caused by relying on previous measurements of green innovation.
The rest of this paper is organized as follows: Part II introduces the theoretical model; Part III presents the research design with empirical data; Part IV shows empirical results followed by Part V, which includes further analysis; and Part VI concludes the paper with policy implications.
Theoretical Model and Assumptions
New economic geography has made a considerable contribution to the study of the relationship between transportation infrastructure and regional economic gaps. Different from previous studies, this paper draws on the ideas of (Acemoglu, Johnson and Robinson., 2001) based on the “core-periphery” model of new economic geography (Krugman, 1993) and divides the sector into industrial sectors of clean industry and the industrial sector of polluting industry. It further discusses the relationship and the mechanism between HSR and urban green innovation.
This paper assumes that there are city H and city W, three sectors (agricultural sector A, industrial sector M in the cleaning industry, an industrial sector I in the pollution industry, of which the industrial sector M in the cleaning industry does not produce pollutants in the city H. The industrial sector I in the polluting industries produces pollutants in the city W, and the two elements are labor (L) and capital (K). In the agricultural sector, with constant returns to scale and perfect competition, agricultural labor is used as an input element to produce agricultural products. The industrial sector M in the cleaning industry has the characteristics of increasing returns to scale and monopolistic competition. Industrial sector I, which is in the polluting industry, has the characteristics of constant returns to scale and perfect competition. There is no cost in the trade of agricultural products, and the trade in the industrial sector needs to meet the assumption of “iceberg cost”. In addition, existing studies have pointed out that there is a loss of efficiency in the flow of labor between regions due to regional differences (Ganong and Shoag., 2017), and the flow of capital between regions also has flow barriers due to information transmission and communication costs. The improvement of transportation infrastructure can enhance traffic accessibility and reduce the degree of information asymmetry between the two places. Existing documents have also pointed out that HSR can effectively reduce the space-time distance (Chen and Hall, 2011). Therefore, this paper assumes that labor (L) and capital (K) can flow between cities H and W at a cost. The flow cost is a function
Consumer Choice
This paper draws on the practice of relevant scholars (Dixit and Stiglitz, 1977) and divides the consumer utility function into three parts. One is the CD utility function of the product combination produced by the industrial sector I of the pollution industry and the product produced by the industrial sector M of the cleaning industry; the second is the CD utility function of the product portfolio produced by the agricultural products and industrial sector M of the cleaning industry; the third is the CES utility function of the product portfolio produced by the industrial sector M of the cleaning industry. The representative consumer effect function is as follows:
Among them,
Assuming that the consumer’s income is e,
Consumers maximize their utility under budget constraints, which can be expressed by the following formula:
Let Eq. 3 find the partial derivatives of,
According to Eq. 4, Eq. 5, and Eq. 6, the representative consumer demand for agricultural products, products of the industrial sector M of the cleaning industry, and products of the industrial sector I of the polluting industry is further obtained as:
Combining Eq. 2 to obtain the representative consumer demand for the first product of the industrial sector M of the cleaning industry is:
Furthermore, by combining Eq. 1 and Eq. 7, the indirect utility function of representative consumers is obtained:
Producer Selection
The agricultural sector uses labor as an input element to produce agricultural products. Under the assumption that there is no cost in agricultural product trade, the prices of agricultural products in city H and city W should be equal, that is
The industrial sector M of the cleaning industry uses industrial labor to produce products. Each unit of output requires
Assuming that the number of companies in city H is n, the effective labor demand of the whole of society in the industrial sector M of the cleaning industry is:
The industrial sector I of the polluting industry uses labor, capital, and technology to produce, and its production function satisfies:
Among them,
The profit maximization of the enterprise is:
By seeking the first-order condition, we can get:
This paper assumes that part of the capital used by industrial sector I of the polluting industry comes from the capital stock of city W, and the other part comes from the capital inflow of city H. Existing literature has shown that HSR can promote the flow of capital and labor from peripheral areas to central areas, creating a “centripetal force”. Therefore, this paper refers to the practice of Xiang et al. (2020), based on the impact of the spillover effect on the cost of capital proposed by the local spillover model, and further draws on the physical model to point out that there are gravitational and repulsive forces that vary with the distance between molecules, and set method according to the parameter of the gravitational and repulsive forces in the potential function. This paper introduces the spillover effect parameter and the congestion effect parameter at the same time to describe the role of “centripetal force” and “centrifugal force” generated by traffic accessibility. The unit capital cost is set as follows:
Among them,
Since the number of enterprises in city W is
HSR, the Flow of Innovative Personnel and Green Innovation
Assuming that the initial total number of innovative personnel is 1, there are L number of innovative personnel flowing between regions. Since the flow of innovative personnel is affected by the traffic infrastructure, there is friction, so the effective labor supply is 1-
When the supply and demand of the labor market are balanced, the labor market clears, namely:
The agricultural product sector’s agricultural product prices and nominal wages in city H and city W are both 1, and output
When the industrial sector M of the cleaning industry clears the product market, the total supply is equal to the total demand, and we get:
When the industrial sector I of the polluting industry clears the product market, the total supply is equal to the total demand, and we get:
Substituting Eqs 24, 25, and Eq. 26 into Eq. 23, we get:
The flow direction of innovative personnel between city H and city W depends on the utility level in the two places. If the utility level of city W is higher than the utility level of city H, the innovators will flow from city H to city W. At this time, “centrifugal force” plays a role, on the contrary, “centripetal force” plays a role. In this paper, let Q =
Among them,
Calculate the first-order partial derivative of Q through Eq. 29, and get:
This paper continues to find the second-order partial derivative of
Among them,
HSR, Capital Flow, and Green Innovation
When society is in a long-term balance, capital is used to maintain economic growth and compensate for depreciation. The available capital at the time t is
According to Tobin’s q theory, when q
Combining Eq. 20 and let Eq. 32 find the first-order partial derivative of
When
HSR, Local Government Behavior, and Green Innovation
Further improvement of transportation infrastructure can have an impact on the positive externalities of the region. To seize the opportunities brought by HSR, local governments will often adopt strategic actions to strengthen their location advantages. With the green development concept’s further deepening, local governments no longer rely solely on “GDP,” but also take the ecological environment as a new baton. The improvement of the level of green innovation can often reduce pollution emissions and promote urban development. Therefore, as transportation accessibility improves, local governments often take action to influence the level of green innovation. According to the above, G
Furthermore, the first-order partial derivative of
H1: HSR can promote urban green innovation.
H2: HSR promotes the level of urban green innovation by promoting the flow of innovative personnel, capital flow, and influencing local government behavior.
When analyzing the impact of the innovator flow, capital flow, and local government behavior on the level of urban green innovation caused by HSR, this paper found that the impact of HSR on the level of urban green innovation showed an inverted U-shaped trend. In other words, HSR has an optimal radius for promoting the level of green innovation. Given this, this paper proposes Hypothesis 3:
H3: There is an optimal radius for the promotion of the city’s green innovation level by HSR.
Research Design
Data Source and Processing
This paper uses the panel data of China’s prefecture-level cities from 2000 to 2018, excluding samples from the Xinjiang and Tibet regions of China to avoid the effect of outliers. Among them, the HSR data mainly comes from the “China Railway Yearbook,” relevant announcements of the National Railway Administration, and the 12,306 website (the official rail ticket booking site in China). This part of the data was collated manually. Other city-level data came from the “China City Statistical Yearbook,” “China Regional Economic Statistical Yearbook,” “China Statistical Yearbook” and statistical yearbooks of various provinces and regions. Moreover, the map data of the post Ming dynasty were matched with Google maps, Chinese maps, and the patent data collected from the State Intellectual Property Office and applied in this paper.
Model Specification
For prefecture-level cities in China, whether or not to open a high-speed railway is somewhat exogenous, as the location of high-speed railway construction is mainly planned by the National Development and Reform Commission and the General Railway Corporation (formerly the Ministry of Railways) in a comprehensive manner, with less influence from the prefecture-level municipal governments. Therefore, HSR can be used as a “quasi-natural experiment”. Existing literature tended to apply the double-difference method to evaluate its effect (Fang, 2021). However, weighing on the perspective of spatial measurement, HSR can affect both the green innovation of the city and the green innovation of surrounding cities. Testing with the traditional double difference method cannot explain the spatial spillover effect brought about by HSR, and it is easy to bring about the problem of multicollinearity between dummy variables and cross-terms. Therefore, based on the traditional double difference model, this paper considers that the spatial Durbin model can not only examine the spatial lag and the impact of the spatial error term, but also examine the external influence of the spatial lag term of the independent variable, and construct a dual-difference spatial Durbin model. The model is set as follows:
In this paper, cities with high-speed rail are used as the treatment group, and cities without high-speed rail are used as the control group. Among them, i represents the city, and t represents the time,
In this paper, both geographic and economic spatial weighting matrices are used. The geographical spatial weight matrix represents the spatial interrelationship between city i and city j in terms of the inverse of the inter-city distance, while the economic spatial weight matrix represents the spatial interrelationship between city i and city j in terms of the level of economic development. The spatial weight matrix is set according to the similarity of the city per capita in GDP, and city fixed effects and year fixed effects, respectively, and are random error terms.
Variable Selection
Urban green innovation is difficult to measure directly. The present study applied two main alternative indicators: indicators of green innovation inputs and indicators of green innovation outputs. In contrast, green patent data covers sufficient information on green and non-green technologies (Keller, 2010). Based on the above, this paper takes the number of green patent applications as the core independent variable. The relevant information provided by The State Intellectual Property Office provided, such as patent application number, application date, publication number, publication date, patent name, abstract, classification number, applicant, and inventor. Compared with design patents, utility model patents and invention patents have higher technical content. For the above reasons, this paper chooses them as the research objects of innovation.
This paper is based on the “Green List of International Patent Classification1” published by the World Intellectual Property Organization (WIPO). We then matched and identified green patents through patent classification numbers, and added them to the prefecture-level city level. Using the total number of green patents (the sum of green invention patents and green utility model patents), green invention patents, and green utility model patents we measured the level of urban green innovation, denoted by Y, Y1, and Y2 respectively, and adding 1 (logarithm) (Wu et al., 2022).
For the selection of the dependent variable, we first considered that the State Railway Administration of China defines a high-speed railway as a new passenger dedicated line railway designed to run 250 km/h (including reserved) and above trains with an initial operating speed of not less than 200 km/h. The Qin-Shen High Speed Railway entered the track laying stage in 2001 as China’s first dedicated passenger line, marking the entrance of China’s railways into the era of high speed. Therefore, the period 2001–2018 was chosen as the time point for the research sample in this paper. This paper selects HSR as the dependent variable, focusing on the “stopped” state of the HSR, and judging whether to open the HSR based on whether there is an HSR station. The year when the first HSR station was opened was the HSR opening date. In view of this, this paper assigns the value of 1 to the year when the HSR of city i was opened and every subsequent year, otherwise it is 0. Taking into account that the opening time of HSR in some cities was the beginning of the year, and the opening time of HSR in other cities took place at the end of the year, this paper treats HSR as starting 1 year later.
Selection of intermediary variables: Innovative personnel flow (Lab), Considering that the flow of innovative personnel is an important factor affecting the level of green innovation, this paper focuses on measuring the flow of innovative personnel. Taking the difference in wages and house prices as attractive variables, and using a double logarithmic gravity model to measure the number of innovative personnel flowing2 (
Local government actions (IER): The behaviors of local governments in this paper mainly refer to the behaviors taken by local governments because of their emphasis on green innovation and the regional advantages of the city. Since environmental regulations are usually direct interventions by local governments in environmental protection, which can significantly affect the level of green innovation in cities, this paper uses the intensity of environmental regulations to express the importance and support of local governments on environmental protection, that is local government’s behavior to support urban green innovation. Measuring the intensity of environmental regulation by constructing a composite index of emissions of wastewater, SO2 and soot (Feng and Chen., 2018). First, according to the three types of pollutant emissions per unit economic output of each city, linear standardization is performed.
In line with existing studies (Hsu et al., 2021; Lin and Jia., 2022), the control variables selected for this paper, include: (1) the level of urban economic development (economy). This paper uses per capita GDP as an indicator to measure the level of urban economic development. (2) The level of opening to the outside world (Open), and the proportion of foreign direct investment in GDP in this paper is used as a substitute indicator. (3) The level of infrastructure construction (inf), measured by the highway mileage of prefecture-level cities (take the logarithm). (4) Industrial structure (lngdp3). This paper uses the tertiary industry’s share of GDP to measure the industrial structure. (5) Fiscal expenditure bias (fs), this paper uses the proportion of local fiscal general budgetary expenditure after deducting people’s livelihood expenditure in the local fiscal general budgetary expenditure. (6) Human capital (hc), this paper measures the number of college students per 10,000 people.
Empirical Results
Parallel Trend Test
The important premise of applying the double difference method is to satisfy that the treatment group and the control group have the same changing trend before the policy is implemented. Therefore, this paper treats the event of HSR in the forward and backward three phases respectively to test whether the parallel trend assumption is satisfied between the cities with HSR and those without HSR. The test results are reported in Figure 1. The average values of the first three phases of the HSR opening are not significant, while the average values of the three phases after HSR all have a significant positive impact. The difference between cities is more obvious.
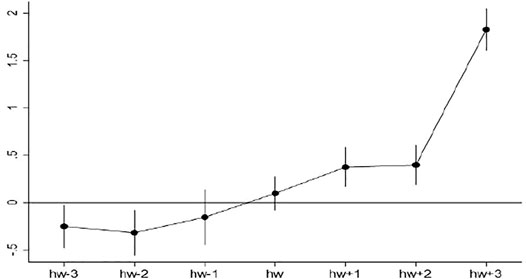
FIGURE 1. Parallel trend test.
Benchmark Regression Results
Due to spatial linkage, the level of green innovation in each city is not only affected by relevant factors in the province, but also by other provinces. Given this, this paper constructs a global Moran I index to test whether there is a correlation between variables. Through calculations, it was found that the total number of urban green patents and green utility patents were significantly positive in the Moran Index from 2000 to 2018, showing a strong spatial correlation. Green invention patents did not show spatial relevance in 2000–2007, but over time, the degree of spatial dependence gradually increased. Taking 2018 as an example, from Figures 2–4, we see that the total number of urban green patents, green invention patents, and green utility patents are all spatially correlated and that the spatial measurement model can be used to undertake further empirical tests.
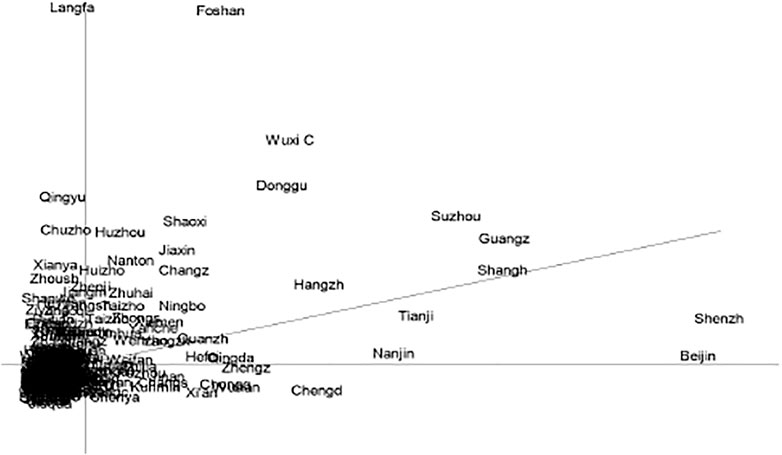
FIGURE 2. The Moran Index of the total number of green patents in 2018.
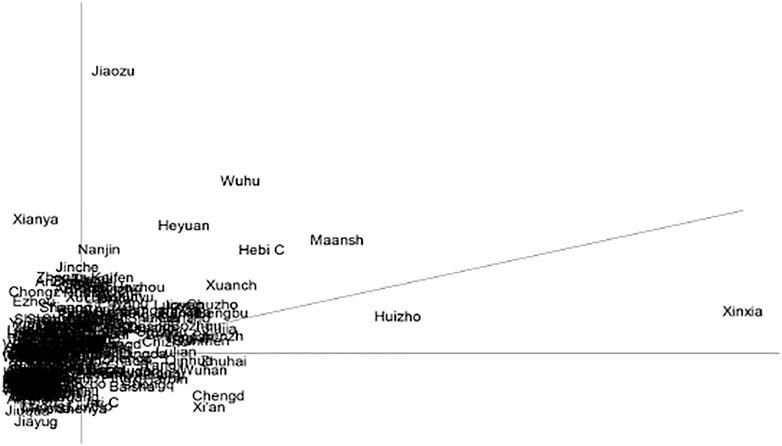
FIGURE 3. The Moran Index of green invention patents in 2018.

FIGURE 4. The Moran Index of green utility model patents in 2018.
To test the relationship between HSR and urban green innovation, this paper verifies Hypothesis 1 according to Eq. 35. All regression results are added with control variables, and time fixed effects and urban fixed effects are added. The regression results are reported in Table 1. It can be seen that after HSR, there is a significant positive relationship with the total number of urban green patents (Y), green invention patents (Y1), and green utility model patents (Y2). In terms of the degree of influence, compared with the urban green utility model patents, HSR has a stronger influence on the urban green invention patents. This paper believes that the reason is that green invention patents can effectively improve the energy-saving and emission-reduction level of enterprises. HSR stimulates the energy-saving and emission-reduction motivation of enterprises by affecting the flow of R&D factors and local government behavior, thereby significantly promoting green invention patents. In addition, it can be found from Table 1 that the spatial spillover effect of HSR is significantly positive, indicating that HSR has a significant spatial radiation effect, which can not only promote the green innovation of the city, but also enable neighboring cities to share the dividends of HSR, and achieve essential factors. Two-way flow, thus forming an obvious positive spatial spillover effect. This is also consistent with the findings of Jia Shao and Yang (2021), proving H1.
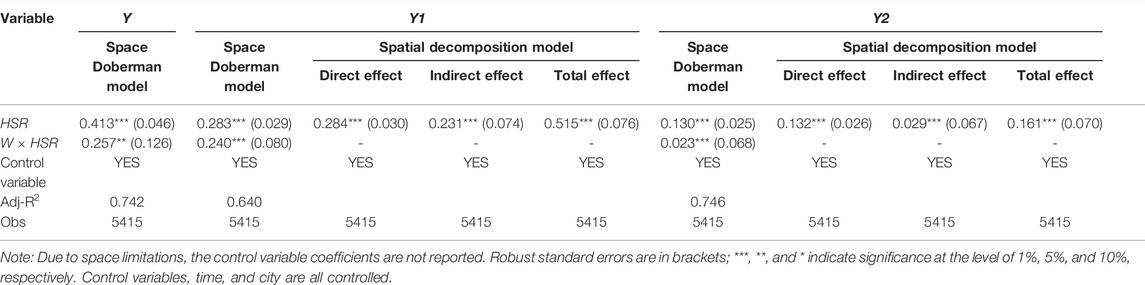
TABLE 1. Benchmark regression results.
Heterogeneity Test
Compared with non-resource-based cities, resource-based cities have more special resource endowments, which may have a differential impact on urban green innovation. To obtain more meaningful research results, we measured the resource endowment of the city by the proportion of extractive industry employees in the total population at the end of the year and divided the sample into resource-based cities and non-resource-based cities according to the median (Feng and Chen, 2018). In the end, 114 resource-based cities and 171 non-resource-based cities were used as samples for testing in this paper.
The regression results are reported in Table 2, which indicates that HSR has no significant impact on urban green innovation and that HSR does not help resource cities improve their green innovation level. For non-resource-based cities, the main effect coefficient and spatial spillover coefficient of HSR are both significantly positive, indicating that HSR can not only improve the city’s green innovation level but also have a driving effect on peripheral cities. The possible reason is that resource-based cities have a higher degree of capital abundance, and enterprises mainly rely on extracting resources to survive and have similar technical levels. In addition, green innovation requires long-term input of labor, capital, and other factors, which makes it difficult for enterprises to spontaneously carry out green innovation. Even if the HSR is open, it is difficult to stimulate green innovation. Non-resource cities usually have a higher awareness of ecological and environmental protection, and local governments are more willing to build clean cities. The technological level will also affect the competitive advantage of enterprises. Therefore, HSR can further enhance the city by promoting the flow of factors and affecting government behavior to improve the green innovation level.
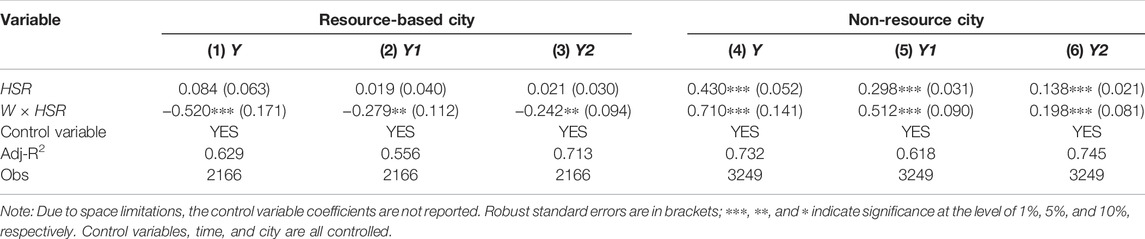
TABLE 2. Test results of heterogeneity of different resource-based cities.
Robustness Test
In view of the fact that the HSR opening event is not strictly exogenous, urban green innovation may be affected by uncontrolled variables in the model. In order to solve the problem of missing variables and reverse causality. In this paper, we refer to related scholars to select the number of Ming Dynasty post stations as the instrumental variable for robustness testing (Ganong and Shoag., 2017). On the one hand, the establishment of Ming dynasty stations and HSR ways mostly occurred in flat areas, and they could also improve traffic accessibility and play a role in connecting cities, thus satisfying the assumption of the correlation of instrumental variables. On the other hand, the establishment of the Ming dynasty station was mainly to convey military and political information, and it did not change with time. It was a strictly exogenous historical event and met the exogenous requirements of instrumental variables. The regression results are reported in Table 3, showing that the main effect and spillover effect coefficients are both significantly positive, indicating that the conclusions of this paper are robust.
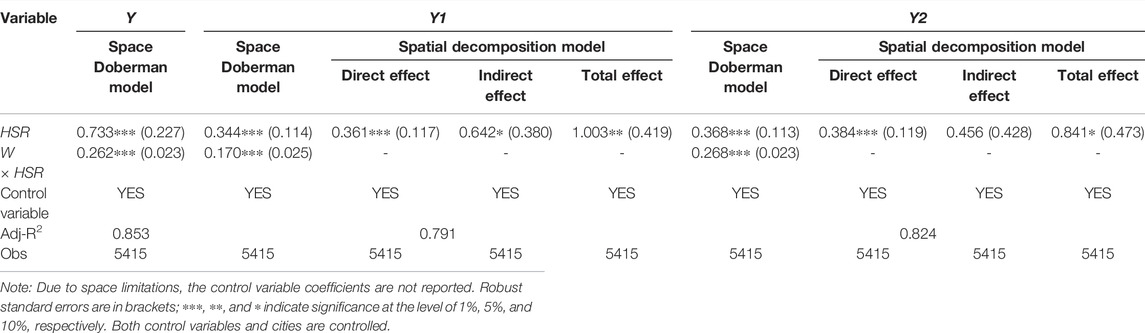
TABLE 3. Regression results of instrumental variables.
To further test that HSR opening is not affected by omitted variables, where HSR opening cities are randomly assigned 1000 times, Figure 5 shows the kernel density plot of the HSR opening coefficients obtained by this method, with the mean value of the coefficients after randomization being 0.0093, which is very close to zero compared to the baseline results, verifying that HSR opening enhances the city’s green innovation level (Alder et al., 2016).
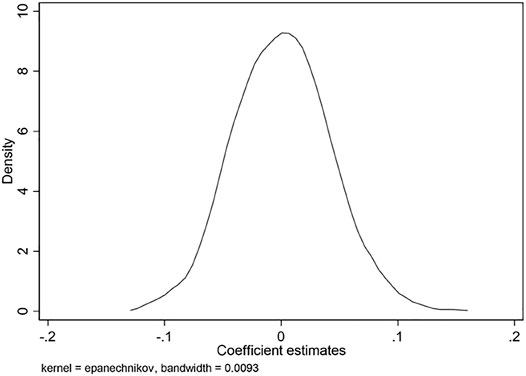
FIGURE 5. Kernel density diagram for HSR opening factor.
Further Analysis
Mechanism Inspection
To explore the mechanism of the impact of HSR on urban green innovation, we first tested the impact of HSR opening on the intermediary variables and then introduced the interaction terms between HSR opening and intermediary variables. This tested whether the intermediary variables play a role in the impact of HSR opening on urban green innovation. The model is set as follows:
Among them,
The regression results of columns (1) and (2) in Table 4, show that HSR can significantly promote the flow of innovative personnel between regions. Moreover, the interaction coefficient between the flow of innovative personnel and HSR is significantly positive at the 1% level, indicating that HSR can indeed promote mutual learning between regions by promoting the flow of innovative personnel, thereby enhancing the level of urban green innovation. The regression results of columns (3) and (4) in Table 4 show that HSR can significantly promote capital flows, and the coefficient of the interaction term is significantly positive, indicating that HSR can effectively reduce the barriers to capital flow by promoting inter-regional capital flows to have a significant positive impact on the city’s green innovation. The results of column (5) of Table 4 show that HSR has a significant positive impact on the intensity of environmental regulations, indicating that HSR has caused local governments to pay more attention to environmental protection to increase location advantages, and significantly improve the level of regional environmental regulations. The regression of column (6) shows that the interaction coefficient between the intensity of environmental regulations and HSR is significantly positive, indicating that HSR can promote the improvement of the level of urban green innovation by influencing the behavior of local governments. This proves hypothesis 2, which outlined that HSR promotes urban green innovation by promoting the flow of innovative personnel, capital flow, and influencing local government behavior.

TABLE 4. Mechanism test results.
The Optimal Radius of the Impact of HSR on Urban Green Innovation
According to the empirical results, HSR promotes the flow of innovators and capital flows, and affects local government behavior, which has a positive incentive effect on the level of urban green innovation. In the theoretical analysis part, this paper believes that there is an optimal radius for the promotion of urban green innovation by HSR, which is further tested in this section. This paper takes provincial capitals and municipalities as central cities and uses 100, 200, 300, and 400 km from the nucleus city as the radius to verify the optimal radius of the promotion of urban green innovation by HSR. This paper reports the regression results of the explained variable as the total number of green patents (Y) in Table 5. The opening of the nucleus city HSR has a significant role in promoting the level of urban green innovation, while the regression results of samples within 100 km from the nucleus city are not significant, and the regression results of samples outside 200 km from the nucleus city are significantly positive, as the distance increases, HSR has gradually weakened the promotion of urban green innovation. It shows that HSR has both a “centrifugal force” and a “centripetal force” effect on urban green innovation. The insignificant regression results of samples within 100 km from the nucleus city may be due to the “centrifugal force” effect. This also confirms that the impact of HSR on the level of green innovation has an inverted U-shaped trend that first rises and then falls, that is, there is an optimal radius for the promotion of HSR on the level of urban green innovation. Therefore, hypothesis 3 of this paper is proved. Furthermore, this paper concludes that the optimal radius of the promotion of HSR on the level of urban green innovation is 200 km.
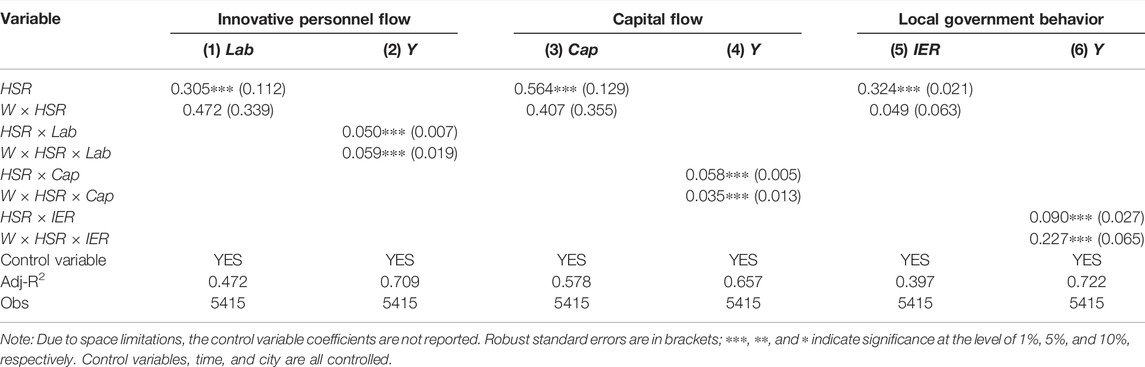
TABLE 5. Optimal radius test results.
Conclusion and Policy Implications
Based on new economic geography’s “core-periphery” model, this paper divides the industrial sector into clean and polluting industries and demonstrates the relationship between HSR and urban green innovation and the working mechanism (Acemoglu et al., 2001). Based on the city-level panel data of China’s prefecture-level cities from 2001 to 2018, the HSR was chosen as a quasi-natural experiment in this paper, and the dual-differential spatial Durbin model was selected to examine the impact and mechanism of HSR on urban green innovation. The study found that: (1) The HSR plays a significant role in promoting urban green innovation, and the spatial spillover effect is substantial. (2) Unlike previous studies, which indicate that the opening of HSR has bearing on city size and geographical location (Jia et al., 2021; Kong et al., 2021), the results of the heterogeneity test in this paper revealed that high-speed rail can enhance urban green innovation in non-resource-based cities. (3) The impact mechanism of the high-speed railway on urban green innovation mainly comes from the flow of innovative personnel and capital, and the strategy of local governments to strengthen environmental regulations to improve regional advantages. This paper also indicates that HSR shows an inverted U-shaped trend in promoting urban green innovation, and the optimal radius is 200 km from the nucleus city.
Based on these research conclusions, this paper proposes the following policy recommendations: first, continuous improvements shall be achieved in the construction of transportation infrastructure, planning for HSR construction shall be decided according to local conditions, the efficiency of resource allocation will be accelerated, and the positive role played by HSR will be improved in the level of urban green innovation. For non-resource-based cities and non-old industrial cities, it is necessary to make full use of the agglomeration of innovative personnel, capital, and policy guidance brought about by HSR, and lay out regional green innovation highlands, making HSR an important source of green innovation. For resource-based cities and old industrial cities, corresponding policies should be formulated to make full use of the radiation effect of HSR opening cities. Second, the division of labor and coordination among cities along the HSR were strengthened, and the “siphon effect” and “black under the lights” caused by HSR shall be alert. Nucleus cities should strengthen regional cooperation and effectively spread the positive effect of HSR; non-nucleus cities should actively improve transportation infrastructure and formulate differentiated urban green innovation development strategies. Third, cities without HSR should aim to boost their economy and strive for opportunities for HSR investment and construction. In addition, cities without HSR should actively integrate into the HSR “radiation circle” to form a pattern of interconnection with HSR cities, and play a positive role in the “1-h economic circle” in urban green innovation.
Data Availability Statement
The original contributions presented in the study are included in the article/Supplementary Material, further inquiries can be directed to the corresponding author.
Author Contributions
XY was a major contributor in writing the manuscript. KW was responsible for data analysis.
Funding
This project is supported by the Ministry of Education Project and the National Social Science Foundation of China (grant numbers 21FJYB033).
Conflict of Interest
The authors declare that the research was conducted in the absence of any commercial or financial relationships that could be construed as a potential conflict of interest.
Publisher’s Note
All claims expressed in this article are solely those of the authors and do not necessarily represent those of their affiliated organizations, or those of the publisher, the editors and the reviewers. Any product that may be evaluated in this article, or claim that may be made by its manufacturer, is not guaranteed or endorsed by the publisher.
Footnotes
1The list divides green patents into seven categories according to the “United Nations Framework Treaty on Climate Change”, including: transportation, waste management Category, energy conservation category, alternative energy production category, administrative supervision and design category, agriculture and forestry category, and nuclear power category.
2
3
References
Acemoglu, D., Johnson, S., and Robinson, J. A. (2001). The Colonial Origins of Comparative Development: An Empirical Investigation. Am. Econ. Rev. 91 (5), 1369–1401. doi:10.1257/aer.91.5.1369
Alder, S., Shao, L., and Zilibotti, F. (2016). Economic Reforms and Industrial Policy in a Panel of Chinese Cities. J. Econ. Growth 21 (4), 305–349. doi:10.1007/s10887-016-9131-x
Baum-Snow, N., Henderson, J. V., Turner, M. A., Zhang, Q., and Brandt, L. (2020). Does Investment in National Highways Help or Hurt Hinterland City Growth? J. Urban Econ. 115, 103124. doi:10.1016/j.jue.2018.05.001
Chandra, A., and Thompson, E. (2000). Does Public Infrastructure Affect Economic Activity?: Evidence From the Rural Interstate Highway System Regional Sci. urban Econ. 30 (4), 457–490. doi:10.1016/S0166-0462(00)00040-5
Chen, C.-L., and Hall, P. (2011). The Impacts of High-Speed Trains on British Economic Geography: a Study of the UK's InterCity 125/225 and its Effects. J. Transp. Geogr. 19 (4), 689–704. doi:10.1016/j.jtrangeo.2010.08.010
De Luca, L. M., and Atuahene-Gima, K. (2007). Market Knowledge Dimensions and Cross-Functional Collaboration: Examining the Different Routes to Product Innovation Performance. J. Mark. 71 (1), 95–112. doi:10.1509/jmkg.71.1.095
Deng, T., Gan, C., Du, H., Hu, Y., and Wang, D. (2021). Do high Speed Rail Configurations Matter to Tourist Arrivals? Empirical Evidence from China's Prefecture-Level Cities. Res. Transp. Econ. 90, 100952. doi:10.1016/j.retrec.2020.100952
Dixit, A. K., and Stiglitz, J. E. (1977). Monopolistic Competition and Optimum Product Diversity. Am. Econ. Rev. 67 (3), 297–308. stable/1831401.
Donaldson, D. (2018). Railroads of the Raj: Estimating the Impact of Transportation Infrastructure. Am. Econ. Rev. 108 (4), 899–934. doi:10.1257/aer.20101199
Dong, X., Zheng, S., and Kahn, M. E. (2020). The Role of Transportation Speed in Facilitating High Skilled Teamwork across Cities. J. Urban Econ. 115, 103212–212. doi:10.1016/j.jue.2019.103212
Fang, J. (2021). Impacts of High-Speed Rail on Urban Smog Pollution in China: A Spatial Difference-In-Difference Approach. Sci. Total Environ. 777 (10), 146153–153. doi:10.1016/j.scitotenv.2021.146153
Feng, Z., and Chen, W. (2018). Environmental Regulation, Green Innovation, and Industrial Green Development: An Empirical Analysis Based on the Spatial Durbin Model. Sustainability 10 (1), 223. doi:10.3390/su10010223
Ganong, P., and Shoag, D. (2017). Why Has Regional Income Convergence in the U.S. Declined? J. Urban Econ. 102 (7), 76–90. doi:10.1016/j.jue.2017.07.002
Hsu, C.-C., Quang-Thanh, N., Chien, F., Li, L., and Mohsin, M. (2021). Evaluating Green Innovation and Performance of Financial Development: Mediating Concerns of Environmental Regulation. Environ. Sci. Pollut. Res. 28 (40), 57386–57397. doi:10.1007/s11356-021-14499-w
Huang, Y., Jiang, C., Wang, K., Xiao, Y., and Zhang, A. (2021). Public-private Partnership in High-Speed Rail Financing: Case of Uncertain Regional Economic Spillovers in China. Transp. Policy 106, 64–75. doi:10.1016/j.tranpol.2021.03.016
Jia, R., Shao, S., and Yang, L. (2021). High-speed Rail and CO2 Emissions in Urban China: A Spatial Difference-In-Differences Approach. Energy Econ. 99, 105271–271. doi:10.1016/j.eneco.2021.105271
Keller, W. (2010). International Trade, Foreign Direct Investment, and Technology Spillovers. Handb. Econ. innovation 2, 793–829. doi:10.1016/S0169-7218(10)02003-4
Kong, Q., Shen, C., Li, R., and Wong, Z. (2021). High-speed Railway Opening and Urban Green Productivity in the Post-COVID-19: Evidence from Green Finance. Glob. Finance J. 49, 100645. doi:10.1016/j.gfj.2021.100645
Krugman, P. (1993). On the Number and Location of Cities. Eur. Econ. Rev. 37 (2-3), 293–298. doi:10.1016/0014-2921(93)90017-5
Li, H., Dong, X., Jiang, Q., and Dong, K. (2021). Policy Analysis for High-Speed Rail in China: Evolution, Evaluation, and Expectation. Transp. Policy 106, 37–53. doi:10.1016/j.tranpol.2021.03.019
Lin, B., and Jia, H. (2022). Does the Development of China's High-Speed Rail Improve the Total-Factor Carbon Productivity of Cities? Transp. Res. Part D Transp. Environ. 105, 103230. doi:10.1016/j.trd.2022.103230
Liu, Y., Zhu, J., Li, E. Y., Meng, Z., and Song, Y. (2020). Environmental Regulation, Green Technological Innovation, and Eco-Efficiency: The Case of Yangtze River Economic Belt in China. Technol. Forecast. Soc. Change 155, 119993. doi:10.1016/j.techfore.2020.119993
Lu, J., and Li, H. (2022). Can High-Speed Rail Improve Enterprise Capacity Utilization? A Perspective of Supply Side and Demand Side. Transp. Policy 115, 152–163. doi:10.1016/j.tranpol.2021.11.002
Magazzino, C., and Mele, M. (2021). On the Relationship between Transportation Infrastructure and Economic Development in China. Res. Transp. Econ. 88, 100947. doi:10.1016/j.retrec.2020.100947
Mele, M., and Magazzino, C. (2020). A Machine Learning Analysis of the Relationship Among Iron and Steel Industries, Air Pollution, and Economic Growth in China. J. Clean. Prod. 277, 123293. doi:10.1016/j.jclepro.2020.123293
Qi, G., Jia, Y., and Zou, H. (2021). Is Institutional Pressure the Mother of Green Innovation? Examining the Moderating Effect of Absorptive Capacity. J. Clean. Prod. 278, 123957. doi:10.1016/j.jclepro.2020.123957
Qin, Y. (2017). 'No County Left behind?' the Distributional Impact of High-Speed Rail Upgrades in China. J. Econ. Geogr. 17 (3), lbw013–520. doi:10.1093/jeg/lbw013
Song, M., Zhang, G., Zeng, W., Liu, J., and Fang, K. (2016). Railway Transportation and Environmental Efficiency in China. Transp. Res. Part D Transp. Environ. 48, 488–498. doi:10.1016/j.trd.2015.07.003
Udemba, E. N., Magazzino, C., and Bekun, F. V. (2020). Modeling the Nexus between Pollutant Emission, Energy Consumption, Foreign Direct Investment, and Economic Growth: New Insights from China. Environ. Sci. Pollut. Res. 27 (15), 17831–17842. doi:10.1007/s11356-020-08180-x
Wang, X., Xie, Z., Zhang, X., and Huang, Y. (2018). Roads to Innovation: Firm-Level Evidence from People's Republic of China (PRC). China Econ. Rev. 49, 154–170. doi:10.1016/j.chieco.2017.12.012
Wang, Y., Cao, G., Yan, Y., and Wang, J. (2022). Does High-Speed Rail Stimulate Cross-City Technological Innovation Collaboration? Evidence from China. Transp. Policy 116, 119–131. doi:10.1016/j.tranpol.2021.11.024
Wu, G., Xu, Q., Niu, X., and Tao, L. (2022). How Does Government Policy Improve Green Technology Innovation: An Empirical Study in China. Front. Environ. Sci. 9. doi:10.3389/fenvs.2021.799794
Keywords: high-speed rail, urban green innovation, optimal radius, dual-differential spatial durbin model, theoretical models
Citation: Yu X and Wan K (2022) High-Speed Rail Opening and Green Innovation—Evidence From China. Front. Environ. Sci. 10:901879. doi: 10.3389/fenvs.2022.901879
Received: 22 March 2022; Accepted: 18 April 2022;
Published: 23 June 2022.
Edited by:
Cosimo Magazzino, Roma Tre University, ItalyCopyright © 2022 Yu and Wan. This is an open-access article distributed under the terms of the Creative Commons Attribution License (CC BY). The use, distribution or reproduction in other forums is permitted, provided the original author(s) and the copyright owner(s) are credited and that the original publication in this journal is cited, in accordance with accepted academic practice. No use, distribution or reproduction is permitted which does not comply with these terms.
*Correspondence: Kai Wan, wankai@shu.edu.cn