Analysis of the impact of investor sentiment on stock price using the latent dirichlet allocation topic model
 Meilan Chen1
  Kashif Abbass
- 1School of International Business, Guangdong University of Finance and Economics, Guangzhou, China
- 2Riphah School of Business and Management, Riphah International University, Lahore, Pakistan
Investor sentiment has always been an active research topic in finance. In recent years, text mining, machine learning and sentiment analysis have been very fruitful, and researchers can extract valuable information from social platforms more promptly and accurately. Unsupervised learning avoids the subjective human selection of data while reducing the workload. This paper uses the primary model for the unsupervised learning total probability generative model LDA (Latent Dirichlet Allocation). Natural language processing and word-splitting tools empirically analyze text data from a well-known financial and stock information website. An attempt is made to explore the correlation with stock excess return. The significant findings are as follows. First, investor sentiment classified by theme is positively correlated with excess return. Second, different themes have different degrees of influence, with “broad market sentiment” affecting the short term, corporate development involving a long time, and “corporate dividends” affecting both. Third, there is an asymmetric effect of investor sentiment on excess return.
1 Introduction
In finance research, studies on investor sentiment are carried out by selecting proxy indicators such as volatility index (VIX), initial public offering (IPO) number, etc., but fail to make use of a large number of text data generated in the interaction of investors in the stock bulletin board system (BBS), which reflects investor sentiment and affect the final investment decision to some extent (Zhang and Zhang, 2021, pp.143-150). However, there is a large amount of noise in text data and a massive workload of labelling investor sentiment.
In recent years, significant achievements have been made in text mining, machine learning and sentiment analysis, and considerable progress has been achieved in natural language processing (NLP), which enables researchers to extract valuable information from social platforms more quickly and accurately (Yan et al., 2017, pp.82-87). In the past, we need to label whether investors are optimistic or not manually. Still, now we can use unsupervised learning to replace and reduce the workload while avoiding the subjective selection of data. Based on Twitter, Bollen and Mao (Bollen and Mao, 2011, pp.91-94) and Sprenger et al. (2014, pp.926-957) find that there are correlations between tweet sentiment and stock returns, information and trading volume, as well as divergence and volatility. Gabrovšek et al. (2017) find from Twitter that the post-closing announcement can well reflect the stock trend of the next day. Bayesian network is established from the terms defined in tweets, and the wrapper method is used to select features, analyze and extract emotions (Al Nasseri et al., 2014, pp.13-24). Long (Long, 2021, pp.59-61) and (Zhang and Wang. 2013, pp.142-155) construct the sentiment index to study the correlation between the fluctuation of investor sentiment and the price fluctuation of the Shanghai stock index by and prove that investor sentiment bears a significant positive impact on market return and volatility. Guan et al. (2020, pp.58-68) (M25) also constructed the sentiment index from the stock BBS to find that investor sentiment is related to the stock’s volatility and the stock price crash risk.
Under the context of “big data”, how to better use the information of Internet platforms to mine investor sentiment and even trading behaviour in the technology development process is worth further research. However, there are many obstacles when analyzing online text data, such as large volume, short text and low signal-to-noise ratio (SNR). Few studies have applied topic models that can extract hidden information to investor sentiment analysis. Moreover, while analyzing the correlation between investor sentiment and stock return, the existing research often fails to probe into the source of stock excess return. Since the basic information of the company serves as an essential factor leading to the change in stock price, this paper aims to extract the implicit information from investors’ posts and filter out a large number of noises unrelated to stock price, such as complaints, to find out the information that primarily affects the trend of stock prices, explore the correlation between investor sentiment and stock prices, and further study the asymmetric effect, to put forward a new way to predict the stock price.
In this paper, we use data from China. The total market value of China’s stock market will have ranked second in the world in terms of market size by 2021, with the number of accounts opened in the A-share market up to 19,708,500. According to the survey reported on the investment situation of individual fund investors, issued by the Securities Investment Fund Association, mobile phone and other mobile terminal transactions have risen to 70.9%. And 61.0% of investors have made their analysis and decision, 13.5% of them invest just following their friends, and 17.2% of them invest according to the recommendations of online experts. The securities investment market was becoming younger and dominated by retail investors, and it is imperative to study the investment behaviour of small investors. Compared with institutional investors, the bounded rational behaviour of retail investors, such as the disposition effect or overconfidence, is the research scope of behavioural finance.
Due to non-standard information disclosure situations, and with the development of communication networks and the popularity of mobile terminals, there are many investor forums, such as Eastmoney and Hexun, through which the investors can check a large number of investment suggestions from users, as well as the sharing and exchange of trading ideas. Therefore, investors resort to professional investor forums such as stock BBS (bulletin board system) to reduce information asymmetry.
However, due to the low threshold of Internet information release, there is some false information about the stock market. The spread of false news leads to the stock market’s violent fluctuation and damages investors’ confidence. At the same time, due to the herding effect of Internet news, the irrational negative information will significantly affect investors’ sentiment and cause stock market turbulence. [9] Therefore, based on the healthy development of the stock market and the protection of retail investors, the research on investor sentiment has particular practical significance.
This paper first introduces relevant theories and research methods in investor sentiment. Then presents the development history and mainstream text mining models, analyzing the advantages and disadvantages of various models. It has adopted the unsupervised learning full probability generation model (LDA) as the primary model. It uses natural language processing and word segmentation tools to analyse East Money Stock BBS’s text data empirically. This paper attempts to apply the classic topic model LDA to the BBS text analysis enriches the method by using stock market information to analyze investor sentiment and explores the correlation between LDA and excess return.
The research content of the text is mainly divided into six parts. The first section proceeds with the introduction, including the development background and practical role of the research topic, which expounds on the rationality and innovation of the research topic and determines the research ideas and methods of this paper. The second section is the literature review, which reviews and sorts out the related financial knowledge, natural language processing and dynamic analysis technology involved in this paper, trying to find out the shortcomings of the existing research. The third to the fourth section is empirical research, in which we construct the regression equation between the stock excess return rate and investor sentiment, test the correlation between them, and further explore the explanation and robustness analysis of asymmetric effect and investor sentiment on the company’s excess earnings. The fifth section is the conclusion and the outlook for further research. The last section is the policy suggestions.
2 Literature review
Our research is mainly related to two categories of the literature, which contain articles about investor sentiment and text analysis methods. In this section, we will review research on these two subjects and try to comment on them.
2.1 Investor sentiment
Securities market pricing is the core issue of finance. Rutledge (1976, pp.118-120) put forward the classical pricing theory in 1970 that the market was composed of rational people. Basic information was the most crucial information driving asset prices. The efficient market hypothesis believed that all information had been reflected in the securities’ price or market value. The current price of stocks or bonds was always traded at its fair value (Rutledge, 1976, pp.118-120). Both empirically and theoretically, researchers question the efficient market hypothesis. In the actual market, the information asymmetry and speed inconsistency lead to the information received by each investor in different times and spaces, and people’s feedback is inconsistent due to individual differences. It is worth noting that investors’ investment behaviour is inevitably dominated by irrationality, which is interpreted as cognitive bias by behavioural finance. De Long et al. (1990, pp.703-738) introduced investor sentiment into asset pricing. They argued that the unpredictability of noise traders’ sentiment would produce risks in asset prices and prevent rational arbitrageurs from actively short-selling. Therefore, the price may deviate significantly from the fundamental values without risk. In the language of modern behavioural finance, arbitrage limits exist (Baker and Wurgler, 2007, pp.129-152).
Investors’ bounded rationality explains many market anomalies. Behavioural economists attribute anomalies in financial markets to human errors such as cognitive bias, overreaction, representative bias and information bias. Irrational investors have become a new research direction. studied the volatility of investors and stock prices and found a significant correlation between investor sentiment and stock prices. (Zhou, 2018, pp.239-259) proved that sentiment could explain the returns of those stocks that were difficult to value and had high arbitrage costs, such as unprofitable stocks, non-dividend stocks, stocks with excessive growth and stocks in distress. So far, investor sentiment has become an indicator of asset pricing.
Investor sentiment refers to investors’ general attitude towards the market’s expected price development. Such expectation is formed by the superposition of fundamental and technical factors, including historical price information, macro-economy, seasonal elements, and significant events. Moreover, due to the cognitive bias of investors’ irrational behaviour, there will be some deviation in investors’ expectations, and investor sentiment indicates the extent to which asset values deviate from their economic fundamentals (Zhou, 2018, pp.239-259). Investor sentiment is usually defined in financial literature as the tendency to take risks and speculate or the overall optimism or pessimism towards risky assets. Both attitudes are based on investors’ beliefs about future cash flows and risks, which are not borne out by existing facts. The role of sentiment in forming risk attitudes and financial decisions is widely documented in the literature. In the existing literature, the primary sources of investor sentiment are financial market measurement, sentiment indicators based on a questionnaire survey, Internet search behaviour, social platform data analysis, and non-economic factors.
The observable economic variables in the stock market are used to measure investor sentiment. In the mainstream literature, it is considered that closed-end fund discount (FDP), trading volume, IPO volume (IPON), initial return (IPOR), share financing proportion (PDND), and dividend premium (SRate) can be used as intermediary variables. Due to the nature of a closed-end fund, when its price deviates from its value, it can be used as a proxy indicator to measure investor sentiment (Xue, 2005, pp.14-17). Baker and Wurgler (2006, pp.1645-1680) found that a high proportion of stock financing predicted lower market returns. Gervais and others believed that the trading volume could well reflect investor sentiment, and the trading volume of a specific stock would lead to its price appreciation.
IPO initial return (IPOR) is a gauge of investor enthusiasm. Dividend premium (Srate) refers to the logarithmic difference between the average price/book ratio of the payers and the non-payers. Compared with non-payers, the scale, profit and growth opportunities of payors are more significant, and dividend premiums may represent the demand and optimism of people. Therefore, based on a single variable, scholars began to coordinate economic indicators and establish comprehensive indicators; Baker and Wurgler (2006, pp.1645-1680) integrated the six hands mentioned above to build the sentiment indicators, WEN et al. adopted the principal component analysis and concluded that the optimistic investors had a more significant effect on the stock returns than the pessimistic investors. Whaley (2000, pp.12-17) also proposed the Chicago Options Exchange Volatility Index (VIX) as another sentiment indicator. Then many alternative indicators, including CSFB and AMSI, can measure investor sentiment to a certain extent based on the instantaneity and availability of trading behaviour. However, the indicators based on trading behaviour are the equilibrium result of multiple market forces, which not only reflect investor sentiment.
Investor sentiment is not only the proxy indicator but also the sentiment indicator based on the market survey, which is usually regarded as a barometer of the future market. Some well-known sentiment indicators abroad include the consumer confidence index of the University of Michigan, the American Association of Individual Investors AAII, etc. In contrast, China’s more prominent sentiment indicators include the CCTV index, friendliness index, Haodan index, etc. The above survey-based sentiment indicators are good predictors in the financial market (Brown and Cliff, 2005, pp.405-440). But according to Da et al. (2015, pp.1-32), there existed a considerable lag since most of the data sets directly based on the market survey questionnaire were released weekly or monthly, while other alternative indicators of investor sentiment could be used daily. Secondly, respondents did not have enough motivation to answer these questions thoughtfully and honestly in the survey (Singer, 2002, pp.163-177); at the same time, the results obtained were also biased due to the person willing to be interviewed being usually more positive and optimistic. In summary, the sentiment indicators based on the survey are helpful for prediction, but they are limited to a certain extent because of their defects.
In 2004, many scholars began to pay attention to the Internet search behaviour of households as a vital source of investor sentiment. Many authors demonstrated the effectiveness of such data in predicting investor attention and market returns (Da et al., 2015, pp.1-32). Most studies use Google Trends (GT) service to extract search volume data and investigate investor sentiment. The prediction ability of GT data for the two most popular volatility indicators: high-frequency volatility (RV) and Exchange Volatility Index (VIX), was studied. Both studies reported a positive and significant correlation between Internet search behaviour data and volatility indicators. Kristoufek (2013, pp.1-5) proposed a method of using Google Trends to search for portfolio diversification, which showed that the search query index was related to the risk of stocks. A weekly sentiment indicator was constructed relying on the Google search behaviour of households. (Gao et al., 2020, pp.549-580) studied how investor sentiment affected stocks around the world, adopted the results of competitive sports in the test, and ultimately showed that sentiment indicators were a reverse predictor of market returns at the national level. Internet search behaviour is a relatively new and promising indicator of investor sentiment. This type of sentiment data does not require additional information from other sources and can be used independently for scientific research.
With the rise of the Internet, online social networking has become a new way of information, sentiment and opinion. Therefore, text mining and sentiment analysis algorithms are used to extract information about investor sentiment from natural language text data of the Internet. (Zhang and Zhang, 2021, pp.143-150) believe that the results of the data extracted from social media show that investor sentiment has an impact on the stock market and avoids the disadvantages of traditional information collection, such as lag, distortion and high investment, compared with the information sources such as questionnaires and interview records.
However, there is a tremendous amount of text data on social media, which has the advantages of authenticity, rapid response and solid social interaction (Zhang and Zhang, 2021, pp.143-150). Bollen and Mao (2011, pp.91-94) find that the sentiment indicators extracted from social media have a better prediction effect by analyzing and comparing traditional investor sentiment indicators and indicators formed by social media data. The number of “positive” and “negative” words in each related tweet is calculated to construct a composite indicator based on these data.
Most early studies used dictionaries to analyze sentiment, and the analysis was based on the preset sentiment dictionary according to data collection. (Renault, 2017, pp.25-40) built a dictionary based on the 60,000,000.00 posts on Twitter from 2012 to 2016, and (Yao et al., 2021, pp.26-46) constructed a new Chinese sentiment dictionary through reorganization and deep learning algorithm and verified its sentiment indicators through horizontal comparison among the formal language dictionary, LM intonation dictionary, informal language dictionary, How Net dictionary, etc., and indicates a significant effect on the stock price crash risk prediction of listed companies.
Extracting investor sentiment from social media has been widely used in stock prediction. However, due to the inconsistency of sample data and the model used, the conclusions obtained are not consistent. Therefore, the research focuses on how to construct investor sentiment indicators. Many similar pieces of literature use direct or indirect indicators to create investor sentiment. Social media users may not be investors in the stock market. Online stock BBS has become a robust investment platform for releasing relevant and valuable UGC data, which is more appropriate to use the user information captured by the investment forum (Al Nasseri et al., 2014, pp.13-24).
Mai and Pukthuanthong (2021) adopt a semi-supervised LDA approach to extract economic narratives from New York Times articles by providing seed words for each topic to guide the formation of issues towards the predefined themes. Roberts et al. (2020) show that Structure Topic Model (STM) has the form of Multinomial Inverse Regression (MNIR) conditional on the latent variable, and both approaches may yield qualitatively similar findings (Besbris et al., 2021). Ji and Han, 2022 employ a structural topic modelling approach to extract topical contents of investor sentiment across multiple finance-specific factors. Results show that investors with different profiles and trading preferences tend to discuss financial markets with heterogeneous beliefs, leading to divergent opinions. And a large number of studies show that investor sentiment on social media is better at predicting contemporaneous stock market returns (Lachana and Schroder, 2022).
In recent years, the combination of the deep learning method and sentiment analysis model for stock price predicting and the use of machine learning classification algorithms to construct investor sentiment indicators are the latest trends. Jing et al. (2021, p.178) propose a hybrid research model, which uses both long-term and short-term memory (LSTM) neural network method to analyze the technical indicators and sentiment analysis results from the stock market, and applies the convolution neural network model to classify the hidden sentiment of investors, achieving better performance in the classification of investor sentiment. At present, support vector machine (SVM), K nearest neighbour (KNN) and Naive Bayes (NB) are widely used. Tsukioka et al. (2018, pp.205-217) use text mining and SVM to extract the pre-IPO sentiment of investors for each listed company from the message boards of Yahoo Japan Finance. Yang et al. (2016, pp.143-158) classify and extract the investor sentiment from more than 900000 posts of companies listed on the GEM in stock BBS of East Money with the help of the KNN algorithm.
The number of investors in China’s domestic stock market is increasing, and the investment style is more diversified. To understand the market rules more comprehensively and accurately and to give an appropriate explanation for the phenomenon that traditional financial theory fails to explain, behavioural finance explains the financial market anomalies by assuming that investors are not entirely rational. For example, investors’ decision-making bias occurs due to cognitive bias and overconfidence. The traditional methods all have such limitations mentioned above. Because the number is large enough, the information released by individual investors on social media will form “group wisdom” and affect the price trend (Chen et al., 2014, pp.1367-1403).
2.2 Text analysis technology
Text corpus modelling in academic research aims to maintain the fundamental statistical relations while efficiently processing large corpus. Large-scale text analysis usually includes dimension reduction, corpus information retrieval, natural language processing, disambiguation, document clustering, co-reference, object extraction, preprocessing and sentiment analysis. Researchers in the field of information retrieval (IR), Baeza-Yates and Ribeiro-Neto. (1999), have made significant progress in this field. The primary method researchers propose in the information retrieval of text corpus is to simplify each document into a real number vector. Each natural number vector represents the counting ratio of words. In the popular tf-idf model, Salton and McGill (1983) select “word” or “term” as the basic unit of each document in the text set and count the occurrence times of each word. After proper standardization, this word frequency count is compared with the reverse document frequency count, which measures the number of occurrences of a word across the corpus (usually expressed in logarithmic form and then appropriately normalized again). The result is a matrix X of document words, including the TF IDF value of each document in the corpus. The scheme reduces the composition of any length into a fixed number list. TF algorithm measures the expression ability of word pairs. IDF refers to the ability to distinguish documents by statistical words. Tf-idf is usually used to filter common words and retain important text, which is the principle of setting stop words.
Although the TF-IDF model has some advantages in the fundamental recognition of document words in the set, this method fails to reduce the description length of documents. It leads to the loss of statistical structure within or between documents. To address these shortcomings, Deerwester et al. (1990, pp.391-407) put forward several other dimension reduction techniques, the most famous of which is the latent semantic index (LSI) (Deerwester et al., 1990, pp.391-407). LSI is based on the singular value decomposition (SVD) method to obtain text topics and performs well in compressing the large-scale corpus.
However, SVD calculation is time-consuming, making it very difficult to do SVD for high-dimensional matrices. Moreover, the selection of topics dramatically impacts the results, and it is not a complete probability generation model.
To study LSI’s relative advantages and disadvantages, Hofmann. (1999) proposes the PLSI model, also known as the aspect model, as an alternative to LSI. PLSI uses hidden variables to represent topics for topic analysis, which belongs to the unsupervised learning method. In this model, the text is represented as topic distribution, and the matter is described as word distribution. Text is generated by assuming the probability distribution of the topic itself and calculating the conditional probability distribution of text and word. The core idea of probabilistic LSI is to find the potential issues contained in the text.
However, PLSI only provides a probabilistic generation model at the topic level but not at the document level. It makes it necessary to determine the text corpus before random sampling, leading to several problems. Firstly, with the increase in the size of the text corpus and the number of topics, the number of parameters will increase linearly with the corpus size, leading to overfitting; Secondly, documents outside the training set cannot be assigned with an accurate probability distribution. To solve the problem of PLSI, Blei et al. (2003, pp.993-1022) introduce the Dirichlet prior distribution at the document level based on PLSA and propose the LDA model. An effective approximate reasoning technique based on the variation method and an EM algorithm is submitted in text modelling for empirical Bayesian parameter estimation (Blei et al., 2003, pp.993-1022).
Compared with PLSA, LDA can better eliminate word ambiguity and assign documents to topics more accurately. Secondly, it solves the problem that PLSA is prone to overfitting. Moreover, LDA Algorithm is easier to use the Map Reduce method in a computer cluster to expand the data set. In a word, LDA can extract hidden information from the text and quantify text more accurately.
LDA and PLSA are both unsupervised learning and provide probabilistic generation models at the document and topic levels, which have become the mainstream text modelling methods. Rosen-ZVI et al. (2012) propose a multi-granularity LDA model (MG-LDA) to extract the features of the evaluated objects from the online user reviews, which adopts the clustering algorithm to remove the part of the topics commented on by the users; Unlike the traditional topic model, which evaluates the global characteristics of an object and cannot be generalized, requiring supervised learning with poor explicability.
To make the topic model both highly refined and unsupervised in topic learning, scholars have constantly been improving the topic model. Generally speaking, there are two ways to deal with the mixed model of topic sentiment. The first is no conflict between the topic word and the sentiment word. A word can be both a topic word and a sentiment word, such as ASUM Model (Jo and Oh, 2011, pp.815-824) and JST Model (Lin et al., 2011, pp.915-824). The second is separation, a word belonging to either a sentimental or topic word, such as the TSM Model (Mei et al., 2007, pp.171-180). TSM model uses the improved HMM model to train the topic and sentiment models.
Although the research shows that the TSM model performs well in the weblog analysis and has certain portability, it does not conform to the traditional semantic background for separate modelling of the topic and sentimental words. Sun et al. (2013, pp.102-108) put forward a topic sentiment hybrid model (UTSU model) that simultaneously samples topic words and sentiment words, which belongs to unsupervised learning. UTSU assumes that one sentence expresses one kind of sentiment, and the words in the sentence can belong to different topics. This method inherits the traditional LDA model to sample topic words. Although it only accounts for positive and negative sentiment, it is more consistent with the semantic background and perfectly unifies the sampling of topic words and sentiment words.
According to the existing literature, there are a large number of proxy indicators of investor sentiment. With the development of research, it has become a new direction to extract sentiment indicators from online text data, which has the advantages of authenticity and rapid response. Many studies have applied unsupervised learning to topic models, but few have used the LDA model to analyze the sentiment of stock BBS texts. This paper attempts to use the classical text analysis model to study the relevance distribution of sentences and integrate sentences’ inclination, degree and relevance to obtain the sentiment of sentences and eventually get the investors’ propensity. Based on the model of Chen et al. (Chen et al., 2014, pp.1367-1403), it studies the relationship between excess return rate and investor sentiment in the United States and further explores the asymmetric effect of the market (Jin and Li, 2017, pp.157-173).
3 Research method
3.1 Theoretic model
According to the above sentimental analysis results, and regarding Jin Dehuan et al., this paper constructs the following sentiment indicators by using the sentiment of the posts in each topic in the previous 20 days.
Where Posi, Negi, Neui correspond to the number of positive, negative and neutral sentiment posts, respectively, in the previous 20 days. This article takes Emoi1 and Emoi2 as the main explanatory variables. The larger the Emoi1 and Emoi2 are, the more optimistic the investors are.
Concerning the method proposed by Blei, Ng and Jordan [34], the LDA model is established based on the variation inference EM algorithm. The number of topics is an essential parameter in developing the LDA model, and Blei, Ng and Jordan [34] adopted the method based on perplexity to determine the number of topics. The calculation formula of Perplexity is:
3.2 Empirical model
To explore the influence of investor sentiment indicators on stock excess return, this paper builds the following regression models:
Where one-month cumulative excess return rate
3.3 Overview of the research process
The research process of this paper is mainly divided into three parts. The first part establishes the topic classification model based on LDA to classify the text data. The second part is to quantitatively analyze the sentiment of investors’ posts and comments on stock BBS reviews. The third part is to construct sentiment indicators and the excess return rate to analyze the correlation with the earnings information of the company.
In terms of establishing the LDA model, the python crawler was used to crawl 450,000 posts from East Money stock BBS, covering the period from 2018 to March 2022. To solve the poor training of short text, the data of “posts and comments” crawled to be merged into long text, and pre-processing, such as stop words, is set simultaneously. The Chinese word segmentation package jieba is used for text segmentation, and the corpus formed after word segmentation is transferred into the LDA topic model. The parameter optimization tool of the Python machine learning library scikit-learn is adopted to find the LDA topic model. According to the optimal number of topics in the word database, relevant parameters are set and put into the LDA model to perform training to obtain the result of text topic classification.
In terms of the quantitative analysis of the sentiment of the posts on stock BBS, with the help of the snowmelt sentiment analysis library of python, the emotional tendency of the whole article can be obtained by summarizing the sentence scores. Then, combining the vibrant results with the topic classification results, the emotional disposition of each topic was accepted. Then the group sentiment indicators are constructed with the theme as the unit to obtain the sentiment indicators sequence of all issues.
In correlation analysis, after adding a certain number of control variables, the panel regression is made between the sentiment indicators by classification by topic and the excess stock return rate to distinguish the fixed effect from the random effect. Then the regression results are compared with those of the sentiment indicators without topic classification to verify the effectiveness of the theme classification. Finally, it further explores the asymmetric effect of investor sentiment on the excess stock return rate and the explanatory power of extra earnings.
4 Variables and data
4.1 Variables description
4.1.1 Dependent variables
Excess returns (Areti, t, t+20 and Areti, t, t+60), As all the samples are the constituent stocks of the Shanghai Stock Exchange index 50, this paper selects the Shanghai Stock Exchange index 50 as the benchmark index. The daily excess return is defined as the daily return rate of individual stock minus the return rate of the Shanghai Stock index 50. By adding up the daily excess return, the cumulative excess return rate of one month is obtained as Areti,t,t+20, and the cumulative excess return rate of 3 months as Areti,t,t+60, which are taken as the main explanatory variables of the model in this paper.
4.1.2 Independent variables
Sentiment indicators (Emo1 and Emo2), as presented above, this paper constructs the following sentiment indicators (Emo1 and Emo2) by using the sentiment of the posts in each topic in the previous 20 days. This article takes Emoi1 and Emoi2 as the main explanatory variables. The larger the Emoi1 and Emoi2 are, the more optimistic the investors are.
4.1.3 Control variables
In addition to the constructed sentiment indicators, this paper adds some control variables to the regression model, such as volatility, market value, monthly report number of stocks, the book-to-market ratio, cumulative excess return in the past 2 days, cumulative excess return and liquidity in the past 3–60 days, regarding the practice of (Chen et al., 2014, pp.1367-1403). The definition of variables is shown in Table 1.
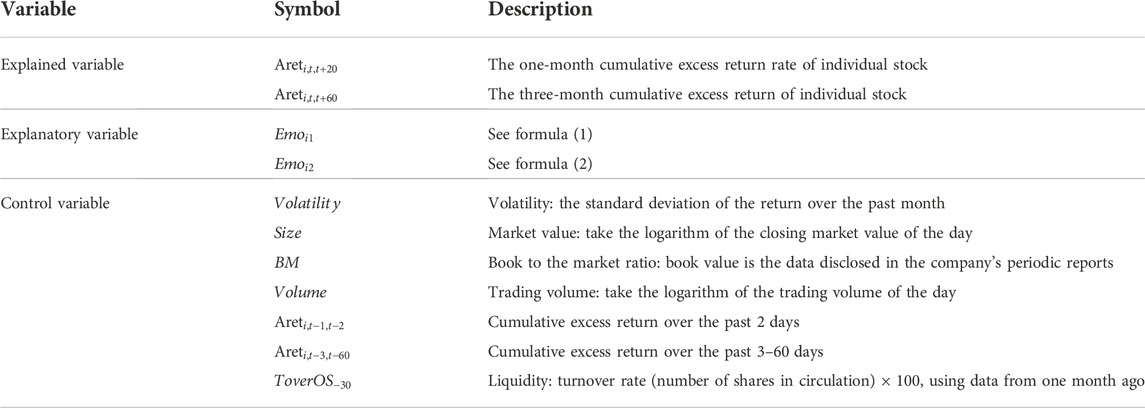
TABLE 1. Description1 of variable definition1.
4.2 Data description and processing
4.2.1 Data sources
First, the text data selected in this paper comes from East Money. com. The stock samples randomly choose six Shanghai Stock Exchange 50 Index stocks. The posts from the first day of listing the stock are crawled for each stock. On average, each stock contains nearly 120000 posts. Through Chinese word segmentation, remove stop words, remove irrelevant data, and other data preprocessing methods. Then, the LDA topic model is used to train and classify all the crawled text data. However, studies have shown that when the input text length of the LDA model is too short due to the small number of words in the document, the model is prone to bias in terms of word correlation discrimination, and the training effect of the model is affected. On the stock BBS, there is a certain degree of correlation between the content and comments of the same post; the discussion under the same position may only express opinions on specific content. It is imported into the LDA model for training as a complete document. The document samples the topic words as a unit to get the topic words of each topic and the probability that each document belongs to a specific topic.
Next, with the help of Baidu AI open platform natural language processing technology and python Chinese natural language processing module snownlp, sentiment analysis of each document is carried out by sentence unit. Firstly, the sentiment tendency of each sentence is obtained, and the sentence scores of the whole document are summed up to get the sentimental tendency of a document. Then, the sentimental tendency of all documents on the day is summed up to get the sentimental tendency of investors on that day. Then, combined with the classification results of the LDA topic model, the sentimental tendency of documents under each topic is obtained. After summing up the sentimental scores every day, the paper takes the excess stock return rate as the dependent variable, the sentimental tendency of each topic as the independent variable, and adds a certain number of control variables to establish a regression model and further explores the asymmetric effect of investor sentiment on the stock price and the explanation effect on the over expected earnings.
Through the regression analysis, we get the topic sentiment and the valuable information contained in the investor sentiment and compare it with the regression model, which directly uses the sentiment tendency without topic classification as the independent variable and analyzes the necessity of adding the topic model.
4.2.2 Sample selection
The data source of this paper is selected from East Money, a Chinese financial and stock information website provider. The website is a financial media with significant influence in China, which provides financial reports and financial market information in an all-around way. Its stock BBS is highly active, with a massive number of users and daily posts and rich information sources. The search indexes of the website rank at the forefront among similar websites. It also classifies the information by sector, industry and individual stock in detail to facilitate data collection by classification. At the same time, all the data from the date of listing can be obtained from the website, which is suitable for subject research.
The data samples selected in this paper are six random constituent stocks of the Shanghai Stock Exchange 50 index. Shanghai Stock Exchange 50 contains many high-quality blue chips and has strong liquidity as a hot index in the Chinese market. Therefore, it is suitable for the subject study. An overview of the data sample is shown in Table 2.
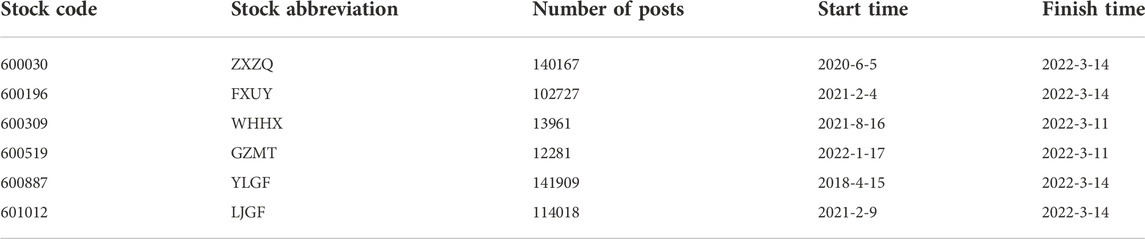
TABLE 2. Data sample overview.
4.2.3 Data preprocessing
The post text data obtained by the above crawler uses the post + comment aggregation mode in this paper to connect the post and the comment as one document. Since LDA is based on the statistical training model of word frequency, processing the text by word segmentation is necessary first.
This paper uses the python classic Chinese word segmentation module jieba for word segmentation. Words not helpful to the theme and sentimental judgment are deleted by extensive use of the Harbin Institute of technology stop word list, Chinese stop word vocabulary, and Baidu stops word list. Sichuan University Machine Intelligence Laboratory contain word vocabulary and some self-defined irrelevant words. Because some posts will publish the announcement of listed companies, financial news and stock prices on that same day, such posts often have more words but contain fewer data on investors’ comments.
Therefore, this paper will exclude posts with more than 300 words in the original text. Finally, it removes some special symbols and HTML tags and gets the number and distribution of smart devices used by Internet users, as shown in Table 1. The word cloud is shown in Figure 1 and Figure 2.
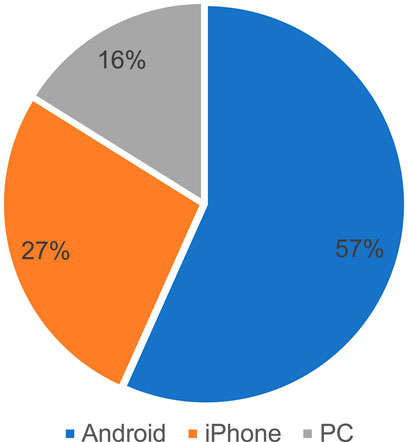
FIGURE 1. Percentage of devices used in Stock BBS.

FIGURE 2. Word cloud based on LDA topic model.
5 Results and analysis
5.1 Topic analysis
From Table 3 and Figure 3, when the number of topics is 7, the likelihood function value of the model is the largest, and the corresponding perplexity is 4996.54. Therefore, the number of LDA model topics selected in this paper is 7. In addition, the maximum number of iterations of the EM algorithm is set to 1000. The top 12 topic words of each topic obtained from the topic training are shown in Table 3. There is an intuitive correlation among the topic words, indicating better classification results of topics. According to the relationship between the topic words, the topics are named respectively. The number of posts on each topic is shown in Table 3, which can be seen that the issues discussed by investors on stock BBS mainly focus on the market, stock price and capital game.
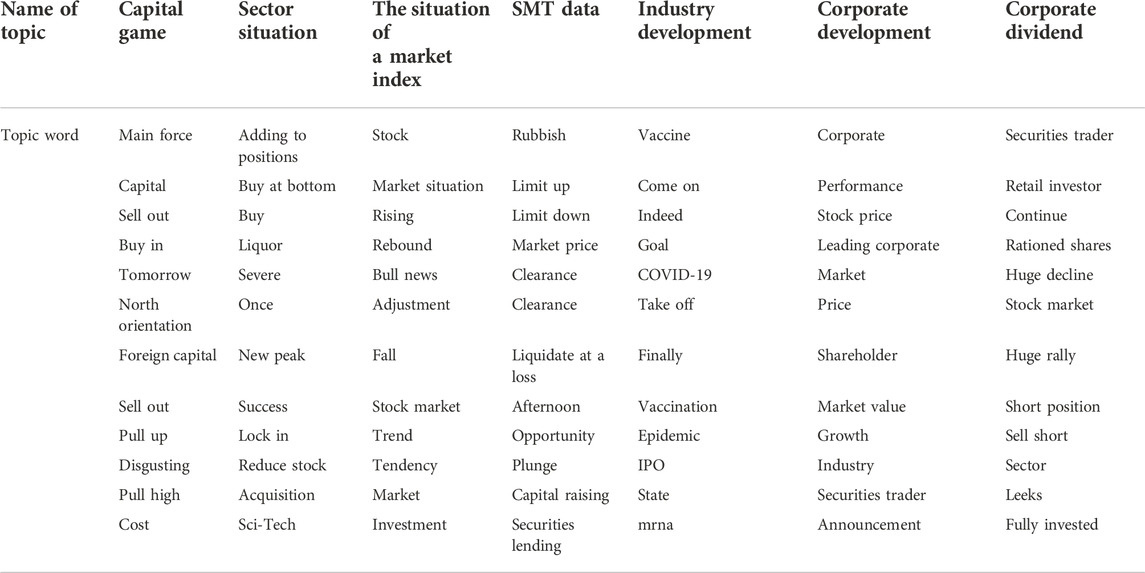
TABLE 3. Top twelve keywords for each topic.
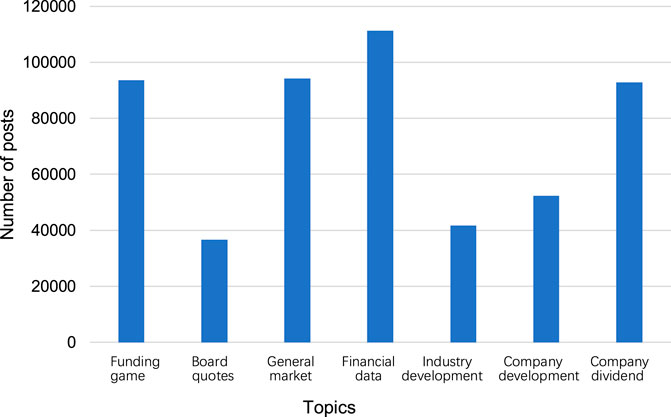
FIGURE 3. Number of posts under each topic.
5.2 Sentimental analysis
This paper analyzes the investor sentiment reflected by each post with the help of Baidu AI sentiment analysis technology and python classic Chinese sentiment analysis package snownlp. Baidu AI sentiment analysis aipnlp can judge the sentiment category (positive, negative, neutral) of the text containing subjective opinions and give the corresponding confidence level. The sentiment analysis results of some stock texts are shown in Figures 4, 5, and the sentiment analysis results of all topics are shown in Figure 6.
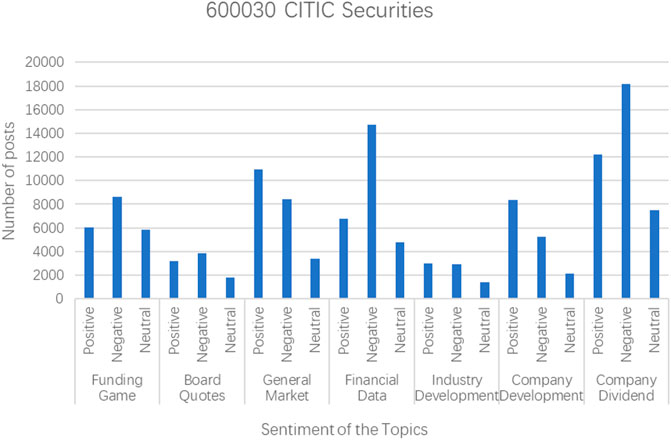
FIGURE 4. Sentiment analysis results of specific stock texts.
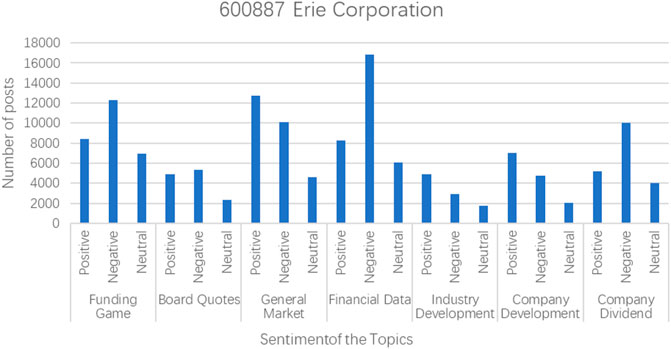
FIGURE 5. Sentiment analysis results of specific stock texts.
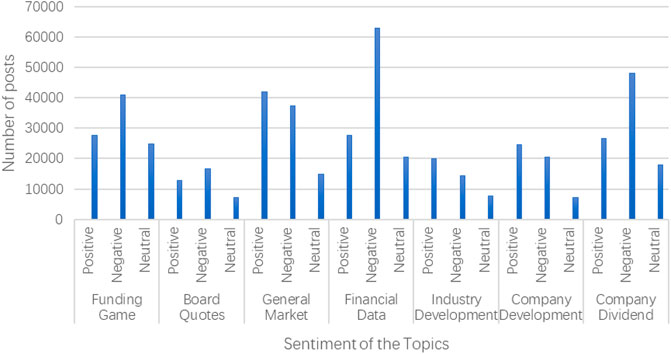
FIGURE 6. Sentiment analysis results of all topics.
We can find that the theme of the two financings has the closest attention from investors, and the main investor sentiment is negative. The second is the company’s dividend, and the investment sentiment is mainly negative. For the general market, the number of posts with positive investment sentiment is slightly higher than the number of negative posts. For the capital game, investors showed a significantly higher number of negative sentiments.
5.3 Regression results and analysis
As shown in Table 4 Regression Results, the regression coefficients of Emo1 and Emo2 are 0.5598 and 2.7446, respectively, after adding a series of control variables affecting the stock return, which are significant at the statistical level of 10%; the regression coefficients of Emo1 and Emo2 of sector quotation are 0.4996 and 1.1720 respectively, which are effective at the statistical level of 1%, and the regression coefficients of Emo1 and Emo2 of the situation of the market index are 2.6649 and 5.6954 respectively, which are significant at the statistical level of 1%.
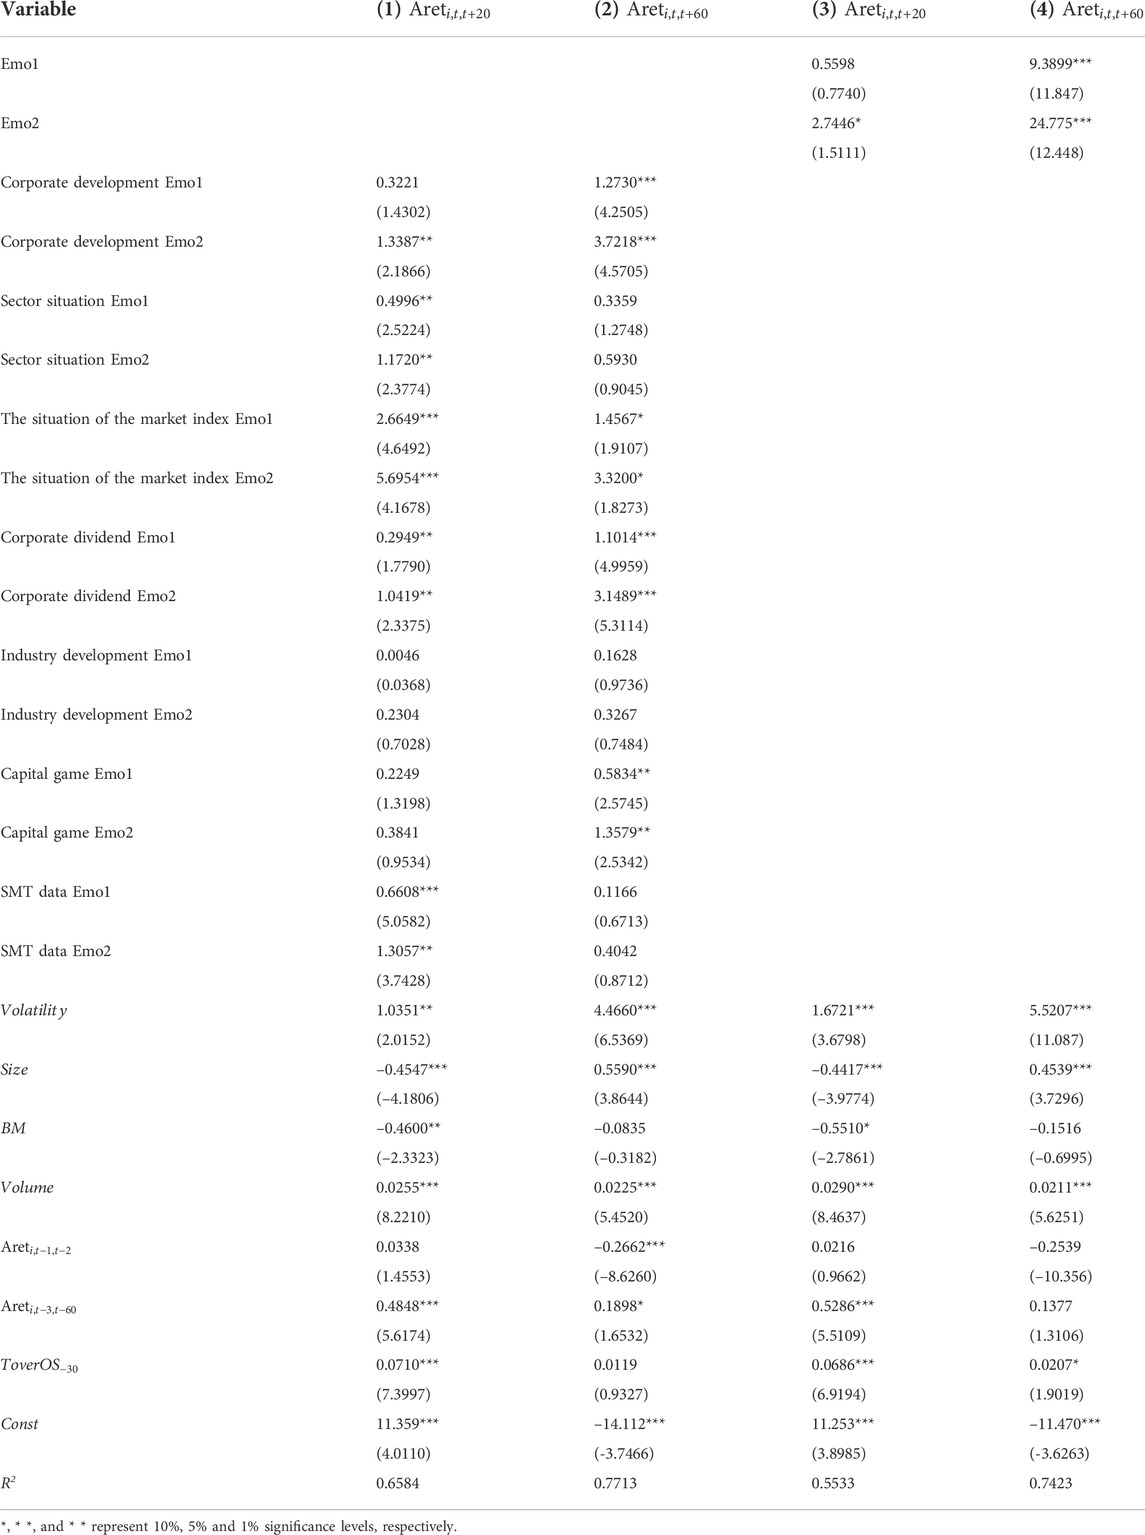
TABLE 4. Excess return and regression result of sentiment indicators.
The regression coefficients of Emo1 and Emo2 of corporate dividends are 0.2949 and 1.0419, respectively, which are statistically significant at the statistical level of 5%. It can be seen that the topic of the short-term stock return is sector quotation and the situation of a market index, which is also consistent with intuition. In the short term, retail investors can quickly reach a consensus on the market trends, such as rising and falling, which will cause fluctuations in the market’s short-term stock prices. When bull news appears, it will also quickly affect the industry and reflect the level of stock price. Since the stock price will affect the company’s dividend payout, the regression coefficient of the topic about the company’s dividend is significant.
Compared with the regression coefficient in the first column, the significant coefficient of the corporate development topic in the second column increases, while that of the situation of the market index decreases. It can be seen that when the long-term return rate of the stock price is taken into account, the influence of the quotation topic becomes smaller, and the future fundamental development of the company is concerned. In contrast, the impact of the corporate dividend topic is still significant.
Considering the regression coefficient of sentiment indicators without topic classification, the coefficient is significantly lower than that of sentiment indicators by topic classification, with a worse model-fitting effect. In conclusion, investor sentiment classified by topic can extract the value information in stock text. Each topic sentiment’s regression coefficient is positive, indicating that the stock’s excess return is positively correlated with the investor sentiment indicators.
The influencing factors of excess return rates of different time lengths are also changing. The quotation information affects short-term returns, and the development information of the company affects long-term returns. The dividend information of the company has an impact on both, which is in line with expectations.
5.4 Asymmetric effect
Baumeister, Bratslavsky, Finkenauer and Vohs [40] Baumeister et al., 2001 propose that bad things are more potent than good ones in daily life. Bad and bad stereotypes are more straightforward to form than good impressions. In the financial field, relevant scholars have found that the proportion of negative words can predict the low return of the company’s stock price in the news reports about a specific company. For those reports focusing on the company’s fundamentals, the negative news is more predictable for the earnings and returns than the positive news. Therefore, this paper further investigates whether there is an asymmetric effect between the positive and negative sentiments on the excess return of the stock price and constructs the following positive and negative sentiment indicators by using the sentiment of posts over the past month
Where the subscript j corresponds to different topics. The larger the
The regression results are shown in Table 5. In column (1), the regression coefficient of the topic Neg of SMT is 2.4841, which is significant at the statistical level of 1%. In contrast, the regression coefficient of Pos is not substantial, which indicates that there is the asymmetric effect on the topic sentiment of SMT. The regression coefficient of other topic sentiments is not significant.
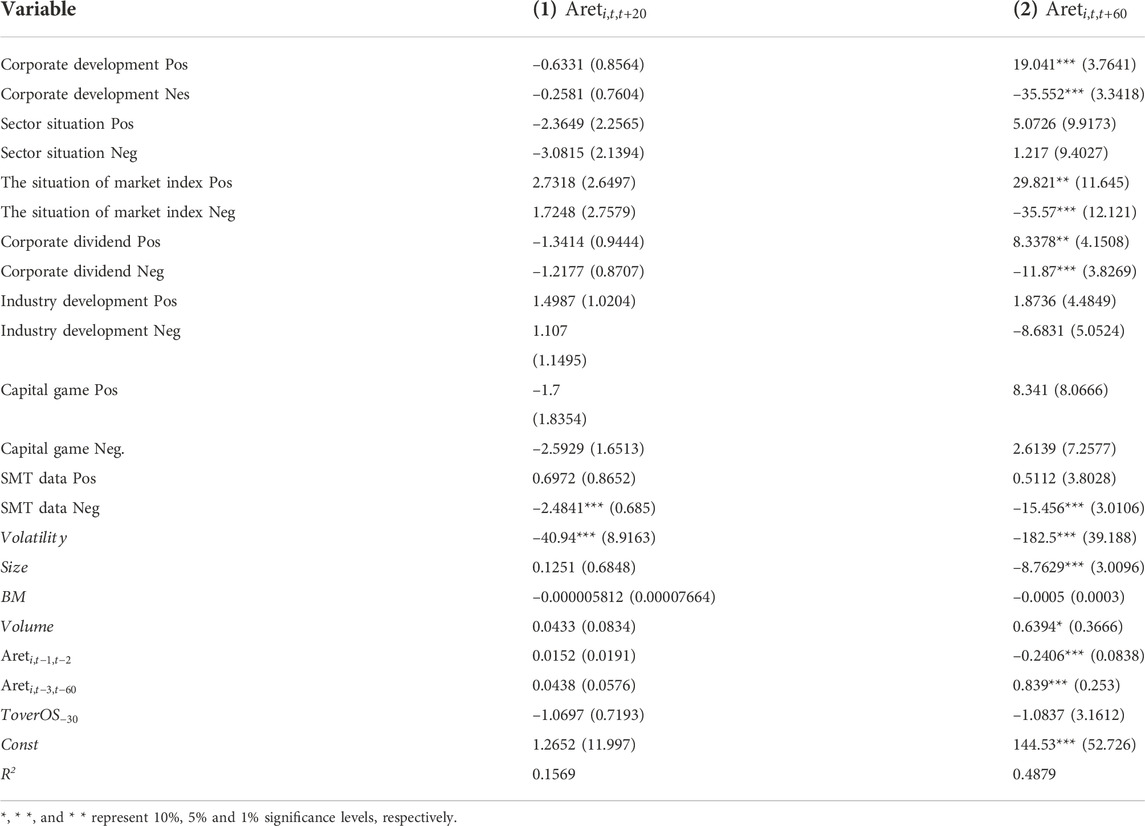
TABLE 5. Asymmetric effect.
The regression coefficients of Pos and Neg of “corporate development” in column (2) were 19.041 and -35.552, respectively, which are significantly higher than those in column (1), and are significant at the statistical level of 1%. The regression coefficients of the market index and corporate dividend situation are significantly increased compared with column (1), and the significance level is improved, indicating that positive and negative sentiments significantly impact long-term stock prices. In terms of topics, investors’ pessimistic attitude towards the company’s development will lead to a significant decline in the long-term stock price, and the attitude towards the market will also affect the company’s long-term stock price, which is consistent with common sense.
From the Pos and Neg coefficients of the topics involving corporate development, the situation of market index and corporate dividend, the coefficient is all positive. In contrast, the Neg coefficient is all negative, which shows that the stock excess return is affected by both positive and negative sentiments. The absolute value of the Neg coefficient is greater than the total value of the Pos coefficient, which confirms the existence of an asymmetric effect. In summary, regarding both the degree of impact and the persistence of the effects, the negative sentiment has a more significant impact on the stock excess return, which verifies the existence of an asymmetric effect.
6 Conclusion and further research
With the development of various social platforms and investment forums, many institutional investors have begun applying public opinion analysis to investment models. Because text data is unstructured, many choices and tools for preprocessing such data exist. Quick and accurate mining of target information has become a new research direction.
This paper first introduces relevant theories and research methods in investor sentiment. Then presents the development history and mainstream text mining models, analyzing the advantages and disadvantages of various models. It has adopted the unsupervised learning full probability generation model (LDA) as the primary model. It uses natural language processing and word segmentation tools to analyse East Money Stock BBS’s text data empirically. This paper attempts to apply the classic topic model LDA to the BBS text analysis enriches the method by using stock market information to analyze investor sentiment and explores the correlation between LDA and excess return.
The results show that: 1) investor sentiment classified by topics positively correlates with excess return rate; 2) different topics have different impact degrees. The situation of the market index has a short-term impact, corporate development has a long-term impact, and the corporate dividend has both short-term and long-term impacts. 3) Investor sentiment has an asymmetric effect on excess return.
Although the sentiment analysis method of text topic classification proposed in this paper has achieved some results for data crawling of East Money stock BBS, there is still plenty of space for optimization:
1) No topic dictionary is built for stock information in advance. The number of topics involved in stock BBS posts is enormous. Some of the posts published by investors are logical, and some are empty. To achieve accurate text topic classification, it is necessary to construct a topic dictionary using the text mining method to train the topic model more specifically.
2) This paper has less innovation in analyzing emotional orientation. It should be noted that even though the existing open-source tools can perform well in text sentiment analysis, there are still many deviations in the study of stock market texts. Because the stock market text contains many financial terms, universal sentiment analysis may not be able to identify such exceptional cases. Therefore, it’s necessary to build a sentiment dictionary for the stock market in advance and combine it with open-source tools to improve the accuracy of sentiment orientation analysis.
3) There are certain limitations in data samples. The data samples selected in this paper are not large enough. The chosen pieces are constituent stocks of the Shanghai Stock Exchange Index 50, without analysis of small-cap stocks or other sectors. Including small-cap stocks in future research is necessary to demonstrate the model’s universality.
4) The data selected in this paper is from East Money stock BBS. Not all investors will choose to speak on the platform, and there may be more posts with fewer comments, leading to more short text data and affecting model training. It can select the hottest positions weekly for future analysis to avoid this problem effectively.
6.1 Suggestions and recommendations
1. Improve the market delisting system: A sound delisting system can optimize the allocation of resources in the market, promote the flow of funds, and encourage listed companies to improve the company’s management levels. Improving the delisting system can start by removing a single indicator and introducing diversified listing standards so that companies with false information disclosure will consciously withdraw from the market or be eliminated in an excellent competitive environment.
2. Enhance the quality of investors’ transactions: For individual investors affected by emotions and repeatedly trade, you can increase the transaction stamp duty or reduce the transaction fee for retail investors to hold a specific stock for more than a certain period to make investors buy stocks more rationally.
3. Encourage retail investors and institutions to trade together: For the phenomenon of too many retail investors in China, we can give policy support to institutions and increase the number of institutional investors in the market. Increase the publicity of the advantages of institutions, attract retail investors to join institutions for investment, and trade in the market reasonably and efficiently. Reduce the handling fee of institutional agency transactions, make it whole so that institutions and retail investors can be combined, reduce the investment risk of retail investors, and reduce the capital losses of institutions.
Data availability statement
The raw data supporting the conclusions of this article will be made available by the authors, without undue reservation.
Ethics statement
Ethical review and approval was not required for the study on human participants in accordance with the local legislation and institutional requirements. Written informed consent from the participants was not required to participate in this study in accordance with the national legislation and the institutional requirements.
Author contributions
MC and KA: Conceptualization, introduction, methodology, interpreted results, writing-original draft preparation. ZG and KA: visualization, validation, conclusion, writing-original draft preparation. KA: Conceptualization, formal analysis, project administration, supervision, finalizes manuscript and Review and editing. KA and WH: Literature review, formal analysis, and review and editing. MC and KA: writing-original draft preparation, review and editing.
Conflict of interest
The authors declare that the research was conducted in the absence of any commercial or financial relationships that could be construed as a potential conflict of interest.
Publisher’s note
All claims expressed in this article are solely those of the authors and do not necessarily represent those of their affiliated organizations, or those of the publisher, the editors and the reviewers. Any product that may be evaluated in this article, or claim that may be made by its manufacturer, is not guaranteed or endorsed by the publisher.
References
Al Nasseri, A., Tucker, A., and Cesare, S. D. (2014). “Big data analysis of stock twits to predict sentiments in the stock market,” in International conference on Discovery Science (Cham: Springer Press), 13–24.
Baeza-Yates, R., and Ribeiro-Neto, B. (1999). Modern information retrieval (Vol. 463). New York: ACM press.
Baker, M., and Wurgler, J. (2006). Investor sentiment and the cross section of stock returns. J. Finance 61 (4), 1645–1680. doi:10.1111/j.1540-6261.2006.00885.x
Baker, M., and Wurgler, J. (2007). Investor sentiment in the stock market. J. Econ. Perspect. 21 (2), 129–151. doi:10.1257/jep.21.2.129
Baumeister, R. F., Bratslavsky, E., Finkenauer, C., and Vohs, K. D. (2001). Bad is stronger than good. Rev. general Psychol. 5 (4), 323–370. doi:10.1037/1089-2680.5.4.323
Besbris, M., Ariela, S., and Kuk, J (2021). The Unequal availability of Rental housing information across Neighborhoods. Demography 58 (4), 1197–1221. doi:10.1215/00703370-9357518
Blei, D. M., Ng, A. Y., and Jordan, M. I. (2003). Latent Dirichlet allocation. J. Mach. Learn. Res. 3 (1), 993–1022.
Bollen, J., and Mao, H. (2011). Twitter mood as a stock market predictor. Computer 44 (10), 91–94. doi:10.1109/mc.2011.323
Brown, G. W., and Cliff, M. T. (2005). Investor sentiment and asset valuation. J. Bus. 78 (2), 405–440. doi:10.1086/427633
Chen, H., De, P., Hu, Y. J., and Hwang, B. H. (2014). Wisdom of crowds: The value of stock opinions transmitted through social media. Rev. Financ. Stud. 27 (5), 1367–1403. doi:10.1093/rfs/hhu001
Da, Z., Engelberg, J., and Gao, P. (2015). The sum of all FEARS investor sentiment and asset prices. Rev. Financ. Stud. 28 (1), 1–32. doi:10.1093/rfs/hhu072
De Long, J. B., Shleifer, A., summers, L. H., and Waldmann, R. J. (1990). Noise trader risk in financial markets. J. Political Econ. 98 (4), 703–738. doi:10.1086/261703
Deerwester, S., Dumais, S. T., Furnas, G. W., Landauer, T. K., and Harshman, R. (1990). Indexing by latent semantic analysis. J. Am. Soc. Inf. Sci. 41 (6), 391–407. doi:10.1002/(sici)1097-4571(199009)41:6<391::aid-asi1>3.0.co;2-9
Gabrovšek, P., Aleksovski, D., Mozetič, I., and Grčar, M. (2017). Twitter sentiment around the Earnings Announcement events. PloS one 12 (2), e0173151. doi:10.1371/journal.pone.0173151
Gao, Z., Ren, H., and Zhang, B. (2020). Googling investor sentiment around the world. J. Financ. Quant. Anal. 55 (2), 549–580. doi:10.1017/s0022109019000061
Guan, J. Y., Zhu, H., and Liu, E. P. (2020). Stock bar review, Analyst Tracking and stock price crash risk: Information content analysis on Fuzzy information. Secur. Mark. Rev. 3, 58–68.
Hofmann, T. “Probabilistic latent semantic indexing,” in Proceedings of the 22nd Annual International ACM SIGIR Conference on Research and Development in Information Retrieval, Berkeley, August 1999 (ACM), 50–57. doi:10.1145/312624.312649
Ji, Rongjiao, and Han, Qiwei (2022). Understanding Heterogeneity of investor sentiment on social media: A structural topic modeling approach. Front. Artif. Intell. 5. doi:10.3389/frai.2022.884699
Jin, D. H., and Li, Y. (2017). Wisdom of crowds: Peer Perspective and value Discovery: Empirical Evidence from social media. Econ. Manag., 157–173.
Jing, N., Wu, Z., and Wang, H. (2021). A hybrid model integrating deep learning with investor sentiment analysis for stock price prediction. Expert Syst. Appl. 178, 115019. doi:10.1016/j.eswa.2021.115019
Jo, Y., and Oh, A. H. “Aspect and sentiment unification model for online review analysis,” in Proceedings of the fourth ACM international conference on Web search and data mining, Hong Kong, China, February 2011 (ACM), 815–824.
Kristoufek, L. (2013). Can Google Trends search queries contribute to risk diversification? Sci. Rep. 3 (1), 2713–2715. doi:10.1038/srep02713
Lachana, Ioanna, and Schroder, David (2022). Investor sentiment, social media and stock ¨ returns: Wisdom of Crowds or power of words? SSRN Working Paper. No.3842039.
Lin, C., He, Y., Everson, R., and Ruger, S. (2011). Weakly supervised joint sentiment-topic detection from text. IEEE Trans. Knowl. Data Eng. 24 (6), 1134–1145. doi:10.1109/tkde.2011.48
Long, J., Lee, C. L., Yang, S. W., Lee, J. Y., Lee, J. G., Song, K. H., et al. (2021). Transobturator four-arms mesh in the surgical management of cystocele: A long-term follow-up. J. Exerc. Rehabil. 20, 59–65. doi:10.12965/jer.2142098.049
Mai, Dat, and Pukthuanthong, Kuntara (2021). Economic narratives and market Outcomes: A semi-supervised topic modeling approach. SSRN Working Paper.
Mei, Q., Ling, X., Wondra, M., Su, H., and Zhai, C. “Topic sentiment mixture: Modelling facets and opinions in weblogs,” in Proceedings of the 16th international conference on World Wide Web, Banff, AB, Canada, January 2007 (ACM), 171–180.
Renault, T. (2017). Intraday online investor sentiment and return patterns in the US stock market. J. Bank. Finance 84, 25–40. doi:10.1016/j.jbankfin.2017.07.002
Roberts, Margaret E., Stewart, Brandon M., and Nielsen, Richard A. (2020). Adjusting for Confounding with text Matching. Am. J. Political Sci. 64 (4), 887–903. doi:10.1111/ajps.12526
Rosen-Zvi, M., Griffiths, T., Steyvers, M., and Smyth, P. (2012). The author-topic model for authors and documents. arXiv preprint. arXiv:1207.4169.
Rutledge, D. J. (1976). A note on the variability of futures prices. Rev. Econ. Statistics 58, 118–120. doi:10.2307/1936017
Salton, G., and McGill, M. J. (1983). Introduction to modern information retrieval. New York: McGraw-Hill.
Singer, E. (2002). The use of incentives to reduce nonresponse in household surveys. Surv. nonresponse 51 (1), 163–177.
Sprenger, T. O., Tumasjan, A., Sandner, P. G., and Welpe, I. M. (2014). Tweets and trades: The information content of stock microblogs. Eur. Financ. Manag. 20 (5), 926–957. doi:10.1111/j.1468-036x.2013.12007.x
Sun, Y., Zhou, X. G., and Fu, W. (2013). Unsupervised text sentiment analysis based on mixed topic sentiment model. J. Peking Univ. Nat. Sci. Ed. 49 (1), 102–108.
Tsukioka, Y., Yanagi, J., and Takada, T. (2018). Investor sentiment extracted from internet stock message boards and IPO puzzles. Int. Rev. Econ. Finance 56, 205–217. doi:10.1016/j.iref.2017.10.025
Whaley, R. E. (2000). The investor fear gauge. J. Portfolio Manag. 26 (3), 12–17. doi:10.3905/jpm.2000.319728
Xue, F. (2005). An empirical test of investor sentiment index selection in China. World Econ. Situat. 14, 14–17.
Yan, F., Du, P. F., Mao, J. H., and Liu, X. F. (2017). Sentiment analysis of stock market text based on sentiment dictionary and LDA model. Electron. Meas. Tech. 40 (12), 82–87.
Yang, X. L., Shen, H. B., and Zhu, Y. (2016). Local preference, investor sentiment and stock returns: Empirical Evidence from online forums. Finance Res. 12, 143–158.
Yao, J, Q., Feng, X., Wang, Z. J., Ji, R. R., and Zhang, W. (2021). Intonation, sentiment and market impact: A Lexicon of financial sentiment. J. Manag. Sci. 24 (05), 26–46.
Zhang, T. M., and Zhang, N. (2021). Review of stock market investor sentiment index research. Comput. Sci., 143–150.
Zhang, Z. X., and Wang, H. L. (2013). Investor sentiment, subjective belief Adjustment and market volatility. Financial Res. 4, 142–155.
Keywords: topic model, investor sentiment, text mining, sentiment analysis, stock price
Citation: Chen M, Guo Z, Abbass K and Huang W (2022) Analysis of the impact of investor sentiment on stock price using the latent dirichlet allocation topic model. Front. Environ. Sci. 10:1068398. doi: 10.3389/fenvs.2022.1068398
Received: 12 October 2022; Accepted: 24 October 2022;
Published: 01 December 2022.
Edited by:
Usama Awan, Inland Norway University of Applied Sciences, NorwayReviewed by:
Joanna Rosak-Szyrocka, Częstochowa University of Technology, PolandAtif Jahanger, Hainan University, China
Copyright © 2022 Chen, Guo, Abbass and Huang. This is an open-access article distributed under the terms of the Creative Commons Attribution License (CC BY). The use, distribution or reproduction in other forums is permitted, provided the original author(s) and the copyright owner(s) are credited and that the original publication in this journal is cited, in accordance with accepted academic practice. No use, distribution or reproduction is permitted which does not comply with these terms.
*Correspondence: Wenfeng Huang, huangwenfeng@gdufe.edu.cn