Robustness of Indoor Aquatic Mesocosm Experimentations and Data Reusability to Assess the Environmental Risks of Nanomaterials
 Mohammad Nassar
 Mélanie Auffan
 Catherine Santaella
 Armand Masion
 Jérôme Rose
- 1CEREGE, CNRS, IRD, INRAE, Coll France, Aix Marseille Univ, Aix-En-Provence, France
- 2Civil and Environmental Engineering, Duke University, Durham, NC, United States
- 3Aix Marseille Univ, CEA, CNRS, BIAM, LEMIRE, Saint Paul-Lez-Durance, France
Indoor aquatic mesocosms are increasingly used in nanosafety to assess the behavior, fate, and impacts of engineered nanomaterials (ENMs) in aquatic environments using relevant exposure scenarios. The robustness of 60 L freshwater mesocosm experimentation was tested on the basis of the reusability of the data collected in a database named MESOCOSM regarding mesocosm experiments examining the environmental risks of CeO2 ENMs. We observed high reliability of the measured variables across replicates. The sensitivity of this mesocosm methodology was evidenced by the contrasted ecosystem responses revealed by a multivariate analysis. We also observed that adding variables to the data set up to 15% did not affect the outcome of the analysis of the results. This ability to buffer this variability demonstrates that the indoor aquatic mesocosms are robust tools contributing to the environmental risk assessment of ENMs, and stresses the benefit of reusing the data stored in databases such as MESOCOSM adhering to the findable, accessible, interoperable, reusable (FAIR) data principles.
Introduction
The current strategies to assess the environmental safety of engineered nanomaterials (ENMs) are often based on standardized hazard-driven nano-ecotoxicological approaches (Kahru and Dubourguier, 2010; Skjolding et al., 2016; Lead et al., 2018). These standardized test conditions are defined according to wide applicability and ease of use, rather than relevant scenarios (e.g., concentrations, duration, and lifecycle stage) (Holden et al., 2016). With such approaches, only little attention is paid to the environmental exposure to ENMs, despite its pivotal role in the understanding of the environmental risks. Exposure to ENMs is driven by physicochemical (e.g., aggregation, sorption of (in)organic substances, and redox transformations) and ecological parameters (e.g., feeding type, trophic, and transgenerational transfers). There is abundant literature about the effects of all these parameters taken separately. However, for a robust characterization of the environmental risk, the complex interplay between these bio-physicochemical parameters in natural ecosystems needs to be considered (Auffan et al., 2014; Petersen et al., 2015; Holden et al., 2016; Schwirn et al., 2020).
In this regard, mesocosms provide an environmentally relevant testing strategy for ENMs since they were designed to allow the simultaneous monitoring of a number of parameters (e.g., aggregation, settling, mass balance, trophic transfer, biotransformation, oxidative stress, and microbial diversity) under environmentally meaningful conditions. A mesocosm is defined as an experimental system that simulates real-life conditions as closely as possible, while allowing the manipulation of environmental factors (Chowdhury et al., 2009). They combine the relevance of a field trial (exposure in complex media, low dose tested, and mid- to long-term duration) (Bradford et al., 2009; Mühling et al., 2009; Yeo and Nam, 2013) with the ease of monitoring (Wohlers-Zöllner et al., 2012; Gall et al., 2017; Båmstedt and Larsson, 2018; Velthuis et al., 2018). Among all available designs, indoor aquatic mesocosm facilities have been successfully used in these past few years to investigate the risks of ENMs. This versatile tool can accommodate several exposure scenarios to ENMs, that is, various ecosystems (such as lotic, lentic, estuarine, or lagoon environments), at ENMs concentrations close to the predicted environmental concentrations (Auffan et al., 2019), and with ENMs at different stages of the nanoproduct life cycle (production, use, and end of life) (Masion et al., 2019).
Schwirn et al. (2020) recently pointed out that “although knowledge on the peculiarities of testing and assessing fate and effects of ENMs in the environment strongly increased in the last years, uncertainties about how to perform a reliable and robust environmental risk assessment for ENMs still remain” (Schwirn et al., 2020). Despite the relevance of indoor aquatic mesocosm setups, the main criticism regards their ability to detect an effect and the important variability among replicates. This lack of precision and variability stems from the complexity of natural environments and the associated challenges to detect/measure ENMs and their effects at low doses. Indeed, conventional testing protocols circumvent the observed variability of biological systems in standardized tests by performing a number of replicates of these tests. Given the involved logistics and the duration of an experimental run, multiplying replicates is not always an option. However, a wider use of this methodology to assess the environmental exposure and hazards of ENMs requires addressing these apparent variabilities and limitations. This requires naturally working with multiple mesocosm experiments and their associated large data sets. This methodology is facilitated by the so-called findable, accessible, interoperable, reusable (FAIR) data initiative and the implementation of the database adhering to these principles (Wilkinson et al., 2016). The rationale is integrating data to develop efficient and deeper data mining to enhance the interdisciplinary vision of scientific results and to provide new insights to improve the safety and properties of ENMs. To meet the specific needs of environmental nanosafety, a dedicated database (called MESOCOSM) and its associated management system have been created recently (Ayadi et al., 2021).
Using the MESOCOSM database, our study aims at determining to which extent currently used indoor aquatic mesocosms produce reliable results and interpretations of the environmental exposure to ENMs and their hazards and will serve as an example of data reusability. In nanosafety, this touches upon the robustness of this experimental approach, a concept for which numerous definitions are available in the literature (Levins, 1966; Wimsatt, 2012) (Goodman et al., 2016; Munafò and Davey Smith, 2018). Narrowing it down to the use of mesocosms in nanosafety, the system dimensions and their reliability, sensitivity, and buffering capacity are key issues. Regarding the dimensioning of the setup, it has already been demonstrated that even a mesocosm with a modest volume produces a response that is characteristic of the simulated ecosystem and not its container (Teuben and Verhoef, 1992). However, the sensitivity (i.e., the ability to detect significant changes in the system response to ENM contamination), the reliability (i.e., the ability to obtain consistent results if an experiment is repeated exactly the same way), and the buffering capacity (i.e., the capacity to smooth out the system response to unexpected/unforeseeable experimental variability) remain to be studied for a better use of mesocosms in nanosafety.
To reach this goal, we used data stored in the MESOCOSM database regarding two experiments performed in 60 L indoor aquatic mesocosms examining the environmental risks of CeO2 ENMs within a pond ecosystem (Tella et al., 2014; Tella et al., 2015). The current study is essentially an examination of the relevance of data reanalysis or reusability in the parlance of the FAIR principles, combining several data sources instead of the single article. To do so, about ∼900 points regarding the bio-physicochemical properties, (bio)distribution, speciation, and biological impacts were gathered and analyzed using multivariate analysis [principal component analysis (PCA) and partial least squares regression (PLS-R)].
Materials and Methods
Where Does the Data Come From?
The data selected for the multivariate analysis in this present work regard experiments performed in freshwater indoor mesocosms contaminated with CeO2 ENMs (Tella et al., 2014; Tella et al., 2015) and were extracted from the publicly available MESOCOSM database (Ayadi et al., 2021). In brief, sixteen indoor mesocosms were set up to mimic a natural pond ecosystem (Auffan et al., 2014). Natural sediments and organisms (picobenthos and the invertebrate Planorbarius corneus) were collected from a non-contaminated pond in the preserved Natura 2000 reserve network in southern France (43.34361°N, 6.259663°E, and altitude 107 m a.s.l.). Each mesocosm consisted of a layer of artificial sediments made up of 79% SiO2, 15% kaolinite, and 1% CaCO3 covered with 300 g of water-saturated natural sediment containing primary producers (e.g., algae and bacteria). The tanks were filled with 46 L of Volvic® water with pH (pH ∼7.9) and conductivity values (between 250 and 330 μS cm−1) close to those of the natural pond water. After the first phase of mesocosm equilibration and organism acclimation, 12 mesocosms were contaminated with CeO2 ENMs, and four were kept as controls.
Two scenarios of CeO2 ENM contamination that can be encountered in real life were simulated for a month: 1) single pulse dosing (called the “mono” exposure scenario) of 69 mg of ENMs to achieve a total concentration of 1.3 mg L−1 of CeO2 ENMs simulating ENMs from rain runoff or spills and 2) multiple dosing (called the “multi” exposure scenario) of 5.2 mg of ENMs 3 times per week to reach a concentration of 1.1 mg L−1 after 28 days. The latter contamination scenario corresponds to a continuous point source discharge such as a wastewater treatment plant or industrial discharge.
Mesocosms were contaminated with three types of commercially available CeO2 ENMs. Citrate-coated CeO2 ENMs (∼4 nm, Nanobyk®, Byk Additives & Instruments, Germany) were used to contaminate a total of six mesocosms (three with the mono- and three with the multi-exposure scenarios). Large bare CeO2 ENMs (∼30 nm, NanoGrain®, Umicore, Germany) were used to contaminate three mesocosms using the multi-exposure scenario and small bare CeO2 ENMs (∼4 nm, Rhodia, France) to contaminate three mesocosms using the mono exposure scenario. Table 1 shows the main physicochemical characteristics of these CeO2 ENMs. More information about the experimental design, the physicochemical properties of the ENMs, the sampling, the analysis, and the bio-physicochemical results obtained are available in references (Tella et al., 2014; Tella et al., 2015).
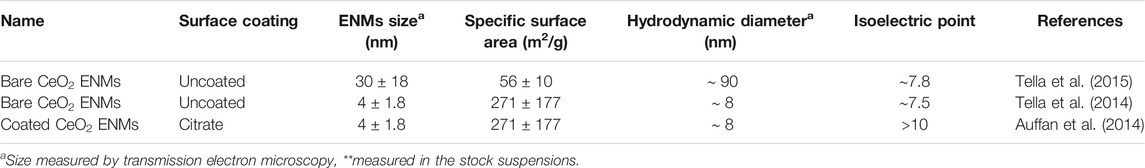
TABLE 1. Main physicochemical characteristics of CeO2 ENMs used to contaminate the mesocosms.
Which Data Were Implemented in the Dataset?
Multiple physicochemical, microbial, and biological measurements are performed during the previously presented experiments to assess the exposure and the impacts of ENMs in the mimicked ecosystem. These measurements allow monitoring, among all the mechanisms of toxicity at the individual and sub-individual scales on the micro- and macro-organisms, the (bio)distribution and (bio)transformation of the metal between the different compartments. Some parameters are monitored continuously with in situ probes (e.g., pH, temperature, redox potential, conductivity, and dissolved oxygen), while other parameters (e.g., metal concentrations, number of natural colloids, picoplankton/picobenthos and algae concentrations, and biomarkers) require sampling with a desired periodicity and ex situ analysis.
Quantitative data obtained in these 16 indoor freshwater mesocosms with CeO2 ENMs were defined in the data set as quantitative environmental variables and quantitative response variables. Six quantitative environmental variables were used: total organic carbon (TOC) measured once a week, and pH, oxidation–reduction potential (ORP) in the water column, ORP in surficial sediments, conductivity (cond), and dissolved O2 (O2) measured every 5 min in each mesocosm. To get a symmetric data set, mean values of pH, ORP, cond, and O2 were considered along 24 h on days 7, 14, 21, and 28. Four quantitative response variables measured once per week on days 7, 14, 21, and 28 in each mesocosm: cerium concentration in the water column ([Ce] tot water), cerium concentration in the surficial sediments ([Ce] tot sediment), a biomarker of total antioxidant capacity (TAOC), and a biomarker of the oxidative stress level based on lipid oxidation products (TBARS, thiobarbituric acid–reactive substances) (Armstrong and Browne, 1994; Botsoglou et al., 1994). TBARS and TAOC were measured on the digestive gland of mollusks. (For more details about these measurements see Tella et al. (2014).) Moreover, the data set also contained four qualitative variables that describe the exposure scenario [single pulse (mono) or multiple dosing (multi)], the surface coating (bare or citrate), the size of ENMs (∼4 and ∼30 nm), and the sampling time points (7, 14, 21, and 28 days).
Imputation of Missing Data
Due to the long experimentation period, sampling incidents and probe failure caused ∼3.64% of the data to be missing from the data set. Different ways for data imputation are usually proposed in the literature: time series analysis, nonlinear iterative partial least squares (NIPALS), Markov chain Monte Carlo (MCMC), analysis of covariance (ANCOVA) (Ogbonnaya and Uzochukwu, 2016). Procrustes analysis (Schneider and Borlund, 2007), which estimates the similarity between two matrices, was used to select the more efficient way for an a posteriori computation of the missing data in our data set. This method gives a constant (m2) that tends toward 0 when resemblance is 100%. Using Procrustes analysis, we showed that data generated using ANCOVA better reproduced the original measurements (m2 = 0.3) than those calculated by NIPALS and MCMC, which generated less accurate data (m2 = 0.95). Consequently, the 3.64% missing data were calculated through multivariate linear regression based on ANCOVA.
Principle Component Analysis and Partial Least Square Regression
PCA was used to assess the sensitivity of indoor aquatic mesocosms experiments to contrasted CeO2 ENMs exposure scenarios. PCA detects patterns in the data set and describes linear relations between the quantitative variables (Abdi and Williams, 2010). PLS-R was used to test the buffering capacity of aquatic indoor mesocosms.
PLS-R is a good alternative to the classical multiple linear regression and principal component regression methods (Wold et al., 1984; Otto and Wegscheider, 1986). PLS aims at explaining a set of response variables Y (a matrix of variables to be explained and to be predicted) from a set of explanatory variables X (a matrix of descriptors and predictive variables). The buffering capacity was quantified by determining the threshold of variability beyond which the data will no longer generate truthful bio-physicochemical conclusions. Our approach consisted in creating seven matrices artificially and randomly altered and modeling through the PLS-R response variables for each matrix. Each matrix is generated by adding some variability selected among seven levels (Table 2) ranging from ±15% (level 1) to ±45% (level 7) of disturbance, with respect to the original matrix. Each level comprises six percentages of disturbance (Table 2). For each level of disturbance, one percentage among the six was randomly selected using the programming language Python (the function “choice ()” from the library “random”), then applied to one observation only. Within one level of disturbance (from level 1: ± 15% to level 7: ± 45%), this was repeated for all 64 sampling observations, thereby generating a new matrix with a variability within the limits defined for that level. The entire procedure was performed for each level of disturbance, producing seven new matrices. The purpose of this approach was to define a threshold of variability below which the PLS-R model remains truthful. PLS-R models were evaluated according to three indicators:
(1) The coefficient of determination R2 (strength of the least squares fit to the training data set). R2 provides a measure of how well observed outcomes are reproduced by the PLS-R models (Heinisch, 1962). According to Chin, (1998) and Henseler et al., (2009), R2 > 0.67 indicates a high fit accuracy, 0.33 < R2 < 0.67 a moderated one, 0.19 < R2 < 0.33 a low fit accuracy, and R2 < 0.19 corresponds to unacceptable fits.
(2) The predictive relevance Q2. Q2 indicates how well the data collected experimentally can be reconstructed with the help of a model and the PLS-R parameters (Akter et al., 2011). Q2 can be used as a criterion for the quality of the model. Indeed, if Q2 is higher than 0.5, the model is regarded as predictive (Chin, 2010).
(3) The convergence/divergence of R2 and Q2 values represented by R2−Q2. If R2−Q2 > 0.3, the model is no longer considered as truthful (Leach, 2001).
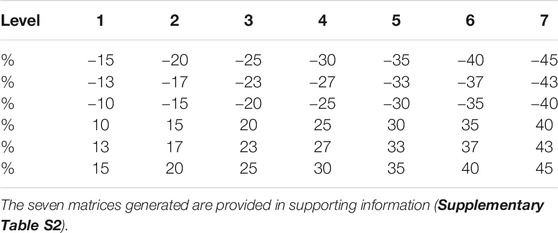
TABLE 2. Percentages of numerical disturbance within the seven disturbance levels applied on the initial data set.
Coefficient of Variation and Intraclass Correlation Coefficient
Coefficient of variation (CV, see Eq. 1) and intraclass correlation coefficient [ICC, see Eq. 2 (Weir, 2005)] were used to quantify the reliability of the mesocosms replicates.
CV values for each quantitative response variables correspond to the means of replicates of CVs of all data points corresponding to one type of contamination scenario at a given time point. In the case of the quantitative environmental variables, all data points that correspond to a given variable were considered in the calculation of CV, regardless of the type of contamination scenario or the sampling time point.
The ICC calculation was performed using two-way ANOVA (analysis of variance) without replication. An ICC value above 0.70 is indicative of a suitable reliability (Baumgartner and Chung, 2001). Here, we assess the physical reproducibility (i.e., across mesocosm replicates) and not statistical replication (i.e., repeated measurement of one variable in one mesocosm at a given time point).
Results and Discussion
Sensitivity of Indoor Aquatic Mesocosm Experiments to Contrasted CeO2 ENMs Exposure Scenarios
As already applied to mesocosm data set (Dauda et al., 2020; Nassar et al., 2020), PCA was used to compare the global response of a lentic ecosystem mimicked in indoor aquatic mesocosms following two contrasted contamination scenarios. The first exposure scenario (single pulse, called mono) simulates an acute CeO2 ENMs release, for example, by a rain runoff or a spill, while the second one (multiple doses, called multi) simulates a continuous point source discharge such as a wastewater treatment plant. PCA is used to examine the structure of the observations and the correlations among the variables (Abdi and Williams, 2010). In the current work, the term observation refers to the measurement of all variables generated within one mesocosm at a given time point.
The loading plot (F1, F2) presented in Figure 1 gathered 24 observations corresponding to 12 mesocosms sampled at short-term (7 days) and medium-term (28 days) time points. The concentration [Ce] tot water and biomarkers (TBARS and TAOC) were the main drivers of the first principal component F1, while the second principal component F2 is driven by the exposure scenario, size, and surface coating, that is, qualitative variables. The main features are 1) the clustering of the observations of the mesocosms according to the CeO2 contamination scenario, namely, single pulse exposure scenario (light and dark blue dots) and multiple doses (red and purple dots) and 2) the different evolutions over time of the mono and multi-exposure scenarios. This analysis is in agreement with previous findings (Auffan et al., 2014; Tella et al., 2014; Tella et al., 2015; Nassar et al., 2020) showing that for the single pulse scenario, the Ce concentration in the water column decreases sharply within a week due to homo-and hetero agglomeration phenomena, whereas [Ce]tot water remained quasi-constant during the entire multiple doses experiment.
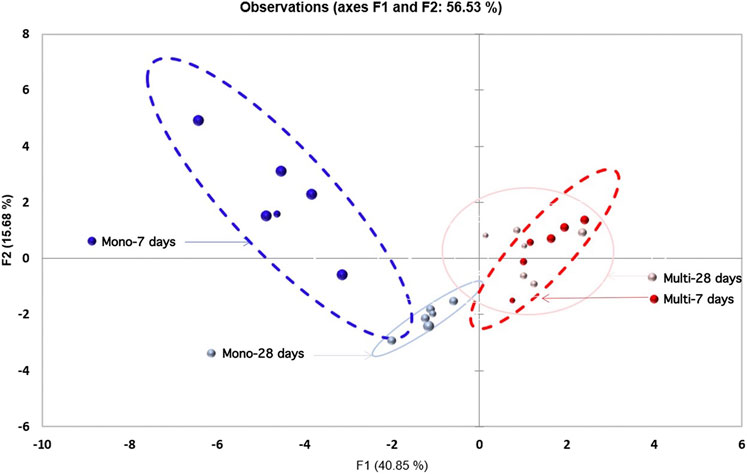
FIGURE 1. Loading plot (F1, F2) gathering 24 observations clustered for to the contamination scenarios. Red: multiple dosing (multi) of CeO2 ENMs. Blue: single pulse (mono) of CeO2 ENMs. Dashed lines: after 7 days of exposure. Full lines: after 28 days of exposure.
The main challenge in working with indoor aquatic mesocosms under relevant exposure conditions (i.e., on the medium/long-term, with different trophic levels, and at concentrations close to the detection limits of analytic instrumentation) is to detect contaminant-induced changes in bio-physicochemical responses within the ecosystems. Herein, we highlight that combining PCA with the mesocosm methodology is sufficiently sensitive to detect scenario-specific or scenario-dependent ecosystem responses to the presence of CeO2 ENMs.
Reliability of Indoor Aquatic Mesocosm Exposed to CeO2 ENMs
Intersystem variability has frequently been considered as a critical drawback of microcosm and mesocosm experiments. This is especially the case in the context of environmental risk of ENMs, where nature-like conditions and reliability are often considered as diametrically opposed, and the low number of replicates (if any) is an aggravating factor. To gain a better insight into this issue, the CV (Cairns, 1988) and ICC (Baumgartner and Chung, 2001) were used to quantify the reliability. The data set used to this end is the one described above, where experiments were performed in triplicate (Tella et al., 2014; Tella et al., 2015).
The CV values determined across triplicates for each quantitative environmental variable were 2% for the pH, 6% for the conductivity, 21% for the ORP in the water column, 30% for the ORP in surficial sediments, and 10% for the dissolved O2. For the response variables, the CV values were 26% for [Ce]tot water, 23% for [Ce]tot sediment, 14% for TBARS, and 11% for TAOC. All these CV values are in the range considered as acceptable for response variables (i.e., CV < 30%) (Isensee, 1976), and even more when considering the 45% value suggested as threshold for mesocosm studies (Sanderson, 2002).
In addition to the CV, the ICC assesses the consistency or conformity between two or more quantitative measurements. It estimates the population variances based on the variability among a given set of measurements. An ICC ≥ 0.70 indicates a good reliability (Baumgartner and Chung, 2001). The ICC values calculated for the environmental variables in both control and contaminated mesocosms were larger than 0.95, which is well above the 0.70 threshold, thereby demonstrating an excellent reliability of the physical-chemical parameters (Figure 2A). While less elevated, the ICC obtained for the response variables ([Ce]tot water, [Ce]tot sediment, TBARS, and TAOC) remained above the 0.7 value indicating good reliability (Baumgartner and Chung, 2001) (ICC > 0.89 and ICC > 0.78 for bare-and coated CeO2 ENMs contamination, respectively, Figure 2B). These CV and ICC estimations highlight that data characterizing the exposure and hazards of ENMs in indoor aquatic mesocosms are sufficiently reliable, despite the intersystem variability often put forward regarding this experimental approach.
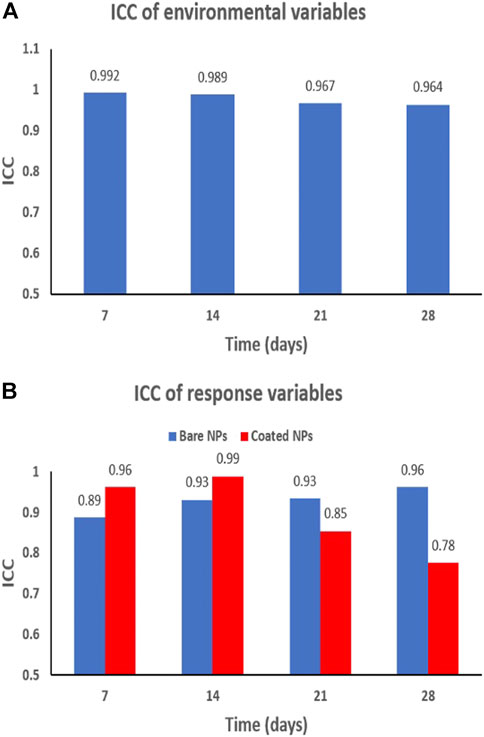
FIGURE 2. (A) Intraclass correlation (ICC) obtained on the environmental variables (pH, temperature, dissolved O2, ORP, and conductivity) in all mesocosms either control or contaminated ones. (B) ICC values based on the measurements of response variables (Ce concentrations and biomarkers) obtained in mesocosms contaminated with bare CeO2 NPs (blue) and coated CeO2 NPs (red).
Buffer Capacity of Indoor Aquatic Mesocosms Exposed to CeO2 ENMs
As already mentioned, working under environmentally relevant exposure conditions over extended periods of time requires a reliable monitoring-sampling-measuring setup. However, possible experimental problems (e.g., probe failure) cause variability that adds to the inherent variability of biological systems (e.g., algal bloom). When the amplitude of this variability is modest, it might be difficult to distinguish from the natural variability. A reliable methodology needs to produce consistent conclusions, despite this variability (Boyle and Fairchild, 1997). The purpose here was to determine to which extent the variability can be buffered before conclusions are affected. To this end, the random numerical data disturbance described above was applied to the data set to simulate experimental variability. The PLS-R modeling (Wold et al., 1984; Otto and Wegscheider, 1986) was performed on [Ce]tot water and TBARS, that is, the main driver variables.
Figure 3 shows the changes in R2 and Q2 over the different levels of disturbance applied. Between 0 and ±15% (level 1) of data disturbance, PLS-R modeled the variable [Ce]tot water with a high fitting accuracy (R2 > 0.67) and predicted new accurate data (Q2 ∼ 0.66) (Figure 3A). Beyond ±30% (level 4) of data disturbance, R2 and Q2 decreased to 0.62 and 0.43, respectively, and the R2 and Q2 values started to diverge (R2−Q2 ∼ 0.2). The absolute values of R2 and Q2 values associated with the divergence between R2 and Q2 showed that PLS-R did not accurately model [Ce]tot water beyond 30% of data degradation.
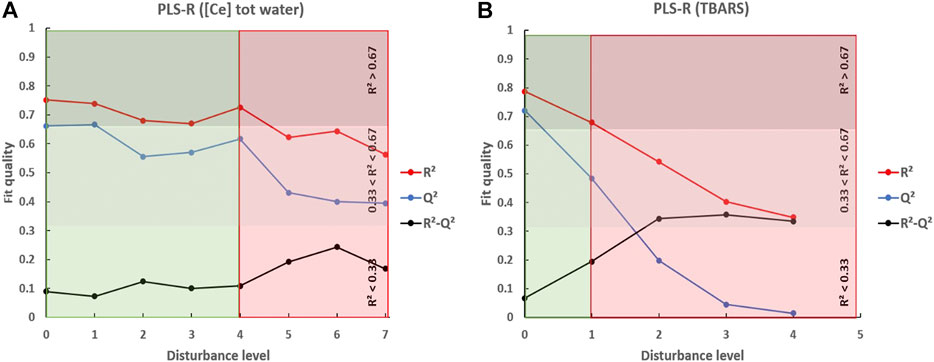
FIGURE 3. Evolution of R2 and Q2 in function of the percentage of artificial data disturbance following levels provided in Table 2. (A) corresponds to the modeling of [Ce]tot water by PLS-R. (B) corresponds to the modeling of the TBARS by PLS-R. The red line represents the evolution of R2, the blue line represents the evolution of Q2, and the black line represents the evolution of the difference R2−Q2. Level 0 means no disturbance of the data set. The green zone illustrates the levels of disturbance that generate a great fit quality, while the red zone illustrates the levels of disturbance generating poor fit quality.
Below ±15% of data disturbance (level 1), PLS-R modeled the variable TBARS with high R2 and Q2 (R2 > 0.67 and Q2 ∼ 0.49) (Figure 3B). From level 2 of data disturbance (between ±15% and ±20%), R2 and Q2 values drastically decreased to 0.54 and 0.19, respectively, and R2 and Q2 diverged (R2−Q2 ∼ 0.34), indicating that PLS-R no longer modeled TBARS accurately. Interestingly, our calculation shows that after a disturbance by ±20%, the coefficient of variation for TBARS data is only about 15%, while a Q2 value below 0.5 indicated a poor fit. This shows that the CV on its own is not a sufficient indicator of the reliability of a data set.
The overall threshold to consider for the buffering capacity of a mesocosm experiment is, of course, the lower of the two values determined with the PLS-R models for [Ce]tot water and TBARS, viz. ±15%. While it is clear that this value obtained under the present experimental conditions with ENMs cannot be applied to mesocosm experimentation in general, it is an indication of the magnitude of the buffering capacity of this methodology, and it demonstrates that significant variability can be added to the data set before fitting accuracy becomes inadequate. To the best of our knowledge, this is the first report describing a multivariate analysis procedure giving a (semi)quantitative estimate of the buffering capacity in the context of environmental exposure and impacts of ENMs using mesocosms.
Robustness of Small Indoor Aquatic Mesocosm in Nanosafety
There has been a great deal of discussion within the nanosafety community these past few years around the best way to assess ENM environmental safety and to generate relevant, useful, and FAIR data. In this regard, mesocosm testing has gained popularity, but criticisms regarding this methodology still exist. The most severe ones are related to the statistical relevance and the variability of this type of experimentation. In the present work, these two aspects and sensitivity requirements were combined under the term robustness.
Our results demonstrate that indoor aquatic mesocosm is a robust methodology since it produces reproducible results and is capable to buffer a significant level of added/accidental variability, while maintaining a sufficient sensitivity to account for changes in contamination scenarios. Addressing sensitivity and reliability/variability issues might appear as opposed concepts. However, in the context of robustness, the sensitivity needs to be seen as the ability of the mesocosm to respond differently to different exposure scenarios.
Using PCA, we highlighted that indoor aquatic mesocosms are sufficiently sensitive to detect scenario-specific or scenario-dependent ecosystem responses to the presence of CeO2 ENMs. The variables responsible for these different global responses were identified. Based on CV and ICC determinations, the reliability across mesocosm triplicates was found to be very satisfactory. It may be counterintuitive that experiments with only three replicates can achieve a reliability score normally attributed to experiments with larger numbers of replications. We hypothesized that standardized tests performed with single species exposed to ENMs in simplified media are less prone to buffer unwanted experimental artifacts. On the opposite, a mesocosm experiment encompasses as much as possible the bio-physicochemical complexity of the mimicked ecosystem and is more prone to buffer this experimental variability across replicates. The PLS-R models performed corroborate this hypothesis showing that the buffering capacity is still preserved within approximately 15% of additional variability (under our experimental conditions), that is , beyond the limit where many experimental scientists would be tempted to discard the data.
To the best of our knowledge, this study is one of the first assessing to which extent currently used indoor aquatic mesocosms produce reliable results and interpretations of the environmental exposure to ENMs and their hazards. Using a multivariate analysis of a given data set, the robustness of such mesocosm experiments could be demonstrated. Of course, the analysis was conducted based on the limited data set obtained within 16 mesocosms mimicking a pond ecosystem contaminated with CeO2 ENMs. This work needs to be extended to address larger data sets, different types of ENMs (e.g., different chemistry, surface properties, and aspect ratio), different ecosystems mimicked (e.g., pond, river, lake, and estuary), and different endpoints considered (e.g., populational, individual, sub-individual, and molecular). The ongoing development and implementation of FAIR compliant data sources (e.g., MESOCOSM database) are facilitating factors.
Data Availability Statement
The data analyzed in this study are subject to the following licenses/restrictions: https://aliayadi.github.io/MESOCOSM-database/. Requests to access these data sets should be directed to auffan@cerege.fr.
Author Contributions
NM performed the multivariate analysis of the data set generated by AM. AM, SC, MA, and RJ supervised the work. NM wrote the manuscript with input and approval from all coauthors.
Funding
This work has received funding from Excellence Initiative of Aix—Marseille University—A*MIDEX, a French “Investissements d’Avenir” program, through its associated Labex SERENADE project, and from the European project Gov4Nano, H2020-NMBP-TO-IND-2018-2020-814401.
Conflict of Interest
The authors declare that the research was conducted in the absence of any commercial or financial relationships that could be construed as a potential conflict of interest.
Acknowledgments
This work is also a contribution to the OSU-Institut Pythéas. The authors acknowledge the CNRS for the funding of the IRP iNOVE.
Supplementary Material
The Supplementary Material for this article can be found online at: https://www.frontiersin.org/articles/10.3389/fenvs.2021.625201/full#supplementary-material
References
Abdi, H., and Williams, L. J. (2010). Principal Component Analysis. Wires Comp. Stat. 2, 433–459. doi:10.1002/wics.101
Akter, S., D’Ambra, J., and Ray, P. (2011). An Evaluation of PLS Based Complex Models: The Roles of Power Analysis, Predictive Relevance and GoF index 9. Proceedings of the 17th Americas Conference on Information Systems (AMCIS2011) (Detroit, USA: Association for Information Systems), 1–7.
Armstrong, D., and Browne, R. (1994). “The Analysis of Free Radicals, Lipid Peroxides, Antioxidant Enzymes and Compounds Related to Oxidative Stress as Applied to the Clinical Chemistry Laboratory,” in Free Radicals in Diagnostic Medicine: A Systems Approach to Laboratory Technology, Clinical Correlations, and Antioxidant Therapy, Advances in Experimental Medicine and Biology. Editor D. Armstrong (Boston, MA: Springer US), 43–58. doi:10.1007/978-1-4615-1833-4_4
Auffan, M., Masion, A., Mouneyrac, C., de Garidel-Thoron, C., Hendren, C. O., Thiéry, A., et al. (2019). Contribution of Mesocosm Testing to a Single-step and Exposure-Driven Environmental Risk Assessment of Engineered Nanomaterials. NanoImpact 13, 66–69. doi:10.1016/j.impact.2018.12.005
Auffan, M., Tella, M., Santaella, C., Brousset, L., Paillès, C., Barakat, M., et al. (2014). An Adaptable Mesocosm Platform for Performing Integrated Assessments of Nanomaterial Risk in Complex Environmental Systems. Sci. Rep. 4, 5608. doi:10.1038/srep05608
Ayadi, A., Rose, J., de Garidel-Thoron, C., Hendren, C., Wiesner, M. R., and Auffan, M. (2021). MESOCOSM: A Mesocosm Database Management System for Environmental Nanosafety. NanoImpact 21, 100288. doi:10.1016/j.impact.2020.100288
Båmstedt, U., and Larsson, H. (2018). An Indoor Pelagic Mesocosm Facility to Simulate Multiple Water-Column Characteristics. Int. Aquat. Res. 10, 13–29. doi:10.1007/s40071-017-0185-y
Baumgartner, T. A., and Chung, H. (2001). Confidence Limits for Intraclass Reliability Coefficients. Meas. Phys. Educ. Exerc. Sci. 5, 179–188. doi:10.1207/S15327841MPEE0503_4
Botsoglou, N. A., Fletouris, D. J., Papageorgiou, G. E., Vassilopoulos, V. N., Mantis, A. J., and Trakatellis, A. G. (1994). Rapid, Sensitive, and Specific Thiobarbituric Acid Method for Measuring Lipid Peroxidation in Animal Tissue, Food, and Feedstuff Samples. J. Agric. Food Chem. 42, 1931–1937. doi:10.1021/jf00045a019
Boyle, T. P., and Fairchild, J. F. (1997). The Role of Mesocosm Studies in Ecological Risk Analysis. Ecol. Appl. 7, 1099–1102. doi:10.1890/1051-0761(1997)007[1099:TROMSI]2.0.CO;2
Bradford, A., Handy, R. D., Readman, J. W., Atfield, A., and Mühling, M. (2009). Impact of Silver Nanoparticle Contamination on the Genetic Diversity of Natural Bacterial Assemblages in Estuarine Sediments. Environ. Sci. Technol. 43, 4530–4536. doi:10.1021/es9001949
Cairns, J. (1988). Putting the Eco in Ecotoxicology. Regul. Toxicol. Pharmacol. 8, 226–238. doi:10.1016/0273-2300(88)90031-1
Chin, W. W. (1998). “The Partial Least Squares Approach for Structural Equation Modeling,” in Modern Methods for Business Research, Methodology for Business and Management (Mahwah, NJ, US: Lawrence Erlbaum Associates Publishers), 295–336.
Chin, W. W. (2010). “How to Write up and Report PLS Analyses,” in Handbook of Partial Least Squares Concepts Methods and Applications. Editors V. Esposito Vinzi, W. W. Chin, J. Henseler, and H. Wang (Germany: Springer), 645–689.
Chowdhury, M. K. A., Hoque, M. I., and Sonnino, A. (2009). Biosafety of Genetically Modified Organisms: Basic Concepts, Methods and Issues. Food Agric. Organ. United Nations 301.
Dauda, S., Gabriel, A. M., Idris, O. F., and Chia, M. A. (2020). Combined nanoTiO2 and Nitrogen Effects on Phytoplankton: a Mesocosm Approach. J. Appl. Phycol 32, 3123–3132. doi:10.1007/s10811-020-02187-0
Gall, A., Uebel, U., Ebensen, U., Hillebrand, H., Meier, S., Singer, G., et al. (2017). Planktotrons: A Novel Indoor Mesocosm Facility for Aquatic Biodiversity and Food Web Research. Limnol. Oceanogr. Methods 15, 663–677. doi:10.1002/lom3.10196
Goodman, S. N., Fanelli, D., and Ioannidis, J. P. A. (2016). What Does Research Reproducibility Mean? Sci. Transl. Med. 8, 341ps12. doi:10.1126/scitranslmed.aaf5027
Heinisch, O. (1962). Steel, R. G. D., and J. H. Torrie: Principles and Procedures of Statistics. (With Special Reference to the Biological Sciences.) McGraw-Hill Book Company, New York, Toronto, London 1960, 481 S., 15 Abb.; 81 S 6 D. Biometrische Z. 4, 207–208. doi:10.1002/bimj.19620040313
Henseler, J., Ringle, C. M., and Sinkovics, R. R. (2009). “The Use of Partial Least Squares Path Modeling in International Marketing,” in New Challenges to International Marketing, Advances in International Marketing. Editors R. Sinkovics Rudolf, and N. Ghauri Pervez (Manchester, England: Emerald Group Publishing Limited), 277–319. doi:10.1108/S1474-7979(2009)0000020014
Holden, P. A., Gardea-Torresdey, J. L., Klaessig, F., Turco, R. F., Mortimer, M., Hund-Rinke, K., et al. (2016). Considerations of Environmentally Relevant Test Conditions for Improved Evaluation of Ecological Hazards of Engineered Nanomaterials. Environ. Sci. Technol. 50, 6124–6145. doi:10.1021/acs.est.6b00608
Isensee, A. R. (1976). Variability of Aquatic Model Ecosystem‐derived Data. Int. J. Environ. Stud. 10, 35–41. doi:10.1080/00207237608737290
Kahru, A., and Dubourguier, H.-C. (2010). From Ecotoxicology to Nanoecotoxicology. Toxicology 269, 105–119. doi:10.1016/j.tox.2009.08.016
Leach, A. R. (2001). Molecular Modelling: Principles and Applications. 2nd Edition. Available at: /content/one-dot-com/one-dot-com/us/en/higher-education/program.html (Accessed March 23, 2020).
Lead, J. R., Batley, G. E., Alvarez, P. J. J., Croteau, M.-N., Handy, R. D., McLaughlin, M. J., et al. (2018). Nanomaterials in the Environment: Behavior, Fate, Bioavailability, and Effects-An Updated Review. Environ. Toxicol. Chem. 37, 2029–2063. doi:10.1002/etc.4147
Tella, M., Auffan, M., Brousset, L., Issartel, J., Kieffer, I., Pailles, C., et al. (2014). Transfer, Transformation, and Impacts of Ceria Nanomaterials in Aquatic Mesocosms Simulating a Pond Ecosystem. Environ. Sci. Technol. 48, 9004–9013. doi:10.1021/es501641b
Masion, A., Auffan, M., and Rose, J. (2019). Monitoring the Environmental Aging of Nanomaterials: An Opportunity for Mesocosm Testing? Materials 12, 2447. doi:10.3390/ma12152447
Mühling, M., Bradford, A., Readman, J. W., Somerfield, P. J., and Handy, R. D. (2009). An Investigation into the Effects of Silver Nanoparticles on Antibiotic Resistance of Naturally Occurring Bacteria in an Estuarine Sediment. Mar. Environ. Res. 68, 278–283. doi:10.1016/j.marenvres.2009.07.001
Munafò, M. R., and Davey Smith, G. (2018). Robust Research Needs many Lines of Evidence. Nature 553, 399–401. doi:10.1038/d41586-018-01023-3
Nassar, M., Auffan, M., Santaella, C., Masion, A., and Rose, J. (2020). Multivariate Analysis of the Exposure and Hazard of Ceria Nanomaterials in Indoor Aquatic Mesocosms. Environ. Sci. Nano 7, 1661–1669. doi:10.1039/C9EN01439J
Ogbonnaya, C. E., and Uzochukwu, E. C. (2016). Estimation of Missing Data in Analysis of Covariance: A Least-Squares Approach. Commun. Stat. - Theor. Methods 45, 1902–1909. doi:10.1080/03610926.2013.868000
Otto, M., and Wegscheider, W. (1986). Selectivity in Multicomponent Analysis. Analytica Chim. Acta 180, 445–456. doi:10.1016/0003-2670(86)80024-1
Petersen, E. J., Diamond, S. A., Kennedy, A. J., Goss, G. G., Ho, K., Lead, J., et al. (2015). Adapting OECD Aquatic Toxicity Tests for Use with Manufactured Nanomaterials: Key Issues and Consensus Recommendations. Environ. Sci. Technol. 49, 9532–9547. doi:10.1021/acs.est.5b00997
Sanderson, H. (2002). Pesticide Studies. Environ. Sci. Pollut. Res. 9, 429–435. doi:10.1007/BF02987597
Schneider, J. W., and Borlund, P. (2007). Matrix Comparison, Part 2: Measuring the Resemblance between Proximity Measures or Ordination Results by Use of the Mantel and Procrustes Statistics. J. Am. Soc. Inf. Sci. 58, 1596–1609. doi:10.1002/asi.20642
Schwirn, K., Voelker, D., Galert, W., Quik, J., and Tietjen, L. (2020). Environmental Risk Assessment of Nanomaterials in the Light of New Obligations under the REACH Regulation: Which Challenges Remain and How to Approach Them? Integr. Environ. Assess. Manag. 16, 706–717. doi:10.1002/ieam.4267
Skjolding, L. M., Sørensen, S. N., Hartmann, N. B., Hjorth, R., Hansen, S. F., and Baun, A. (2016). Aquatic Ecotoxicity Testing of Nanoparticles-The Quest to Disclose Nanoparticle Effects. Angew. Chem. Int. Ed. 55, 15224–15239. doi:10.1002/anie.201604964
Tella, M., Auffan, M., Brousset, L., Morel, E., Proux, O., Chanéac, C., et al. (2015). Chronic Dosing of a Simulated Pond Ecosystem in Indoor Aquatic Mesocosms: Fate and Transport of CeO2 Nanoparticles. Environ. Sci. Nano 2, 653–663. doi:10.1039/C5EN00092K
Teuben, A., and Verhoef, H. A. (1992). Relevance of Micro- and Mesocosm Experiments for Studying Soil Ecosystem Processes. Soil Biol. Biochem. 24, 1179–1183. doi:10.1016/0038-0717(92)90069-A
Velthuis, M., Kosten, S., Aben, R., Kazanjian, G., Hilt, S., Peeters, E. T. H. M., et al. (2018). Warming Enhances Sedimentation and Decomposition of Organic Carbon in Shallow Macrophyte‐dominated Systems with Zero Net Effect on Carbon Burial. Glob. Change Biol. 24, 5231–5242. doi:10.1111/gcb.14387
Weir, J. P. (2005). Quantifying Test-Retest Reliability Using the Intraclass Correlation Coefficient and the Sem. J. Strength Conditioning Res. 19, 231–240. doi:10.1519/00124278-200502000-00038
Wilkinson, M. D., Dumontier, M., Aalbersberg, I. J., Appleton, G., Axton, M., Baak, A., et al. (2016). The FAIR Guiding Principles for Scientific Data Management and Stewardship. Sci. Data 3, 160018. doi:10.1038/sdata.2016.18
Wimsatt, W. C. (2012). “Robustness, Reliability, and Overdetermination (1981),” in Characterizing the Robustness of Science: After the Practice Turn in Philosophy of Science, Boston Studies in the Philosophy of Science. Editors L. Soler, E. Trizio, T. Nickles, and W. Wimsatt (Dordrecht: Springer Netherlands), 61–87. doi:10.1007/978-94-007-2759-5_2
Wohlers-Zöllner, J., Biermann, A., Engel, A., Dörge, P., Lewandowska, A. M., von Scheibner, M., et al. (2012). Effects of Rising Temperature on Pelagic Biogeochemistry in Mesocosm Systems: a Comparative Analysis of the AQUASHIFT Kiel Experiments. Mar. Biol. 159, 2503–2518. doi:10.1007/s00227-012-1958-x
Wold, S., Ruhe, A., Wold, H., and Dunn, III, W. J. (1984). The Collinearity Problem in Linear Regression. The Partial Least Squares (PLS) Approach to Generalized Inverses. SIAM J. Sci. Stat. Comput. 5, 735–743. doi:10.1137/0905052
Keywords: nanosafety, mesocosms, nanoparticles, environment, ecotoxicity, statistics, database
Citation: Nassar M, Auffan M, Santaella C, Masion A and Rose J (2021) Robustness of Indoor Aquatic Mesocosm Experimentations and Data Reusability to Assess the Environmental Risks of Nanomaterials. Front. Environ. Sci. 9:625201. doi: 10.3389/fenvs.2021.625201
Received: 02 November 2020; Accepted: 10 May 2021;
Published: 31 May 2021.
Edited by:
Andrew Hursthouse, University of the West of Scotland, United KingdomReviewed by:
Monika Mortimer, China Jiliang University, ChinaCarmen Wolf, Institut für Energie und Umwelttechnik, Germany
Copyright © 2021 Nassar, Auffan, Santaella, Masion and Rose. This is an open-access article distributed under the terms of the Creative Commons Attribution License (CC BY). The use, distribution or reproduction in other forums is permitted, provided the original author(s) and the copyright owner(s) are credited and that the original publication in this journal is cited, in accordance with accepted academic practice. No use, distribution or reproduction is permitted which does not comply with these terms.
*Correspondence: Mohammad Nassar, mhammad.nassar@live.com