Techno-Economic Assessment Guidelines for CO2 Utilization
 Arno W. Zimmermann1
  Johannes Wunderlich1
  Leonard Müller2
  Georg A. Buchner1
  Annika Marxen1
  Stavros Michailos3
  Katy Armstrong4
  Henriette Naims5
  Stephen McCord4
  Peter Styring4
  Volker Sick6
  Reinhard Schomäcker1*
- 1Institute of Chemistry, Technische Universität Berlin, Berlin, Germany
- 2Institute of Technical Thermodynamics, RWTH Aachen University, Aachen, Germany
- 3Energy 2050, The University of Sheffield, Sheffield, United Kingdom
- 4UK Centre for Carbon Dioxide Utilization (CDUUK), The University of Sheffield, Sheffield, United Kingdom
- 5CO2 Utilisation Strategies and Society, Institute for Advanced Sustainability Studies (IASS), Potsdam, Germany
- 6The Global CO2 Initiative, The University of Michigan, Ann Arbor, MI, United States
Carbon Capture and Utilization (CCU) is an emerging technology field that can replace fossil carbon value chains, and that has a significant potential to achieve emissions mitigation or even “negative emissions”—however in many cases with challenging technology feasibility and economic viability. Further challenges arise in the decision making for CCU technology research, development, and deployment, in particular when allocating funding or time resources. No generally accepted techno-economic assessment (TEA) standard has evolved, and assessment studies often result in “apples vs. oranges” comparisons, a lack of transparency and a lack of comparability to other studies. A detailed guideline for systematic techno-economic (TEA) and life cycle assessment (LCA) for CCU technologies was developed; this paper shows a summarized version of the TEA guideline, which includes distinct and prioritized (shall and should) rules and which allows conducting TEA in parallel to LCA. The TEA guideline was developed in a co-operative and creative approach with roughly 50 international experts and is based on a systematic literature review as well as on existing best practices from TEA and LCA from the areas of industry, academia, and policy. To the best of our knowledge, this guideline is the first TEA framework with a focus on CCU technologies and the first that is designed to be conducted in parallel to LCA due to aligned vocabulary and assessment steps, systematically including technology maturity. Therefore, this work extends current literature, improving the design, implementation, and reporting approaches of TEA studies for CCU technologies. Overall, the application of this TEA guideline aims at improved comparability of TEA studies, leading to improved decision making and more efficient allocation of funds and time resources for the research, development, and deployment of CCU technologies.
Introduction
Reports by the Intergovernmental Panel on Climate Change (IPCC) and the US National Academies emphasize that meeting the global temperature goals of 1.5°C or even 2°C above pre-industrial levels will require the removal of carbon dioxide (CO2) from the atmosphere (IPCC, 2018; National Academies of Sciences Engineering and Medicine, 2019). Carbon Capture and Utilization (CCU) is an emerging technology field that can replace fossil carbon value chains with significant potential in emissions mitigation or even negative emissions (Mikkelsen et al., 2010; Artz et al., 2018; Kätelhön et al., 2019; Tanzer and Ramírez, 2019). CCU includes a variety of technologies that separate the greenhouse gas CO2 from point sources or ambient air and consume CO2 to make products or services, aiming to provide economic, environmental, and social benefits. CCU products include concrete (e.g., Lafarge, Carboncure), carbonate aggregates (e.g., Carbon8, MCI), fuels (e.g., Sunfire, SkyNRG), polymers (e.g., Covestro, Novomer, Econic), methanol (e.g., CRI) or carbon monoxide (e.g., Opus12) (CO2 Sciences and The Global CO2 Initiative, 2016; Zimmermann et al., 2017; Bushuyev et al., 2018). Even though CO2 is an abundant resource in the atmosphere, its economic capture and cost-effective use still require substantial research and development efforts. To advance further development of CCU requires allocation of funds and time resources primarily to economically promising technologies. It is therefore paramount to assess the economic viability of a process upfront using a detailed techno-economic assessment (TEA) in addition to an environmental assessment that is based on life cycle assessment (LCA). TEA is a methodology framework to analyze the technical and economic performance of a process, product or service and “includes studies on the economic impact of research, development, demonstration, and deployment of technologies” (SETIS ERKC, 2016), quantifying the cost of manufacturing and market opportunities.
For the related field carbon capture and storage, a set of international standards (ISO 27912–ISO 27919) has been developed that clarify the scoping and evaluation of CO2 capture systems (see ISO, 2016a). For CCU, TEA is reported to be commonly used in industrial companies following internal standards—however usually remains unpublished. Published CCU-related TEAs, such as government reports or academic papers, do not yet follow consistent approaches (Zimmermann and Schomäcker, 2017). In contrast to LCA, the number of publications is by orders of magnitude smaller for TEA, and overarching methodological standards are lacking. Most academic TEAs in CCU follow chemical engineering text books such as Peters et al. (2003); Sinnott and Towler (2009), and Turton et al. (2012). In recent years, CCU-relevant TEA-only approaches for example by Sugiyama (2007), Otto et al. (2015), and TEA-LCA-integrated approaches for example by Azapagic et al. (2016) and Thomassen et al. (2019) have been suggested. While providing great practices, the available approaches remain currently too generic, leaving a significant number of methodological choices open, or lack sector-specific guidance for CCU. The current discussion in scientific conferences, industry reports, and academic literature points out that comparing the economic viability or technological feasibility of the various CCU approaches, either of individual technologies or a system of technologies, is challenging and that the number of apples vs. oranges comparisons is high (Pérez-Fortes et al., 2014a; Naims et al., 2015; Roh et al., 2016; Yuan et al., 2016; Zimmermann and Schomäcker, 2017). The significant challenges in TEA for CCU development are the lack of transparency in assumptions and intermediate results as well as the lack of a generally accepted TEA standard; all of which make assessments and comparisons of CCU technologies difficult.
To address these challenges, thereby increase comparability and put decision making to advance CCU technologies on a rigorous and transparent basis, the first of a kind guideline for standardized TEA for CCU technologies was developed; the work presented here is a summary of this detailed guideline document (Zimmermann et al., 2018). The TEA guideline was developed based on an extensive literature analysis and in a co-operative and creative approach, weighing the various opinions and perspectives present in the field and striving for a consensus. The guideline further provides systematic, step by step guidance on how to produce sound comparisons and how to create and provide transparency, comparability, and reliability of TEA studies for CCU technologies. The TEA guideline was developed in parallel with a guideline for Life Cycle Assessment (LCA) in a one-year project by the partners RWTH Aachen, The University of Sheffield, IASS Potsdam and TU Berlin. Besides the detailed guidelines and this work, several additional publications are available: An overview of both guidelines (Armstrong et al., 2019), a summary LCA guideline (Müller et al., submitted), three worked examples for methanol, e-fuels and mineral aggregates (Michailos et al., 2018; McCord et al., 2019; Zimmermann et al., 2019).
Approach
The TEA Guidelines were developed in seven phases, literature analysis, workshop 1, creation of draft, workshop 2, revision of draft and expert review before they were published in an extended report, see Figure 1.
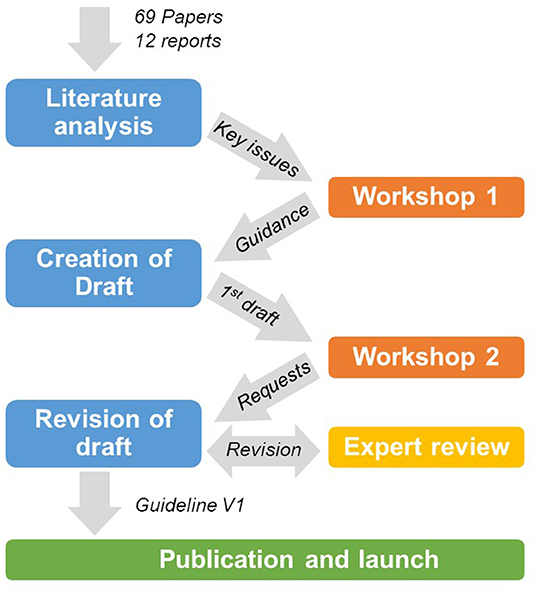
Figure 1. Development approach.
For the first phase of the TEA guideline development, literature analysis, a prior study that analyzed 29 papers (Zimmermann and Schomäcker, 2017) was extended following a similar approach; Literature was identified systematically through keyword search covering CO2 utilization and techno-economic assessment in the Web of Knowledge search engine. As in the prior study, a narrow and a broad search were carried out on September 6th, 2017 and resulted in a list of 219 peer-reviewed journal articles (“papers”) [for search terms see Appendix, for further description of literature selection (see Zimmermann and Schomäcker, 2017)]. Besides the 29 papers from the prior study, further 34 new papers, which focused on both CCU technologies and applied techno-economic assessment, were identified. Additional six relevant papers and 11 non-peer-reviewed publications (“reports”) that fulfilled the criteria but did not show up in the search results were added. Overall, 69 papers and 11 reports (see Table A1) formed the basis for analysis. Furthermore, relevant procedures and rules of standard literature were included (Peters et al., 2003; ISO 14044, 2006; Sinnott and Towler, 2009; EC-JRC, 2010; Turton et al., 2012). The literature analysis resulted in a systematic overview of assessment approaches, economic, technical and environmental assumptions, methods, and indicators applied. A list of 30 key issues for further discussion in co-creation workshop 1 was derived (see Figure A1). The relevant LCA phases and procedures of ISO 14044 and the ILCD handbook were adapted to TEA.
The second phase of the TEA Guidelines development was preparing, conducting, and evaluating workshop 1, a two half-day, in-person discussion meeting, hosted in November 2017 at IASS Potsdam. Four semi-structured discussion sessions were held on 30 key issues, one for each assessment phase, resulting in specific guidance for each of the key issues. The discussion group consisted of 5 project members and 10 external participants, which were invited based on their publications and presentations on techno-economic assessment in CO2 utilization. The group of 10 external participants represented a diverse set of backgrounds (40% industry, 40% academia, 20% policy).
The third phase was the drafting of the detailed guidelines, an iterative and interactive process, including all co-authors of this publication. The first draft was based on the literature overview, literature best practices, and guidance of workshop 1 and follow-up discussions on the 30 key issues.
The fourth phase was preparing, conducting, and evaluating workshop 2, a full day in-person discussion meeting hosted on April 10th, 2018, at TU Berlin. The session design used three groups, rotating through topical sessions on goal and scope, inventory, interpretation and reporting, presenting feedback, and discussing change requests independent of each other. Based on the documentation and recordings, 266 individual change requests were identified. Besides the 15 members of the project team, 34 external participants attended. External participants were invited as in workshop 1 based on prior work, representing a diverse set of backgrounds (26% industry, 38% academia, 35% policy).
The fifth phase was the revision of the detailed guideline draft, during which the 187 most urgent change requests were implemented. The remaining requests were left for the following version due to time constraints, but are currently under consideration in a follow-on project.
The sixth phase comprised of a written review from four leading academic researchers (“peer-review”), which was implemented in the revision of the draft. Finally, the detailed guideline document was published in the depository of the University of Michigan (Zimmermann et al., 2018) and launched at the ICCDU 2018 conference in August for a scientific audience as well as at the EIT house in Brussels in October 2018 for a policymaker and industry audience (IASS, 2018).
TEA Guidelines
Overview
This article presents the summary of the TEA Guidelines, including all required and recommended guideline rules, which are printed in bold:
• Shall rules, the minimum requirements to achieve a standardized assessment, and
• Should rules, the recommended requirements to produce an assessment of greater depth;
• Please note that the “may” rules are not covered in this article, but only in the detailed guideline document.
This work transfers and applies many concepts from ISO 14044 (ISO 14044, 2006) and the ILCD handbook (EC-JRC, 2010) to TEA. Following LCA, TEA is subdivided into the phases: goal and scope, inventory, calculation of indicators, interpretation, and reporting (see Figure 2); due to its importance reporting is counted as an own phase of the assessment. In the goal phase, practitioners define the goal for the overall study. In the scope phase, experts define what aspects to include and how to conduct the comparison. In the inventory phase, they collect all relevant data. In the calculation phase, experts specify the calculation procedure and produce the results. In the interpretation phase, practitioners evaluate the quality, consistency, and robustness of outcomes; while they carry out some aspects of interpretation throughout the study, they produce conclusions and recommendations only at the end. As TEA is an iterative process, practitioners will likely go back in loops, specifying and improving the assessment in each round. Finally, all phases and their outcomes are summarized in a TEA report (see Figure 2).
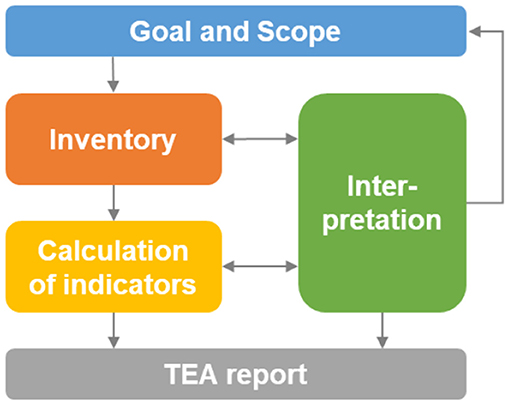
Figure 2. Phases of techno-economic assessment.
Goal
In the first phase, the goal of the study is defined, including the main questions, the context, the intended use, the limitations, and the audience of the analysis. The goal determines all other parts of the TEA study. While practitioners define an initial goal at the beginning of the work, they can refine or adapt it during the study—but with caution.
Perspectives and Principles of Assessment Goals
Prior studies and the here conducted analysis of CCU literature show that comparisons between TEA studies are often challenging (Zimmermann and Schomäcker, 2017), especially when comparing technologies of varying disciplines, markets, and technology maturities. First and foremost, all assessments need to be based on process concepts that are technologically plausible; for example, proposed concepts do not violate the laws of thermodynamics. Before the assessment, a “sanity check,” for example, checking kinetics as well as mass and energy balances, needs to be conducted by practitioners also synonymously described here as “experts.” As research, development, and deployment of CCU products involve a range of stakeholders, TEAs for CCU are typically conducted from different perspectives—in this report three different perspectives as specified: R&D, corporate and market (see Table 1). Each perspective targets a different audience and poses its specific questions, relevant for defining the assessment goal. When comparing product applications (e.g., is it more profitable to use methanol as a chemical or as a fuel? Is it more land-efficient to use algae for food or fuel?), the assessment needs to be carried out first by each application individually before a comparison can be carried out.
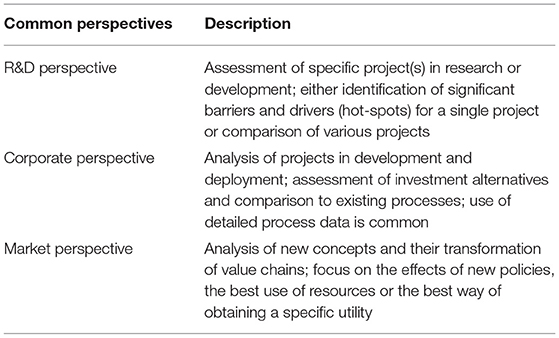
Table 1. Common TEA perspectives.
In summary and following the principles of LCA, goals of TEAs shall state clearly and unambiguously:
• The study context, especially comparison to what, location, time horizon, scale and partners
• The intended application and reasons for carrying out the study (e.g., decision support for R&D funding allocation, investment decisions or policy, and regulation; methodological studies)
• Target audience (e.g., R&D experts, funding agencies, investors, corporate management, policy makers, NGOs, journalists, the public)
• Commissioners and authors of the study (e.g., funding organization, university, company, individual)
• Limitations in the usability from assumptions or methods (e.g., time, location or specific use cases of the products).
Assessment Scenarios
As TEA studies are supporting decision making with long-term implications, especially for CCU products that often require substantial investments, scenario analysis can be a useful approach to investigate the impact of different core assumptions. Practitioners can define TEA scenarios either in the initial goal phase or when having reached the interpretation phase where experts identify key data for improvement and refine the study goal in another iteration (also see iterative approach in sections Data Quality and Uncertainty and Sensitivity Analysis). If scenario analysis is applied, all scenarios used for analysis shall be distinct and physically as well as economically plausible. Scenarios used should alter factors accounting for dynamic changes (e.g., analysis of various competing technology developments or consequences of large-scale technology adoptions, analysis of different potential states in future markets and regulation or societal acceptance). The base case scenario shall serve as a baseline for analysis extending current trends in terms of technology performance, sales prices, and volumes as well as policies and acceptance. Scenarios shall be developed in interaction with the stakeholders of the study to ensure they remain relevant to the audience. Scenario assumptions and data should be provided at open access to facilitate future work. The analysis and reporting of uncertainty for each scenario are essential and are further described in interpretation (see section Interpretation). If practitioners integrate TEA and LCA, they shall use the same set of scenarios. The LCA guidelines offer four scenarios (status quo, low decarbonized, high decarbonized, full decarbonized), which can serve as a helpful starting point for scenario definition (see LCA guidelines, Annex 10.1). For further reading on scenario analysis see Liu et al. (2008); Mahmoud et al. (2009); Amer et al. (2013).
Scope
Building on the goal, practitioners describe in the assessment scope what aspects of a product they will assess and how they will compare it to competing solutions. Significant activities in the scope phase are identifying the intended product application, the subject of analysis (product system) and in what dimension it is compared to other systems (functional unit), in what quantity it is compared to other systems (reference flow), further specifying the system (system elements), defining what is included and excluded from the assessment (system boundaries), selecting systems for comparison (benchmark systems), understanding how far the technologies are from market-entry (technology maturity) and what parameters and measures are used (criteria and indicators). From the scope, practitioners can derive the requirements for the following phases inventory, calculation, and reporting (ISO 14044, 2006; EC-JRC, 2010).
Product Applications and Functional Units
CCU product applications
In general, the product application shall be defined according to the study goal and documented clearly in the report. Potentially, CCU products can provide applications other than similar, conventional products (e.g., carbonation of mineral slags is waste treatment but also creates aggregates for cement). The definition of product applications depends on how many applications exist. For products with a small number of applications, practitioners should define one relevant application (e.g., fuels for transportation, polyols for foams). For products with a large number of applications or where the application cannot be specified, the product itself should serve as the application (e.g., methanol, or carbonate aggregates) and the expert should include a detailed description of the product (e.g., molecular structure and properties). For cases of multiple applications, a key question is how many can be carried out at the same time. If multiple applications can be carried out in parallel, practitioners should define a relevant “application-mix” (e.g., for multiple ash sources for CO2 mineralization). If only one of multiple applications can be carried out at a time, selecting only one application is sufficient (e.g., polyols for flexible or rigid foams, energy storage for household-scale or grid-scale).
The product applications should be defined specific to the market segment as it is recommended to compare products with equal performance. Comparing products with different performances is possible but requires a good understanding of price-performance correlations (e.g., market segments: low carbon footprint, commodities, and specialties). In corporate-perspective TEAs, practitioners should include a description of at least one customer group and their needs. They can classify customer needs as essential, desirable, and useful (Cussler and Moggridge, 2011). Fulfilling all essential user needs is obligatory for customer acceptance. Fulfilling a desirable user needs can provide a competitive advantage. Table 2 lists examples of CCU product applications and market segments.
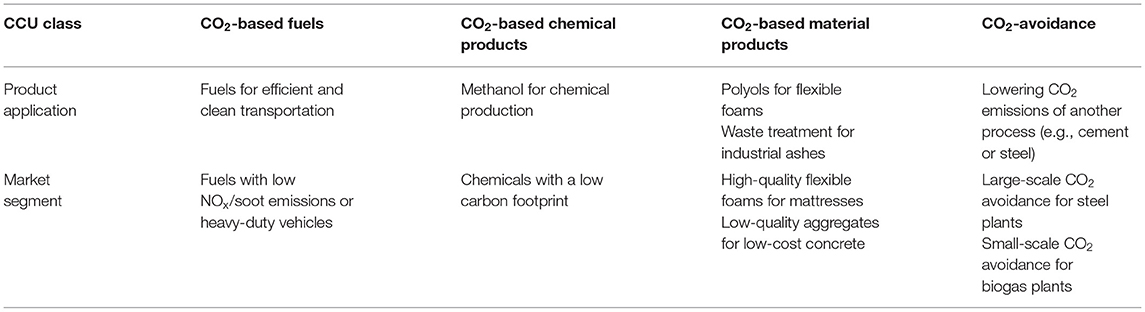
Table 2. Examples of CCU product applications and market segments (not exhaustive).
Functional units and reference flows
The functional unit is the dimension of how practitioners compare the reference system to a benchmark (e.g., mass or distance). The functional unit shall be defined according to the study goal and documented clearly in the report. The functional unit definition depends on product properties and the number of applications. For products with the same chemical structure, composition, or characteristics as benchmark products (“substitutes”), experts shall define the functional unit on a mass or energy basis. For products with a structure or characteristics different to benchmark products (“non-substitutes”), practitioners shall derive the functional unit from the product performance (e.g., performance of new power storage vs. existing solutions). The reference flow is the quantity of comparison (e.g., 1 kg, 1 MJ, 100 km), typically over a period (e.g., 20 years). The reference flow can be expressed either in a functional unit oriented way (e.g., 1 kg of polyol) or in a product-oriented way (e.g., per mattress, softcore, 180 cm width, 10-year durability) (EC-JRC, 2010). If the TEA study is conducted together with an LCA, the functional unit shall be consistent for both studies. Table 3 lists examples.
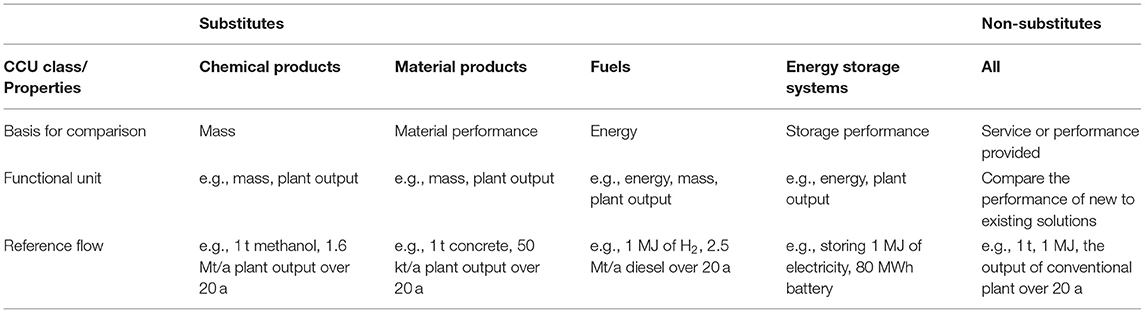
Table 3. Examples of CCU substitutes, the basis of comparison, functional units and reference flows.
Product Systems
Deriving a CCU product system and its elements
The “system boundary” defines the limits of the assessed product system and describes which system elements belong to it. Material flows and energy flows crossing the system boundary are referred to as “input flows” and “output flows” (see Figure 3).
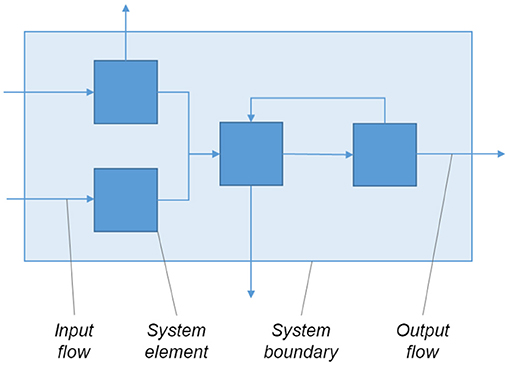
Figure 3. An exemplary product system with its elements, boundaries, input, and output flows.
When defining system elements, choosing an appropriate level of detail is crucial; Practitioners shall use process units as a basis for system elements (e.g., electrolysis, CO2 capture, methanol synthesis). The assessment should not only be carried out for the product system overall, but each system element individually, meaning that each system element should serve as the accounting unit for inventory, calculation, interpretation, and reporting. General guidance on defining the scope for product systems that include carbon capture is provided by the standards ISO 27912 and ISO 27919 (ISO, 2016a, 2018).
Deriving CCU product system boundaries
Overall, the system boundaries shall be consistent with the TEA goal and perspective. Practitioners can derive TEA system boundaries from two points of views: the perspective of the study and product properties. TEAs with an R&D or corporate perspective typically focus on product development and draw the system boundaries around the activities of a company (gate-to-gate). This approach resembles the cradle-to-gate approach in LCA as economic “impacts” of resource extraction are represented by input prices. TEAs with a market perspective can draw the system boundaries around a whole value chain involving multiple organizations, spanning from processing to the use phase and disposal. Such TEA gate-to-grave system boundaries are especially relevant for policy audiences.
Furthermore, TEA system boundaries need to be consistent with product properties. For substitutes, the use and disposal phases are likely to be the same as for benchmark products; a gate-to-gate approach is therefore sufficient. For non-substitutes, the indicator values could significantly change when including the use and disposal phases, due to a different structure and properties. This change should either be addressed by including price-performance correlations in gate-to-gate assessments which help to include rational decision making of users, or by extending the system boundaries to cradle-to-grave to include impacts from the whole life cycle (also see LCA Guideline, chapter C.4.2.1). If the intention is to integrate economic and environmental assessment, practitioners shall derive the system boundaries from the LCA Guidelines; also see Figure 4 for different boundary possibilities.
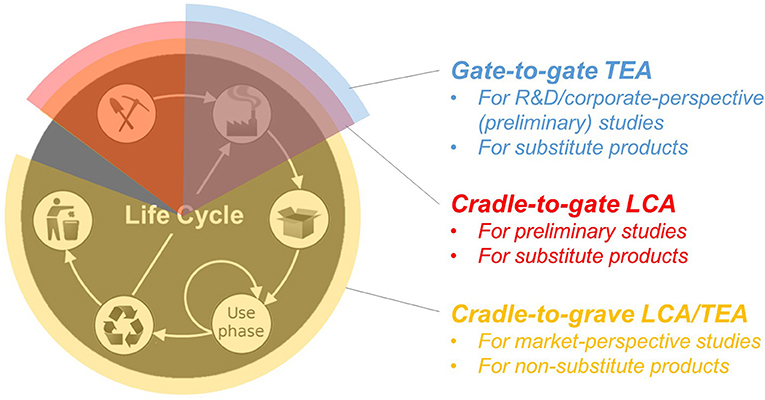
Figure 4. The scope of TEA and LCA in the product life cycle, adapted from von der Assen (2016).
The approach of Life Cycle Costing (LCC) can be helpful when extending the boundaries to cradle-to-grave (Swarr et al., 2011a; Sell et al., 2014; ISO, 2017). However, the high number and wide variety of LCC approaches lead to reduced comparability of the studies. Recent discussions of integrating LCC and LCA exist, which could be helpful when addressing an integrated techno-economic-environmental assessment with cradle-to-grave boundaries (see Swarr et al., 2011b; ISO, 2017; Miah et al., 2017; Dong et al., 2018).
Including or excluding CCU upstream processes in system boundaries
Common questions are whether to include or exclude CO2 capture, separation and transport processes, hydrogen or electricity production. Any exclusion does not mean that the study does not account for the upstream economic impacts, but that practitioners replace process-specific technical and economic data with average or generic data. Therefore, such exclusion cannot result in zero cost input flows, as it is unlikely that suppliers provide CO2 or H2 or electricity without charge.
The decision shall be made for each process individually to serve the assessment goal, data availability, data requirements, and the audience. In the case of an independent TEA, experts shall include any upstream process that lies in the focus of the assessment goal, that is required for linking other system elements, or that significantly contributes to the uncertainty of the results. If practitioners conduct TEA and LCA studies in parallel, CO2 capture, separation, and transportation shall be included in system boundaries (see LCA Guidelines chapter 4.2); other upstream processes shall follow the LCA principles. Following the iterative approach (see section Data Quality), it might be that an upstream process is excluded at first and added later when it becomes apparent that they significantly contribute to uncertainty. If this is the case, but practitioners exclude upstream processes nevertheless, they shall provide a reason.
Multiproduct systems
Product systems can have multiple raw materials or multiple products (also called multifunctionality). However, comparing systems with different products is challenging. For systems with multiple products, practitioners should take into account relationships and dependencies between products. When the system produces multiple products, such as coupled products, at the same time (dependent products), experts need to include all dependent products in the assessment (e.g., coupled products of water electrolysis—both, hydrogen and oxygen, need to be included). How to address multiproduct systems in TEA depends on the perspective of the study and whether the practitioners integrate TEA and LCA studies. If LCA and TEA studies are integrated, experts shall apply the same method for solving multiproduct systems. However, setting the system boundaries and creating the inventory can be challenging (see LCA Guidelines, chapter 4.3). If practitioners do not integrate TEA and LCA studies, their approach can follow any principle that ensures meaningful results. TEAs for multiproduct systems typically calculate indicators for all products combined without separating the indicator value for the particular products (e.g., calculating profits for a whole plant, including all products it makes). Another approach is allocation, where experts allocate a share of the result to each product following a key. One particular allocation approach is economic allocation, where, for example, the overall profit can be allocated to each product by the revenue that this product generates. However, an economic allocation is challenging in case of highly uncertain prices and therefore practitioners need to apply it carefully.
Presentation of a product system
Product systems, their elements, and boundaries shall be presented in a graphical scheme (see Figure 3), such as an extended block flow diagram. The required specifications for all input flows shall be described, including mass flows and their composition, energy flows, and their type of carrier, temperature, and pressure.
Benchmark Product Systems
The term “benchmark” is used for other products or services providing the same application. Benchmark product systems can have similar or different technologies compared to the reference product systems (e.g., thermochemical, electrochemical, biochemical or photochemical pathways) and belong either to existing technology regimes (e.g., CCU methanol compared to conventional methanol) or to new ones (e.g., transport by CCU fuel vehicles vs. battery electric vehicles). Essential for identifying and selecting relevant benchmarks is a good understanding of the product application (see section Product Applications and Functional Units). Benchmarks shall be selected and stated according to application and assessment goal. Customer needs should be used to identify where the product might have a competitive advantage (Cussler and Moggridge, 2011; Saavedra, 2016). Practitioners shall select the currently most common or “best in class” products as benchmark products; one or multiple products can be selected (e.g., comparing a CCU material to three materials available on the market). Besides, they should additionally include benchmark products that might be relevant in the future in the assessment (e.g., extending the prior comparison by two promising future material concepts).
Assessment Indicators
In the following “criterion” is referred to as a parameter in decision making (e.g., profitability), “indicator” as a representative measure for a criterion (e.g., net present value) and “method” as the way of generating an indicator (e.g., an equation for net present value). Practitioners derive the choice of criteria, indicators, and methods from the assessment goal and technology maturity, which needs to be defined before the assessment (Buchner et al., 2018, 2019). A lack of indicator standardization was demonstrated for CCU TEAs: A high number of indicators is currently used to evaluate one criterion, and different methods are applied to derive one indicator, representing a significant obstacle for comparison (Zimmermann and Schomäcker, 2017). Table 4 shows examples of criteria and indicators.
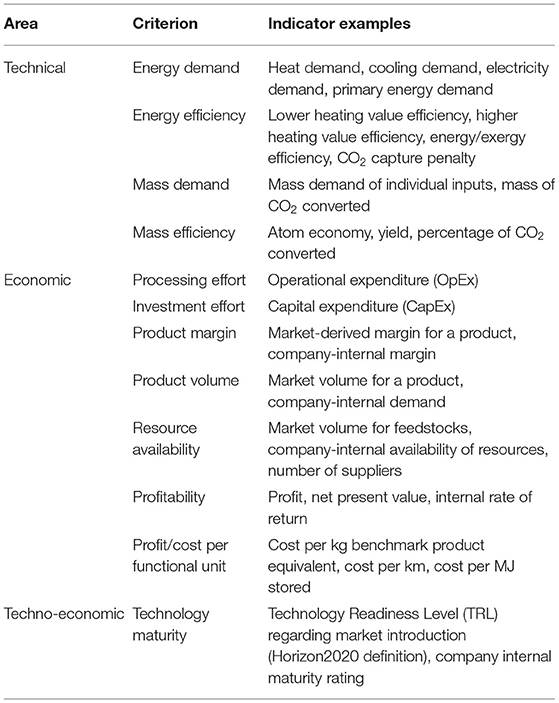
Table 4. List of example criteria and indicators.
Many TEAs use the indicators technology readiness levels (TRL), operational expenditure (OpEx), and capital expenditure (CapEx); however, the used definitions and calculation methods vary widely. The detailed guidelines cover definitions and methodological approaches of TRL, OpEx, and CapEx (for CapEx and OpEx see section Economic Indicators, for TRL see detailed guideline section A). Indicators and methods can be selected from the list presented above, or from the pool of indicators used in similar TEA studies or chemical engineering textbooks:
• General TEA indicators and methods for the chemical industry can be found here (Peters et al., 2003; Sinnott and Towler, 2009; Turton et al., 2012)
• Specific indicators for the assessment of early-stage technologies are discussed here (Sugiyama et al., 2008; Patel et al., 2012; Kabatek and Zoelle, 2014; Otto et al., 2015; Buchner et al., 2018)
• Specific indicators for the assessment of product systems including carbon capture are provided in the standards ISO 27912 and ISO 27919 (ISO, 2016a, 2018).
The selected indicators shall be compliant with the assessment goal (e.g., select cost and revenue indicators for a corporate-perspective TEA) and accessible for the intended audience (e.g., detailed indicators for researchers, aggregated indicators for politicians). As the goals for CCU TEAs relate to techno-economic questions, indicators from both fields should be selected. The selected indicators and methods shall be compliant with technology maturity, which indicates whether data is available and whether estimation methods can be used (e.g., approximated or measured energy demand for OpEx). With increasing maturity, the level of technical detail increases and the understanding of products, costs, and markets improve; overall data becomes more reliable and representative and estimation methods increase in quality. Depending on the maturity simpler or more complex indicators can be chosen (e.g., simpler static relative profit vs. more complex dynamic net present value).
Inventory
After the goal and scope phase, the inventory phase follows next. The general approach to establish the inventory model covers five interlinked phases: defining requirements for data quality, identifying relevant technical processes, collecting technical and economic data as well as documenting the collected data (see Figure 5). In this paper, data is described according to its type (process-specific, industry-average, or generic) and according to its sources (primary or secondary).
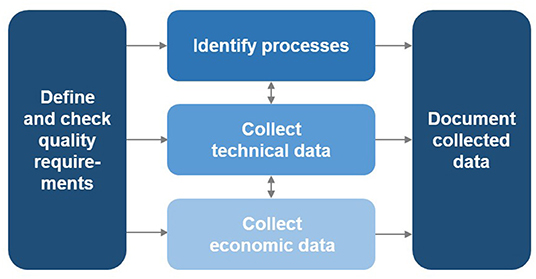
Figure 5. Five phases of TEA inventory creation.
Data Quality
First, practitioners shall define quality requirements for each data point—according to the assessment goal and scope (e.g., for methanol production– primary, process-specific data for the system elements of reaction and distillation, and secondary, average data for all other system elements). Second, data quality shall be checked and documented during data collection. The aim is to substantially reduce time and effort by first collecting high-quality data sets only when these contribute sensitively to the TEA result and second increasing data quality step by step until it matches the requirements (iterative approach). The iterative approach reduces effort by helping to identify and increase the quality of significant data points only. Sensitivity analysis and uncertainty analysis help to characterize each parameter during the inventory model creation (see section Uncertainty and Sensitivity Analysis).
In each iteration, practitioners should choose types and sources of data according to the quality requirements. In the first iteration, low data quality can be the starting point. In the second and following iterations, experts need to raise the quality requirements and collection effort where necessary (e.g., input price data from an open internet platform in the first iteration, from a commercial price database in the second iteration, and from a market study in the third iteration). If practitioners cannot improve data quality to a satisfactory level, they might not be able to answer the questions posed in the goal. Thus, they should either adjust goal and scope according to data availability or discontinue the study. In general, with increasing maturity of the assessed process, more process-specific and primary data should be used, as this data increasingly represents the projected process at the deployment stage. However, experts should use generic or average data from secondary sources, where sufficiently representative.
Practitioners should aim at collecting data available at the corresponding technology maturity: The technology maturity of a product system gives an indication, whether specific data points can be collected directly at high quality or need to be estimated. For CCU, where many early-stage technologies are under development, and for which relevant, high-quality economic data is not available, data estimation is particularly important. Based on the available data from the present technology maturity, the projected plant (TRL 9) is estimated. Practitioners shall state any problems with the acquisition of confidential data clearly.
Collecting Data
Overall, data collection shall follow data requirements, selected methods and indicators, and the defined assessment goal. As TEA aims to guide the improvement of the overall product system, but also of individual elements, the collection and documentation of data for each identified system element become necessary. The level of detail shall follow the identified processes based on the system elements.
Technical data comprises energy and material flows, process conditions, and equipment specifications, among others; practitioners obtain technical data primarily from process design. Economic data comprises of costs of equipment, prices of inputs and outputs as well as market information. Similar to technical data, economic data can be obtained from a variety of sources (e.g., quotes, databases, experts, literature) but in contrast validity is much more limited to the scenario (e.g., location of quote) and values can vary significantly between sources (e.g., internal company prices vs. market prices). When collecting data from different sources, practitioners should carry out harmonization, which means keeping uniformity and aligning assumptions (e.g., adapting data to the same year, continuous use of lower heating value). Where possible, technical and economic data shall be related to the functional unit and reference flow.
For analyzing the economic criteria, practitioners require data on cost, sales prices, and market volumes. In many cases, the cost of a plant is not available but needs to be estimated (see section Economic Indicators). For deriving the sales price of substitutes, a value-based approach is recommended; a cost-plus pricing approach can serve as an approximation. For the sales price of non-substitutes, a price-performance approach can be used. The market volume for substitutes can be derived from the market volume of benchmark products; estimating the market volume for non-substitutes can be challenging.
Practitioners shall describe the temporal and regional context of the study (e.g., value chain characteristics) as well as their related limitations and risks, and justify context-specific assumptions and parameters. If prices or market volumes are estimated based on similar studies, a reasonable overlap between temporal and geographical conditions is required, so limitations are not underestimated. For example, governmental regulations might strongly vary between locations and impact the feasibility of the product system (e.g., subsidies on feedstock, taxes, environmental regulations).
For economic data in the inventory model, input prices play a crucial role. It is, therefore, necessary to derive prices for input flows that cross the system boundaries. In some cases, it might be of additional interest to derive a price of a flow between system elements (e.g., the internal production cost of 1 kg of hydrogen via electrolysis as a basis for comparison to other production alternatives). Deriving an input price, in general, depends on three major factors: technical specifications, assessment boundaries, and location. First, the technical specifications of the input flow need to match the requirements by the product system, such as in quantity, quality, and development over time. If the input flow does not meet these requirements, practitioners need to change the input flow source or production technology, modify the system boundary, or change the system elements. For example, if an input flow does not reach the purity required by the product system, a purification step could be added to the product system. Second, practitioners need to define whether or not the source, production, or additional handling steps, such as purification, compression or heating, of a flow are included or excluded by the assessment boundaries. In the example, experts need to account for the added purification step in the assessment. Please note that if they include the source, production, and handling in the assessment, the discussed flow does not cross the system boundaries and is not an input to the product system, instead it flows between system elements; however, deriving a price for such flow can be of interest. Third, if practitioners define a specific location of the input source, the specific cost for transportation and storage can be used, otherwise applying average cost is sufficient. In the example, the production could be in the same industrial park, and experts could include simple transportation cost by pipeline.
Practitioners should also adapt the quality of price data and the number of sources to technology maturity. In early research and development stages, market-average price data should be used; typically, few secondary sources are sufficient. In development stages, experts should include market-average price data that is date and location specific; typically, secondary sources are still sufficient, but multiple sources need to be included. In deployment, practitioners should use process-specific data and primary sources. The detailed guidelines provide a further description.
If the technology maturity is low, experts have to include learning curves and improvements for the system elements, for both reference product systems as well as the benchmark systems; The cost reduction from building the first of a kind (FOAK) and nth of a kind (NOAK) plant needs to be taken into account (Rubin, 2014, 2016; van der Spek et al., 2017a,b)
Deriving a CO2 Price
Deriving a CO2 price depends on technical specifications, system boundaries, and location (see Figure 6). First, the technical specifications of flue gas source, CO2 capture, and utilization need to be consistent. Key factors are, for example, CO2 concentration or quantity. Furthermore, practitioners need to clarify whether the product system uses the CO2-containing flue gas directly or requires an additional purification step. Some CCU processes require concentrated and therefore typically more expensive CO2-containing flows, while others operate with less concentrated and therefore also typically less expensive ones as the purification step can be left out. If the specifications of the CO2-containing flow do not meet the requirements of the product system (e.g., too high impurities or too low CO2 concentration), practitioners can change the source or production technology or adapt the system boundaries or system elements, such as separation processes to the assessment. While experts should consider a source or supply with the lowest technically required concentration of CO2, they cannot only base the choice of emission source on the lowest price. Source and capture processes need to be critically reviewed, as these might cause higher environmental burdens compared to alternatives, requiring a proper LCA. A practice-relevant overview of flue gas qualities is provided in the standard ISO 27912 (ISO, 2016a).
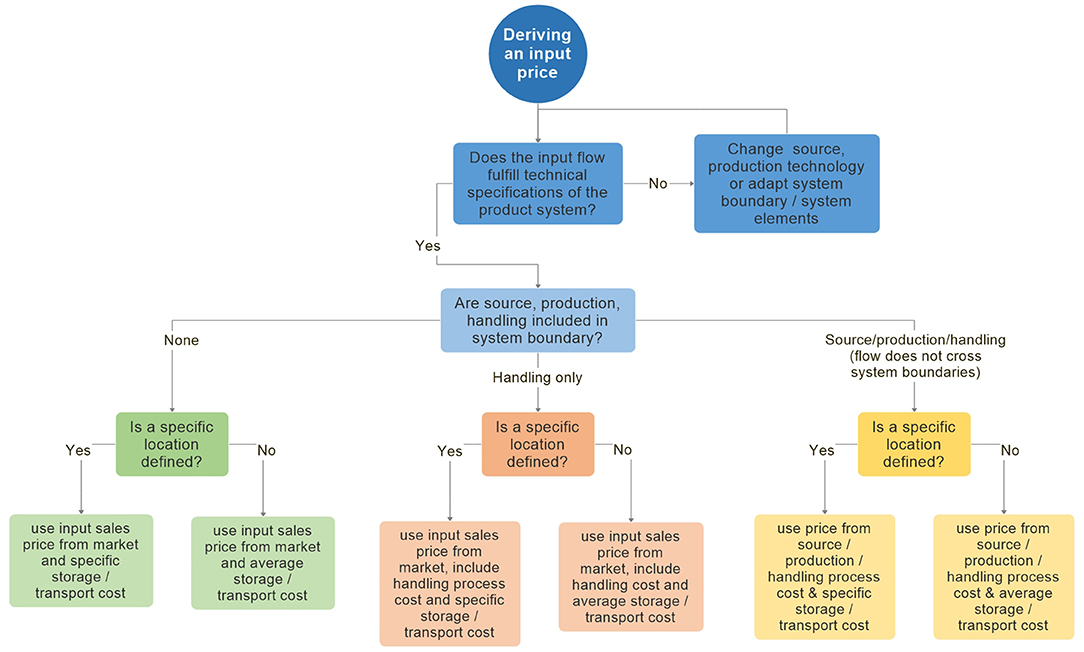
Figure 6. Deriving an input price.
Second, deriving a CO2 price is dependent on the system boundaries, meaning whether practitioners include or exclude CO2 source, capture, and compression from the assessment. The CO2 price shall be related to the assessment scope, especially to emission source and CO2 capture technology. When experts include CO2 capture in the system boundaries, the base case CO2 price shall represent the cost of capture and compression; the CO2 price shall be calculated based on the full process providing the CO2 stream. Including handling steps such as CO2 purification or compression in the assessment, also requires to include handling cost based on the process. When practitioners exclude CO2 capture, they should derive the base case CO2 price from a market price, which they can collect from a supplier quote.
Third, deriving a CO2 price is dependent on whether a specific location has been defined or not, meaning that assessments with a specified location require data of local CO2 sources, while others can be sufficiently assessed with regionally average data. If the assessment goal and scope define a particular location, a location-specific CO2 price shall be derived. When the practitioners exclude the CO2 capture from the system boundaries, a location-average price is sufficient, but the distance between the source and the utilization plant should be also considered. The CO2 price shall be estimated considering transport. Detailed guidance on pipeline transport of CO2 can be found in the standard ISO 27913 (ISO, 2016b).
One typical pitfall when deriving a CO2 price from literature is mixing up the cost of CO2 captured, and the cost of CO2 avoided. “Cost of CO2 captured” relates all processing cost of CO2 capture to the amount for CO2 available for utilization; practitioners shall report the cost of CO2 captured or otherwise include a statement. In contrast, “cost of CO2 avoided” (or “CO2 abatement cost”) relates all processing cost of capture and production to the amount of CO2 emissions avoided; “CO2 avoided” means the difference in CO2 emissions between the product system and the benchmark system. To calculate the quantity of CO2 avoided, life cycle assessment is required, underlining the active link between TEA and LCA.
In the inventory model and the TEA report, the key technological and economic assumptions for deriving a CO2 price shall be documented, such as:
• Technologies: capture, compression, transport and storage concepts, CO2 concentrations, flow rates, flow conditions
• Prices: process-specific or average, cost of CO2 capture
• Limitations: regional restrictions, reference year and applied transformation factors.
When deriving the CO2 price from literature, the reported values range from 5 USD/tCO2 to 180 USD/tCO2 (Metz et al., 2005; Zero Emission Platform, 2011; Lackner et al., 2012; Wilcox, 2012; de Coninck and Benson, 2014; Smit et al., 2014; Naims, 2016; Leeson et al., 2017), while the EU Prodcom database reports an EU-28 market average value of 78 EUR/tCO2 (70 USD/tCO2) for 2016 (Eurostat, 2018). Any selected cost data or cost ranges from literature shall be checked and harmonized to ensure the use of adequate assumptions, such as same units, same base year, appropriate scales, matching technology maturity and consistent boundary conditions.
This work refrains from recommending the use of regulatory adjustments or cost lowering mechanisms regarding the estimation of CO2 prices in the base case. Although specific examples of such mechanisms exist (e.g., emission trading schemes or carbon taxes), significant regional differences and future political decisions add to high underlying complexity. Including these mechanisms in the base case, would decrease comparability between TEAs, which is, therefore, not recommended. Instead, practitioners may consider the use of regulatory adjustments for additional scenarios to the base case.
Other Key CCU Inputs
Besides CO2, there are many more crucial inputs for CCU technologies, such as hydrogen, electricity, and mineral inputs, which are discussed in the following section. The detailed guidelines provide guidance on further inputs.
Hydrogen as an input
Hydrogen generation can have both substantial economic and environmental impacts for many CCU studies. Deriving a hydrogen price is, like any price, dependent on the three significant factors: technical specifications, system boundaries, and location (see Figure 6).
First, the technical specifications of hydrogen production need to be consistent with its consumption, which can be hydrogen concentration in the output stream, output quantity, or process durability. If not already completed in the maturity assessment, practitioners shall document the maturity of the underlying hydrogen production technology and discuss their current and future viability. Experts shall include a mature hydrogen production (TRL 9) as system element in the base case; future and low carbon footprint technologies should be included as scenarios (see Häussinger et al., 2011 and IHS Markit, 2015). When selecting the hydrogen production process, practitioners should favor “green” hydrogen generation and need to consider environmental trade-offs. If the specifications or the hydrogen-containing flow do not meet the requirements of the product system (e.g., too many impurities or too low process durability), practitioners can change the production technology (e.g., from alkaline electrolysis to PEM electrolysis), adapt the system boundaries or change the system elements (e.g., adding the separation of impurities).
Second, deriving a hydrogen price is dependent on the system boundaries, whether practitioners include or exclude hydrogen production from the assessment. If hydrogen production turns out to be a significant cost driver, data requirements are high, and therefore, experts should include hydrogen production in the system boundaries. If the hydrogen production is included, the hydrogen price shall be calculated based on the full process cost. If hydrogen production is excluded, practitioners shall use the input sales price from the market. Including system elements for handling (e.g., purification or compression) in the assessment, also requires to add process based costs for these handling elements.
Third, deriving a hydrogen price is dependent on the location. If a specific location has been defined (e.g., onsite production or delivery from within the industrial park) the storage and transport cost shall be included relating to this location. If a specific location has not been defined in greater detail (e.g., delivery by road from the Netherlands or shipping from Saudi Arabia) cost of transport and storage shall be included, but it is sufficient to use average cost. For hydrogen prices (also see Hart et al., 2015; IEA, 2015). In general, the hydrogen price shall represent the cost of production or a market price; hydrogen generation and compression shall both be represented in the price. All parameters, especially energy sources and prices, shall be clearly documented.
For transparency, hydrogen generation should be described systematically and in detail. Typical pitfalls when deriving hydrogen prices are:
• Assuming an optimistic future hydrogen production technology or a larger than currently feasible production scale in the base case scenario
• Selecting an inexpensive but environmentally impactful hydrogen production technology and omitting an analysis of the environmental trade-offs
• Assuming intermittent electricity input, but omitting technologic or economic trade-offs (e.g., OpEx vs. CapEx at different utilization rates, start-stop mechanisms).
Electricity as an input
Depending on the type of CCU technology, the consumption of electricity might contribute significantly to the economic performance or to the environmental impacts of the product system. Electricity production from renewable resources is of particular interest as it allows for a strong reduction of environmental impacts. Deriving the price for electricity is, as any input price, dependent on the three factors technology specifications, system boundaries, and location (see Figure 6). First, the technical specifications of electricity production need to match the requirements of the product system, especially in terms of availability over time and quantity. For example, in the case of intermittent electricity production, either the consuming system elements can handle intermittency, or an additional system element for electricity storage is required. The final choices of electricity production and potential storage technologies need to be clearly documented. Furthermore, a regional electricity grid mix should be included either in the base case or a scenario as this increases comparability. Second, deriving the electricity price is dependent on the system boundaries, meaning whether electricity production is included or excluded from the assessment. If electricity production is included, its price shall be calculated based on full process cost. If electricity production is excluded from assessment boundaries, the price shall be based on a market sales price, such as a spot price. There is extensive literature on electricity pricing, for example from Eurostat's Energy database and the US Energy Information Administration (see EIA U.S. Energy Information Administration, 2020; Eurostat Energy Database). Free or negative electricity prices can be assumed in additional scenarios but should not be included in the base case. Third, deriving the electricity price is dependent on the location of electricity production. If the location is defined, specific transportation cost can be included, otherwise using average transportation cost is sufficient.
Typical pitfalls when deriving electricity prices are:
• Excluding a scenario with grid mix electricity
• Assuming free or negative electricity prices in the base case scenario.
Minerals as inputs
Carbonation of minerals, as a CO2 utilization concept, generally works either with mined minerals (e.g., olivine, serpentine), mineral wastes (e.g., fly ash and steel slags), or using CO2 for concrete curing (see Pan, 2015). Deriving prices for mineral inputs follows, as any input price, the three factors technical specifications, system boundaries, and location (see Figure 6). First, the technical specifications of the mineral input need to match the requirements of the process; mineral conformation and impurities vary from site to site and might require an adaption of the product system and its elements. Therefore, the quality of raw material from the mining or waste site should be considered. In the case of treating waste, potential existing regulatory mechanisms rewarding waste treatment should also be considered. Second, deriving a price for mineral inputs depends on the system boundaries, especially whether and which steps for mining, transportation, handling/pre-reaction, and post-reaction are included in the assessment. For example, in many processes grinding and milling of the raw material is necessary to obtain the required particle size. Any system elements that are included within the system boundary should be assessed and documented clearly; prices need to be based on full process cost. For all excluded system elements, using market or regulatory prices is sufficient, but might be challenging to retrieve due to the strong regional variety and low transparency of these markets. Third, deriving the price of mineral inputs is dependent on the location. If the location is defined, specific transportation such as from the mine to the processing facility or from the processing facility to the construction site can be included, otherwise using average transportation cost is sufficient. In addition to the base case, scenarios with varying transport distances and energy sources should be included in the assessment.
Documentation of Data Collection
The documentation of inventory data represents the backbone of any assessment—strong documentation helps to assess effectively, troubleshoot quickly, and communicate efficiently. In the beginning, it is recommended to create a model or template with separate sections for an assessment summary, assumptions (separately for base case and scenarios, for technical and economic assumptions), flow data (separated by system elements), calculation of indicators and sensitivity, detailed individual calculations and finally references. Using such a template helps to document data while it is being collected and run several iterations for improving data quality. Technical and economic data should be documented based on system elements and based on the functional unit and reference flow while ensuring that the model can adapt if the reference flow is changed. Data uncertainty and potential regional or temporal context such as present in regional prices, currency exchange rates, or market sizes shall be included in the documentation. The comparability between assessment studies strongly depends on the units used for reporting results. Parameters shall be documented in SI-Units within the metric system, due to their broad acceptance and clear definitions. In the case that non-SI-units are used, a clear documentation and unit definition shall be provided. In addition, a conventional flow diagram consisting of system elements, mass, and energy flows may be extended by relevant TEA data, to visualize technical and economic parameters efficiently (“TEA flow sheet”). Errors in the inventory model often become apparent during documentation. TEA flow diagrams help to identify errors in mass and energy balances. Furthermore, the thermodynamic limitations of conversions need to be checked thoroughly. For the TEA report, economic data should be displayed in a separate list.
Calculation
Following the selection of indicators and the collection of data, calculation methods are selected, and the calculations conducted in the calculation phase. The results or model outputs serve as a basis for the interpretation. In this chapter, best practices for calculation are discussed first, followed by a more detailed description of economic indicators and approaches for normalization and weighting.
Best Practices
Indicator calculation best practices build on the inventory model: practitioners shall organize indicator calculation separately from inventory (in a different file or sheet) but link to it allowing indicators to update following changes of the inventory. Calculation shall be organized transparently listing all indicators and equations, relevant inputs and results for system elements individually as well as for the product system overall in SI-units or including a unit definition. Results should be organized separately (in a different file or sheet) from the calculation. If any data gaps remain, practitioners shall document them. Existing literature offers frameworks (Dysert, 2003; Lagace, 2006; Cheali et al., 2015; Buchner et al., 2018) and detailed descriptions of calculation methods (Peters et al., 2003; Sinnott and Towler, 2009; Turton et al., 2012).
Economic Indicators
Commonly used economic indicators are the investment cost indicator “capital expenditure” (CapEx), the processing cost indicator “operational expenditure” (OpEx) and profitability indicators, which are discussed below. CapEx and OpEx generate the cost of goods manufactured (COGM); addition of general expenditure (GenEx) results in the cost of goods sold (COGS). Profitability indicators can be calculated from COGS considering revenues and risk, as shown in Figure 7.
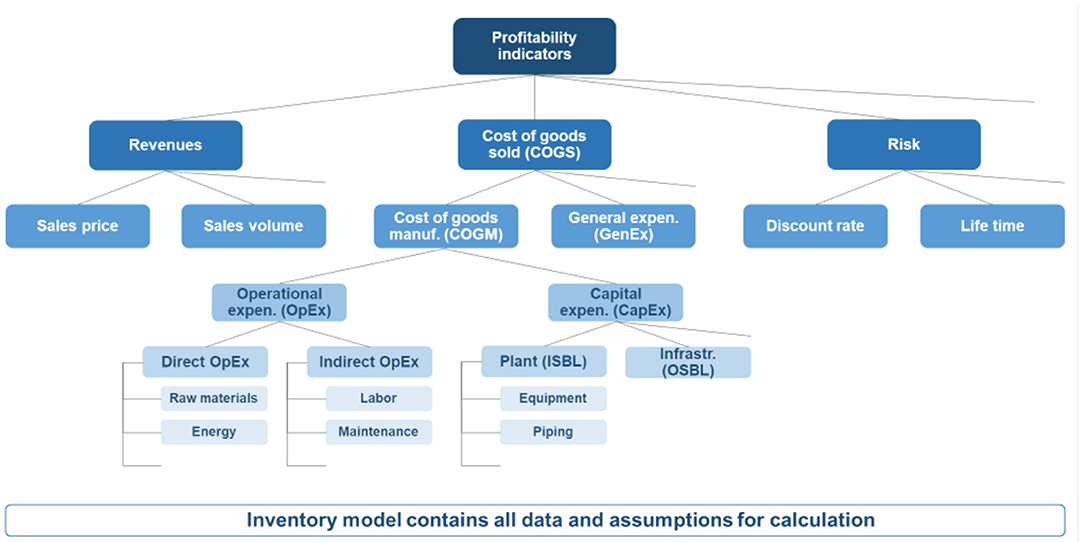
Figure 7. Calculation hierarchy for economic indicators, adapted from Buchner et al. (2018).
Capital expenditure
Capital expenditure (CapEx) is a key indicator serving the investment criterion in a techno-economic assessment. CapEx can either be interpreted directly or can be used for calculating further indicators such as COGM, COGS or profitability indicators, see Figure 7. CapEx comprises the initial investment for “designing, constructing, installing [and commissioning] a plant and the associated modifications needed to prepare the plant site” (Sinnott and Towler, 2009); working capital bound in the operation is often also included. CapEx includes investment for the core plant, “inside battery limits” (ISBL), and investment for connection and infrastructure, “outside battery limits” (OSBL). For orientation in selecting adequate methods, Table 5 provides an overview of typical CapEx estimation methods clustered by maturity phases and AACE International estimate classes (Christensen and Dysert, 2005).
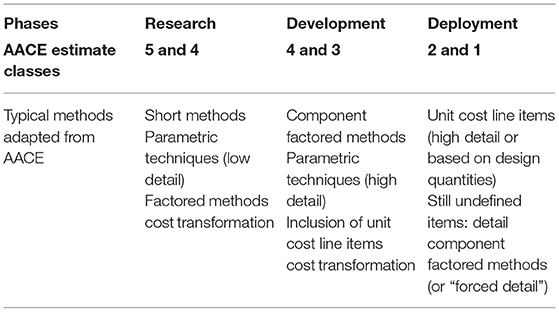
Table 5. Overview of typical capital expenditure calculation methods.
Calculating CapEx for CCU technologies is challenging as projects can vary widely in technologies making the choice of calculation method difficult. Furthermore, CCU projects are often in the research and development phase lacking detailed data and leading to significant uncertainty in CapEx estimates. Practitioners shall select CapEx calculation methods that comply with the goal and scope of the study. They should select CapEx methods that are as precise possible but only as precise as available data permits following the iterative approach; this means first using rough estimation, second identifying the key parameters and third selecting more accurate methods. CapEx methods common in literature should be selected, or otherwise, the use of uncommon methods shall be explained. A challenge for CCU technologies is that CapEx methods are typically based on company experience with fossil resource-based processes and emphasize individual technology parameters differently, leading to under- or overestimation. Therefore, multiple methods should be selected, helping to understand the uncertainty in the specific estimation case. For many CCU technologies, the practitioners can choose whether a component belongs inside or outside battery limits—experts should, therefore, state ISBL and OSBL components. For early to mid-maturity, OSBL cost should be calculated as a factor of ISBL cost. If high-quality data of similar plants or equipment is available, cost transformation should be applied; as the cost of each component scales differently, the scaling exponent needs to be defined for each component individually. At mid to high technology maturity, experts should analyze how the cost of the main components scale. Once a site is selected, OSBL should be estimated independent of ISBL and before building the plant; then all CapEx items should be estimated independently; extrapolation via factors needs to be avoided. Building on the inventory documentation, the practitioners shall state all additional assumptions, requirements, adjacent estimates used. The detailed guideline document discusses further optional CapEx calculation options, such as forced detail, learning curves and contingency and lowering of accuracy demands. A comprehensive CapEx estimation framework compliant with these TEA Guidelines is described in Buchner et al. (2018).
Operational expenditure
Operational expenditure (OpEx) is a key indicator serving the processing criterion in techno-economic assessment and can either be interpreted directly or used for calculating further indicators such as COGM, COGS and profitability indicators, see Figure 7. OpEx comprises all cost for production, including both variable (direct) cost such as raw materials or utilities and fixed (indirect) cost such as labor cost and maintenance. For orientation in selecting adequate methods, Table 6 provides an overview of typical OpEx estimation approaches clustered by maturity phases.
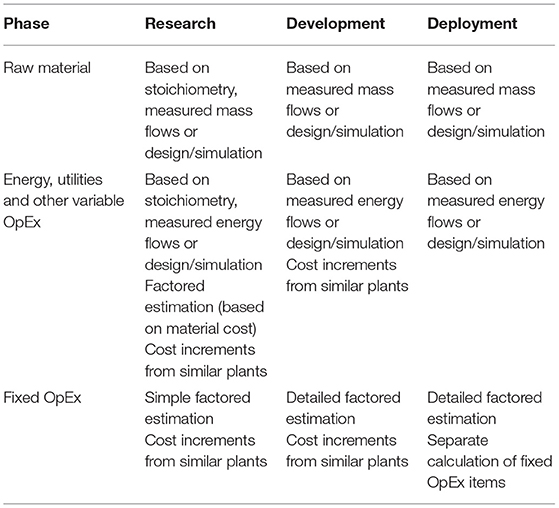
Table 6. Overview of typical operational expenditure calculation approaches.
The practitioners shall select methods that comply with the goal and scope of the study; factors for calculation, especially for fixed OpEx, should be carefully adapted to the defined scenarios. As for CapEx, experts should select OpEx methods that are as precise as possible but only as precise as available data permits following the iterative approach; the selected OpEx methods need to be suited to the technology maturity. OpEx methods common in literature should be selected, or otherwise, the use of uncommon methods shall be explained. In early research and development, experts should consider data from similar plants for energy, utility, and other variable OpEx as well as for fixed OpEx. In late research and development, as soon as fixed capital investment is available, factored estimation for fixed OpEx should be used. In deployment, before plant commissioning, all cost items should be calculated in detail for fixed OpEx. Building on the inventory documentation and as for CapEx, the practitioners shall state institution-specific assumptions, requirements, adjacent estimates.
Profitability indicators
Profitability indicators such as profit, net present value or internal rate of return serve the profitability criterion in techno-economic assessment, comprising of revenues, costs such as CapEx and OpEx and risk. Profitability indicators measure if, how much, and when money can be earned in comparison to an alternative investment (Ward, 2001).
As discussed for OpEx and CapEx, the practitioners need to select profitability indicators and methods that comply with the study's goal and scope that are precise and reasonable following the iterative approach and common in literature. As various calculation approaches exist even for the same profitability indicator, experts shall present equations and motivations for each indicator. Furthermore, the selected profitability indicators and methods need to be suited to the technology maturity; this work provides some additional guidance in the following: In the research phase, practitioners shall perform qualitative evaluation if a quantitative evaluation is not (yet) possible. When a mass balance is at hand, the shall calculate quantitative profitability indicators. Also, experts should normalize the profit calculated in order to facilitate concept comparison. In the development and deployment phase and when the addressable market volume is derived, practitioners shall calculate an absolute profit measure. Only following an advanced scenario description, experts shall introduce dynamic indicators; if dynamic indicators are required, the practitioners shall calculate the net present value. In dynamic calculations, quantifying the risk and selecting an adequate discount rate with a suitable risk profile poses a significant challenge. Rather than taking an average capital market interest rate, experts needs to select an interest rate representing an investment with the same risk profile. Many companies use their weighted average cost of capital (WACC) if the project's risk profile is similar to that of the company. The practitioners shall consider if a company's WACC applies to the project and adapt the WACC to the project's characteristics or obtain a discount rate from other models. The selected discount rate should represent the same risk profile as the product system. In the later development stages, different interest rates should be accounted for as the rates depend on the life span of the financing instrument. In the deployment phase, experts shall perform detailed economic simulations which consider the project's financial structure and should replace cost items with actual cash flows as soon as they are realized. For further information, see the detailed guideline document and Buchner et al. (2018).
Normalization and Weighting
As CCU technologies cover a broad range of chemistry fields (e.g., thermochemical, biochemical, electrochemical, photochemical) and include projects at varying technology maturity, normalization and weighting of results might be useful but has to be conducted carefully. Especially for CCU products with diverse technologies and markets, various trade-offs between different indicators and criteria exist (e.g., OpEx vs. CapEx, market price vs. market volume). Normalization and weighting are optional approaches for further processing of previously calculated indicators to facilitate interpretation and decision-making. Normalization is the comparison of different indicators by eliminating the units of measurement so that relations are depicted instead of absolute values. Normalization can be used for the comparison of different TEAs, to show relations within a single TEA or enable the combined presentation of indicators. Weighting is assigning quantitative weights to (normalized) indicators. Weighting also includes aggregating, which means adding up weighted indicators. Practitioners have to normalize indicators with different dimensions (preferably to dimensionless indicators) before they can aggregate them. While indicators that have the same dimension and are based on the same assumptions do not require prior normalization. Nevertheless, this work recommends normalization in order to create a common basis and scale. However, if practitioners or the audience only consider the results, both normalization and weighting can lead to a loss of information. Normalization and weighting schemes are specific to technologies and projects; they include subjective choices and have to be carried out with great caution.
Interpretation
Interpretation is conducted in parallel to all TEA phases checking quality, consistency, completeness, and reliability of the inventory data (model inputs) and associated intermediate or final results (model outputs) in relation to goal and scope of the study. Key activities during the interpretation phase are conducting uncertainty and sensitivity assessments, interpreting results, and producing a multicriteria decision analysis, all of which are discussed below. The outcomes of the interpretation phase are conclusions and limitations which serve as a basis for decisions and recommendations for future research, development, and deployment.
Uncertainty and Sensitivity Analysis
Practitioners shall provide conclusions, limitations, and a basis for recommendations in the report—which actively build on the analysis of uncertainty and sensitivity. This work recommends the following procedure to analyze the uncertainty and sensitivity of calculated indicators:
1. Characterization of uncertainty
2. Uncertainty analysis
3. Sensitivity analysis
4. Improving data quality iteratively.
First, the practitioners need to characterize uncertainty. Uncertainties can occur in the categories: input, model, and context. Input data uncertainty may result from errors of measurement, from probability distributions of variables, or from estimations with low accuracy. Model structure and process uncertainty may result from limitations of how well the model reflects the observed system. Context uncertainty may result from methodological choices in the goal and scope phase (Saltelli, 2002; EC-JRC, 2010; Igos et al., 2019).
Second, practitioners conduct uncertainty analysis, relating uncertainties from model input, the model itself, or the context on the model outputs. Uncertainty analysis thereby becomes a quality test by considering all sources of uncertainty and validating whether the model output supports the underlying decision process. Input data uncertainty is typically analyzed quantitatively through intervals (ranges with upper, mid and lower bonds), variance, probability distributions, possibility distributions, or fuzzy intervals (Saltelli et al., 2000; Igos et al., 2019). If data is available to derive probability distributions, using probabilistic methods is recommended. Probability distributions are assigned to a set of input variables and are passed through a model (or transfer function) to obtain the distributions of the resulting output. A comprehensive uncertainty propagation method is Monte-Carlo-Analysis. Probability distribution approaches require a good knowledge of the probability distribution functions of the variables—this is often not the case at early technology maturity. Especially in early maturity, qualitative methods can be helpful, for example, degree of confidence approaches such as the pedigree matrix (Fernández-Dacosta et al., 2017). Practitioners can analyze model structure uncertainty by validating the model outputs with measured data or data from similar systems. Context uncertainty can be analyzed by identifying different scenarios and comparing the results or comparing model results with real observations. Scenarios are first defined in the goal phase but might be adapted, or further scenarios might be added when reaching the interpretation phase, after identifying key variables that have a significant influence on the model output (e.g., different energy mixes and their respective prices or different system boundaries and associated costs and prices). Scenario analysis goes beyond considering the parameters' known uncertainty ranges but instead considers possible future events on a broader scope. Overall, uncertainty analysis shall be conducted. Practitioners shall select and analyze one or more output variables or indicators and identify output uncertainty.
Third, practitioners conduct a sensitivity analysis, studying how sensitive the model output is to variations of one or more model inputs. Sensitivity analysis is complementary to uncertainty analysis—it reveals how the uncertainty of the output is constructed and discloses critical input variables that can contribute most to the uncertainty (Saltelli et al., 2000). This work discusses two kinds below: local and global sensitivity analysis. Local sensitivity analysis often also called 'one at a time' method, describes a variation of one input variable around a base value keeping all other input variables fixed. One kind of local sensitivity analysis is threshold analysis, where the smallest or highest value of an input variable is studied that is sufficient to cause a recognizable alteration in the model results that would change the decision. Global sensitivity analysis describes the investigation of how the variation in the model output can be attributed to variations of all input variables. Global sensitivity analysis should be applied to analyze the effects on the output of both individual inputs and interactions between the input variables. Practitioners shall conduct sensitivity analysis and identify key variables. For quick screening purposes or at early technology maturity, practitioners should conduct a local sensitivity analysis and a threshold analysis for critical variables; a discussion of hotspots, for example, in process design can also be helpful. It is recommended to focus interpretation at early technology maturity on informing about next steps in R&D, rather than on recommending whether to continue or cancel a technology development. If the goal is to cover the whole parameter space, a global sensitivity analysis should be conducted.
Fourth, practitioners aim at improving input data iteratively by identifying key variables from the results of uncertainty and sensitivity analysis. Experts then prioritizes data according to (lack of) quality and sensitivity. High priority should be placed on data with both a significant lack of data quality and high sensitivity (see Figure 8). If practitioners cannot improve data quality, an overall high uncertainty of results can remain; this needs to be documented (Lagace, 2006). Experts should focus on the improvement of data with substantial contribution and sensitivity on the overall result.
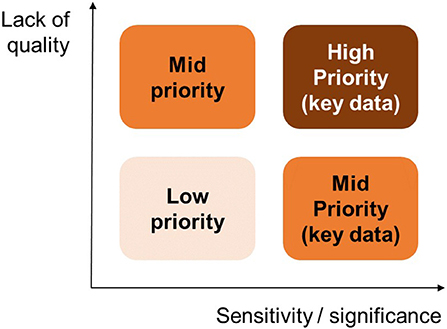
Figure 8. Priority setting for improving data for inventory, adapted from EC-JRC (2010).
Interpretation of Indicators
To address the assessment goal, in particular its central questions and tasks, the criteria selected in the study need to receive an indication, meaning a positive, negative, or indifferent evaluation. Practitioners derive such an indication for each criterion from the interpretation of the corresponding indicators. Indicators, in particular the ones without an inherent comparison, shall be interpreted by comparing the indicator value of the product system in focus to one or multiple benchmark values. Some indicators (e.g., internal rate of return, net present value) already include a comparison and provide an evaluation within the calculation; such comparative indicators can be additionally set into relation with further alternatives if required by the assessment goal. If the practitioners use the indicator “internal rate of return” (IRR), interpretation of IRR shall be only conducted together with an absolute profitability indicator without an inherent comparison, such as profit. Overall, the interpretation of any indicators shall be made in compliance with their definition, especially according to limitations. Furthermore, indicators shall be interpreted according to the specifications set in goal and scope. For example, if the goal defines a threshold value, the difference of calculated and threshold value is to be evaluated. Finally, interpretation shall be conducted independently from a subsequent decision making step.
Practitioners should interpret uncertainty ranges of indicators if different alternatives exist. The interpretation of uncertainty ranges of multiple alternatives strongly depends on the practitioners' risk preferences, meaning if the expert is risk seeking or risk averse. Risk preferences may be documented and accounted for as a separate parameter in multicriteria decision analysis. Alternatively, a threshold value within the uncertainty range can be defined under (or above) which the expected values are accounted for with a defined factor.
Multicriteria Decision Analysis
Following uncertainty and sensitivity analysis, and the interpretation of indicators, practitioners usually identify a spectrum of criteria relevant for decision making; this whole spectrum should be presented to decision makers. If the goal defines more than one objective and requires to study trade-offs between different targets, multicriteria decision-making (MCDA) can be a helpful approach. MCDA is a method for supporting decisions that involve multiple dimensions, such as economic, social, and environmental criteria, and allows to evaluate trade-offs systematically (Wang et al., 2009). Two categories exist: Multiple Attribute Decision Making (MADM), a ranking approach with finite solutions, and Multiple Objective Decision Making (MODM), a design approach with infinite solutions.
MADM allows studying a discrete decision space and a predetermined set of alternatives. MADM methods use normalization and weighting in order to rank alternatives according to preferences. If applied, MADM shall include a wide range of technical and economic criteria, also see Figure 9, left.
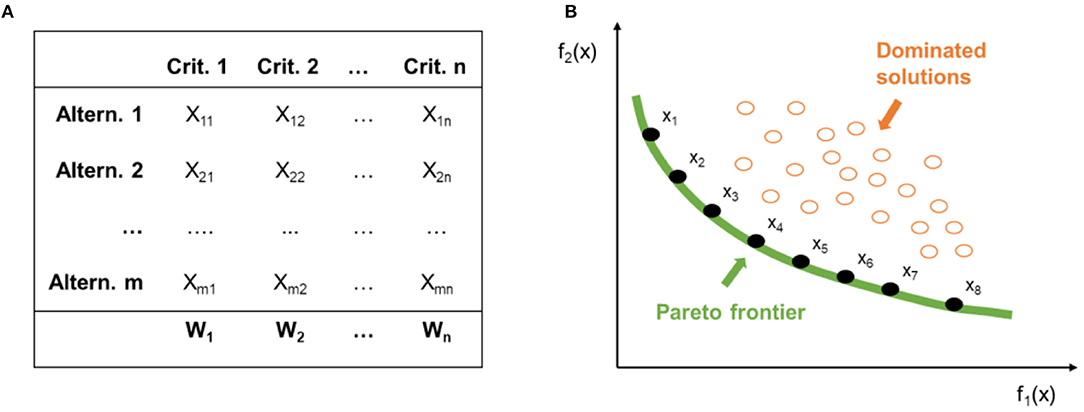
Figure 9. (A) Common structure of a MADM; (B) two-objective MODM, showing Pareto frontier and dominated solutions.
In contrast, MODM allows studying a continuous decision space providing a group of solutions called the “Pareto optimal set.” MODM may be used to identify and display all trade-offs among the investigated indicators. If MODM is applied, conflicting concepts shall be analyzed which means that achieving the optimum for one objective requires some compromise on one or several other objectives, also see Figure 9 (Hwang and Yoon, 1981; Triantaphyllou et al., 1998; Kahraman, 2008). MADM and MODM can also be applied to analyze trade-offs between LCA and TEA results, which is especially relevant if practitioners integrate both studies.
Reporting
The relevant approaches and results of all prior phases are documented in the TEA report, where practitioners present their findings to an audience. Good reporting practice is vital, as the TEA can only be of value if the audience understands it. A good practice is a TEA report that presents the work comprehensively, clearly and related to the goal of the study, thereby addressing the needs of the audience; a TEA report needs to be more than a mere presentation of indicator values. The requirements of the audiences vary, and thus, the corresponding reporting style and content can take numerous forms.
Audiences
The different TEA perspectives, R&D, corporate, and market perspective (see section Perspectives and Principles of Assessment Goals), target different audience groups. R&D experts and funding agencies are a typical audience for R&D perspective TEAs. R&D experts demand detailed technical information and the use of specific terminology; they use TEA reports for technical feedback and planning the next steps in R&D. Funding agencies and political analysts require intermediate level technical information and, also, a summarized description of social and economic benefits. Funding agencies and political analysts use TEA reports for funding decision making and communication to governmental or public stakeholders. Company managers or investors are the typical audiences for corporate perspective TEAs. They require a summary and a detailed report, including detailed economic indicators and also technical indicators at an intermediate level; it is recommended to introduce technical terminology. Managers and investors use TEA reports for funding decision making and project management. Policy audiences, i.e., lawmakers, associations, or NGOs, as well as journalists, are the general audiences of market perspective TEAs. This group demands information on broader economic, societal, and environmental impacts—creating a need for the integration of TEA, LCA, and social impact assessment. Policy audiences require a summary and a main report and use TEA reports for designing policy creating long term opportunities or barriers for the technology. Journalists typically demand summarized reports in an easy to understand language; journalists use TEA reports to inform the public and shape opinions, overall influencing acceptance or resistance of the public. In general, TEA reports need to be tailored to the audience's requirements. Any report shall use clear language to avoid misinterpretations, particularly in summaries and should take into account the terminology and language commonly known for the audience.
Reporting Styles
The report may take numerous styles (e.g., scientific article, investor pitch, media briefing); the perspective and target audience set the outline for the reporting style. In general, reports should include a summary in written form (such as an executive summary) and a technical summary in table form (see detailed guideline document, TEA section, Table 16 Annex). Such technical table summary enables the reader to access the data used in the assessment easily. The results should be presented for the overall system, as well as for individual system elements. Such presentation allows the audience to understand the impact of individual system elements and identify where technology advances would create the most significant benefits. Finally, the report should list the names and backgrounds of the practitioners that carried out the study and include a description of whether and how a review was conducted.
Content
Once practitioners have identified the report audience and style, they can select the relevant content. Overall, the TEA report shall cover all phases of the study: goal, scope, inventory, assessment, and interpretation. In particular, the report shall present all assumptions, data, methods, results, recommendations, and limitations transparently and as detailed as possible given the audience and style of the report. Furthermore, data sources and references need to be stated to guarantee reproducibility and traceability. If experts seek compliance with the TEA Guidelines version 1, they shall use the provided reporting checklist. Practitioners need to take great care when preparing the content of reports that aim to prepare major decisions, may they be for policy or investment. To avoid misinterpretation, uncertainty and sensitivity of results need to be reported, in particular, all critical variables and their effects on the model result (Igos et al., 2019).
TEA reports for CCU technologies often face challenges in enabling the reader to understand the terminology and to make sense of the assumptions and context of results. First, the terminology can be unknown to the audience and easily confused as it is often the case for “amount of CO2 used” and “amount of CO2 avoided”; practitioners need to ensure that the report terminology is well defined and easy to understand for the audience to improve understanding. Second, switching assumptions or including new scenarios can lead to a drastic change of study results, such as switching from a continuous CO2 policy scenario to a policy change or from stable electricity supply to intermittent supply; to improve understanding, experts could present the changes in results clearly and discuss the limitations of the chosen assumptions. Third, audiences often struggle to understand the context of the results including input and output flows, such as the often large energy requirements or the market size compared to the production capacity; to improve understanding, practitioners could provide comparisons with existing real-world examples such as the number of wind turbines.
Discussion
This work presents a systematic and holistic approach of how to conduct techno-economic assessments for carbon capture and utilization technologies. The work summarizes the current state of the art, building on a broad literature review, institutional reports and the feedback of more than 50 experts from industry, academia and policy that was collected through a series of workshops and resulted in a detailed TEA and LCA Guidelines document (Zimmermann et al., 2018) that enables transparent and comparable assessments.
The TEA guidelines define a robust framework that has received global attention since its release in 2018. The guidelines represent the summary of the current discussion. However, some concepts are still subject to change; the authors see the guideline as a living document and invite all users to contribute to updating the document. As next steps, five aspects should be addressed: First, to build on the acceptance of the first version of the detailed guidelines document (Zimmermann et al., 2018) it could be used to inform the development of an ISO standard. Second, the goal and scope of both TEA and LCA assessments remain different, assessments are currently not aligned, and thus, results have to be interpreted individually for each assessment. Stronger alignment between both TEA and LCA would be beneficial, in fact, crucial, in particular, for the identification of trade-offs between environmental and economic indicators. Third, in many cases CCU technologies promise to reduce environmental impacts and achieve costs competitiveness. This evaluation can, however, be challenging for early-stage technologies because the availability of quantitative and scalable data is low at these stages. For this reason, further methods to assess the potential for technologies with low maturity are needed. Fourth, the technical terminology, length, and reporting complexity of TEA and LCA reports have been identified to be a significant challenge for policy audiences that aim to derive policies. Therefore, guidance on how to commission and understand TEA and LCA results for policy audiences as well as detailed guidance for practitioners on how to produce TEA and LCA reports for a particular target audience must be subject to future research. Fifth and finally, these TEA guidelines were designed for carbon capture and utilization technologies, which include a variety of technologies, including thermochemistry, electrochemistry, photochemistry, and many more. Fundamentally, the applicability of these guidelines for TEAs outside of CCU is expected but will have to be demonstrated.
Conclusion
The principal goal of this work was to develop unifying guidelines on how to conduct as well as report rigorously and transparently techno-economic assessments (TEA) for carbon capture and utilization (CCU) processes. To meet this need, a harmonized TEA assessment guideline for CCU was developed in an international effort as presented in this paper. The work includes approaches for improved comparisons, such as guidance on technology maturity, on defining system boundaries or on identifying benchmark systems. This work further provides guidance for increasing transparency and comparability, such as guidance on the interpretation of uncertainty and sensitivity as well as best practices for reporting. To the best of our knowledge, this guideline is the first TEA framework with a focus on CCU technologies and the first that is designed to be conducted in parallel to LCA due to aligned vocabulary and assessment steps. A combined and broadly reviewed detailed guidelines document that also includes detailed guidance for life cycle assessment (LCA) was made publicly available (Zimmermann et al., 2018) and has found broad dissemination. In the process of developing and disseminating the guidelines document, the authors identified additional needs and opportunities. Subjects for future work are further harmonization with related efforts and eventually the development of a global standard, extended alignment or even integration of TEA and LCA providing detailed guidelines, further guidance on early maturity technologies and on addressing policy audiences as well as the application of this TEA framework on technologies beyond CCU. This work, therefore, extends the LCA CCU framework, the detailed TEA and LCA Guidelines and the worked examples, current literature, improving the design, implementation, and reporting of TEA studies. Overall, the application of this TEA guideline is expected to lead to improved transparency and decision making for the development of climate mitigating, negative emission CCU technologies.
Author Contributions
AZ, JW, LM, GB, AM, SMi, KA, HN, SMc, PS, VS, and RS were involved in the conception and the revision of the article. AZ carried out the writing, and summarizing the detailed guideline document, which is composed of contributions of all authors. All authors approved the final version of the article and agreed to be accountable for what it contains.
Funding
Funding for this work from the European Institute of Technology (EIT) Climate-KIC grant numbers 190204, 180409, and 180426-A1803 and by The Global CO2 Initiative is thankfully acknowledged.
Conflict of Interest
The authors declare that the research was conducted in the absence of any commercial or financial relationships that could be construed as a potential conflict of interest.
Acknowledgments
The authors would like to thank Till Strunge (TU-Berlin/IASS) for his support in the literature review as well as Issam Dairanieh (formerly The Global CO2 Initiative), Sira Saccani (EIT Climate-KIC) and Ted Grozier (formerly EIT Climate-KIC) as well as all participants of the co-collaboration workshops and reviewers for their fruitful discussions and feedback.
Supplementary Material
The Supplementary Material for this article can be found online at: https://www.frontiersin.org/articles/10.3389/fenrg.2020.00005/full#supplementary-material
References
EIA U.S. Energy Information Administration (2020). Available online at: https://www.eia.gov/ (accessed July 4, 2019).
Eurostat Energy Database. Available online at: https://ec.europa.eu/eurostat/web/energy/data/database (accessed July 4, 2019).,
Abdelaziz, O. Y., Hosny, W. M., Gadalla, M. A., Ashour, F. H., Ashour, I. A., and Hulteberg, C. P. (2017). Novel process technologies for conversion of carbon dioxide from industrial flue gas streams into methanol. J. CO2 Util. 21, 52–63. doi: 10.1016/j.jcou.2017.06.018
ADEME ENEA Consulting, EReIE, and ICPEES. (2014). Chemical Conversion of CO2 Overview Quantification of Energy and Environmental Benefits. Angers.
Agyeman, S., and Ampadu, S. I. (2016). Exploring the techno-economic feasibility of mine rock waste utilisation in road works: the case of a mining deposit in Ghana. Waste Manage. Res. 34, 156–164. doi: 10.1177/0734242X15611739
Albrecht, F. G., König, D. H., Baucks, N., and Dietrich, R.-U. (2017). A standardized methodology for the techno-economic evaluation of alternative fuels – a case study. Fuel 194, 511–526. doi: 10.1016/j.fuel.2016.12.003
Al-Qayim, K., Nimmo, W., and Pourkashanian, M. (2015). Comparative techno-economic assessment of biomass and coal with CCS technologies in a pulverized combustion power plant in the United Kingdom. Int. J. Greenh. Gas Control 43, 82–92. doi: 10.1016/j.ijggc.2015.10.013
Amer, M., Daim, T. U., and Jetter, A. (2013). A review of scenario planning. Futures 46, 23–40. doi: 10.1016/j.futures.2012.10.003
Armstrong, K., Zimmermann, A., Müller, L., Wunderlich, J., Bucher, G., Marxen, A., et al. (2019). “5. Techno-economic assessment and life cycle assessment for CO2 utilisation,” in Fundamentals, eds M. North and P. Styring (Berlin; Boston: De Gruyter), 63–78. doi: 10.1515/9783110563191-005
Artz, J., Müller, T. E., Thenert, K., Kleinekorte, J., Meys, R., Sternberg, A., et al. (2018). Sustainable conversion of carbon dioxide: an integrated review of catalysis and life cycle assessment. Chem. Rev. 118, 434–504. doi: 10.1021/acs.chemrev.7b00435
Atsonios, K., Panopoulos, K. D., and Kakaras, E. (2016). Investigation of technical and economic aspects for methanol production through CO2 hydrogenation. Int. J. Hydrog. Energy 41, 2202–2214. doi: 10.1016/j.ijhydene.2015.12.074
Audus, H., and Oonk, H. (1997). An assessment procedure for chemical utilisation schemes intended to reduce CO2 emissions to atmosphere. Energy Convers. Manage. 38, S409–S414. doi: 10.1016/S0196-8904(96)00303-2
Azapagic, A., Stamford, L., Youds, L., and Barteczko-Hibbert, C. (2016). Towards sustainable production and consumption: a novel DEcision-Support Framework IntegRating Economic, Environmental and Social Sustainability (DESIRES). Comput. Chem. Eng. 91, 93–103. doi: 10.1016/j.compchemeng.2016.03.017
Barbato, L., Centi, G., Iaquaniello, G., Mangiapane, A., and Perathoner, S. (2014). Trading renewable energy by using CO2: an effective option to mitigate climate change and increase the use of renewable energy sources. Energy Technol. 2, 453–461. doi: 10.1002/ente.201300182
Bellotti, D., Rivarolo, M., Magistri, L., and Massardo, A. F. (2017). Feasibility study of methanol production plant from hydrogen and captured carbon dioxide. J. CO2 Util. 21, 132–138. doi: 10.1016/j.jcou.2017.07.001
Biagi, J., Agarwal, R., and Zhang, Z. (2016). Simulation and optimization of enhanced gas recovery utilizing CO2. Energy 94, 78–86. doi: 10.1016/j.energy.2015.10.115
Buchner, G. A., Stepputat, K. J., Zimmermann, A. W., and Schomäcker, R. (2019). Specifying technology readiness levels for the chemical industry. Ind. Eng. Chem. Res. 58, 6957–6969. doi: 10.1021/acs.iecr.8b05693
Buchner, G. A., Zimmermann, A. W., Hohgräve, A. E., and Schomäcker, R. (2018). Techno-economic assessment framework for the chemical industry—based on technology readiness levels. Ind. Eng. Chem. Res. 57, 8502–8517. doi: 10.1021/acs.iecr.8b01248
Bushuyev, O. S., De Luna, P., Dinh, C. T., Tao, L., Saur, G., van de Lagemaat, J., et al. (2018). What should we make with CO2 and how can we make it? Joule 2, 825–832. doi: 10.1016/j.joule.2017.09.003
Campanari, S., Chiesa, P., Manzolini, G., and Bedogni, S. (2014). Economic analysis of CO2 capture from natural gas combined cycles using Molten Carbonate Fuel Cells. Appl. Energy 130, 562–573. doi: 10.1016/j.apenergy.2014.04.011
Cheali, P., Gernaey, K. V., and Sin, G. (2015). Uncertainties in early-stage capital cost estimation of process design – a case study on biorefinery design. Front. energy Res. 3, 1–13. doi: 10.3389/fenrg.2015.00003
Chiuta, S., Engelbrecht, N., Human, G., and Bessarabov, D. G. (2016). Techno-economic assessment of power-to-methane and power-to-syngas business models for sustainable carbon dioxide utilization in coal-to-liquid facilities. J. CO2 Util. 16, 399–411. doi: 10.1016/j.jcou.2016.10.001
Christensen, P., and Dysert, L. R. (2005). AACE International Recommended Practice No. 18R-97. 10. Available online at: http://www.costengineering.eu/Downloads/articles/AACE_CLASSIFICATION_SYSTEM.pdf (accessed September 8, 2017).
Climent Barba, F., Martínez-Denegri Sánchez, G., Soler Segu,í, B., Gohari Darabkhani, H., and Anthony, E. J. (2016). A technical evaluation, performance analysis and risk assessment of multiple novel oxy-turbine power cycles with complete CO2 capture. J. Clean. Prod. 133, 971–985. doi: 10.1016/j.jclepro.2016.05.189
CO2 Sciences and The Global CO2 Initiative (2016). Global Roadmap for Implementing CO2 Utilization. Available online at: https://deepblue.lib.umich.edu/handle/2027.42/150624
Coddington, K., Gellici, J., Hilton, R. G., Wade, S., Ali, S., Berger, A., et al. (2016). CO2 Building Blocks: Assessing CO2 Utilization Options. 98. Available online at: http://www.nationalcoalcouncil.org/Documents/CO2-Building-Blocks-2016.pdf (accessed January 20, 2020).
Cormos, C.-C. (2014). Economic evaluations of coal-based combustion and gasification power plants with post-combustion CO2 capture using calcium looping cycle. Energy 78, 665–673. doi: 10.1016/j.energy.2014.10.054
Cussler, E. L. L., and Moggridge, G. D. D. (2011). Chemical Product Design, 2nd Edn. Cambridge; New York, NY: Cambridge University.
Davis, R., Aden, A., and Pienkos, P. T. (2011). Techno-economic analysis of autotrophic microalgae for fuel production. Appl. Energy 88, 3524–3531. doi: 10.1016/j.apenergy.2011.04.018
de Coninck, H., and Benson, S. M. (2014). Carbon dioxide capture and storage: issues and prospects. Annu. Rev. Environ. Resour. 39, 243–270. doi: 10.1146/annurev-environ-032112-095222
Dimitriou, I., Garcia-Gutierrez, P., Elder, R. H., Cuellar-Franca, R. M., Azapagic, A., and Allen, R. W. K. (2015). Carbon dioxide utilisation for production of transport fuels: process and economic analysis. Energy Environ. Sci. 8, 1775–1789. doi: 10.1039/C4EE04117H
Dong, Y., Miraglia, S., Manzo, S., Georgiadis, S., Sørup, H. J. D., Boriani, E., et al. (2018). Environmental sustainable decision making– The need and obstacles for integration of LCA into decision analysis. Environ. Sci. Policy 87, 33–44. doi: 10.1016/j.envsci.2018.05.018
Duraccio, V., Gnoni, M. G., and Elia, V. (2015). Carbon capture and reuse in an industrial district: a technical and economic feasibility study. J. Co2 Util. 10, 23–29. doi: 10.1016/j.jcou.2015.02.004
EC-JRC (2010). “General guide for life cycle assessment—detailed guidance,” in Institute for Environment and Sustainability: International Reference Life Cycle Data System (ILCD) Handbook, 1st Edn (Luxembourg: Publications Office of the European Union).
Edrisi, A., Mansoori, Z., and Dabir, B. (2016). Urea synthesis using chemical looping process – techno-economic evaluation of a novel plant configuration for a green production. Int. J. Greenh. Gas Control 44, 42–51. doi: 10.1016/j.ijggc.2015.10.020
Element Energy Carbon Counts, PSE, Imperial College, University of Sheffield. (2014). Techno-economics of ICCS and CCU in UK. Available online at: http://www.element-energy.co.uk/wordpress/wp-content/uploads/2017/06/Element_Energy_DECC_BIS_Industrial_CCS_and_CCU_final_report_14052014.pdf (accessed January 20, 2020).
Eloneva, S., Said, A., Fogelholm, C.-J., and Zevenhoven, R. (2012). Preliminary assessment of a method utilizing carbon dioxide and steelmaking slags to produce precipitated calcium carbonate. Appl. Energy 90, 329–334. doi: 10.1016/j.apenergy.2011.05.045
Erans, M., Hanak, D., Mir, J., Anthony, E., and Manovic, V. (2016). Process modelling and techno-economic analysis of natural gas combined cycle integrated with calcium looping. Therm. Sci. 20, 59–67. doi: 10.2298/TSCI151001209E
Eurostat (2018). Manufactured Goods - Prodcom NACE Rev.2. Available online at: http://ec.europa.eu/eurostat/web/prodcom/data/excel-files-nace-rev.2 (accessed July 8, 2018).
Fan, J.-L., Zhang, X., Zhang, J., and Peng, S. (2015). Efficiency evaluation of CO2 utilization technologies in China: a super-efficiency DEA analysis based on expert survey. J. Co2 Util. 11, 54–62. doi: 10.1016/j.jcou.2015.01.004
Fernández-Dacosta, C., van der Spek, M., Hung, C. R., Oregionni, G. D., Skagestad, R., Parihar, P., et al. (2017). Prospective techno-economic and environmental assessment of carbon capture at a refinery and CO2 utilisation in polyol synthesis. J. CO2 Util. 21, 405–422. doi: 10.1016/j.jcou.2017.08.005
Ghezel-Ayagh, H., Jolly, S., Patel, D., and Steen, W. (2017). Electrochemical membrane technology for carbon dioxide capture from flue gas. Energy Proc. 108, 2–9. doi: 10.1016/j.egypro.2016.12.183
Giannoulakis, S., Volkart, K., and Bauer, C. (2014). Life cycle and cost assessment of mineral carbonation for carbon capture and storage in European power generation. Int. J. Greenh. Gas Control 21, 140–157. doi: 10.1016/j.ijggc.2013.12.002
Gong, J., and You, F. (2015). Value-added chemicals from microalgae: greener, more economical, or both? ACS Sustain. Chem. Eng. 3, 82–96. doi: 10.1021/sc500683w
Gozalpour, F., Ren, S. R., and Tohidi, B. (2005). CO2 EOR and storage in oil reservoirs. Oil Gas Sci. Technol. 60, 537–546. doi: 10.2516/ogst:2005036
Han, K., Ahn, C. K., Lee, M. S., Rhee, C. H., Kim, J. Y., and Chun, H. D. (2013). Current status and challenges of the ammonia-based CO2 capture technologies toward commercialization. Int. J. Greenh. Gas Control 14, 270–281. doi: 10.1016/j.ijggc.2013.01.007
Hart, D., Howes, J., Lehner, F., Dodds, P. E., Hughes, N., Fais, B., et al. (2015). Scenarios for Deployment of Hydrogen in Contributing to Meeting Carbon Budgets and the 2050 Target. London: E4tech (UK) Ltd.
Häussinger, P., Lohmüller, R., and Watson, A. M. (2011). Hydrogen, 2. production. Ullmann's Encycl. Ind. Chem. doi: 10.1002/14356007.o13_o03
Hendriks, C., Noothout, P., Zakkour, P., and Cook, G. (2013). Implications of the Reuse of Captured CO2 for European Climate Action Policies Final Report. Available online at: http://www.scotproject.org/sites/default/files/CarbonCount,Ecofys%282013%29ImplicationsofthereuseofcapturedCO2-report.pdf (accessed September 22, 2015).
Hwang, C. L., and Yoon, K. (1981). Multiple Attribute Decision Making: Methods and Applications : A State-of-the-Art Survey. Berlin; Heidelberg; New York, NY: Springer-Verlag.
IASS (2018). Launch of the Standardised Guidelines for Life Cycle and Techno-Economic Assessment of CO2 Utilisation Technologies. Available online at: https://www.iass-potsdam.de/de/veranstaltungen/launch-standardised-guidelines-life-cycle-and-techno-economic-assessment-co2 (accessed June 20, 2019).
IEA (2015). Technology Roadmap - Hydrogen and Fuel Cells. Paris: International Energy Agency (IEA). Available online at: http://ieahydrogen.org/pdfs/TechnologyRoadmapHydrogenandFuelCells-(1).aspx
Igos, E., Benetto, E., Meyer, R., Baustert, P., and Othoniel, B. (2019). How to treat uncertainties in life cycle assessment studies? Int. J. Life Cycle Assess. 24, 794–807. doi: 10.1007/s11367-018-1477-1
IPCC (2018). Global Warming of 1.5°C, eds V. Masson-Delmotte, P. Zhai, H.-O. Pörtner, D. Roberts, J. Skea, P. R. Shukla, et al. Available online at: https://www.ipcc.ch/sr15/ (accessed January 20, 2020).
ISO (2016a). ISO/TR 27912:2016 - Carbon Dioxide Capture — Carbon Dioxide Capture Systems, Technologies and Processes. International Organization for Standardization. Available online at: https://www.iso.org/standard/64233.html?browse=tc (accessed January 7, 2020).
ISO (2016b). ISO 27913–1:2016 - Carbon Dioxide Capture, Transportation and Geological Storage — Pipeline Transportation Systems. International Organization for Standardization. Available online at: https://www.iso.org/standard/64235.html?browse=tc (accessed January 7, 2020).
ISO (2018). ISO 27919-1:2018 - Carbon Dioxide Capture — Part 1: Performance Evaluation Methods for Post-combustion CO2 Capture Integrated With a Power Plant. International Organization for Standardization. Available online at: https://www.iso.org/standard/67271.html?browse=tc (accessed January 7, 2020).
ISO 14044 (2006). ISO 14044: Life Cycle Assessment — Requirements and Guidelines. International Organization for Standardization. 14044, 46.
Jiang, Y., and Bhattacharyya, D. (2016). Process modeling of direct coal-biomass to liquids (CBTL) plants with shale gas utilization and CO2 capture and storage (CCS). Appl. Energy 183, 1616–1632. doi: 10.1016/j.apenergy.2016.09.098
Jiang, Y., and Bhattacharyya, D. (2017). Techno-economic analysis of direct coal-biomass to liquids (CBTL) plants with shale gas utilization and CO2 capture and storage (CCS). Appl. Energy 189, 433–448. doi: 10.1016/j.apenergy.2016.12.084
Kabatek, P., and Zoelle, A. (2014). Cost and performance metrics used to assess carbon utilization and storage technologies. National Energy Technology Laboratory. Available online at: https://www.osti.gov/biblio/1489766-cost-performance-metrics-used-assess-carbon-utilization-storage-technologies
Kahraman, C. (2008). Fuzzy Multi-Criteria Decision Making: Theory and Applications with Recent Developments. Berlin; Heidelberg; New York, NY: Springer US.
Kätelhön, A., Meys, R., Deutz, S., Suh, S., and Bardow, A. (2019). Climate change mitigation potential of carbon capture and utilization in the chemical industry. Proc. Natl. Acad. Sci. USA. 116, 11187–11194. doi: 10.1073/pnas.1821029116
Kim, J., Henao, C. A., Johnson, T. A., Dedrick, D. E., Miller, J. E., Stechel, E. B., et al. (2011). Methanol production from CO2 using solar-thermal energy: process development and techno-economic analysis. Energy Environ. Sci. 4:3122. doi: 10.1039/c1ee01311d
Klein-Marcuschamer, D., Turner, C., Allen, M., Gray, P., Dietzgen, R. G., Gresshoff, P. M., et al. (2013). Technoeconomic analysis of renewable aviation fuel from microalgae, Pongamia pinnata, and sugarcane. Biofuels Bioprod. Bioref. 7, 416–428. doi: 10.1002/bbb.1404
Kongpanna, P., Pavarajarn, V., Gani, R., and Assabumrungrat, S. (2015). Techno-economic evaluation of different CO2-based processes for dimethyl carbonate production. Chem. Eng. Res. Des. 93, 496–510. doi: 10.1016/j.cherd.2014.07.013
Kourkoumpas, D. S., Papadimou, E., Atsonios, K., Karellas, S., Grammelis, P., and Kakaras, E. (2016). Implementation of the power to methanol concept by using CO2 from lignite power plants: techno-economic investigation. Int. J. Hydrog. Energy 41, 16674–16687. doi: 10.1016/j.ijhydene.2016.07.100
Lackner, K. S., Brennan, S., Matter, J. M., Park, A.-H. A., Wright, A., and Van Der Zwaan, B. (2012). The urgency of the development of CO2 capture from ambient air. Proc. Natl. Acad. Sci. USA 109, 13156–13162. doi: 10.1073/pnas.1108765109
Lagace, J. C. (2006). Making sense of your project cost estimate. Chem. Eng. 113, 54–58. Available online at: https://www.chemengonline.com/making-sense-of-your-project-cost-estimate/
Leeson, D., Mac Dowell, N., Shah, N., Petit, C., and Fennell, P. S. (2017). A Techno-economic analysis and systematic review of carbon capture and storage (CCS) applied to the iron and steel, cement, oil refining and pulp and paper industries, as well as other high purity sources. Int. J. Greenh. Gas Control 61, 71–84. doi: 10.1016/j.ijggc.2017.03.020
Lehner, M., Ellersdorfer, M., Treimer, R., Moser, P., Theodoridou, V., and Biedermann, H. (2012). Carbon Capture and Utilization (CCU) – Verfahrenswege und deren Bewertung. BHM Berg Hüttenmän. Monatshef. 157, 63–69. doi: 10.1007/s00501-012-0056-1
Liu, Y., Mahmoud, M., Hartmann, H., Stewart, S., Wagener, T., Semmens, D., et al. (2008). “Chapter nine formal scenario development for environmental impact assessment studies,” in Developments in Integrated Environmental Assessment, eds. A. J. Jakeman, A. A. Voinov, A. E. Rizzoli, and S. H. Chen (Amsterdam: Elsevier), 145–162. doi: 10.1016/S1574-101X(08)00609-1
Mahmoud, M., Liu, Y., Hartmann, H., Stewart, S., Wagener, T., Semmens, D., et al. (2009). A formal framework for scenario development in support of environmental decision-making. Environ. Model. Softw. 24, 798–808. doi: 10.1016/j.envsoft.2008.11.010
Mantripragada, H. C., and Rubin, E. S. (2014). Calcium looping cycle for CO2 capture: performance, cost and feasibility analysis. Energy Proc. 63, 2199–2206. doi: 10.1016/j.egypro.2014.11.239
Markham, J. N., Tao, L., Davis, R., Voulis, N., Angenent, L. T., Ungerer, J., et al. (2016). Techno-economic analysis of a conceptual biofuel production process from bioethylene produced by photosynthetic recombinant cyanobacteria. Green Chem. 18, 6266–6281. doi: 10.1039/C6GC01083K
McCord, S., Villa Zaragoza, A., Sanderson, P., Armstrong, K., Styring, P., Hills, C., et al. (2019). Mineralization Worked Examples for the TEA and LCA Guidelines for CO2 Utilization. Ann Arbor, MI: The Global CO2 Initiative.
Metz, B., Orgunlade, D., de Coninck, H., Loos, M., and Meyer, L. (2005). IPCC Special Report on Carbon Dioxide Capture and Storage. Available online at: https://www.ipcc.ch/report/carbon-dioxide-capture-and-storage/ (accessed January 20, 2020).
Miah, J. H., Koh, S. C. L., and Stone, D. (2017). A hybridised framework combining integrated methods for environmental Life Cycle Assessment and Life Cycle Costing. J. Clean. Prod. 168, 846–866. doi: 10.1016/j.jclepro.2017.08.187
Michailos, S., Sanderson, P., Villa Zaragoza, A., McCord, S., Armstrong, K., Styring, P., et al. (2018). Methanol Worked Examples for the TEA and LCA Guidelines for CO2 Utilization.
Mikkelsen, M., Jørgensen, M., and Krebs, F. C. (2010). The teraton challenge. A review of fixation and transformation of carbon dioxide. Energy Environ. Sci. 3, 43–81. doi: 10.1039/B912904A
Mondal, K., Sasmal, S., Badgandi, S., Chowdhury, D. R., and Nair, V. (2016). Dry reforming of methane to syngas: a potential alternative process for value added chemicals—a techno-economic perspective. Environ. Sci. Pollut. Res. 23, 22267–22273. doi: 10.1007/s11356-016-6310-4
Müller, K., and Arlt, W. (2014). Shortcut evaluation of chemical carbon dioxide utilization processes. Chem. Eng. Technol. 37, 1612–1615. doi: 10.1002/ceat.201400228
Müller, K., Mokrushina, L., and Arlt, W. (2014). Thermodynamic Constraints for the Utilization of CO2. Chem. Ing. Tech. 86, 497–503. doi: 10.1002/cite.201300152
Naims, H. (2016). Economics of carbon dioxide capture and utilization—a supply and demand perspective. Environ. Sci. Pollut. Res. 23, 22226–22241. doi: 10.1007/s11356-016-6810-2
Naims, H., Olfe-Kräutlein, B., Lorente Lafuente, A. M., and Bruhn, T. (2015). CO2 Recycling—An Option for Policymaking and Society? Potsdam.
National Academies of Sciences Engineering and Medicine (2019). Negative Emissions Technologies and Reliable Sequestration. Washington, DC: National Academies Press.
Ng, K. S., Zhang, N., and Sadhukhan, J. (2013). Techno-economic analysis of polygeneration systems with carbon capture and storage and CO2 reuse. Chem. Eng. J. 219, 96–108. doi: 10.1016/j.cej.2012.12.082
Otto, A., Grube, T., Schiebahn, S., and Stolten, D. (2015). Closing the loop: captured CO2 as a feedstock in the chemical industry. Energy Environ. Sci. 8, 3283–3297. doi: 10.1039/C5EE02591E
Pan, S.-Y. (2015). An innovative approach to integrated carbon mineralization and waste utilization: a review. Aerosol Air Qual. Res. 15, 1072–1091. doi: 10.4209/aaqr.2014.10.0240
Parsons Brinckerhoff Global CCS Institute (2011). Accelerating the update of CCS: Industrial Use of Captured Carbon Dioxide. Available online at: https://www.globalccsinstitute.com/resources/publications-reports-research/accelerating-the-uptake-of-ccs-industrial-use-of-captured-carbon-dioxide/ (accessed January 20, 2020).
Patel, A. D., Meesters, K., den Uil, H., de Jong, E., Blok, K., and Patel, M. K. (2012). Sustainability assessment of novel chemical processes at early stage: application to biobased processes. Energy Environ. Sci. 5, 8430–8444. doi: 10.1039/c2ee21581k
Pérez-Fortes, M., Bocin-Dumitriu, A., and Tzimas, E. (2014a). CO2 utilization pathways: techno-economic assessment and market opportunities. Energy Procedia 63, 7968–7975. doi: 10.1016/j.egypro.2014.11.834
Pérez-Fortes, M., Moya, J. A., Vatopoulos, K., and Tzimas, E. (2014b). CO2 capture and utilization in cement and iron and steel industries. Energy Proc. 63, 6534–6543. doi: 10.1016/j.egypro.2014.11.689
Pérez-Fortes, M., Schöneberger, J. C., Boulamanti, A., Harrison, G., and Tzimas, E. (2016a). Formic acid synthesis using CO2 as raw material: techno-economic and environmental evaluation and market potential. Int. J. Hydrog. Energy 41, 16444–16462. doi: 10.1016/j.ijhydene.2016.05.199
Pérez-Fortes, M., Schöneberger, J. C., Boulamanti, A., and Tzimas, E. (2016b). Methanol synthesis using captured CO2 as raw material: Techno-economic and environmental assessment. Appl. Energy 161, 718–732. doi: 10.1016/j.apenergy.2015.07.067
Pérez-fortes, M., and Tzimas, E. (2016). Techno-Economic and Environmental Evaluation of CO2 Utilisation for Fuel Production. Synthesis of Methanol and Formic Acid. Petten: Publications Office of the European Union.
Peters, M. S., Timmerhaus, K. D., and West, R. E. (2003). Plant Design and Economics for Chemical Engineers, 5th Edn. New York, NY: McGraw-Hill Education.
Reiter, G., and Lindorfer, J. (2015). Evaluating CO2 sources for power-to-gas applications – a case study for Austria. J. CO2 Util. 10, 40–49. doi: 10.1016/j.jcou.2015.03.003
Rezvani, S., Moheimani, N. R., and Bahri, P. A. (2016). Techno-economic assessment of CO2 bio-fixation using microalgae in connection with three different state-of-the-art power plants. Comput. Chem. Eng. 84, 290–301. doi: 10.1016/j.compchemeng.2015.09.001
Roh, K., Lee, J. H., and Gani, R. (2016). A methodological framework for the development of feasible CO2 conversion processes. Int. J. Greenh. Gas Control 47, 250–265. doi: 10.1016/j.ijggc.2016.01.028
Rubin, E. S. (2014). “Seven simple steps to improve cost estimates for advanced carbon capture technologies,” in Present. to DOE Transform. Carbon Capture Technol Work (Pittsburgh, PA: DOE NETL).
Rubin, E. S. (2016). “Evaluating the cost of emerging technologies,” in Presentation to the Climit Workshop on Emerging CO2 Capture Technologies (Pittsburgh, PA). Available online at: https://www.cmu.edu/epp/iecm/rubin/PDF files/2016/Rubin-Evaluating the cost of Emerging Technologies.pdf
Rubin, E. S., Short, C., Booras, G., Davison, J., Ekstrom, C., Matuszewski, M., et al. (2013). A proposed methodology for CO2 capture and storage cost estimates. Int. J. Greenh. Gas Control 17, 488–503. doi: 10.1016/j.ijggc.2013.06.004
Rubin, E. S., and Zhai, H. (2012). The cost of carbon capture and storage for natural gas combined cycle power plants. Environ. Sci. Technol. 46, 3076–3084. doi: 10.1021/es204514f
Saavedra, C. A. (2016). The Marketing Challenge for Industrial Companies, Advanced Concepts and Practices. Berlin; Heidelberg: Springer International Publishing.
Saltelli, A. (2002). Sensitivity analysis for importance assessment. Risk Anal. 22, 579–590. doi: 10.1111/0272-4332.00040
Sarić, M., Dijkstra, J. W., and Haije, W. G. (2017). Economic perspectives of Power-to-Gas technologies in bio-methane production. J. CO2 Util. 20, 81–90. doi: 10.1016/j.jcou.2017.05.007
Sarić, M., Dijkstra, J. W., Walspurger, S., and Haije, W. G. (2014). The Potential of “Power to Gas” Technology Integrated with Biomethane Production. Petten: Energy Research Centre of the Netherlands (ECN).
Schäffner, B., Blug, M., Kruse, D., Polyakov, M., Köckritz, A., Martin, A., et al. (2014). Synthesis and application of carbonated fatty acid esters from carbon dioxide including a life cycle analysis. ChemSusChem 7, 1133–1139. doi: 10.1002/cssc.201301115
Sell, I., Ott, D., and Kralisch, D. (2014). Life cycle cost analysis as decision support tool in chemical process development. Chem. Bio. Eng. Rev. 1, 50–56. doi: 10.1002/cben.201300007
SETIS ERKC (2016). Techno-Economic Assessment. Available online at: https://setis.ec.europa.eu/energy-research/techno-economic-assessment (accessed August 12, 2016).
Sinnott, R., and Towler, G. (2009). Chemical Engineering Design. 2014 Repri. Amsterdam: Elsevier Ltd.
Smit, B., Park, A.-H. A., and Gadikota, G. (2014). The grand challenges in carbon capture, utilization, and storage. Front. Energy Res. 2:55. doi: 10.3389/fenrg.2014.00055
Soares, F. R., Martins, G., and Seo, E. S. M. (2013). An assessment of the economic aspects of CO2 sequestration in a route for biodiesel production from microalgae. Environ. Technol. 34, 1777–1781. doi: 10.1080/09593330.2013.816784
Song, C. (2006). Global challenges and strategies for control, conversion and utilization of CO2 for sustainable development involving energy, catalysis, adsorption and chemical processing. Catal. Today 115, 2–32. doi: 10.1016/j.cattod.2006.02.029
Sridhar, N., and Hill, D. (2011). Carbon Dioxide Utilization. Electrochemical Conversion of CO2 Opportunities and Challenges. DNV Res. Innov. Position Pap. Available online at: https://issuu.com/dnv.com/docs/dnv-position_paper_co2_utilization (accessed January 20, 2020).
Stechel, E. B., and Miller, J. E. (2013). Re-energizing CO2 to fuels with the sun: Issues of efficiency, scale, and economics. J. CO2 Util. 1, 28–36. doi: 10.1016/j.jcou.2013.03.008
Sugiyama, H. (2007). Decision-Making Framework for Chemical Process Design Including Different Stages of Environmental, Health and Safety (EHS) Assessment. doi: 10.3929/ethz-a-005398654
Sugiyama, H., Fischer, U., Hungerbühler, K., and Hirao, M. (2008). Decision framework for chemical process design including different stages of environmental, health, and safety assessment. AIChE J. 54, 1037–1053. doi: 10.1002/aic.11430
Swarr, T. E., Hunkeler, D., Klöpffer, W., Pesonen, H.-L., Ciroth, A., Brent, A., et al. (2011b). Environmental Life Cycle Costing: A Code of Practice, eds. T. E. Swarr, D. Hunkeler, W. Klöpffer, H.-L. Pesonen, A. Ciroth, A. C. Brent, and R. Pagan (Pensacola, FL: Soc. of Environmental Toxicology and Chemistry), 98.
Swarr, T. E., Hunkeler, D., Klöpffer, W., Pesonen, H.-L., Ciroth, A., Brent, A. C., et al. (2011a). Environmental life-cycle costing: a code of practice. Int. J. Life Cycle Assess. 16, 389–391. doi: 10.1007/s11367-011-0287-5
Tanzer, S. E., and Ramírez, A. (2019). When are negative emissions negative emissions? Energy Environ. Sci. 12, 1210–1218. doi: 10.1039/C8EE03338B
Teir, S., Kotiranta, T., Pakarinen, J., and Mattila, H.-P. (2016). Case study for production of calcium carbonate from carbon dioxide in flue gases and steelmaking slag. J. CO2 Util. 14, 37–46. doi: 10.1016/j.jcou.2016.02.004
Thomassen, G., Van Dael, M., Van Passel, S., and You, F. (2019). How to assess the potential of emerging green technologies? Towards a prospective environmental and techno-economic assessment framework. Green Chem. 21, 4868–4886. doi: 10.1039/C9GC02223F
Tremel, A., Wasserscheid, P., Baldauf, M., and Hammer, T. (2015). Techno-economic analysis for the synthesis of liquid and gaseous fuels based on hydrogen production via electrolysis. Int. J. Hydrog. Energy 40, 11457–11464. doi: 10.1016/j.ijhydene.2015.01.097
Triantaphyllou, E., Shu, B., Sanchez, S. N., and Ray, T. (1998). Multi-criteria decision making: an operations research approach. Encycl. Electr. Electron. Eng. 15, 175–186.
Trippe, F., Fröhling, M., Schultmann, F., Stahl, R., Henrich, E., and Dalai, A. (2013). Comprehensive techno-economic assessment of dimethyl ether (DME) synthesis and Fischer–Tropsch synthesis as alternative process steps within biomass-to-liquid production. Fuel Process. Technol. 106, 577–586. doi: 10.1016/j.fuproc.2012.09.029
Turton, R., Bailie, R. C., Whiting, W. B., Shaeiwitz, J. A., and Bhattacharyya, D. (2012). Analysis, Synthesis, and Design of Chemical Processes. Upper Saddle River, NJ: Prentice Hall, Pearson.
van der Spek, M., Ramirez, A., and Faaij, A. (2017a). Challenges and uncertainties of ex ante techno-economic analysis of low TRL CO2 capture technology: Lessons from a case study of an NGCC with exhaust gas recycle and electric swing adsorption. Appl. Energy 208, 920–934. doi: 10.1016/j.apenergy.2017.09.058
van der Spek, M., Sanchez Fernandez, E., Eldrup, N. H., Skagestad, R., Ramirez, A., and Faaij, A. (2017b). Unravelling uncertainty and variability in early stage techno-economic assessments of carbon capture technologies. Int. J. Greenh. Gas Control 56, 221–236. doi: 10.1016/j.ijggc.2016.11.021
Versteeg, P., and Rubin, E. S. (2011). A technical and economic assessment of ammonia-based post-combustion CO2 capture at coal-fired power plants. Int. J. Greenh. Gas Control 5, 1596–1605. doi: 10.1016/j.ijggc.2011.09.006
von der Assen, N. (2016). From Life-Cycle Assessment Towards Life-Cycle Design Of Carbon Dioxide Capture And Utilization. Available online at: http://publications.rwth-aachen.de/record/570980/ (accessed March 27, 2018).
Wang, D., Zhang, Y., Adu, E., Yang, J., Shen, Q., Tian, L., et al. (2016). Influence of dense phase co2 pipeline transportation parameters. Int. J. Heat Technol. 34, 479–484. doi: 10.18280/ijht.340318
Wang, F., Li, H., Zhao, J., Deng, S., and Yan, J. (2016). Technical and economic analysis of integrating low-medium temperature solar energy into power plant. Energy Convers. Manage. 112, 459–469. doi: 10.1016/j.enconman.2016.01.037
Wang, J.-J., Jing, Y.-Y., Zhang, C.-F., and Zhao, J.-H. (2009). Review on multi-criteria decision analysis aid in sustainable energy decision-making. Renew. Sustain. Energy Rev. 13, 2263–2278. doi: 10.1016/j.rser.2009.06.021
Ward, T. J. (2001). “Economic evaluation,” in Kirk-Othmer Encyclopedia of Chemical Technology (Hoboken, NJ: John Wiley & Sons), 525–550.
Wu, J. C.-S., Sheen, J., Chen, S., and Fan, Y. (2001). Feasibility of CO2 fixation via artificial rock weathering. Ind. Eng. Chem. Res. 40, 3902–3905. doi: 10.1021/ie010222l
Xin, M., Shuang, L., Yue, L., and Qinzhu, G. (2015). Effectiveness of gaseous CO2 fertilizer application in China's greenhouses between 1982 and 2010. J. CO2 Util. 11, 63–66. doi: 10.1016/j.jcou.2015.01.005
Yuan, Z., Eden, M. R., and Gani, R. (2016). Toward the development and deployment of large-scale carbon dioxide capture and conversion processes. Ind. Eng. Chem. Res. 55, 3383–3419. doi: 10.1021/acs.iecr.5b03277
Zero Emission Platform (2011). The Costs of CO2 Capture, Transport and Storage. Post-Demonstration CCS in the EU. Available online at: https://zeroemissionsplatform.eu/document/the-costs-of-co2-capture-transport-and-storage/ (accessed January 20, 2020).
Zevenhoven, R., Eloneva, S., and Teir, S. (2006). Chemical fixation of CO2 in carbonates: Routes to valuable products and long-term storage. Catal. Today 115, 73–79. doi: 10.1016/j.cattod.2006.02.020
Zhai, H., and Rubin, E. S. (2013). Techno-economic assessment of polymer membrane systems for postcombustion carbon capture at coal-fired power plants. Environ. Sci. Technol. 47, 3006–3014. doi: 10.1021/es3050604
Zhang, C., Jun, K.-W., Gao, R., Kwak, G., and Kang, S. C. (2016). Efficient utilization of associated natural gas in a modular gas-to-liquids process: technical and economic analysis. Fuel 176, 32–39. doi: 10.1016/j.fuel.2016.02.060
Zhang, C., Jun, K.-W., Gao, R., Kwak, G., and Park, H.-G. (2017). Carbon dioxide utilization in a gas-to-methanol process combined with CO 2 /Steam-mixed reforming: Techno-economic analysis. Fuel 190, 303–311. doi: 10.1016/j.fuel.2016.11.008
Zhang, C., Jun, K.-W., Gao, R., Lee, Y.-J., and Kang, S. C. (2015). Efficient utilization of carbon dioxide in gas-to-liquids process: process simulation and techno-economic analysis. Fuel 157, 285–291. doi: 10.1016/j.fuel.2015.04.051
Zhang, X., He, X., and Gundersen, T. (2013). Post-combustion carbon capture with a gas separation membrane: parametric study, capture cost, and exergy analysis. Energy Fuels 27, 4137–4149. doi: 10.1021/ef3021798
Zimmermann, A. W., Kant, M., Strunge, T., Tzimas, E., Leitner, W., Arlt, W., et al. (2017). CO2 Utilisation Today: Report 2017, eds. A. Zimmermann and M. Kant (Berlin).
Zimmermann, A. W., Müller, L. J., Marxen, A., Armstrong, K., Buchner, G., Wunderlich, J., et al. (2018). Techno-Economic Assessment and Life-Cycle Assessment Guidelines for CO2 Utilization. Ann Arbor, MI: University of Michigan Library, 157. doi: 10.3998/2027.42/145436
Zimmermann, A. W., and Schomäcker, R. (2017). Assessing early-stage CO2 utilization technologies-comparing apples and oranges? Energy Technol. 5, 850–860. doi: 10.1002/ente.201600805
Keywords: CO2 utilization, CCU, carbon capture and utilization, techno-economic assessment, TEA, standardization, harmonization, life cycle assessment
Citation: Zimmermann AW, Wunderlich J, Müller L, Buchner GA, Marxen A, Michailos S, Armstrong K, Naims H, McCord S, Styring P, Sick V and Schomäcker R (2020) Techno-Economic Assessment Guidelines for CO2 Utilization. Front. Energy Res. 8:5. doi: 10.3389/fenrg.2020.00005
Received: 06 August 2019; Accepted: 09 January 2020;
Published: 31 January 2020.
Edited by:
Tao Wang, Zhejiang University, ChinaReviewed by:
Ning Wei, Institute of Rock and Soil Mechanics (CAS), ChinaAtsushi Kurosawa, Institute of Applied Energy, Japan
Copyright © 2020 Zimmermann, Wunderlich, Müller, Buchner, Marxen, Michailos, Armstrong, Naims, McCord, Styring, Sick and Schomäcker. This is an open-access article distributed under the terms of the Creative Commons Attribution License (CC BY). The use, distribution or reproduction in other forums is permitted, provided the original author(s) and the copyright owner(s) are credited and that the original publication in this journal is cited, in accordance with accepted academic practice. No use, distribution or reproduction is permitted which does not comply with these terms.
*Correspondence: Reinhard Schomäcker, schomaecker@tu-berlin.de