 Richard N. Bergman
- Diabetes and Obesity Research Institute, Cedars-Sinai Medical Center, Los Angeles, CA, United States
It has long been hoped that our understanding of the pathogenesis of diabetes would be helped by the use of mathematical modeling. In 1979 Richard Bergman and Claudio Cobelli worked together to find a “minimal model” based upon experimental data from Bergman’s laboratory. Model was chosen as the simplest representation based upon physiology known at the time. The model itself is two quasi-linear differential equations; one representing insulin kinetics in plasma, and a second representing the effects of insulin and glucose itself on restoration of the glucose after perturbation by intravenous injection. Model would only be sufficient if it included a delay in insulin action; that is, insulin had to enter a remote compartment, which was interstitial fluid (ISF). Insulin suppressed endogenous glucose output (by liver) slowly. Delay proved to be due to initial suppression of lipolysis; resultant lowering of free fatty acids reduced liver glucose output. Modeling also demanded that normalization of glucose after injection included an effect of glucose itself on glucose disposal and endogenous glucose production – these effects were termed “glucose effectiveness.” Insulin sensitivity was calculated from fitting the model to intravenous glucose tolerance test data; the resulting insulin sensitivity index, SI, was validated with the glucose clamp method in human subjects. Model allowed us to examine the relationship between insulin sensitivity and insulin secretion. Relationship was described by a rectangular hyperbola, such that Insulin Secretion x Insulin Sensitivity = Disposition Index (DI). Latter term represents ability of the pancreatic beta-cells to compensate for insulin resistance due to factors such as obesity, pregnancy, or puberty. DI has a genetic basis, and predicts the onset of Type 2 diabetes. An additional factor was clearance of insulin by the liver. Clearance varies significantly among animal or human populations; using the model, clearance was shown to be lower in African Americans than Whites (adults and children), and may be a factor accounting for greater diabetes prevalence in African Americans. The research outlined in the manuscript emphasizes the powerful approach by which hypothesis testing, experimental studies, and mathematical modeling can work together to explain the pathogenesis of metabolic disease.
Early Thoughts and Personal Issues
Mathematical modeling of physiological systems gained interest in the early 1950’s. One of the earliest models in the metabolic field was that of Bolie, who represented the glucose/insulin relationship in terms of two simple equations (1). During the same period, more complex models were introduced. One example is Guyton’s model of the cardiovascular system (2). It was Guyton’s goal to include all (at the time) known information regarding the known physiology of the cardiovascular system, and he included additional interactions which emanated from his own work (Figure 1). While Guyton and colleagues were able to gain much insight from this work, the model was not usable by the scientific or medical communities, in view of its great complexity.
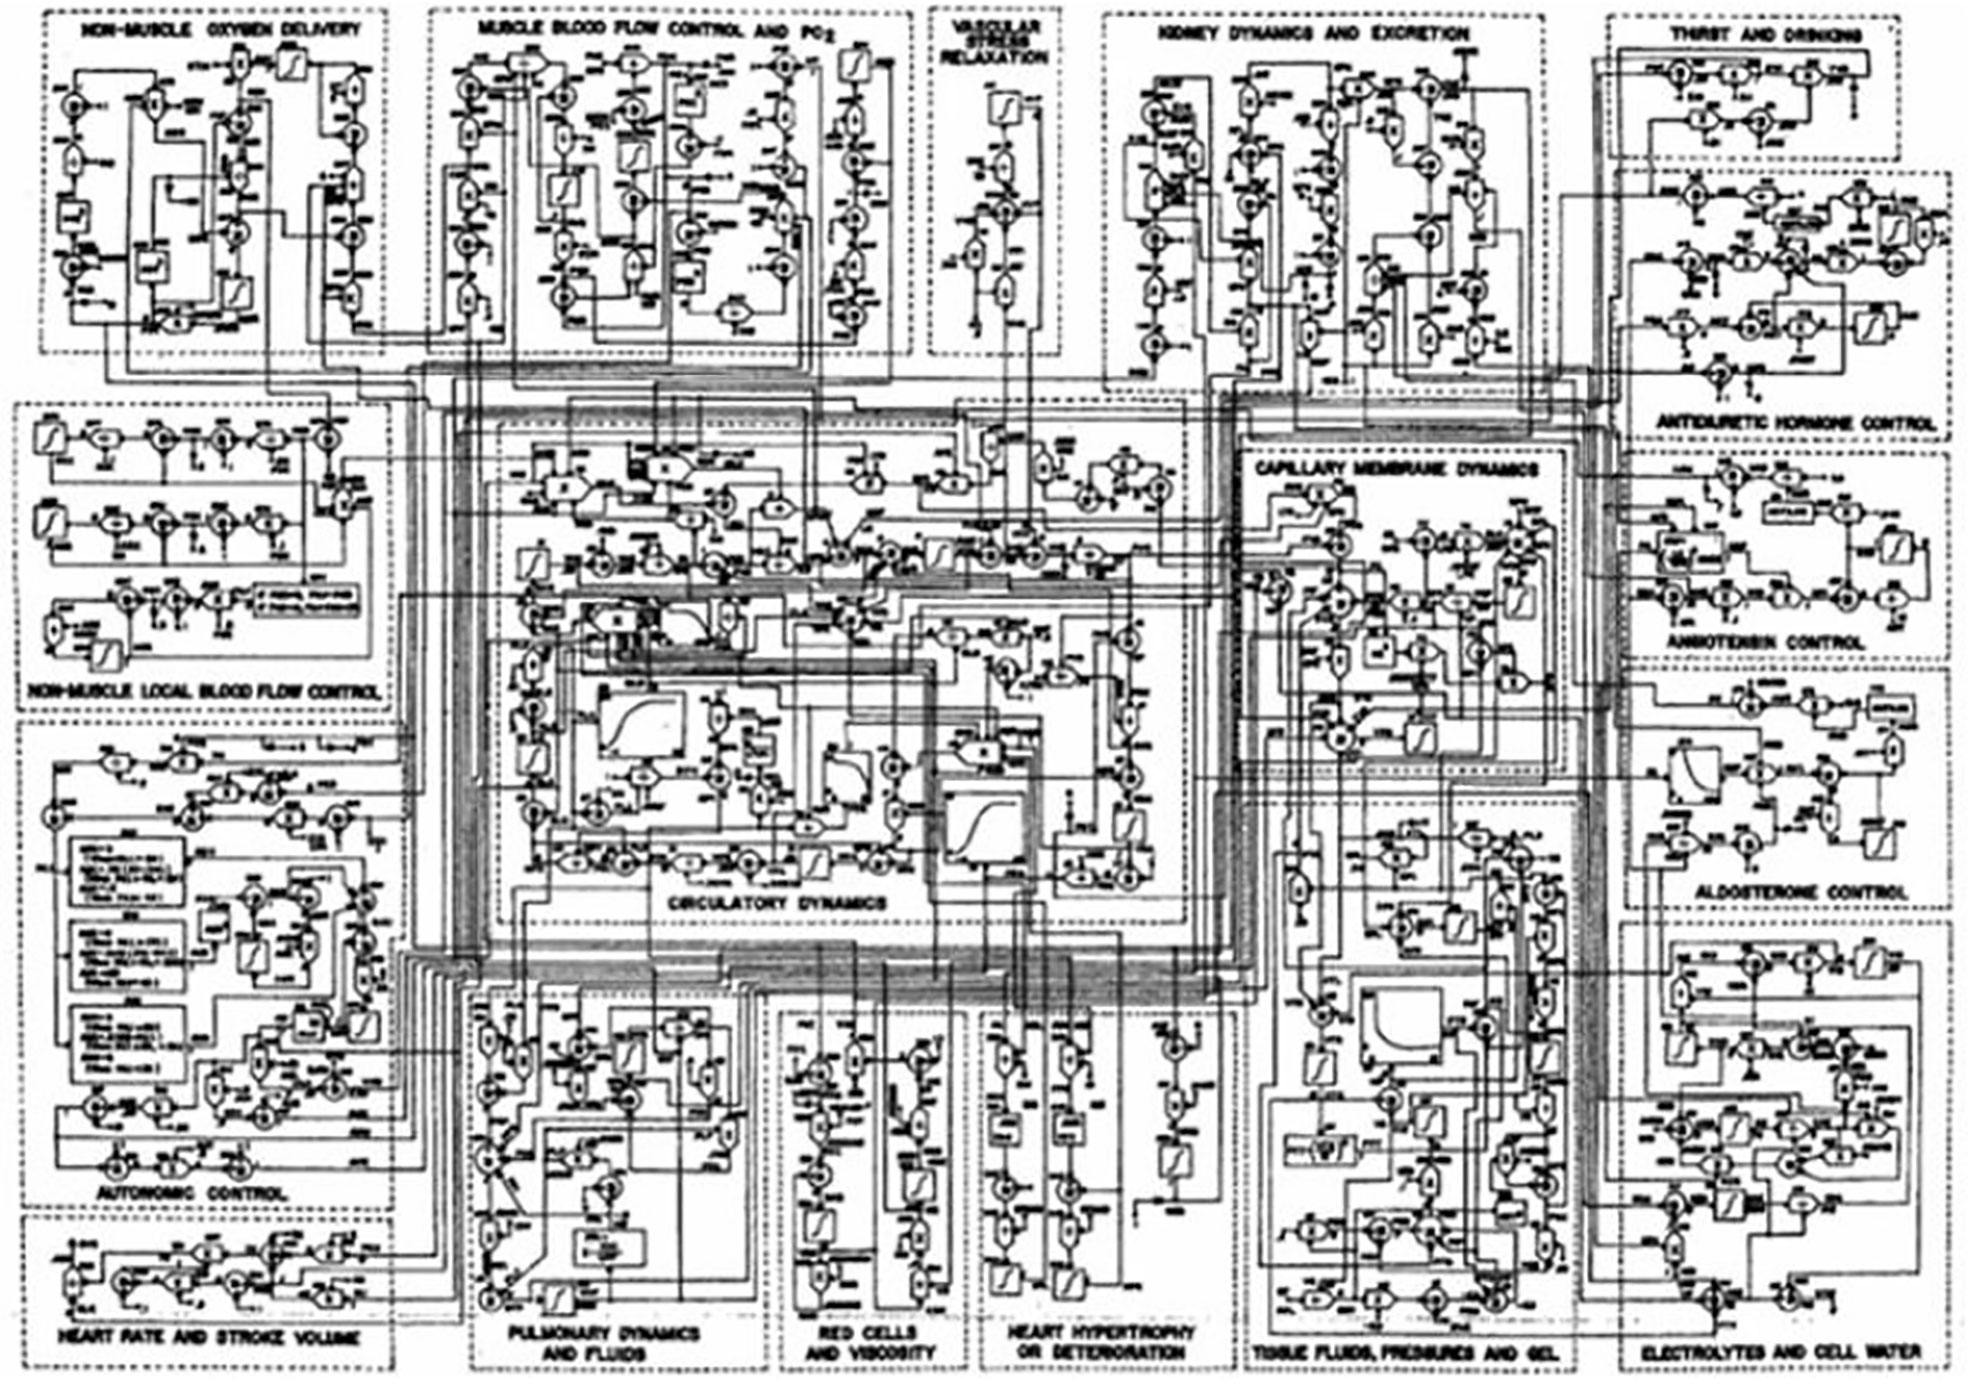
Figure 1 Guyton model of the cardiovascular system.
My own background was as an electrical engineer. I was virtually without training in the biological sciences. This changed due to interaction with Professor Oscar Hechter (my uncle by marriage) of the Worcester Foundation of Experimental Biology. Hechter suggested I contact John Urquhart of the University of Pittsburgh; John along with F. Eugene Yates, were pioneers of modeling of endocrine systems. Their electromechanical model of the adrenocortical system remains a classic (3). I joined Urquhart’s lab despite my lack of education in the biological sciences. He was patient, and he taught me much about experimental physiology. At Pitt, I came in contact with I. Arthur Mirsky, who was a giant of the field of carbohydrate metabolism. I made a major life decision; I believed that mathematical modeling of carbohydrate metabolism could in the end be even more important for patient care.
I therefore chose to study, for my PhD thesis, not modeling of the adrenocortical system, but modeling of the endocrine pancreas. I developed the cross-perfused pancreas system so I could measure the dynamics of insulin release from the endocrine pancreas (4). In fact, I believe that we were the first to discover that insulin release from the isolated pancreas was biphasic (Figure 2). Gerald Grodsky confirmed this result in the rat (5). For my PhD thesis, I developed one of the first mathematical models of pancreatic insulin secretion (Figure 3).
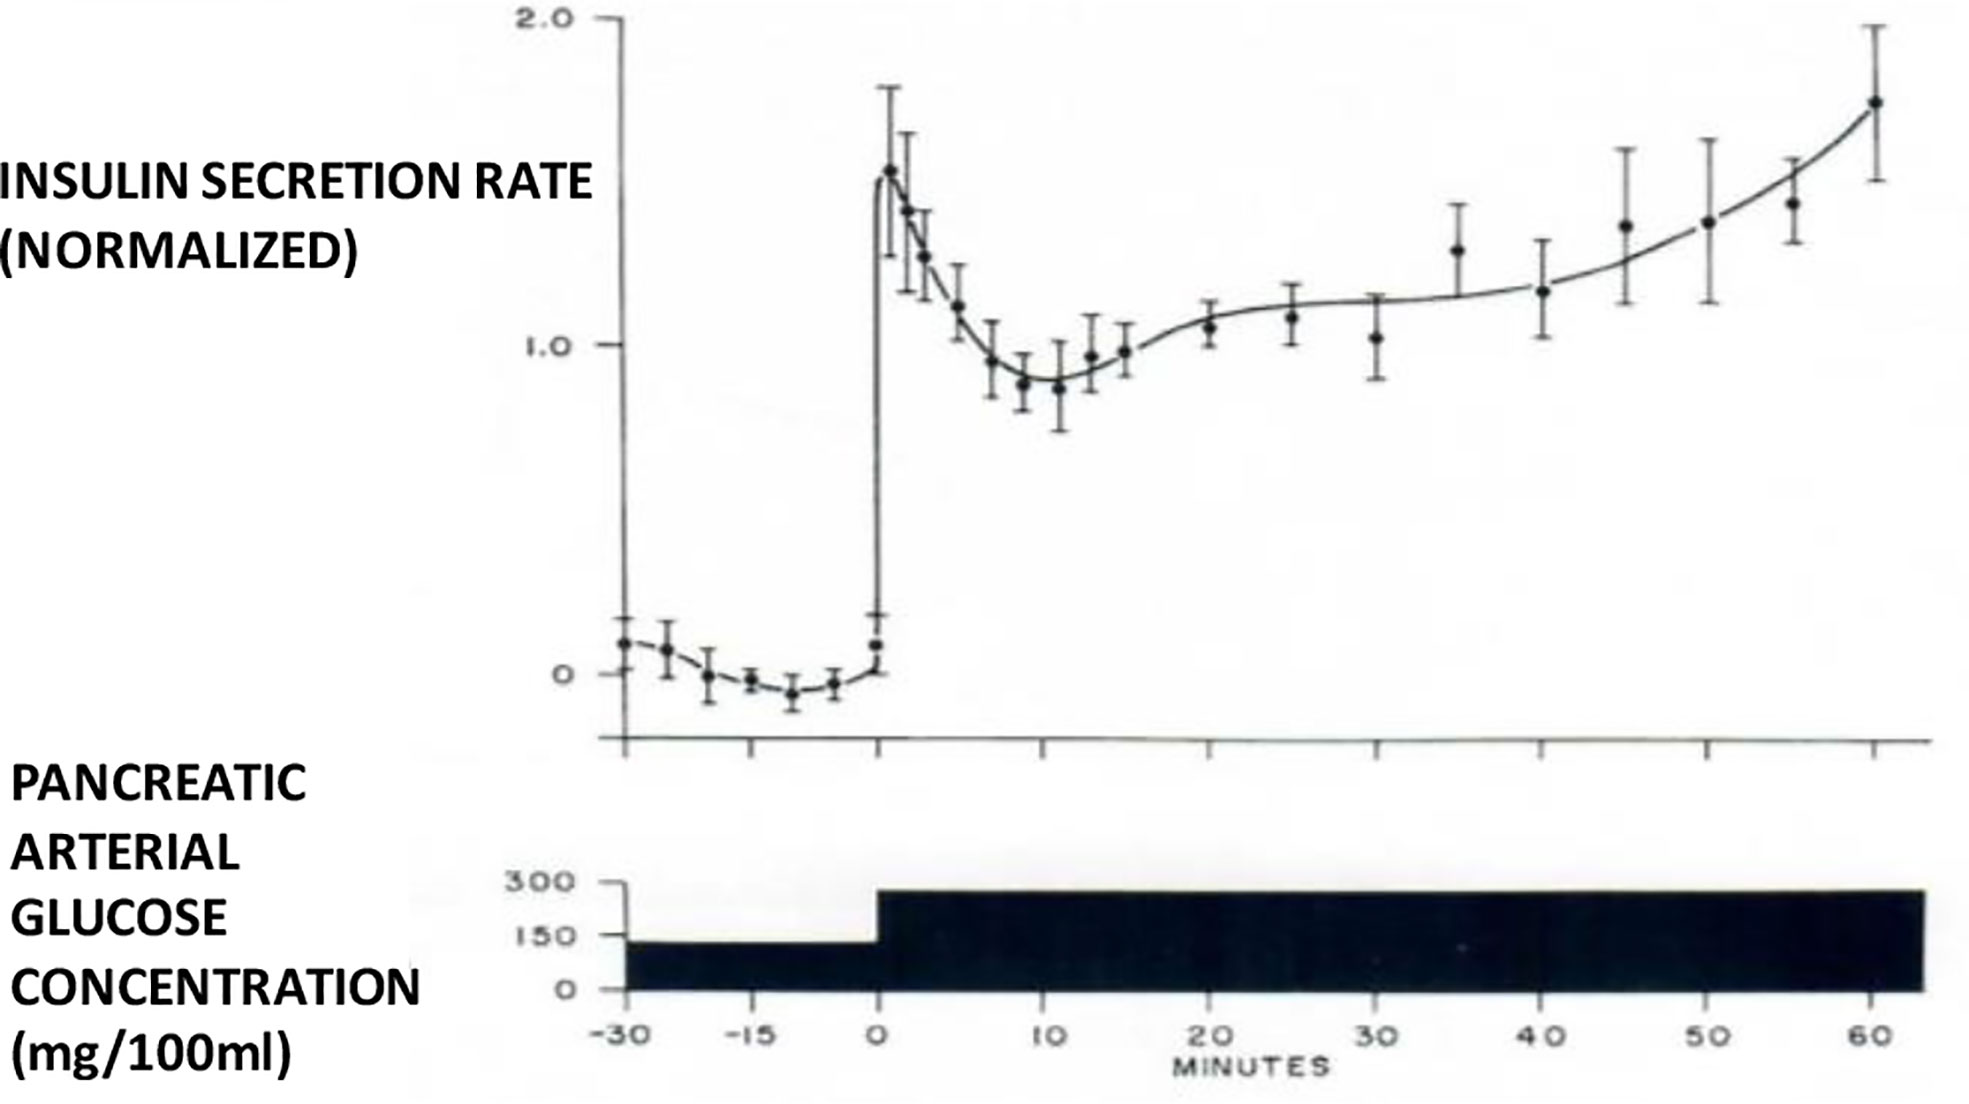
Figure 2 Biphasic insulin release from perfused pancreas.
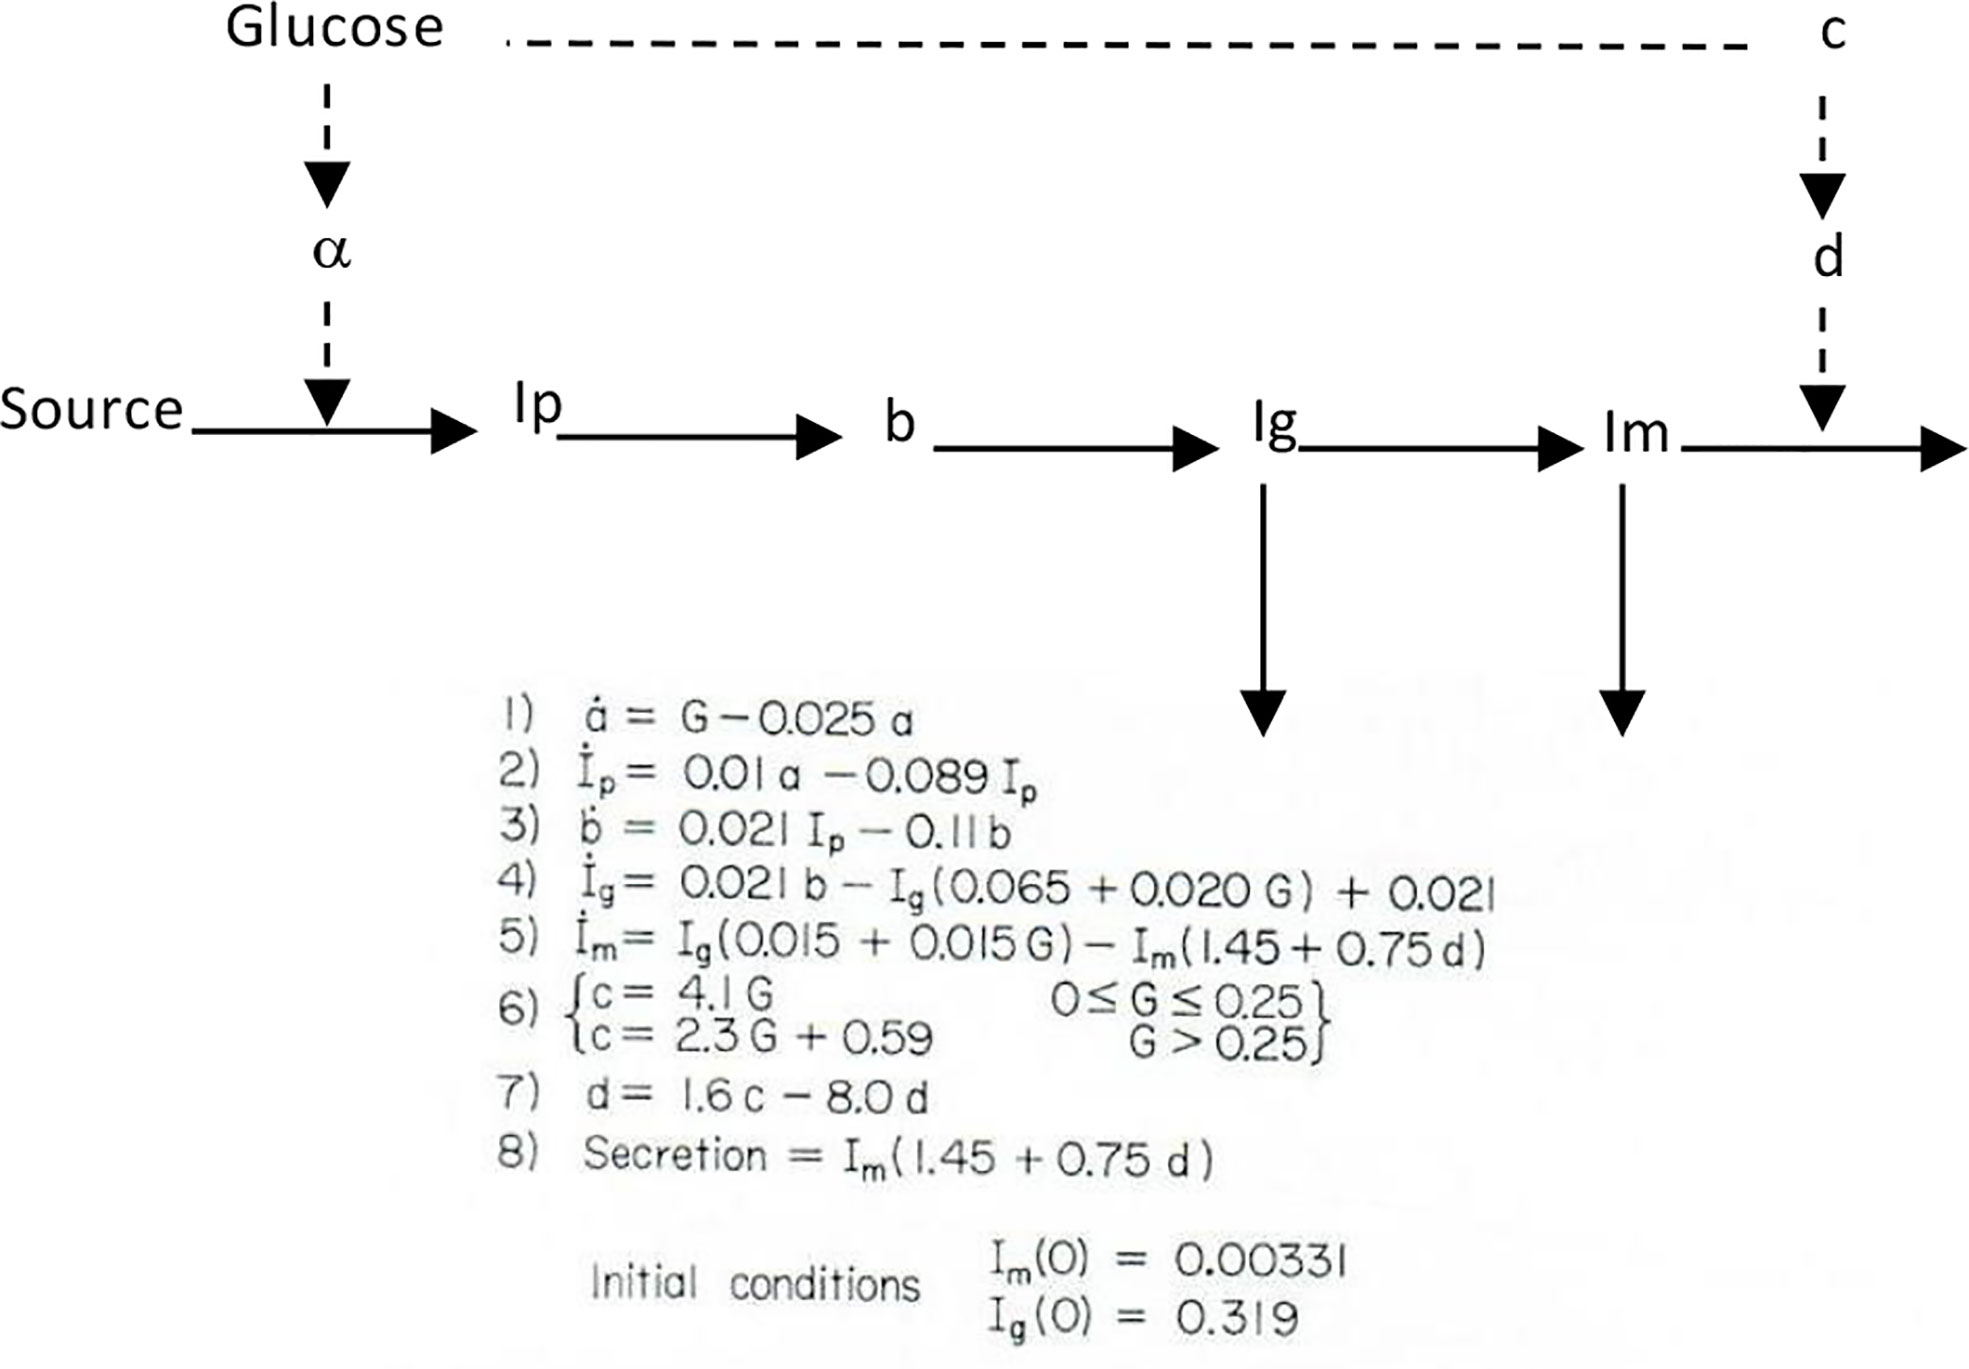
Figure 3 Bergman model of insulin secretion.
I was unfortunate (probably fortunate) that my PhD advisor abandoned our lab, setting me out for the first time as a truly independent investigator, although I was still a 22-year-old graduate student. I later followed John Urquhart to the University of Southern California Department of Biomedical Engineering. (It was very difficult to publish modeling papers in the standard endocrine or physiology literature at the time).
Origin of the Minimal Model
In the context of “Frontiers in Physiology,” it is of interest to remember the resistance of the endocrine community to models in general. In fact, Departments of Physiology (at least in the United States) were highly suspicious of modeling studies in the 1970s. In part, this was due to a history of investigators who would propose models, but not test them in the laboratory (6); such models often “died on the vine”. Personally, I was determined to combine modeling with rigorous experimental testing—an approach our laboratory continues to apply to this day. (I identified with George Gershwin, dedicated to make a “Gentleman out of Jazz”. Maybe we could help make a “Gentleman out of Modeling” in carbohydrate regulation).
During the first decade of my independent laboratory (1971–1980), we introduced several disparate models, such as a differential equation model of insulin secretion (discussed above), a “random hit” statistical representation of hormone binding and activation (7), and a differential equation model of liver glycogen metabolism (8). However, one model that has survived the test of time is the so-called “minimal model” of carbohydrate metabolism.
I was approached by Alberto Salvan at the International Endocrine Society meeting in Copenhagen and invited to visit Padova, Italy. Alberto was sent by Claudio Cobelli, the young “star” of the Bioengineering Department at the University of Padova. I went to Padova and introduced Claudio to my original concept—I argued that previous models of physiological systems (particularly carbohydrate metabolism) were less than useful because they were either too complex (their parameters could not be uniquely specified from data) or too simplistic to accurately account for the data available. I also argued that the effort had not yet been put forth to obtain data which made it possible to make intelligent model design. Thus, in my laboratory at Northwestern University (I was there in Bioengineering from 1976 to 1979), I encouraged my graduate student, Y. Ziya Ider, to obtain a data set which we could use as a basis for modeling the regulation of the glucose level. At the time, the clinical tests of metabolism included the oral glucose tolerance test and the intravenous glucose tolerance test (IVGTT); both included glucose ingestion—oral or intravenous infusion—with infrequent (~1/h) sampling. We reasoned that more frequent sampling was necessary to reveal the actual patterns of glucose and insulin which resulted from carbohydrate administration. Indeed, performing the IVGTT and sampling every minute for 180 min (Figure 4) revealed that the time course of glucose and insulin after intravenous administration was more complex than revealed by the previously used hourly sampling (9). This choice of frequent sampling after glucose injection was a critical choice. It revealed that the return of glucose to basal (by 180 min) could be described by four temporal phases (Figure 5): a mixing phase of glucose in plasma, a quasi-exponential phase (see below, “glucose effectiveness”) an acceleration of the glucose decline (reflecting the action of insulin) followed by glucose’s return to pre-injection value (10).
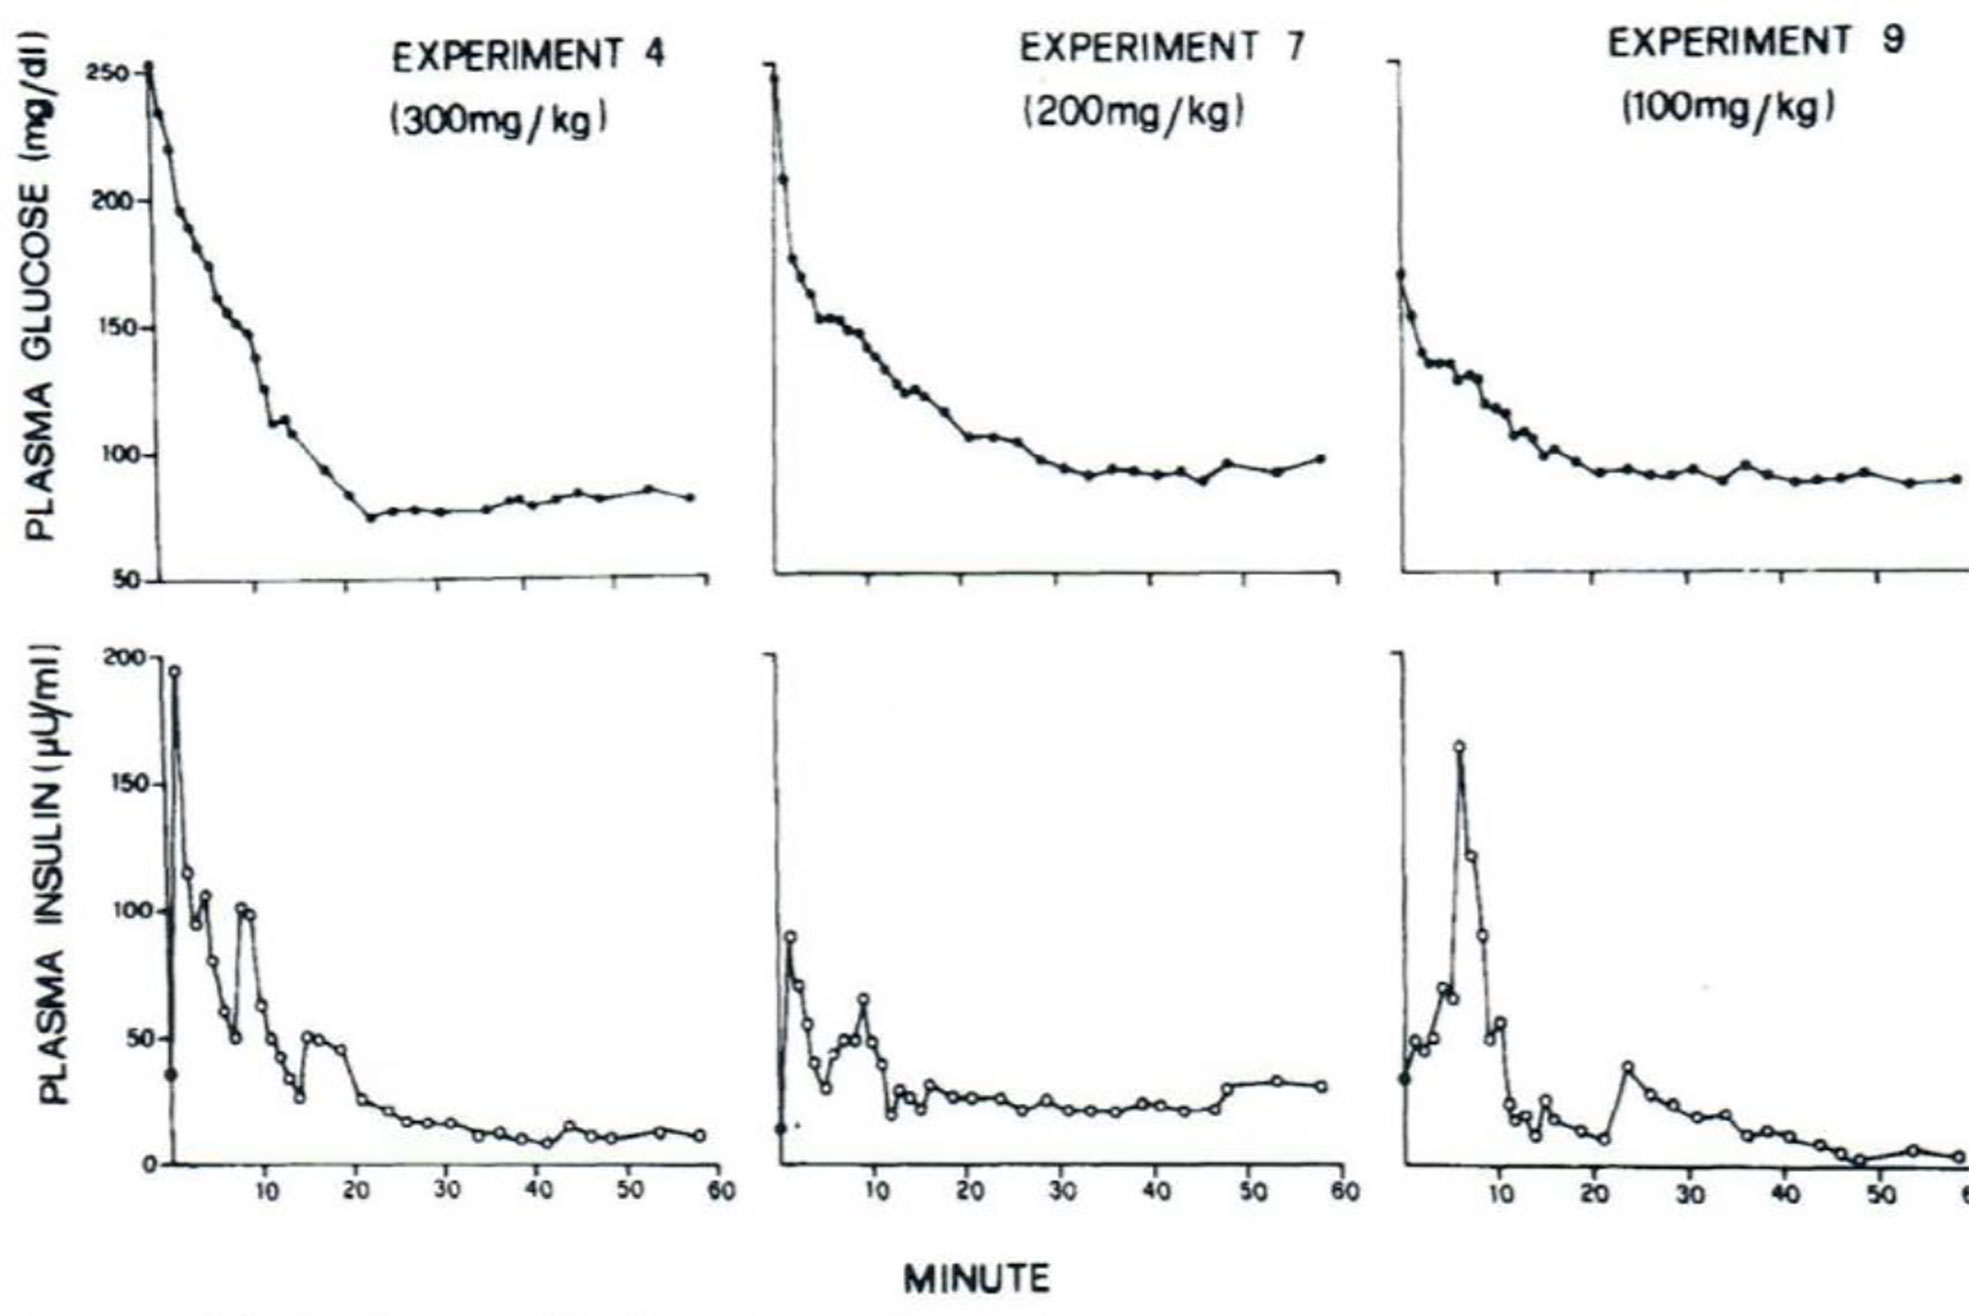
Figure 4 Early IVGTTs with frequent blood sampling.
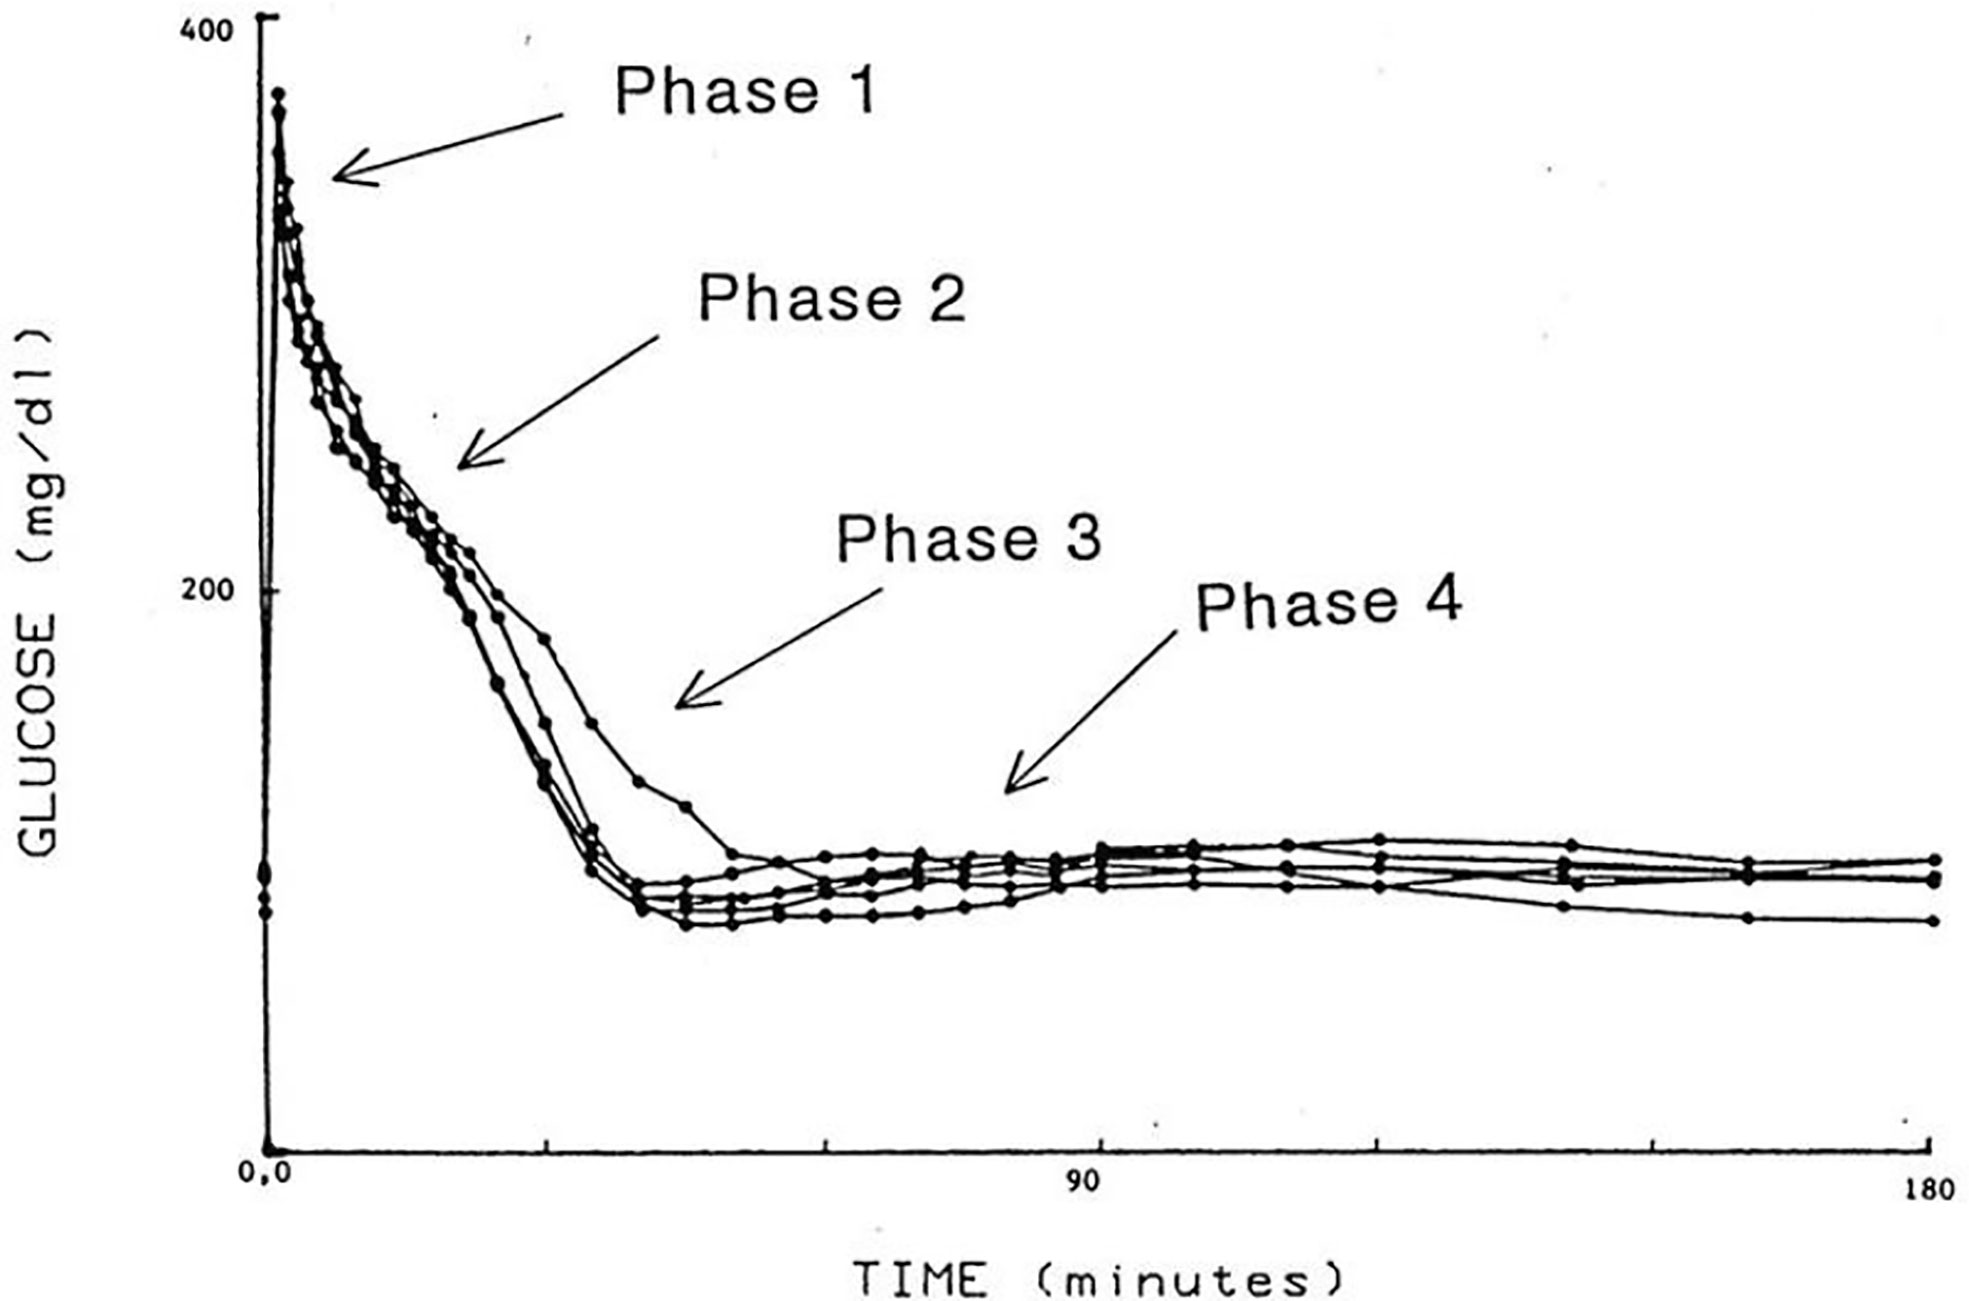
Figure 5 IVGTT phases.
Concepts Underlying the Minimal Model
With this limited data base (Figure 4), Claudio Cobelli came to Evanston IL, and we began to build the model. This was a critical period; the manuscript emerging from the 6 weeks of work in the summer of 1978 was entitled “Quantitative estimation of insulin sensitivity (9)“. It is of interest that this seminal paper has been cited over 2,000 times; ironically, it remained virtually uncited for the first 10 years after publication.
Our basic goal was to find a “minimal model”. This would be a mathematical construct which was 1) based upon known physiological principles, 2) sufficiently complex to account for the intravenous data we obtained in our laboratory, and 3) simple enough that the model parameters could be calculated from a single IVGTT performed in a single individual.
Partition Analysis
We envisioned glucose regulation as a closed loop system (Figure 6), including glucose production and uptake, and insulin release from the pancreatic β-cells. Glucagon was not included in our original representation. However, we faced a serious dilemma: we knew from our previous work that it would be a great challenge to model insulin release from the endocrine pancreas. Therefore, we applied the principle of “partition analysis (11)“; we would treat the plasma insulin concentration as an “input” to the tissues producing and utilizing glucose, and the plasma glucose as the “output,” reflecting the effect of the known insulin on the turnover of glucose. This approach allowed us to model just the insulin-sensitive tissues, while obviating the difficult problem of modeling insulin secretion from the β-cells.
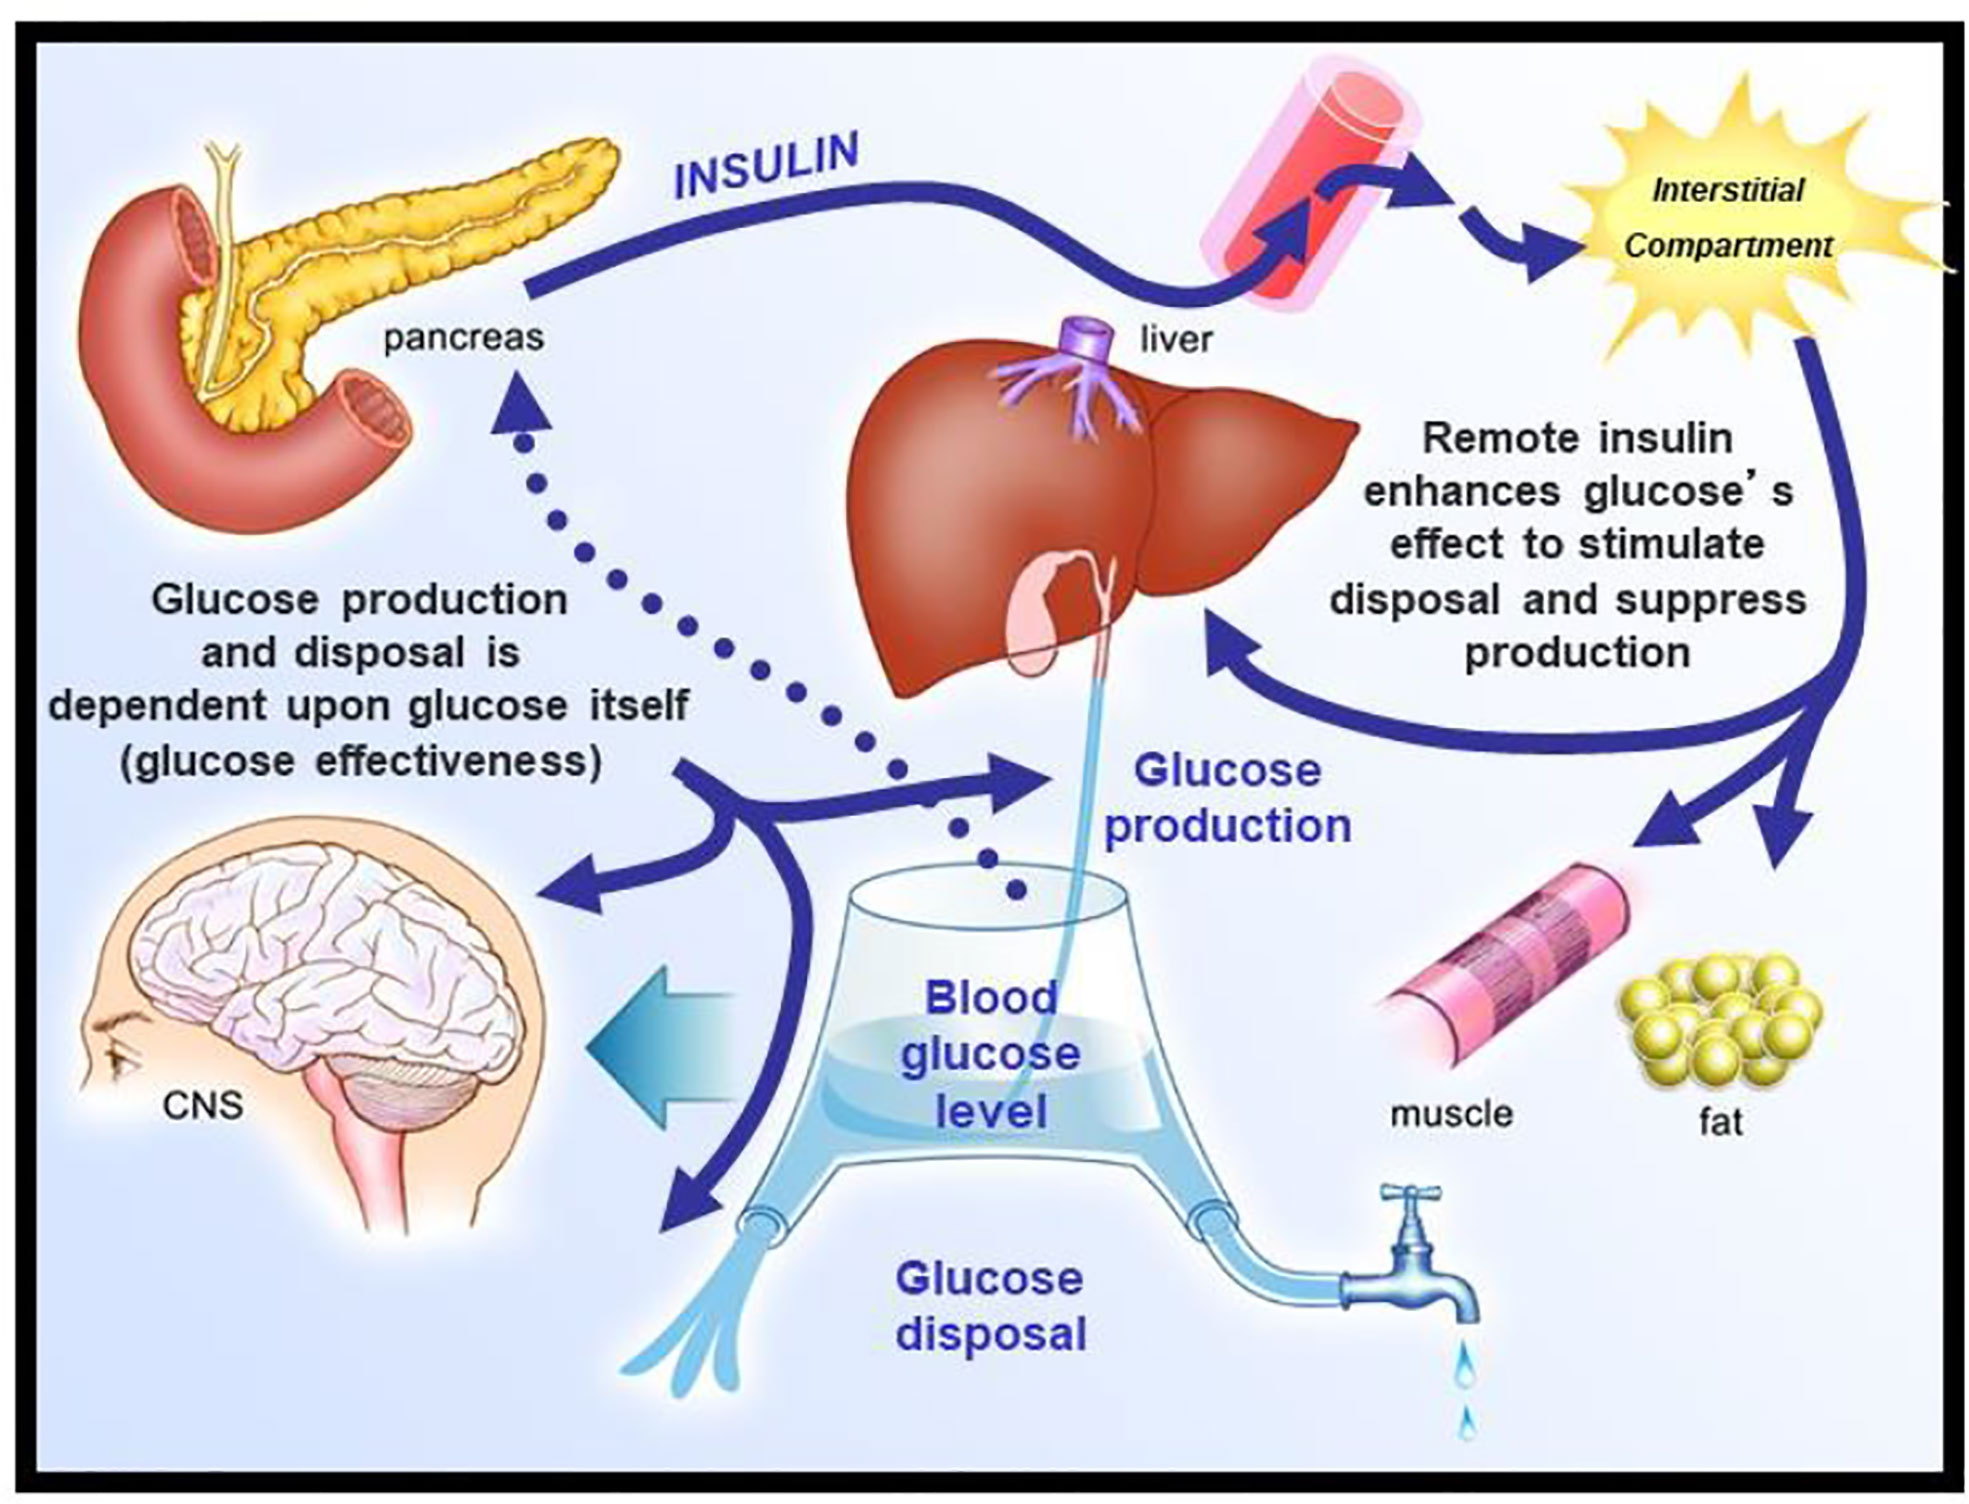
Figure 6 Closed loop system of glucose regulation.
Choice of the Model
Two approaches were possible—defining a complex model (representing all known physiology) and simplifying it, or choosing the simplest conceptual model, asking if it could account for the known data (Figure 4), and systematically introducing complexity until a best model could be found. The models we tested are in Figure 7. Note that the simplest model was glucose first order decay with no explicit insulin action; in Model 2 Michaelis Menten disappearance was added. Two compartment glucose distribution was added in Model 3. When we attempted to account for insulin glucose dynamics, we learned something very important: it was not possible to account for glucose kinetics without a delay in insulin’s effects to increase glucose utilization and suppress glucose production. As we shall see, further experimental studies which resulted from this realization that insulin’s effects were delayed in time had very important ramifications regarding insulin action in vivo. The model we finally chose, Number 6 in Figure 7, was therefore accepted as the minimal model of glucose utilization, and it remains the accepted model to this day.
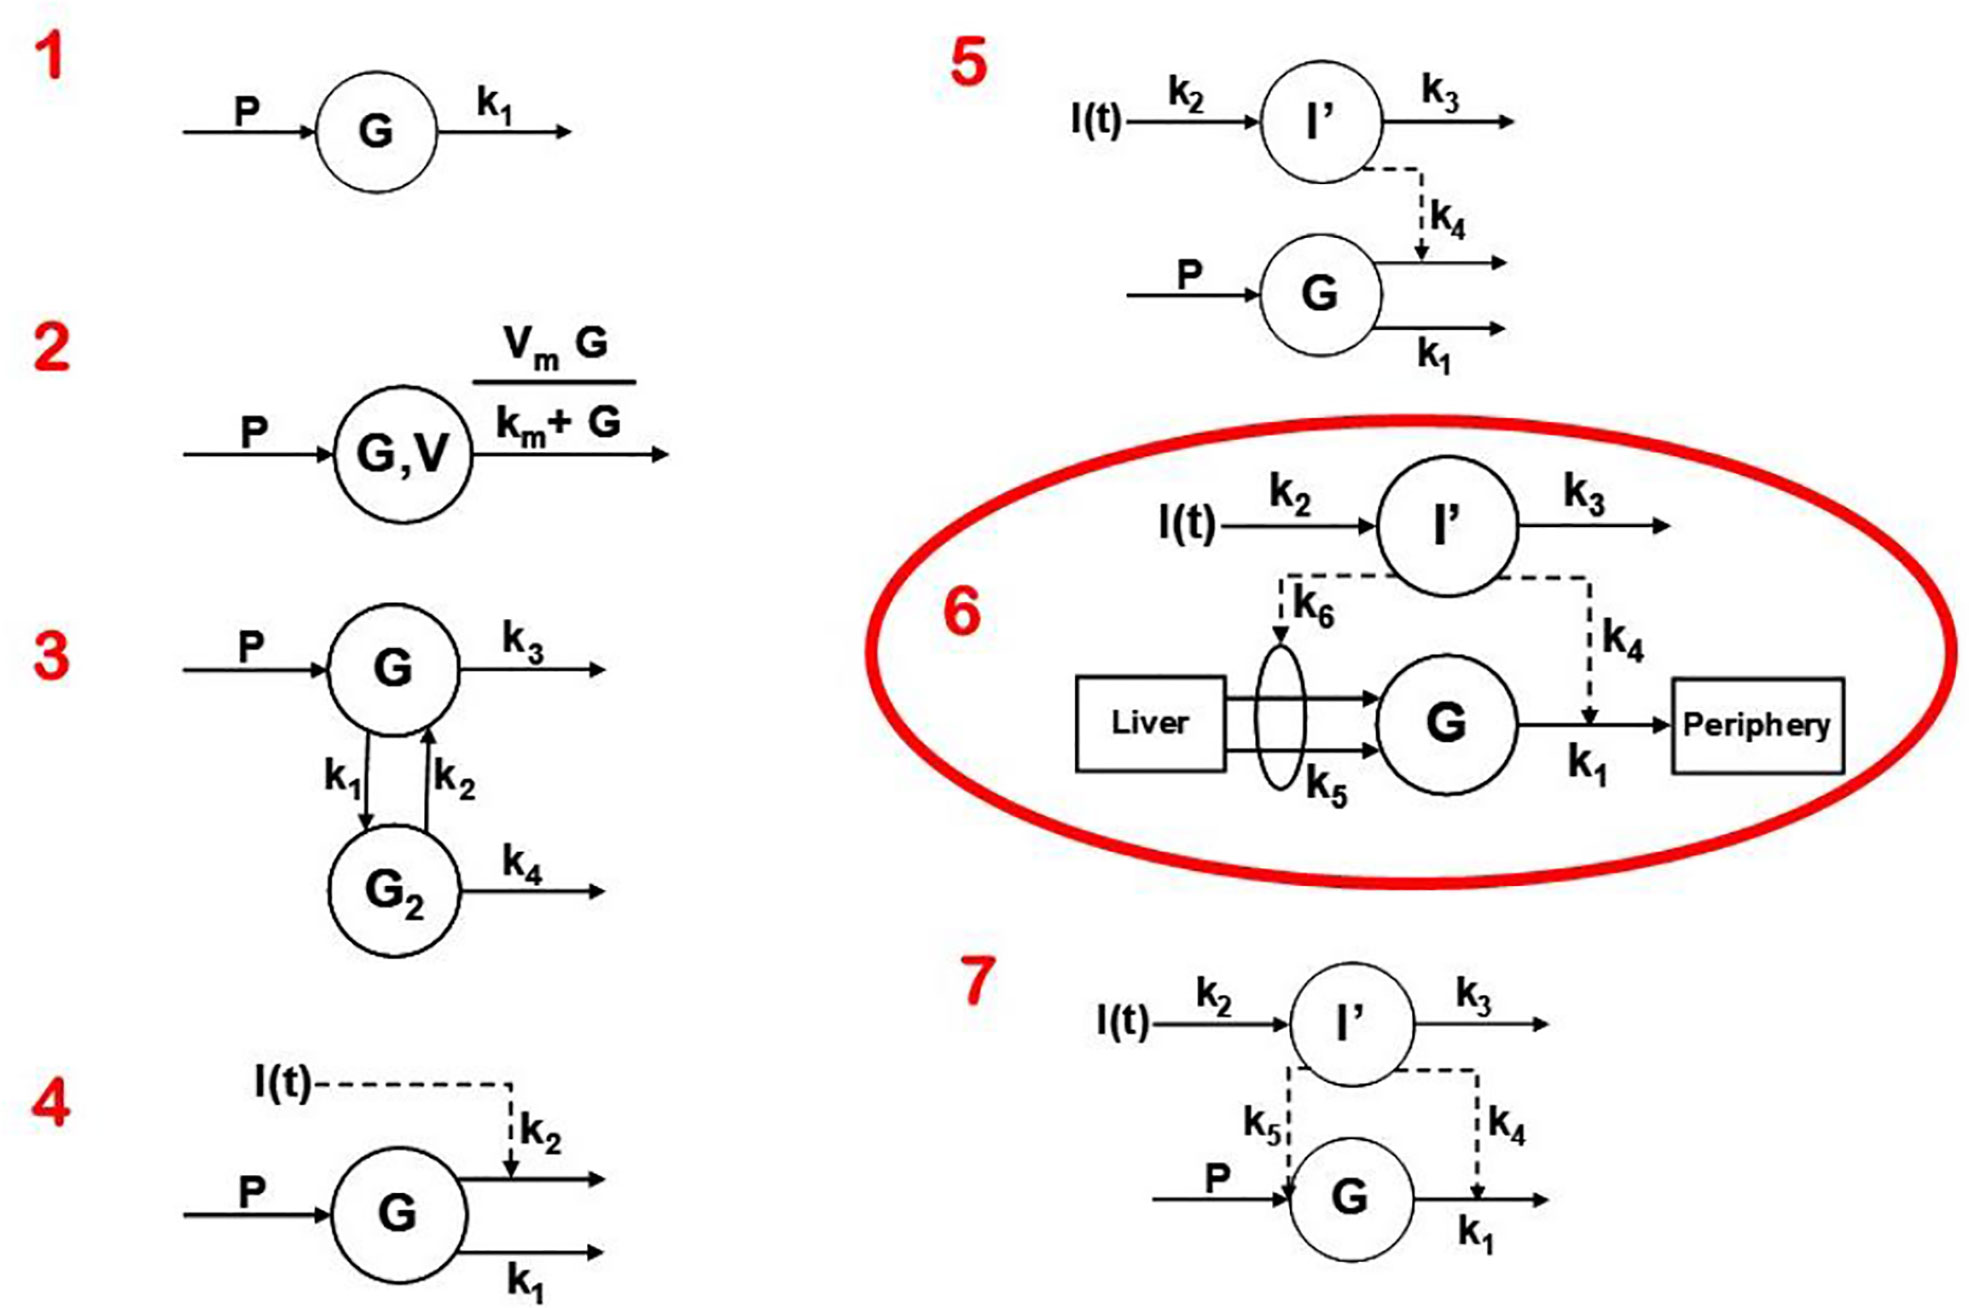
Figure 7 Models tested to determine “optimal” degree of complexity. Model 6 was chosen and was designated the “minimal model.”
Equations of the minimal model can be explained as follows (Figure 8): the model accounts for the return of glucose to the basal value after injection. As we had discovered that insulin’s effect had to be delayed, we assumed that insulin acts from a compartment remote from plasma. We hypothesized that the delay in insulin action could be due to a slow rate of movement of insulin from plasma to interstitial fluid (ISF), the latter bathing skeletal muscle. To test this concept, we performed a series of euglycemic clamp experiments in which we measured insulin in blood and in skeletal muscle lymph fluid, the latter as a surrogate of ISF (12–14). We discovered that the rate of glucose disposal was directly related to ISF insulin level, proving that the delay in insulin action in vivo is indeed explained by the slow transport of the hormone from the blood to the ISF (Figure 9).
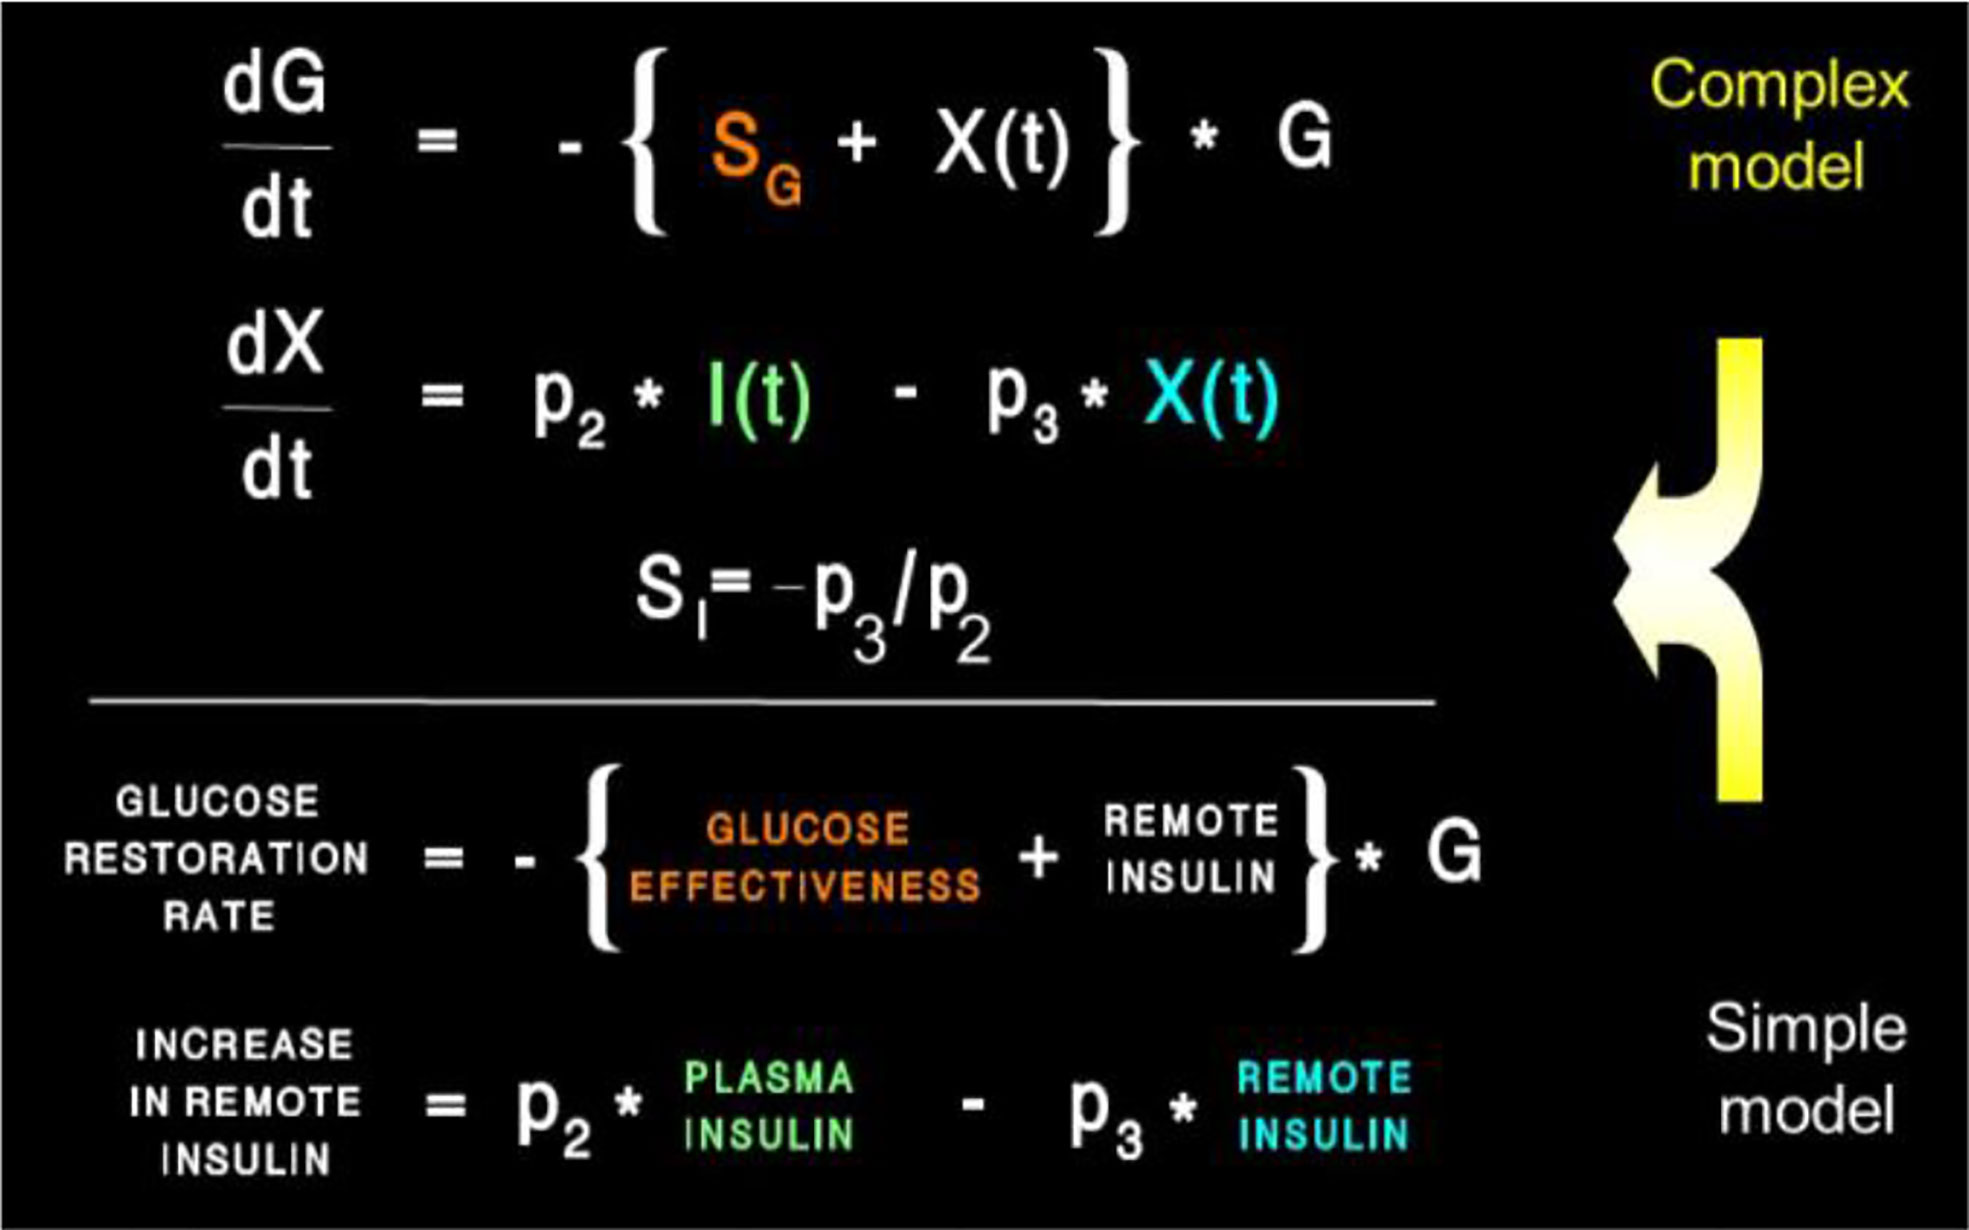
Figure 8 Equations of the minimal model and their “translation.”
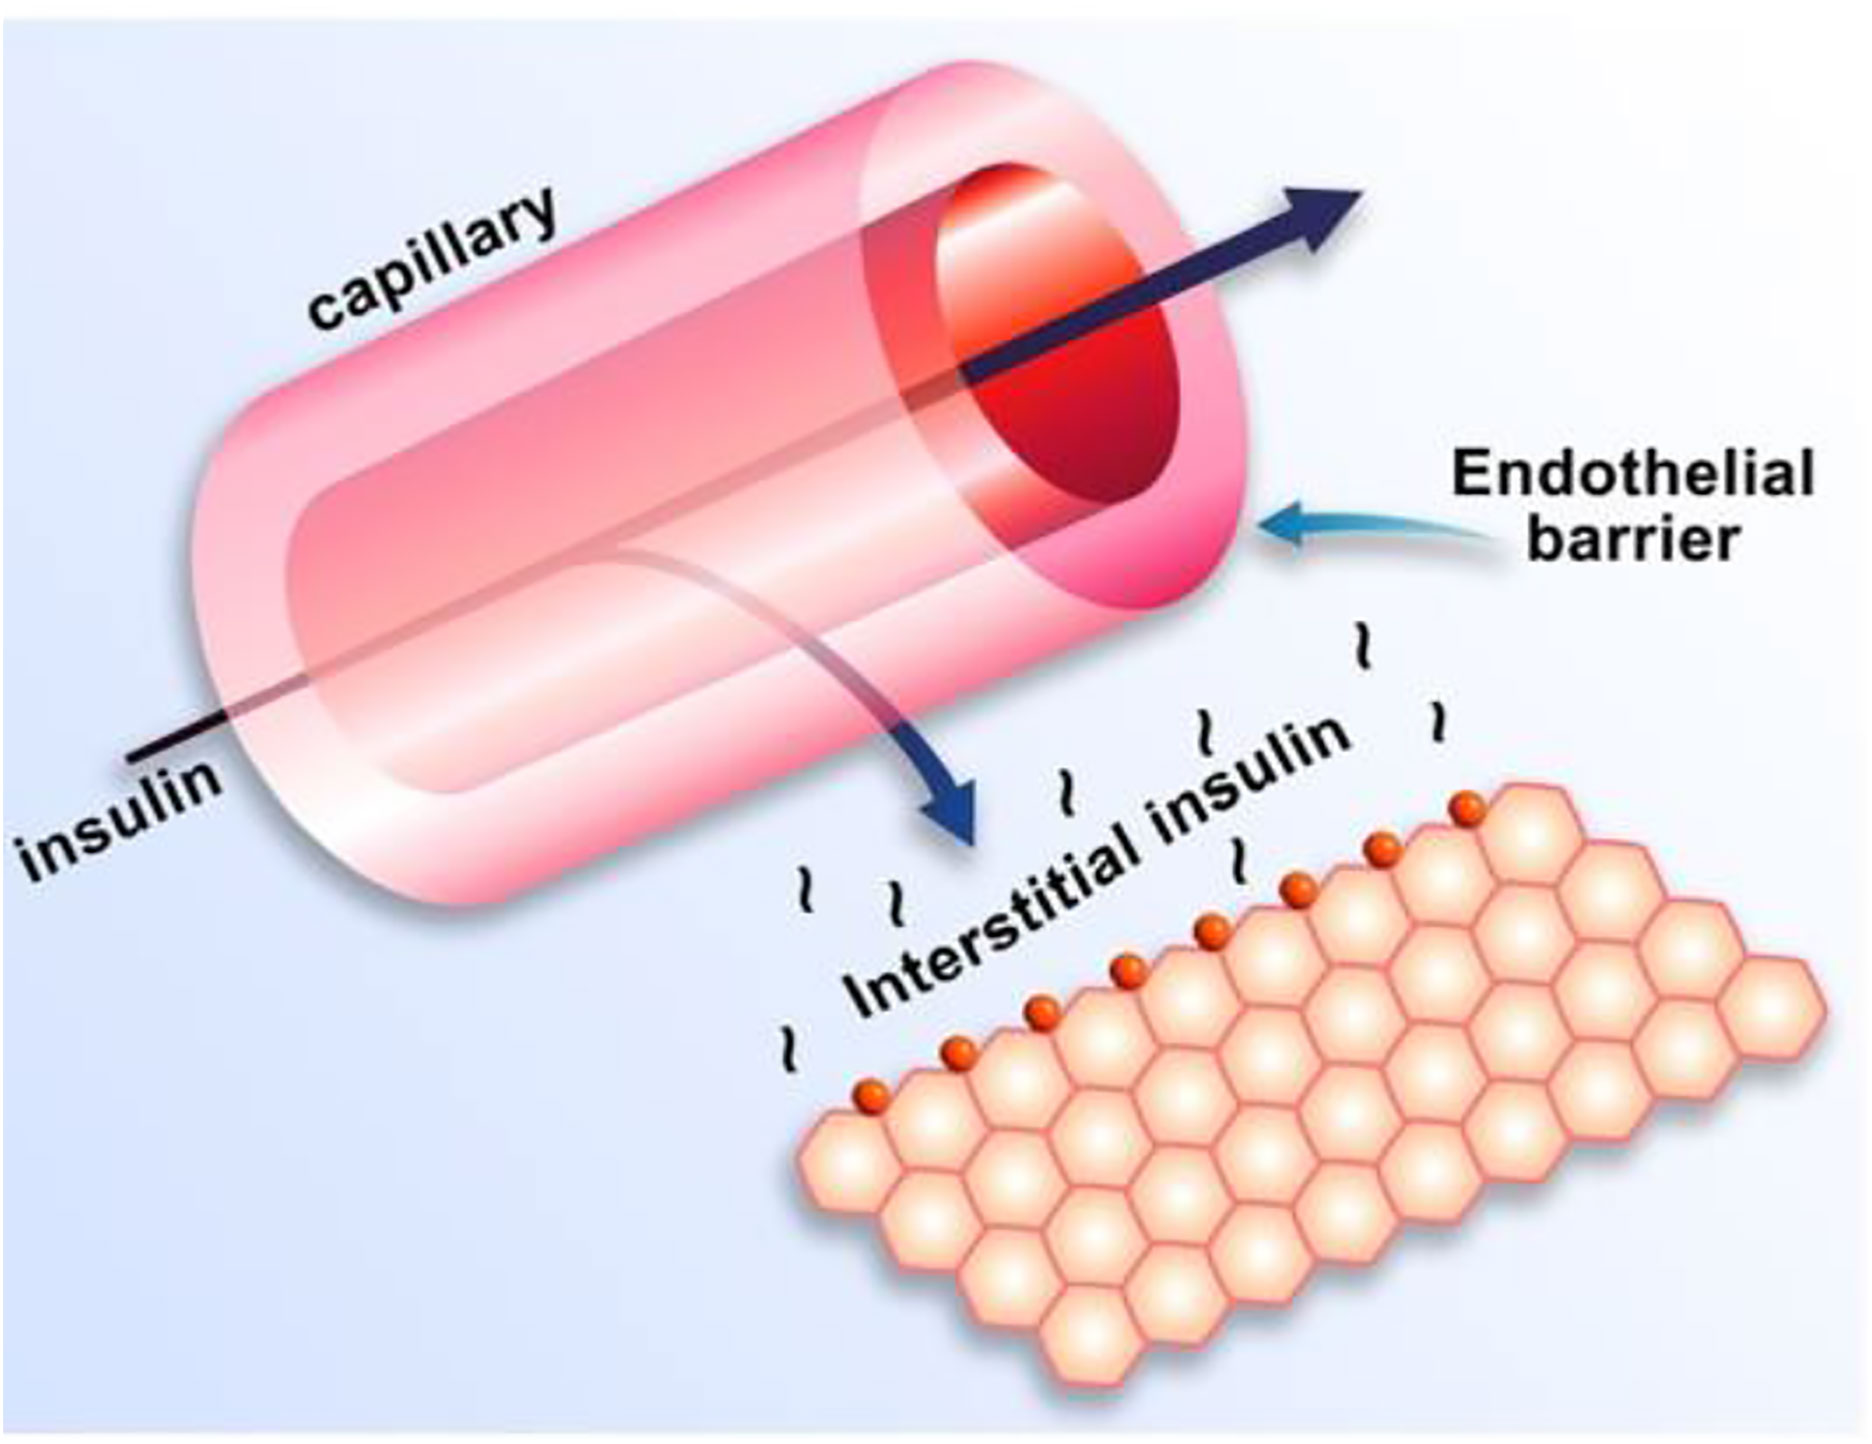
Figure 9 Schematic of insulin transport from blood to interstitial fluid.
One question that arose was why the modeling was acceptable with delays not only in insulin stimulation of glucose disposal (mediated by interstitial insulin) but also with slow insulin suppression of endogenous glucose production (EGP). It was known at the time that the binding of insulin to liver was very rapid. Why, then, was the effect of insulin to suppress glucose production similarly retarded as the disposal effect (15)? Possibly, insulin acted to suppress the liver not directly, but indirectly via a tissue remote from the liver. In fact, we hypothesized that insulin’s effect on the liver was mediated by free fatty acids (FFA); once insulin is infused, the hormone suppressed lipolysis in adipose tissue, and the resulting lowering of FFA acted to lower liver glucose production. In a series of studies carried out by Kerstin Rebrin and Garry Steil, we showed that not only was there a strong correlation between FFA suppression and the suppression of EGP, but that preventing the FFA suppression by infusion of intralipid prevented the decline in EGP (16, 17). Thus, we believe that the slow movement of insulin into ISF in adipose tissue was rate-limiting for the effect of insulin to suppress EGP; therefore, it was not necessary to include rapid suppression of EGP in the model to account for glucose dynamics in vivo.
Insulin kinetics in the minimal model are represented by equation 2; this first-order equation assumes that secreted insulin enters the ISF compartment where it is represented by variable “X,” which we now know to represent interstitial insulin. ISF insulin then exits the remote compartment by a first-order process. Glucose dynamics are represented in the first equation; the rate of return of glucose to basal following injection was envisioned to have an insulin-dependent component [in proportion to variable X(t), or ISF insulin]. Also, to model the data, it was requisite that glucose could return to basal also in proportion to its own concentration, driven by a term we referred to as parameter SG, which we named “glucose effectiveness.” Glucose effectiveness is the ability of glucose per se to normalize its own concentration. We showed that the minimal model was able to account for the dynamics of glucose observed after injection.
Insulin Resistance
There has been a debate, going back decades, regarding the relative importance of insulin resistance versus β-cell failure in the pathogenesis of Type 2 diabetes mellitus. To address this issue, we felt it necessary to attempt to measure these factors from the glucose tolerance test. Applying the minimal model to the IVGTT, is it possible to access a measure of insulin resistance? Examination of the model (Figure 8) showed that two factors determined the ability of glucose to normalize after glucose injection—insulin action, represented by the parameter SI, and glucose effectiveness (SG), which accounts for glucose’s ability to self-normalize. Represented mathematically, insulin sensitivity is given as the partial derivative of glucose disappearance on glucose and insulin. It was easy to demonstrate that this relationship results in the ratio of two parameters of the minimal model: p3/p2. Thus, we showed SI, the “insulin sensitivity index”, to be equal to the ratio of these parameters from the minimal model. This index appears in over 2,000 publications.
Insulin Sensitivity Index: Is It Accurate?
The accuracy of the SI was questioned by Reaven and colleagues (18). They claimed that in insulin resistant subjects, particularly insulin resistant patients with inadequate insulin response, the insulin sensitivity index from the minimal model correlated poorly with insulin sensitivity calculated from the euglycemic glucose clamp. Reaven’s manuscript, which appeared to be a blow to the minimal model method, was actually a godsend. We realized that a greater insulin pattern in blood would be necessary to accurately calculate insulin sensitivity from the IVGTT in resistant subjects. We therefore modified the IVGTT profile by adding an injection of the insulin secretagogue tolbutamide 20 min after glucose (Figure 10). Later the protocol was changed to inject insulin itself at 20 min after glucose, rather than tolbutamide (19).
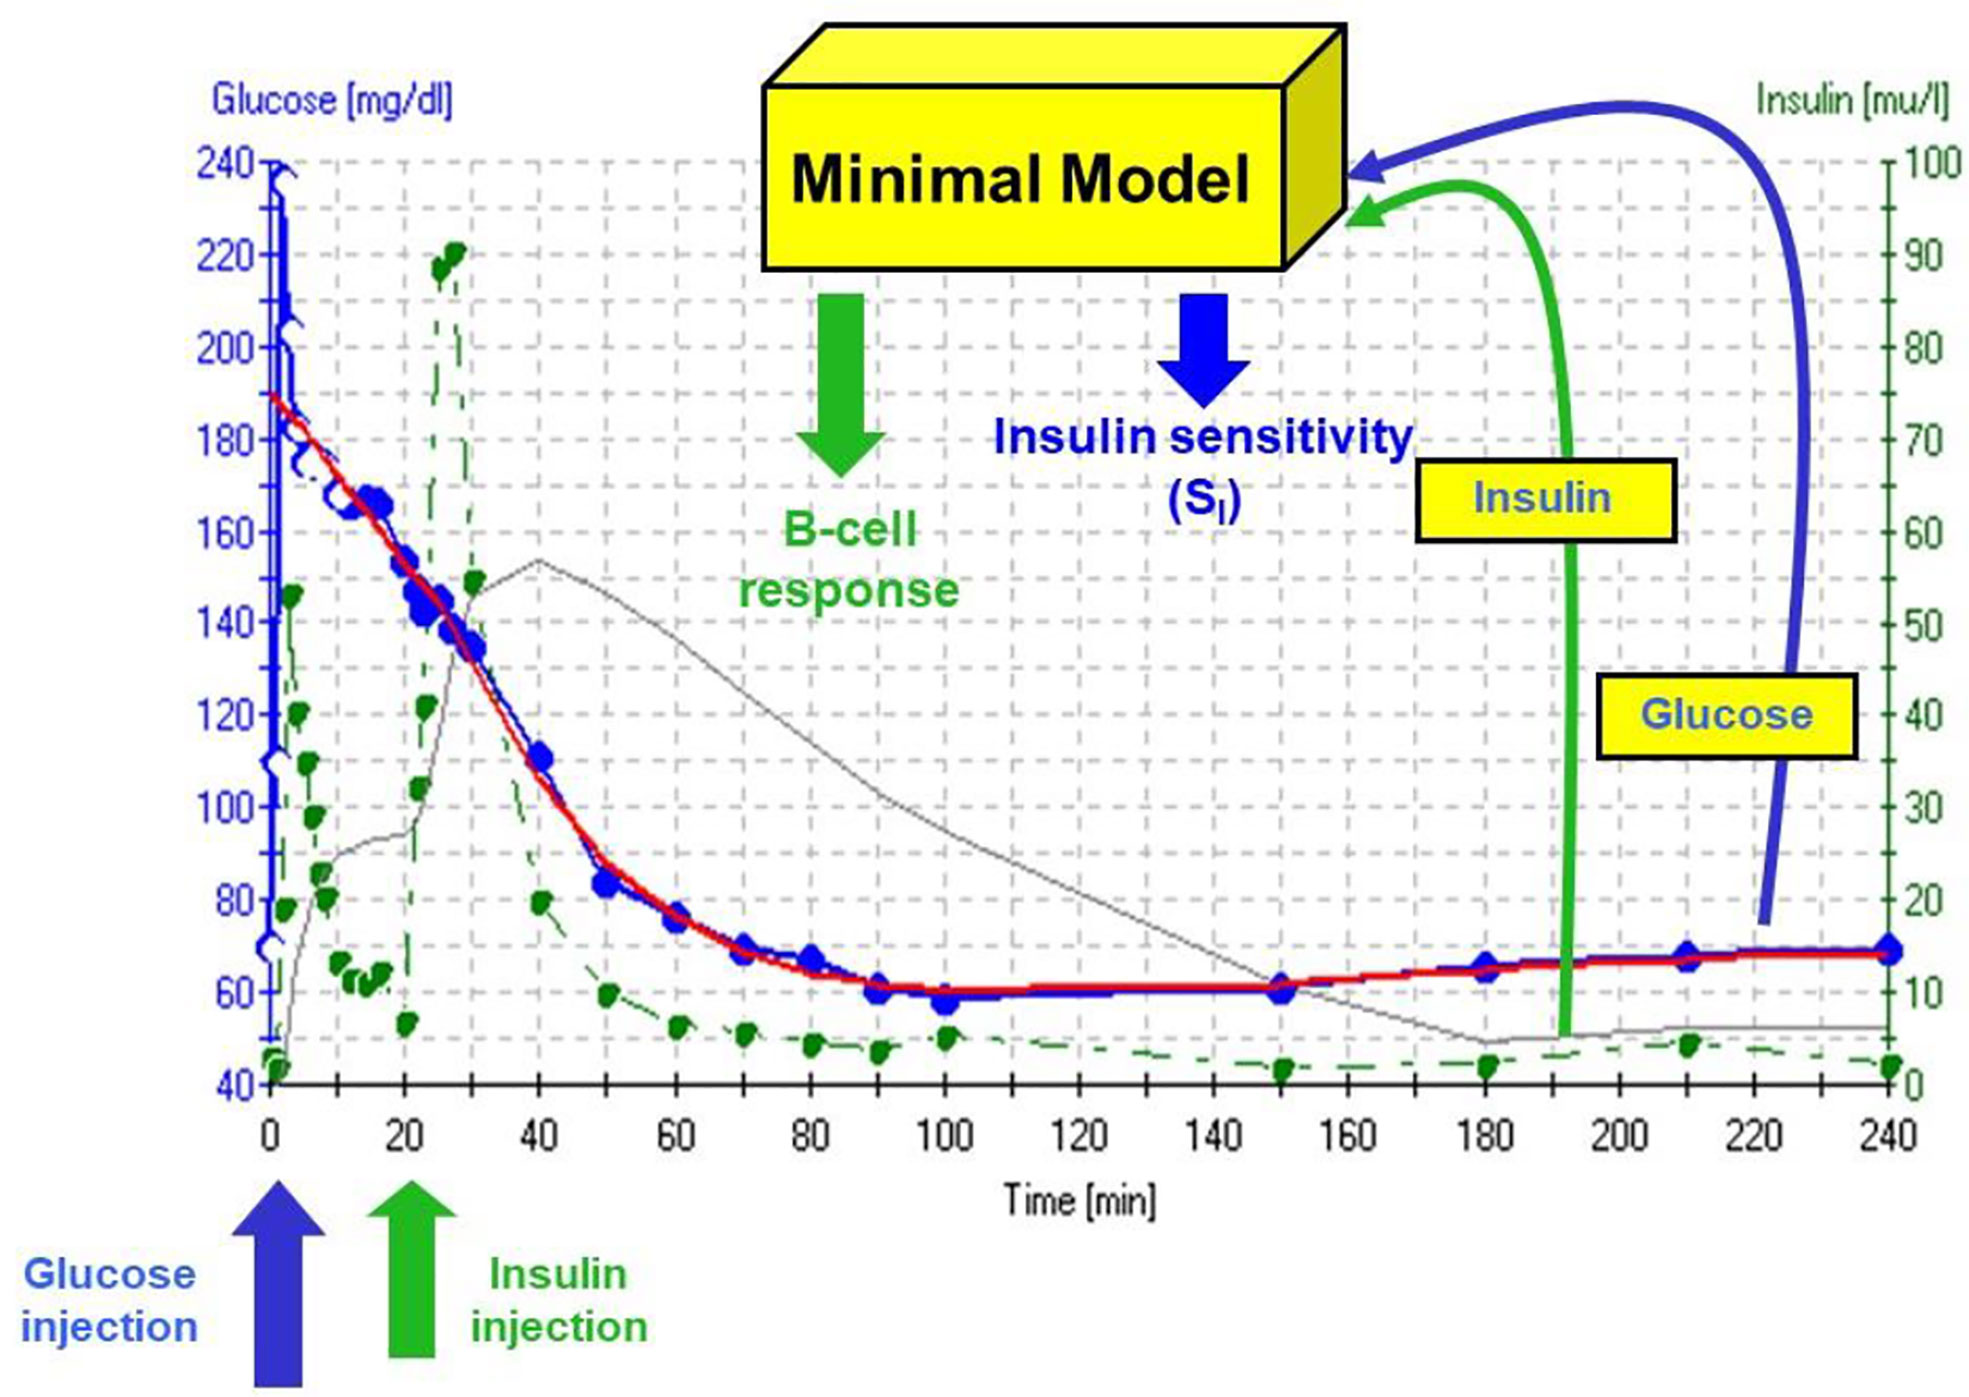
Figure 10 IVGTT protocol and minimal model output. Insulin data are”input” to the minimal model, which determines the best fit of the glucose dynamics and model parameters for that IVGTT.
Validation of SI
It is generally assumed that the euglycemic glucose clamp (EGC) is the “gold standard” for the estimation of insulin sensitivity. Because most endocrinologists are not familiar with mathematical modeling, and may not trust modeling, it was of interest to validate the insulin sensitivity of the minimal model experimentally versus the clamp.
Validation studies were first carried out in the dog, where a significant correlation was observed between SI and insulin sensitivity calculated from the EGC [r = 0.82, (20)]. This result was confirmed in human volunteers by Beard et al. (21). These studies alone supported the use of the IVGTT-based SI for a relative measure of insulin sensitivity. However, the question naturally arose as to whether the IVGTT was measuring the same physiological process as the glucose clamp. Therefore, in collaboration with Jerrold Olefsky and colleagues, we compared minimal model values against the clamp (22). More important, we asked whether we could determine the IVGTT sensitivity values for a cohort of human subjects, and then determine what the clamp-based measures were in the same subjects. The strong correlation between IVGTT and clamp not only validated the IVGTT method, but also demonstrated equivalency with the clamp, when data from the two methods were expressed in identical units. We showed that insulin sensitivity from the clamp, defined as change in glucose disposal (ΔRd) induced with a measured change in plasma insulin (ΔI) per steady state glucose value [= ΔRd/(ΔI x G)], normalized by body surface area, was directly comparable to minimal model-derived SI times the body distribution volume (SI x VD). In fact, correlation in a group of individuals of varying body mass index was excellent; more important, the relationship had a slope not different from 1.0, and the regression line passed through the origin, demonstrating a lack of bias (Figure 11). These multiple validation studies supported the use of the IVGTT with minimal modeling as a potent tool to be used to study insulin action in vivo in large animals or human volunteers.
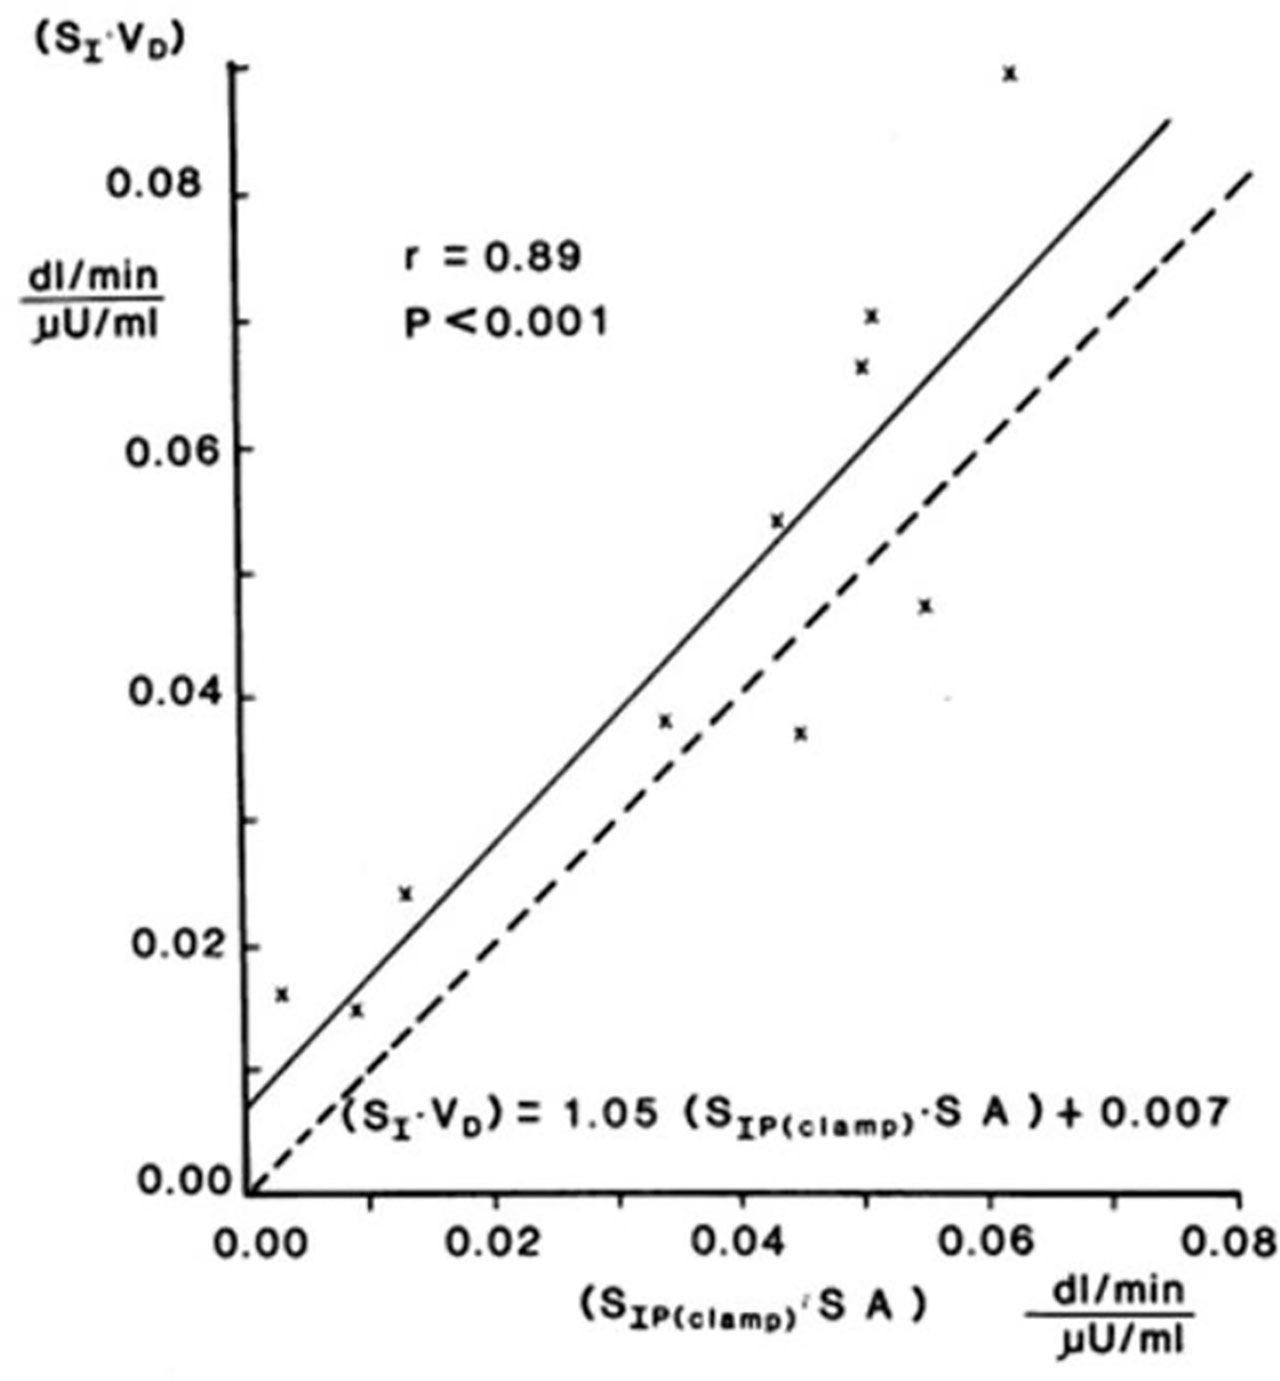
Figure 11 SI equivalence between minimal model and clamp.
The Disposition Index (DI)
As previously stated, a debate regarding the relative importance of insulin resistance versus β-cell dysfunction in the pathogenesis of Type 2 diabetes raged for decades (23, 24). With the minimal model in hand, we hoped to contribute to help resolve this debate. We became interested not only in the measurement of insulin sensitivity and insulin release, but the relationship between the two. We hypothesized that in the face of insulin resistance, β-cell function would improve, and thus resist any change in glucose tolerance (Figure 12). We quantified this hypothesis as what became known as the “Hyperbolic Law of Glucose Tolerance (25)”.
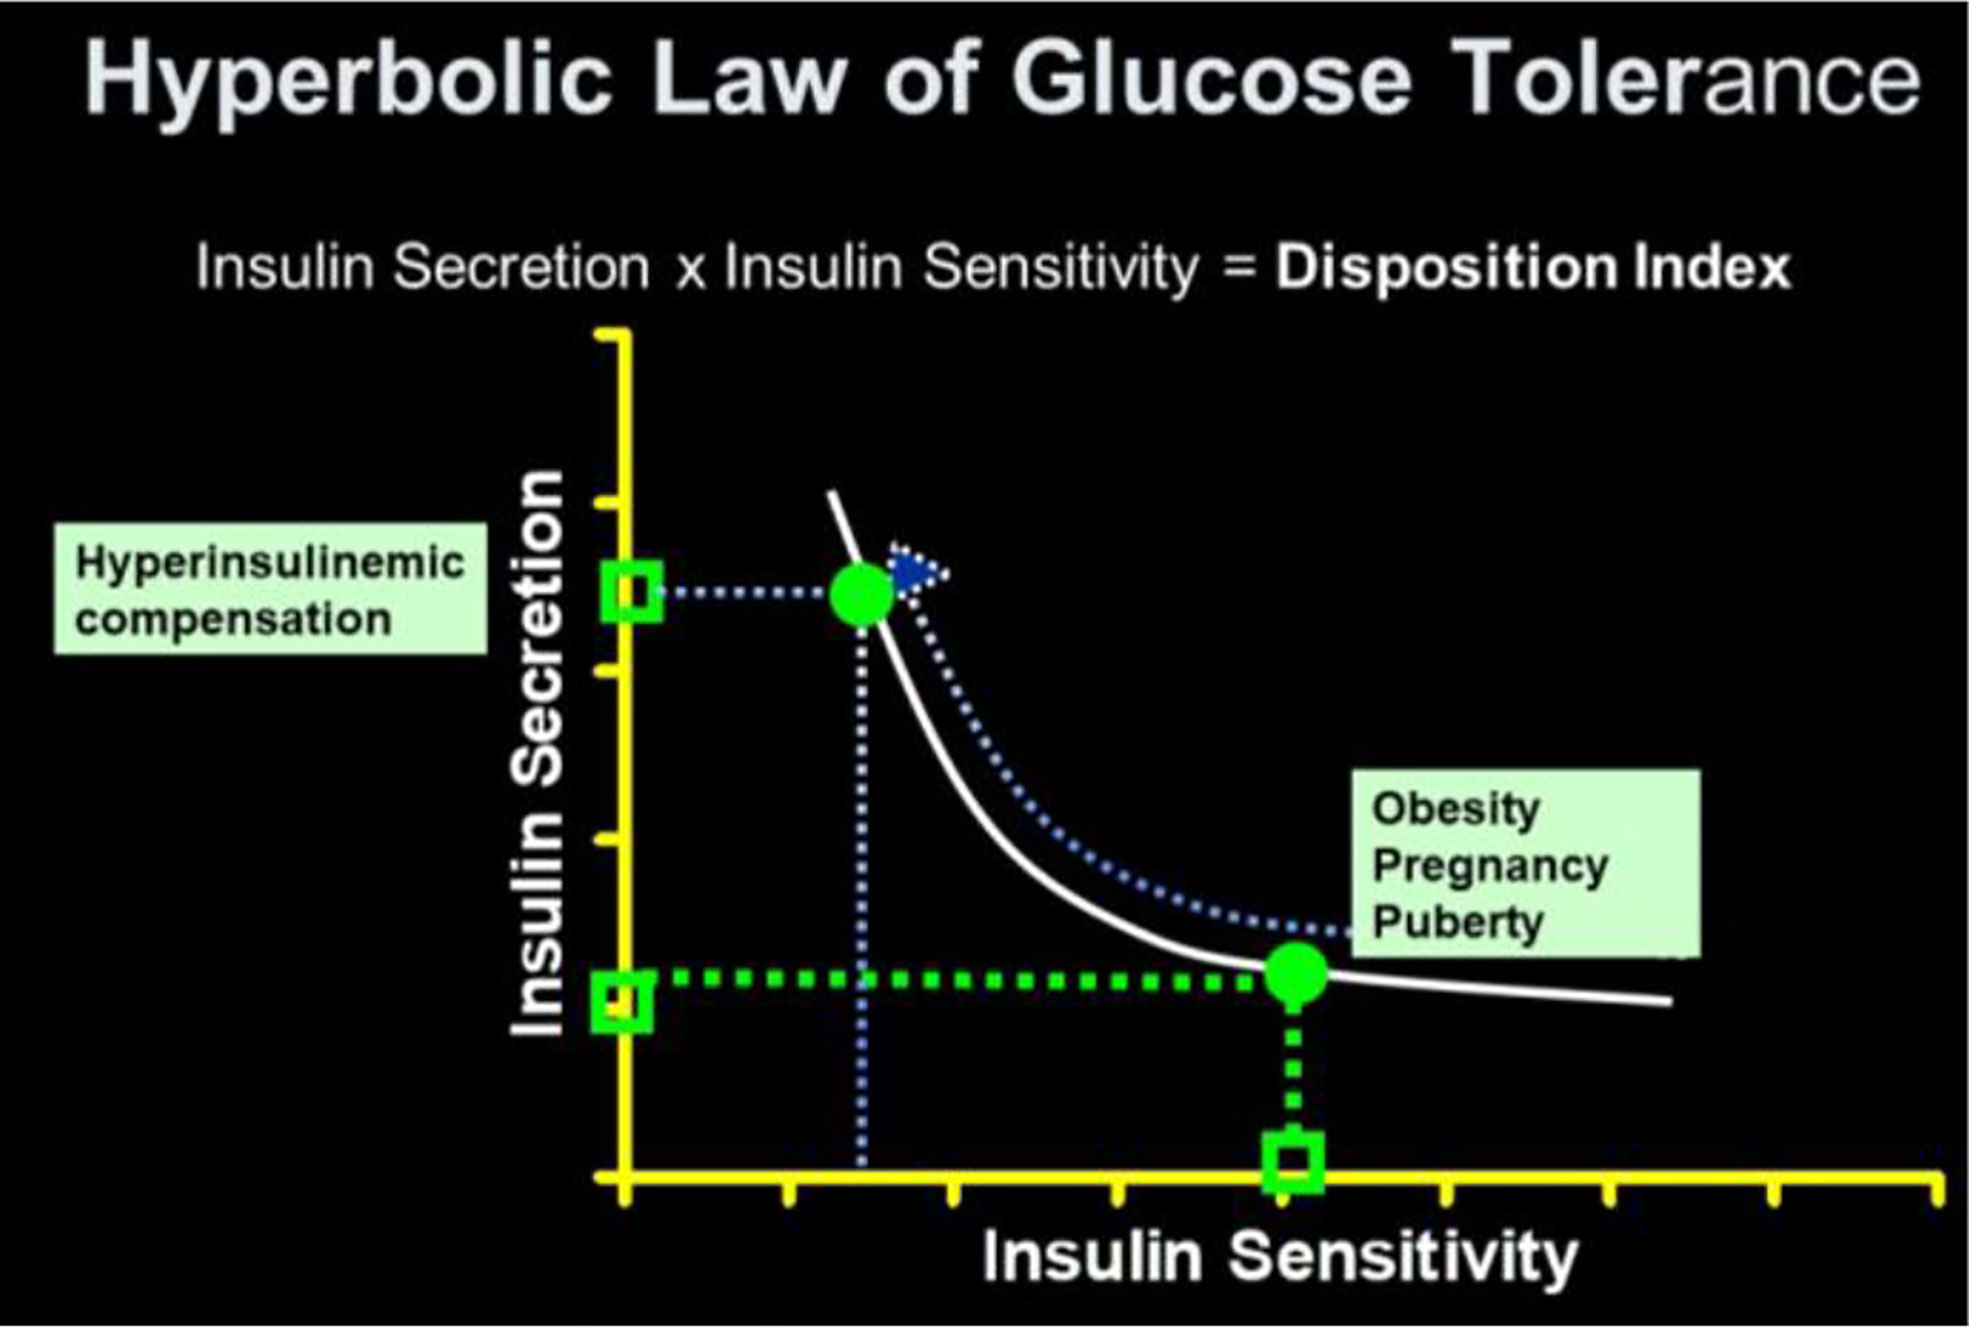
Figure 12 Disposition index (DI).
This law can be stated as the following equation of a rectangular hyperbola:
in which SI is insulin sensitivity, as discussed above, AIRglucose is the first phase response of plasma insulin to the glucose injection, and DI was named the “Disposition Index”.
After defining the hyperbolic relationship, we applied it to human subjects (26). It was shown that the product of insulin secretory response (which can be assessed as the first phase insulin response to glucose injection) multiplied by insulin sensitivity would be approximately constant in normal individuals. While initially controversial, the DI has now been accepted overwhelmingly by the diabetes community as the most accurate measure of β-cell function, and it has been cited in almost 1,000 publications as of this writing (Figure 13).
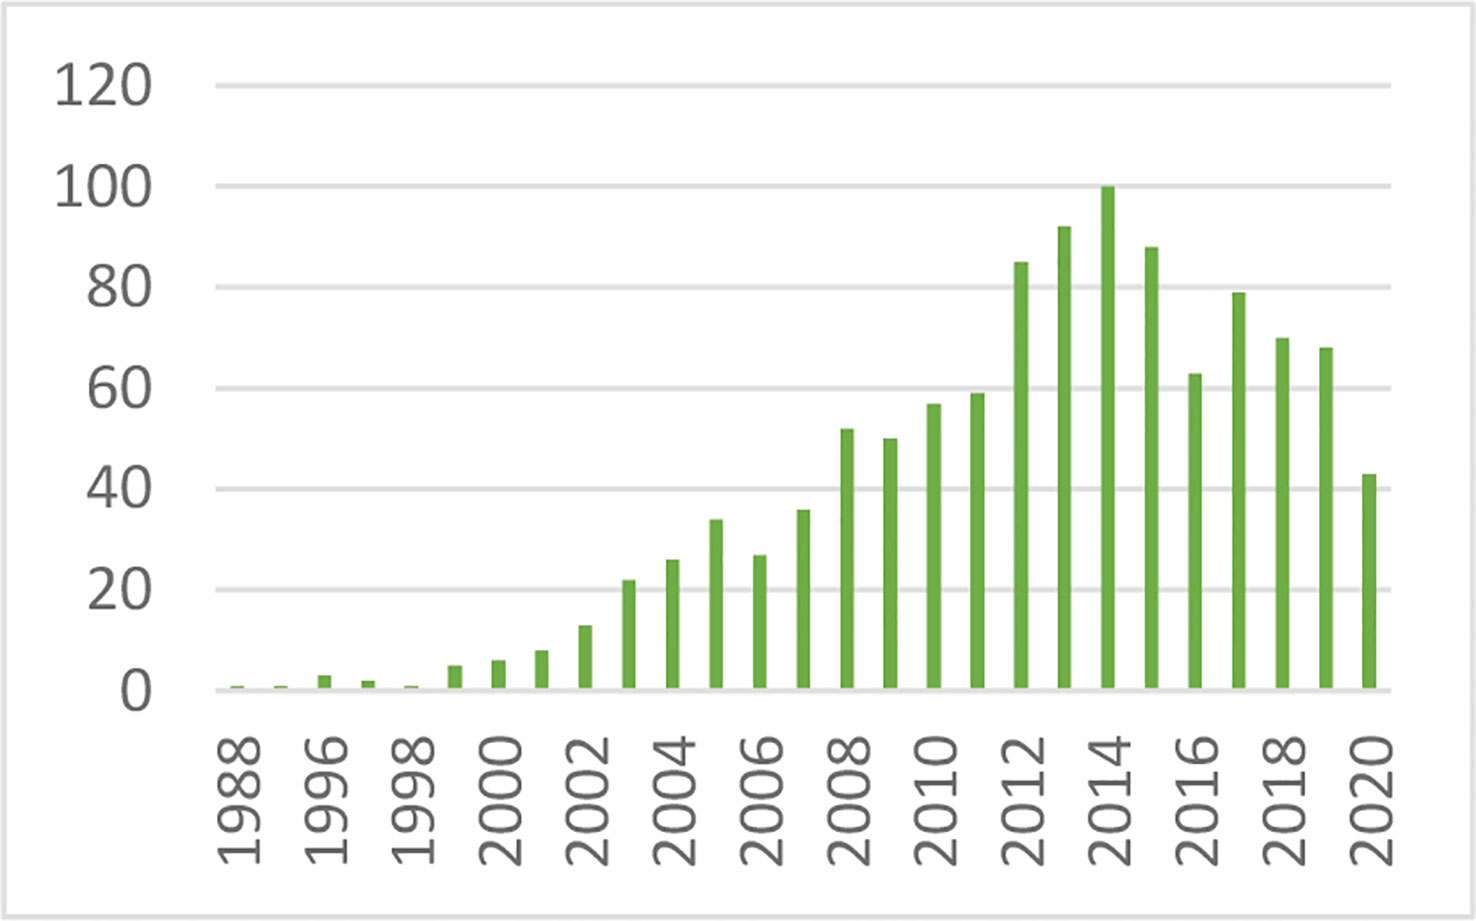
Figure 13 Cited publications pertaining to the DI.
The DI represents the ability of the islet cells to compensate for insulin resistance. The resistance can be due to a variety of environmental changes, including obesity, pregnancy, and PCOS. The β-cells act to compensate, and under normal conditions prevent the frankly diabetic state. This is shown clearly in pregnancy, where severe insulin resistance in the third trimester is compensated by a massive islet cell response; glucose tolerance remains normal (27). Epidemiological studies have demonstrated that lower DI is a strong predictor of future diabetes (28, 29), and genetic studies have identified predictive variants related to DI (30). Weyer and colleagues showed in Pimas that lower DI predicts decline to Type 2 diabetes, whereas higher DI is protective [Figure 14; (31)]. It is of interest to remember that the DI emerged as a “child” of the minimal model itself; once it was possible to measure insulin sensitivity from the IVGTT, it was only natural to consider the relation to pancreatic islet cell function.
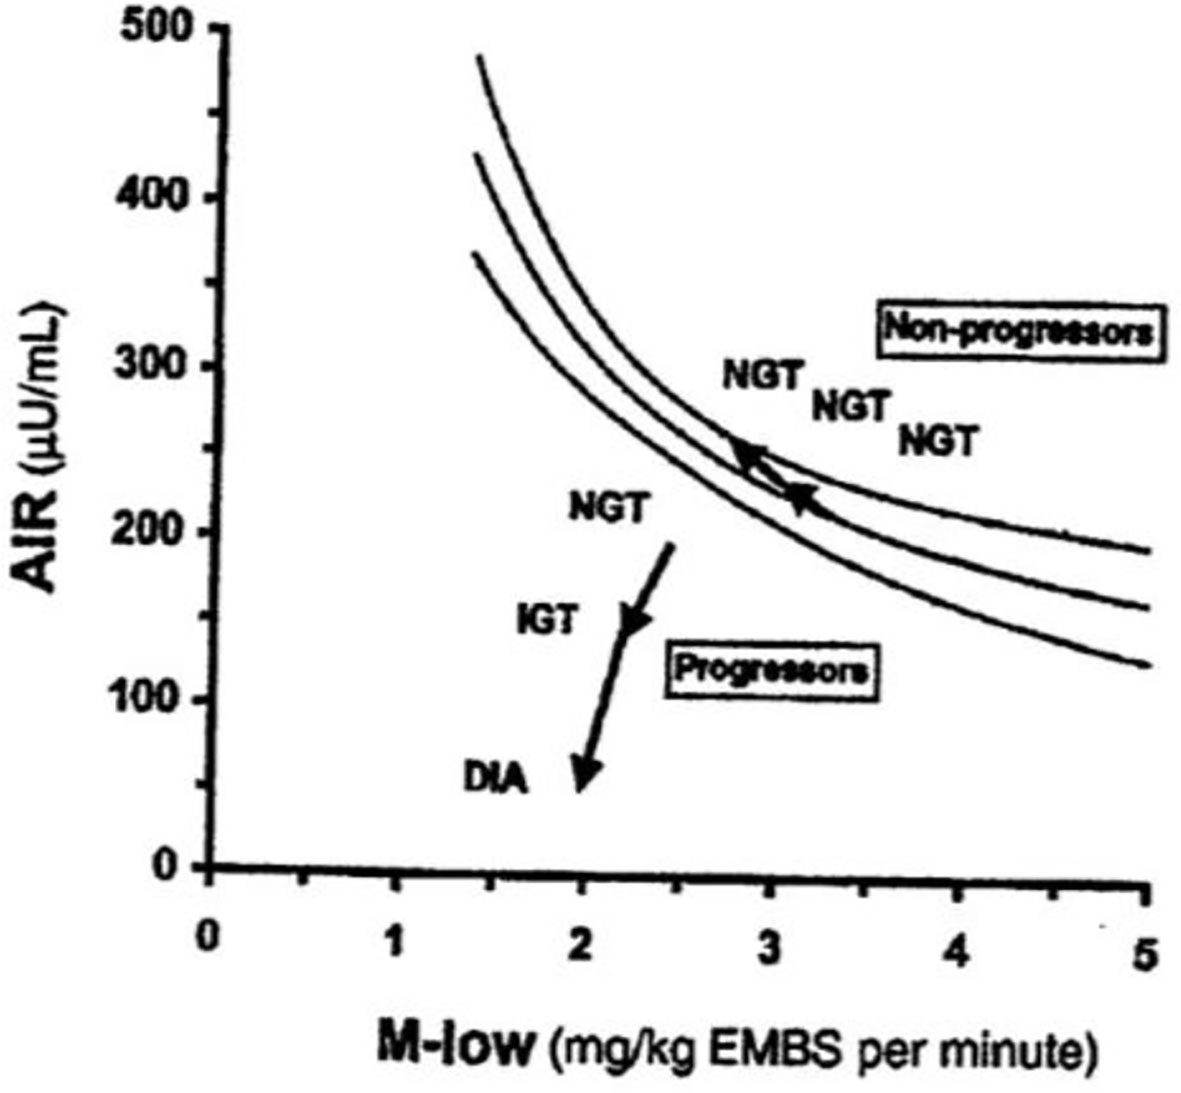
Figure 14 Predictive impact of DI on diabetes risk.
An unanswered question that remains is the underlying mechanism accounting for the hyperbolic relationship. We followed the development of enhanced insulin secretory response in normal dogs, demonstrating that the hyperbolic relationship is a dynamic one, as insulin response increased in proportion to insulin resistance (32). Experiments to identify the blood-borne signal responsible for the increase in insulin response suggested that nocturnal free fatty acids, peaking in the middle of the night, might provoke the enhanced secretory response, since blocking the nocturnal rise prevented the increment in the islet response (33); a similar mechanism is apparent in human volunteers (34). More data are needed to confirm or deny this latter mechanism in animals and in human subjects.
Additional Factors
While historically focus was on insulin resistance and islet cell response, other factors can play a major role in the ability of the organism to utilize carbohydrate efficiently. Additional factors include insulin clearance and “glucose effectiveness” [Figure 15; (35, 36)]. Our laboratory has recently focused more on these additional factors. (Because our research has been based upon intravenous glucose administration, we have focused less on gastrointestinal agents such as GLP-1 and GIP).
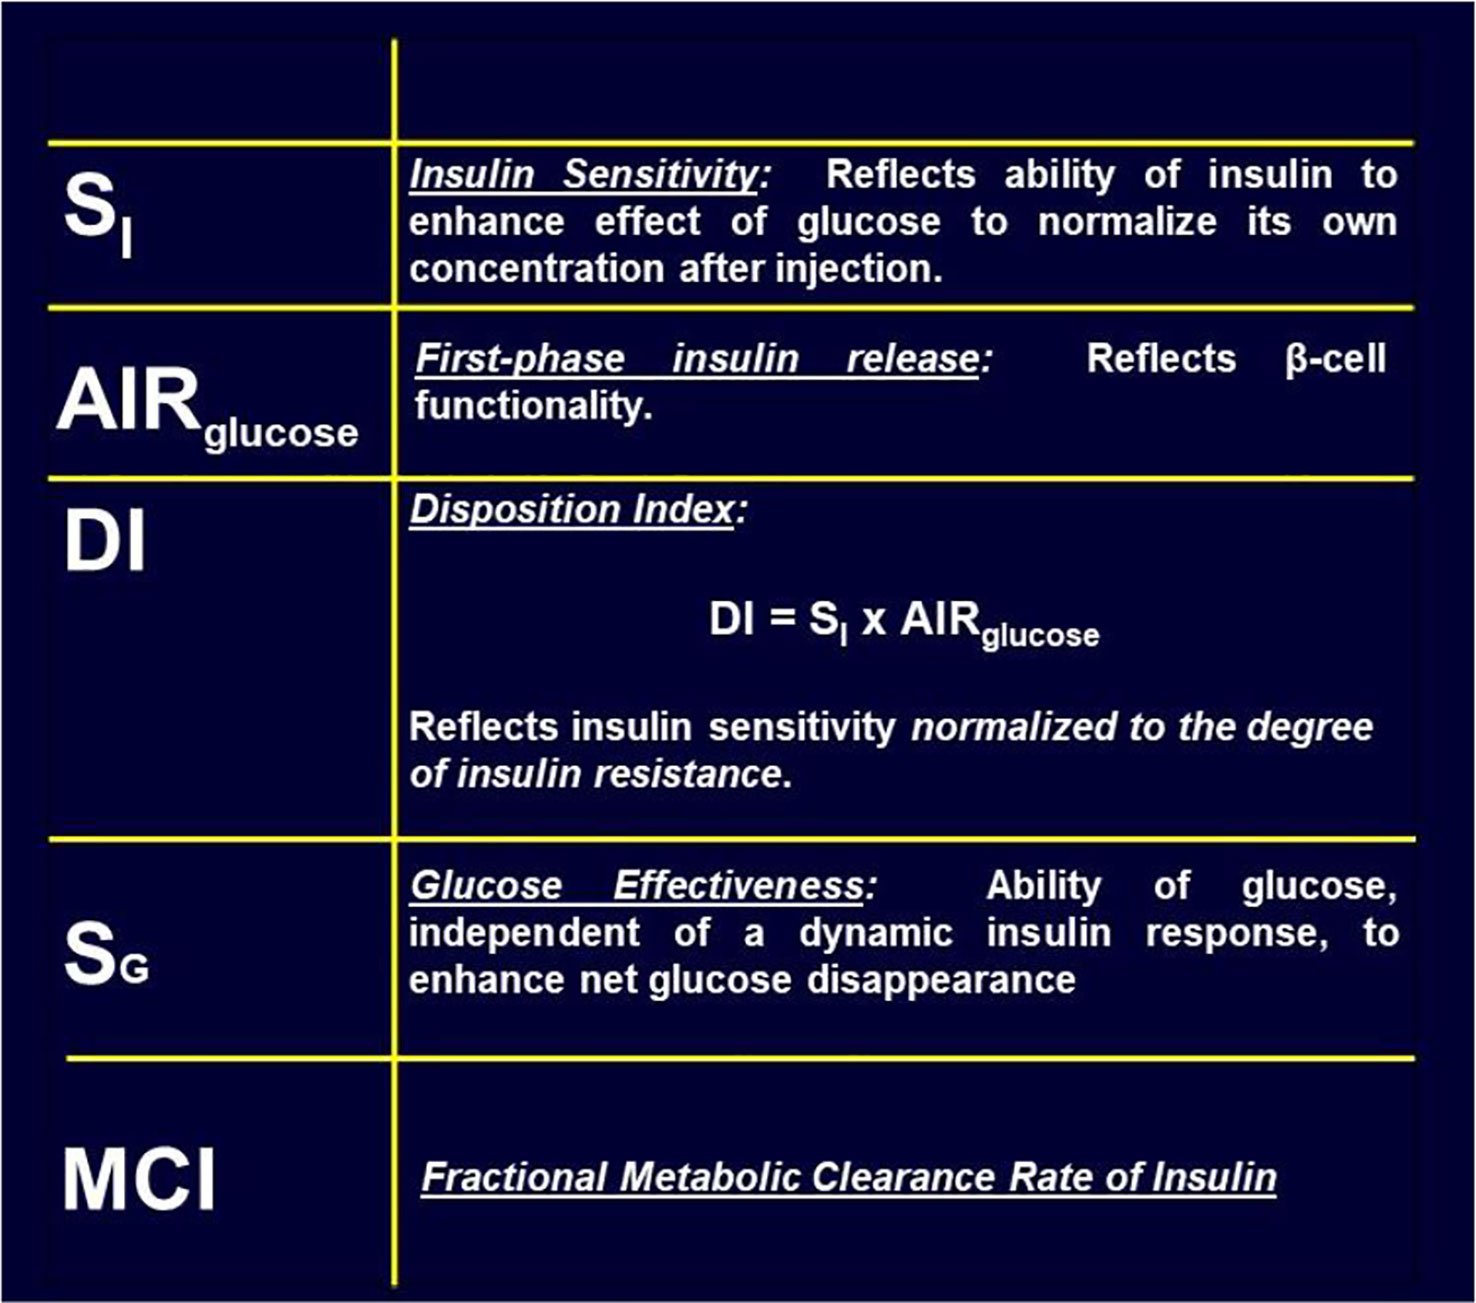
Figure 15 Factors contributing to glucose tolerance.
Insulin Clearance
Insulin is degraded primarily by liver and kidney. In fact, once secreted from the pancreas, about half the insulin presented to the liver via the portal vein is degraded and does not enter the systemic circulation. Our laboratory has recently considered the following question: “why would evolution choose to degrade half the secreted insulin before it has a chance to act to enhance glucose utilization by skeletal muscle and other tissues?” Working with the canine model allowed us to measure insulin clearance directly by comparing insulin infusion into the portal vein with systemic insulin infusion. Given matched infusion rates, the former route would result in less systemic insulin concentrations. By comparing insulin levels resulting from different routes of insulin administration, an accurate assessment of insulin clearance can be calculated (37, 38). We were surprised to discover a substantial variance in insulin degradation rates, even in normal animals; rates varied from 22 to 77% of portally presented insulin degraded during the initial pass through the liver (37).
Working with David Polidori of Janssen Research, and Francesca Piccinini in our laboratory, we developed a new non-invasive model which allowed for estimation of first-pass hepatic clearance of insulin in human volunteers [Figure 16; (39)]. We were fortunate to obtain data from Drs. Barbara Gower and Jose Fernandez of the University of Alabama at Birmingham, which allowed us to apply our model to a human cohort from different ethnic groups (White, Hispanic American, African American), including nondiabetic adults and children, ages 7–13 years. In both adults and children, we confirmed that insulin clearance rates were significantly lower in African Americans than in Whites (40, 41). This lower insulin clearance can explain the hyperinsulinemia of African Americans (adults and children), which may contribute to the higher risk of Type 2 diabetes in those individuals. In our laboratory, we continue to examine the importance of variations in insulin clearance rates to diabetes risk, and mechanisms underlying the variations in clearance across different populations. While the mechanisms of insulin clearance, particularly in the liver, remain to be more clearly defined, it is apparent that insulin degrading enzyme (IDE) and CEACAM1 may both be involved (42). We have hypothesized that reduction in insulin clearance, particularly in liver, might be one cause of Type 2 diabetes, at least in some individuals. The concept is illustrated in Figure 17. Lower hepatic insulin clearance (in African Americans, for example) would result in a larger proportion of secreted insulin bypassing first-pass degradation of the hormone. This would result in systemic hyperinsulinemia, both at fasting and after nutrient intake. Hyperinsulinemia has been shown to downregulate insulin action in skeletal muscle (43, 44). The resulting insulin resistance would stress the pancreatic β-cells, potentially leading to prediabetes or diabetes itself (lower clearance, insulin resistance, and reduced β-cell function). While the putative importance of this hypothetical mechanism of diabetes pathogenesis remains to be proven, very recent data emerging from the NIH studies of diabetes in the Pima Nation appear to support this hypothesis. The NIH investigators, led by Douglas Chang, have very recently reported that in a study of 570 Pimas, followed over a period of 8 years, lower insulin clearance (measured by the glucose clamp) was a strong predictor of conversion from prediabetes to Type 2 diabetes mellitus, and this effect of lower insulin clearance was apparently independent of other factors (45). The NIH study appears to be a direct confirmation of the lower clearance hypothesis. However, further studies of the importance of insulin clearance in pathogenesis of diabetes remain to be done. Of particular interest is whether lower clearance is predictive in other ethnic groups, and what fraction of those who convert from prediabetes to diabetes may be due to reduced clearance, or other factors.
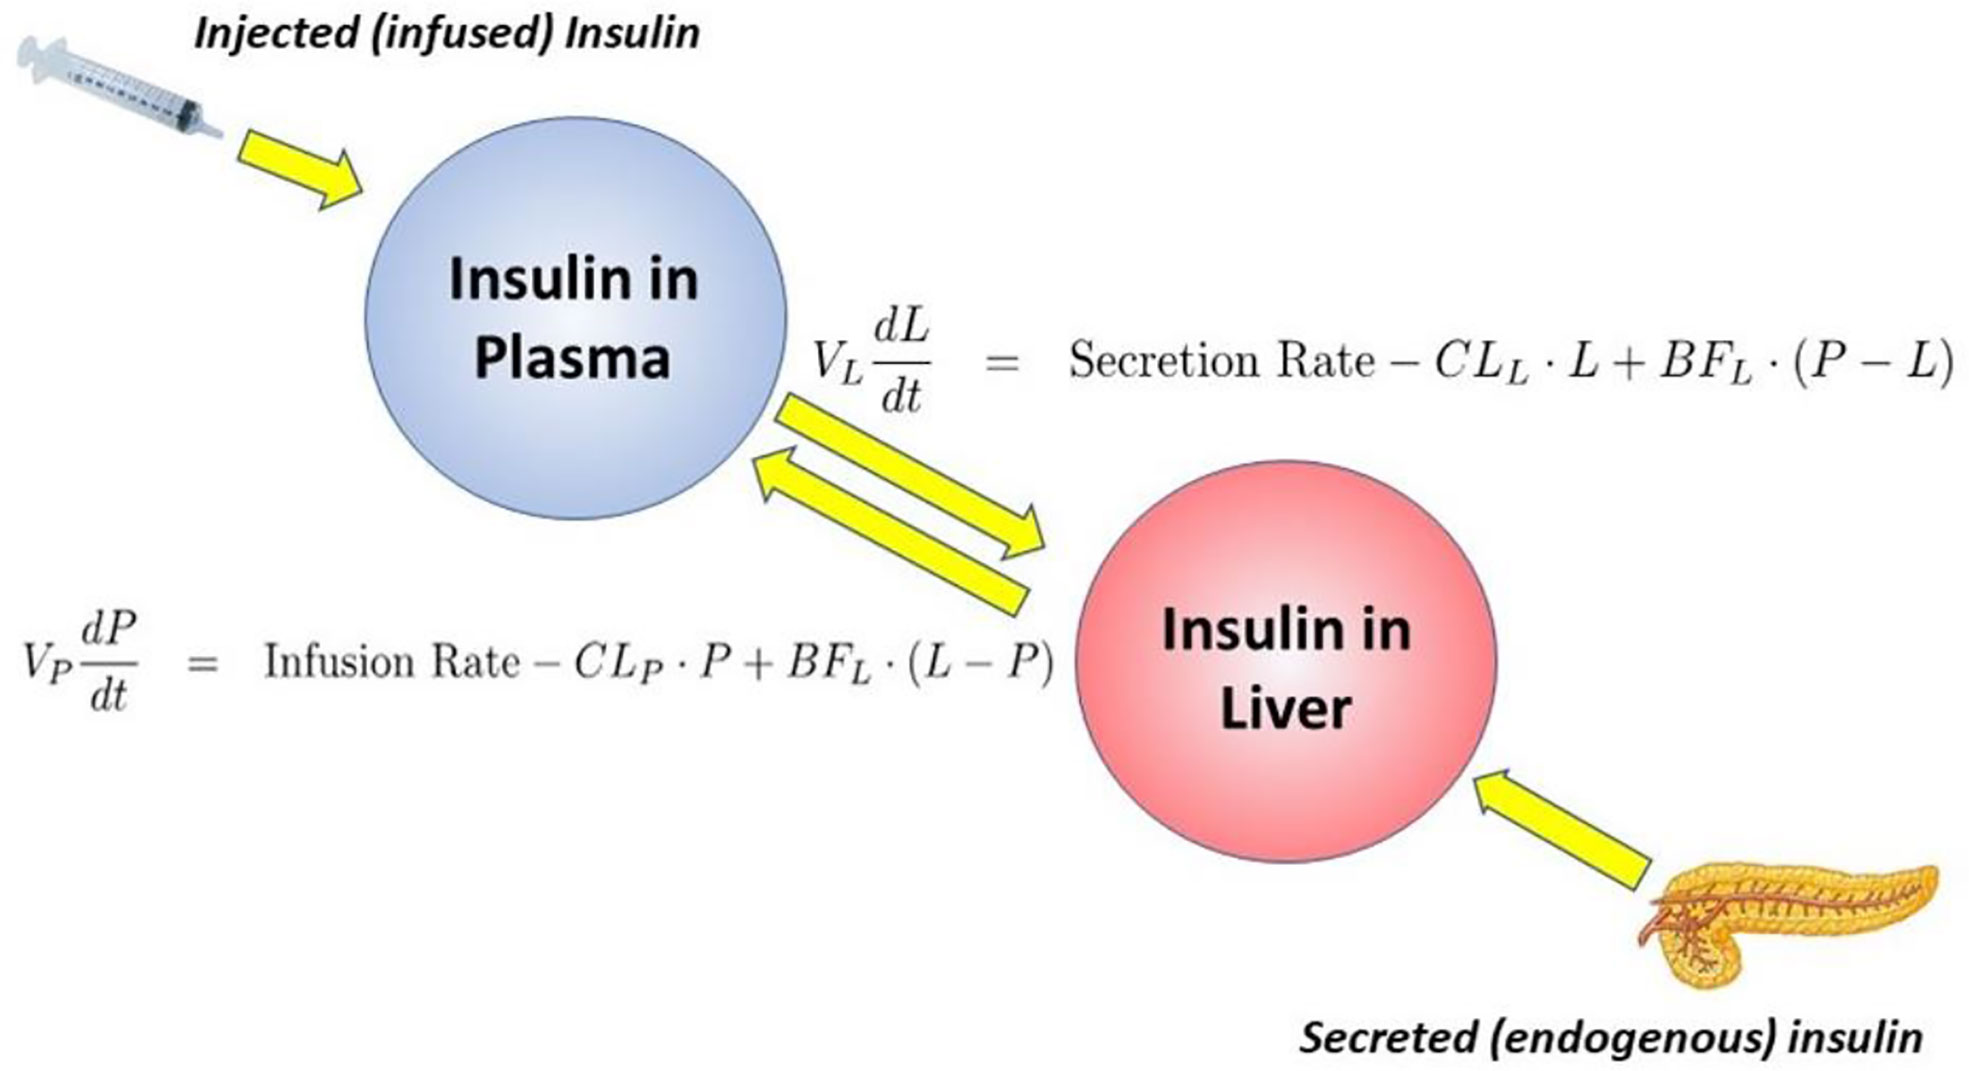
Figure 16 Model of insulin clearance.
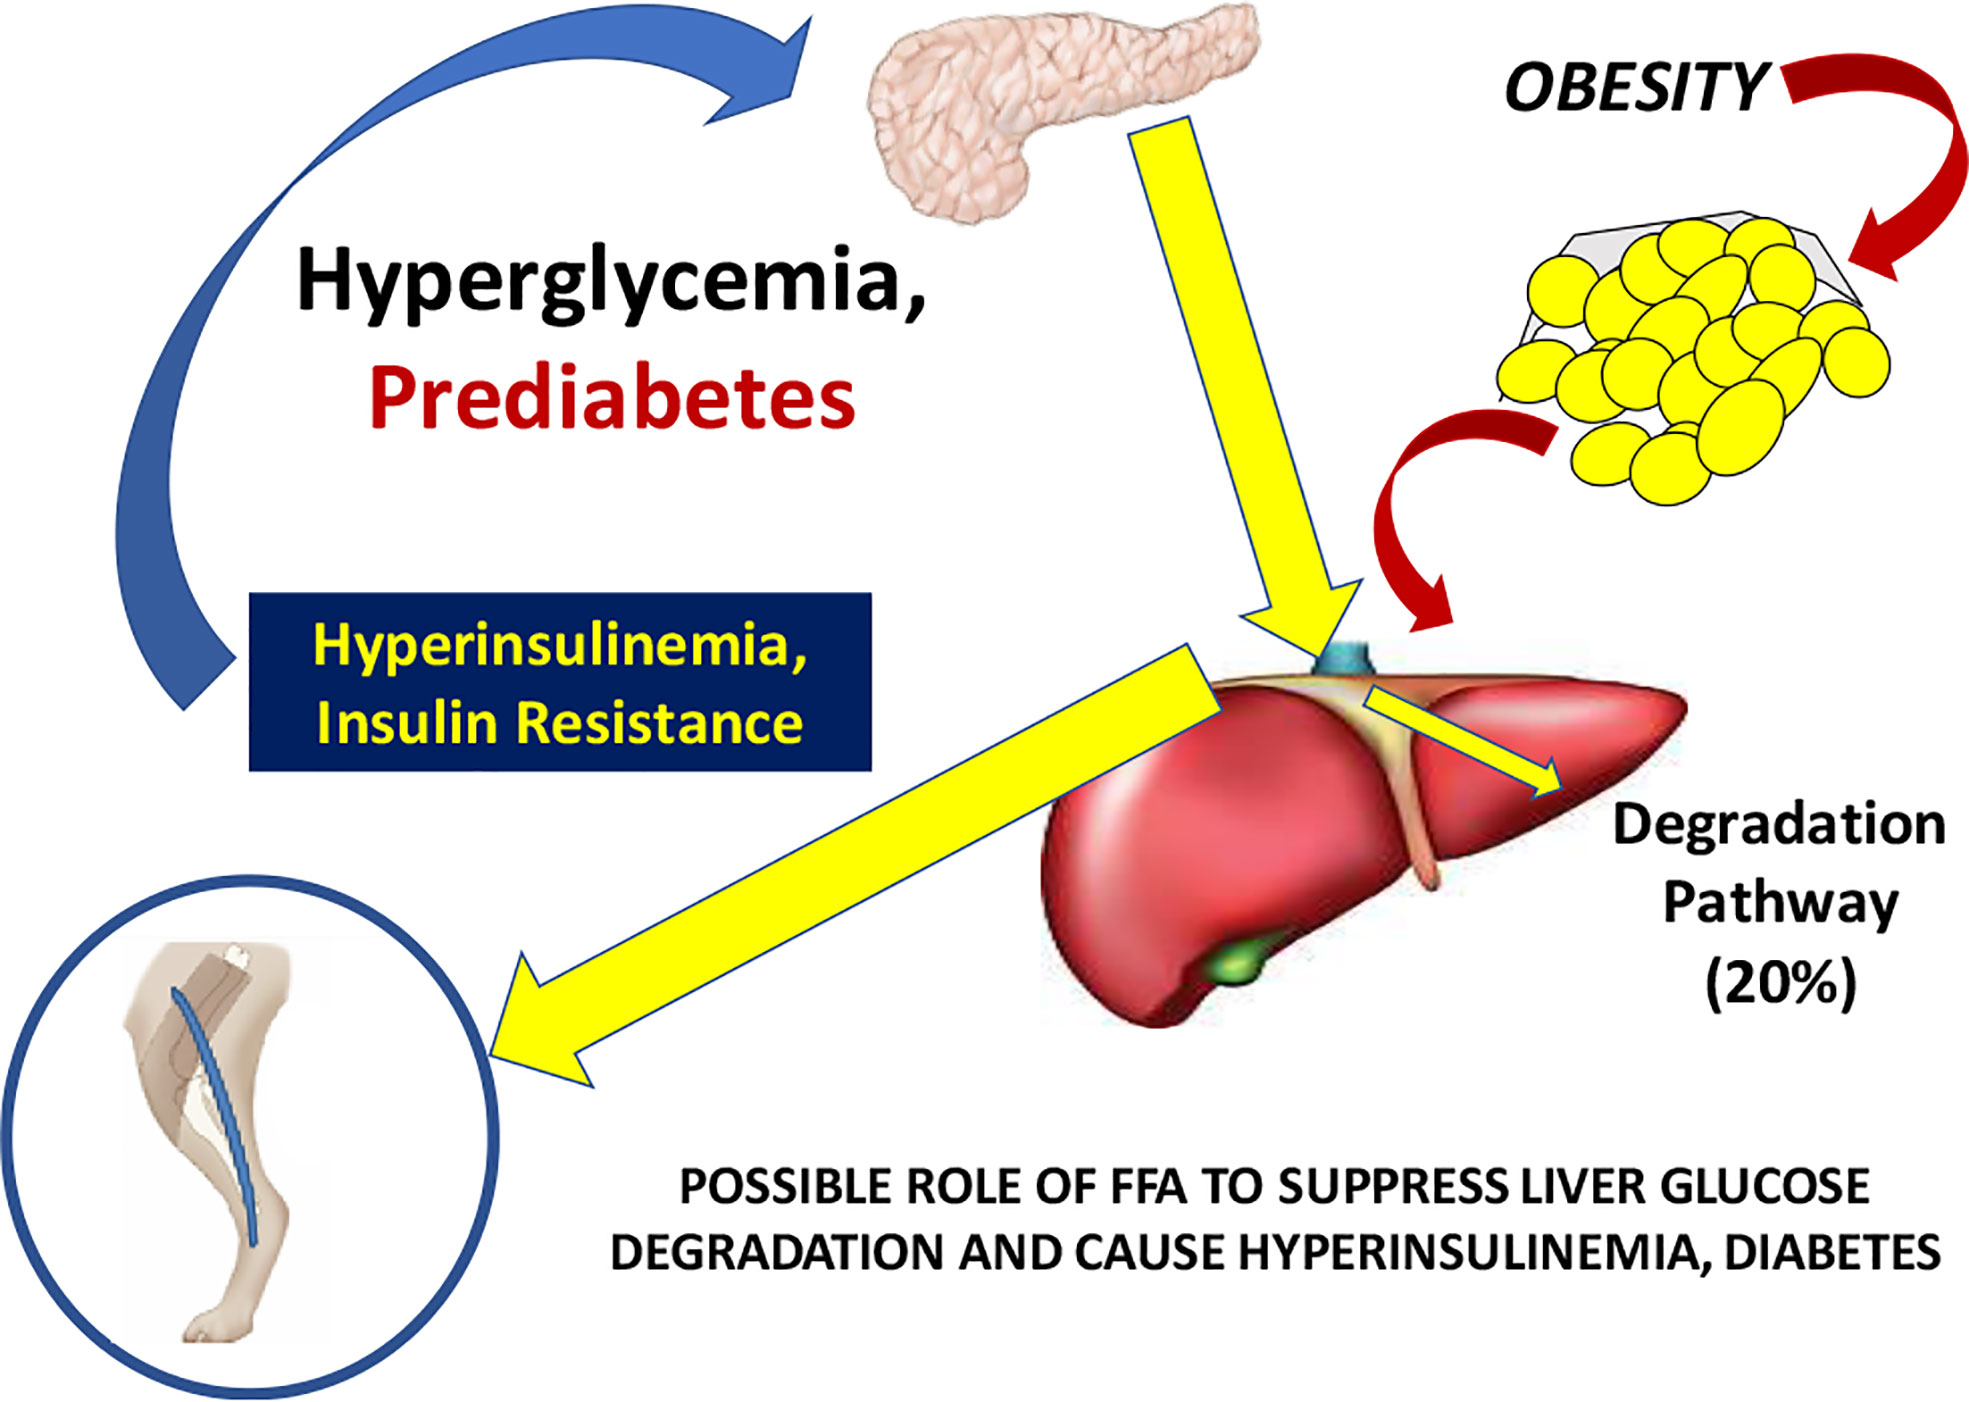
Figure 17 Hypothesis of the pathogenesis of Type 2 diabetes. It is suggested that increased plasma free fatty acids cause a reduction in hepatic insulin clearance, possibly by downregulation of IDE. A large proportion of insulin secreted by the β-cells therefore bypasses first-pass degradation, resulting in peripheral hyperinsulinemia. Higher plasma insulin downregulates skeletal muscle insulin sensitivity, stressing β-cells, and resulting in diabetes.
Glucose Effectiveness
In the original choice of the minimal model (discussed above), we could only account for glucose normalization by including two fundamental processes: the effects of insulin to enhance glucose utilization (represented by factor SI) and a second term SG, which is the effect of glucose per se to enhance glucose utilization independent of a dynamic insulin response. We coined the term “glucose effectiveness” to describe this process, and while it is not totally understood, we continue to examine it. Marilyn Ader, in our laboratory, demonstrated the importance of SG in experimental animals in studies where she demonstrated glucose’s ability to self-normalize (after injection) even if the dynamic insulin response is blocked (46).
The importance of SG remains under investigation; we have proposed that it is a second defense for those at risk for Type 2 diabetes. Individuals with a combination of reduced insulin response and insulin resistance together can be protected from frank diabetes by a maintained glucose effectiveness. There has been some debate regarding the measurement of glucose effectiveness from analysis of the intravenous glucose tolerance test using the minimal model (47, 48). Inclusion of the secondary secretagogue, or insulin injection itself, during the test clearly improved the assessment of SI but possible incorrect estimation of SG is still a possibility. To improve this estimation, we have developed a new approach. The mechanisms underlying glucose effectiveness remain unclear, but we have proposed that much of the insulin-independent glucose utilization after carbohydrate intake is due to activation of hepatic glucokinase, resulting in a greater rate of glucose phosphorylation, glycogen deposition, and release of three-carbon intermediates from liver (predominately lactate). We have therefore developed a simple model of the liver, relating glucose uptake to lactate output from the liver (Figure 18). This model can be analyzed using data from the IVGTT, yielding an estimate of SG independent of the traditional minimal model analysis of the IVGTT. We are presently evaluating the precision and accuracy of the “lactate model” approach (49).
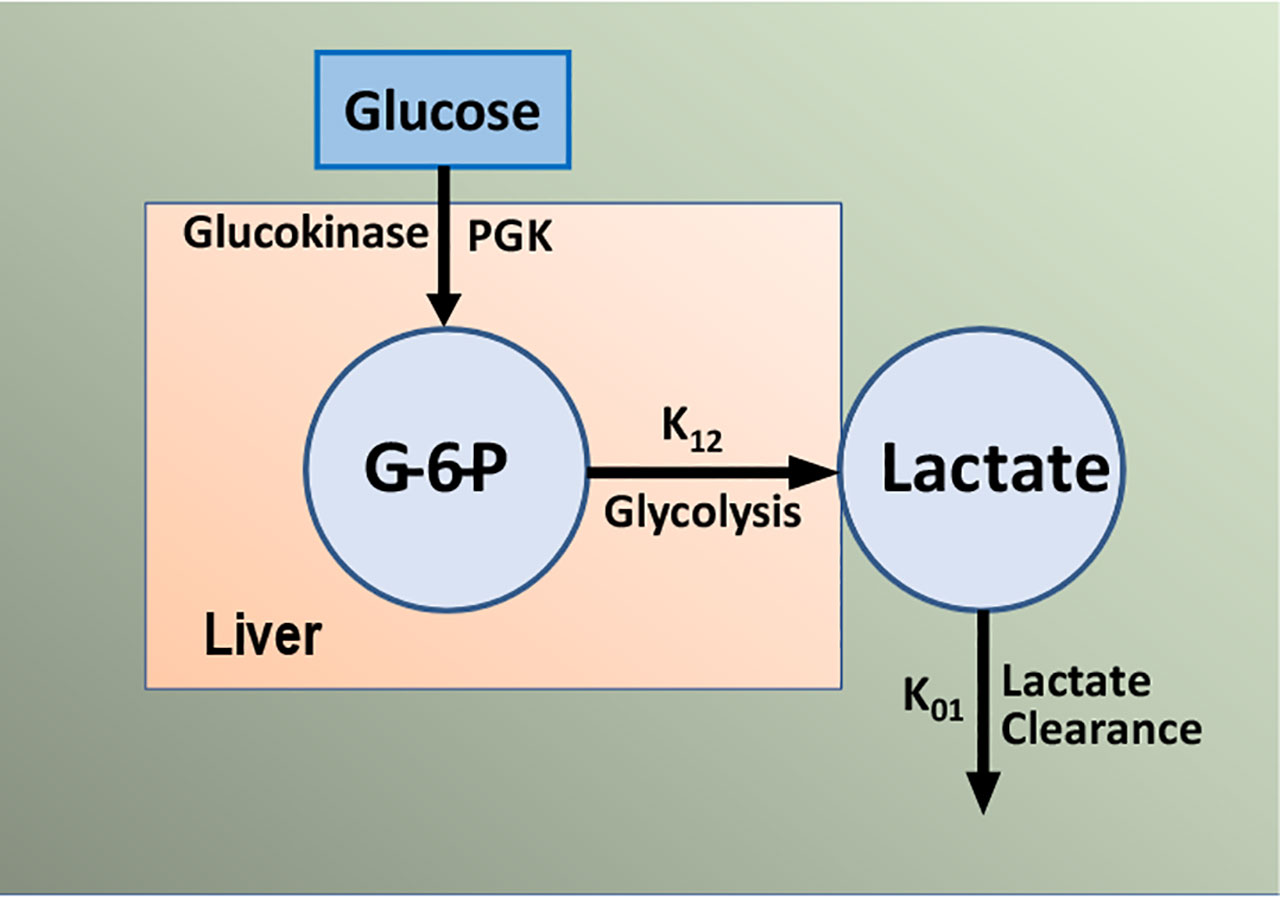
Figure 18 Simple model of glucose/lactate kinetics. Glucose enters hepatocytes, independent of insulin, and follows the glycolytic pathway via glucokinase. Lactate exits the liver and is a surrogate for glucokinase activation and “glucose effectiveness”.
Commentary
It can no longer be doubted that mathematical modeling can have a great impact on our understanding of metabolic regulation. The minimal model is but one part of an extensive number of mathematical representations that have enabled the scientific community to understand metabolic physiology, to predict the time course of development of metabolic disease, and to design devices to more effectively regulate the blood sugar.
The interaction among hypothesis, predictions, modeling and experimental testing of the models has characterized our work (Figure 19) and the work of other productive laboratories. It is of interest that investigations may begin at various points in the interactions shown in the figure; the minimal model itself began first with experimental data, then the model was proposed, and predictions of the model were tested in experimental models. In some cases, the model resulted in predictions (e.g., slow effect of insulin) which were examined in new experimental models (sampling of interstitial fluid). The possible role of insulin clearance in pathogenesis of Type 2 diabetes began with a hypothesis (lower clearance predicted diabetes) and examined with population studies (lower clearance in African American adults and children). Thus we have enjoyed, and we recommend, studying the interaction among these four activities to further our understanding of the mechanisms underlying metabolic disease at the organ level.
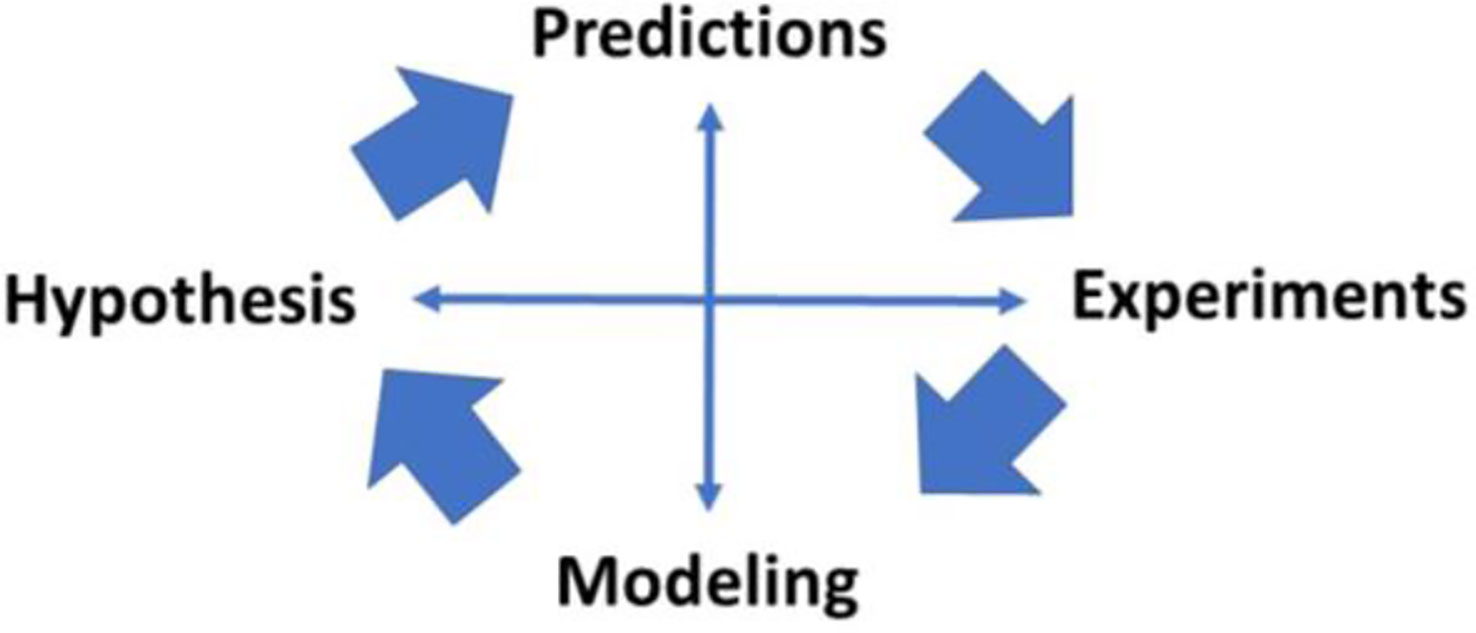
Figure 19 Importance of modeling in the scientific method.
We were fortunate to have in our armamentarium the ability to model using modern computer techniques, and the availability of our laboratory to test our hypotheses directly. We were lucky to assemble a group of colleagues, drawn from biomedical engineering, mathematics, experimental physiology and molecular biology, to do our work. We can only thank them and the scientists with whom they worked for our modest success in helping to understand the complex but fascinating story of the regulation of carbohydrate metabolism in the intact organism.
Data Availability Statement
The original contributions presented in the study are included in the article/supplementary material. Further inquiries can be directed to the corresponding author.
Ethics Statement
The studies involving human participants were reviewed and approved by University of Alabama Human Subjects Committee. Written informed consent to participate in this study was provided by the participants’ legal guardian/next of kin. Animal studies were reviewed and approved by USC IACUC and Cedars IACUC.
Author Contributions
The author confirms being the sole contributor of this work and has approved it for publication.
Funding
This research was supported by research grants to Richard N. Bergman from the National Institutes of Health (DK 29867, DK 27619).
Conflict of Interest
The author declares that the research was conducted in the absence of any commercial or financial relationships that could be construed as a potential conflict of interest.
References
1. Bolie VW. Coefficients of normal blood glucose regulation. J Appl Physiol (1961) 16:783–8. doi: 10.1152/jappl.1961.16.5.783
2. Guyton AC, Coleman TG, Granger HJ. Circulation: overall regulation. Annu Rev Physiol (1972) 34:13–46. doi: 10.1146/annurev.ph.34.030172.000305
3. Yates FE, Urquhart J. Control of plasma concentrations of adrenocortical hormones. Physiol Rev (1962) 42:359–433. doi: 10.1152/physrev.1962.42.3.359
4. Bergman RN, Urquhart J. The pilot gland approach to the study of insulin secretory dynamics. Recent Prog Horm Res (1971) 27:583–605. doi: 10.1016/B978-0-12-571127-2.50039-0
5. Gerich JE, Charles MA, Grodsky GM. Characterization of the effects of arginine and glucose on glucagon and insulin release from the perfused rat pancreas. J Clin Invest (1974) 54:833–41. doi: 10.1172/JCI107823
6. Rashevsky N. Advances and applications of mathematical biology. Chicago: University of Chicago Press (1940). doi: 10.2307/1439087
7. Bergman RN, Hechter O. A random-hit matrix model for coupling in a hormone-sensitive adenylate cyclase system. J Biol Chem (1978) 253:3238–50. doi: 10.1016/S0021-9258(17)40828-3
8. Bergman RN, El Refai M. Dynamic control of hepatic glucose metabolism: studies by experiment and computer simulation. Ann BioMed Eng (1975) 3:411–32. doi: 10.1007/BF02409326
9. Bergman RN, Ider YZ, Bowden CR, Cobelli C. Quantitative estimation of insulin sensitivity. Am J Physiol (1979) 236:E667–77. doi: 10.1152/ajpendo.1979.236.6.E667
10. Ader M. Physiologic principles underlying glucose effectiveness. In: Bergman RN, Lovejoy JC, editors. The Minimal Model Approach and Determinants of Glucose Tolerance. Baton Rouge: Louisiana State University Press (1997).
11. Bergman RN, Cobelli C. Minimal modeling, partition analysis and the estimation of insulin sensitivity. Fed Proc (1980) 39:110–5.
12. Bergman RN, Bradley DC, Ader M. On insulin action in vivo: the single gateway hypothesis. Adv Exp Med Biol (1993) 334:181–98. doi: 10.1007/978-1-4615-2910-1_13
13. Steil GM, Ader M, Moore DM, Rebrin K, Bergman RN. Transendothelial insulin transport is not saturable in vivo: no evidence for a receptor-mediated process. J Clin Invest (1996) 97:1497–503. doi: 10.1172/JCI118572
14. Yang YJ, Hope ID, Ader M, Bergman RN. Insulin transport across capillaries is rate limiting for insulin action in dogs. J Clin Invest (1989) 84:1620–8. doi: 10.1172/JCI114339
15. Bradley DC, Poulin RA, Bergman RN. Dynamics of hepatic and peripheral insulin effects suggest common rate-limiting step in vivo. Diabetes (1992) 42:296–306. doi: 10.2337/diabetes.42.2.296
16. Rebrin K, Steil GM, Getty L, Bergman RN. Free fatty acid as a link in the regulation of hepatic glucose output by peripheral insulin. Diabetes (1995) 44:1038–45. doi: 10.2337/diab.44.9.1038
17. Rebrin K, Steil GM, Mittelman S, Bergman RN. Causal linkage between insulin regulation of lipolysis and liver glucose output. J Clin Invest (1996) 98:741–9. doi: 10.1172/JCI118846
18. Donner CC, Fraze E, Chen YDI, Hollenbeck CB, Foley JE, Reaven GM. Presentation of a new method for specific measurement of in vivo insulin-stimulated glucose disposal in humans: comparison of this approach with the insulin clamp and minimal model techniques. J Clin Endocrinol Metab (1985) 60:723–6. doi: 10.1210/jcem-60-4-723
19. Welch S, Gebhart SSP, Bergman RN, Phillips LS. Minimal model analysis of intravenous glucose tolerance test-derived insulin sensitivity in diabetic subjects. J Clin Endocrinol Metab (1990) 71:1508–18. doi: 10.1210/jcem-71-6-1508
20. Finegood DT, Pacini G, Bergman RN. The insulin sensitivity index. Correlation in dogs between values determined from the intravenous glucose tolerance test and the euglycemic glucose clamp. Diabetes (1984) 33:362–8. doi: 10.2337/diabetes.33.4.362
21. Beard JC, Bergman RN, Ward WK, Porte D Jr. The insulin sensitivity index in nondiabetic man: correlation between clamp-derived and IVGTT-derived values. Diabetes (1986) 35:362–9. doi: 10.2337/diabetes.35.3.362
22. Bergman RN, Prager R, Volund A, Olefsky JM. Equivalence of the insulin sensitivity index in man derived by the minimal model method and the euglycemic glucose clamp. J Clin Invest (1987) 79:790–800. doi: 10.1172/JCI112886
23. Perley M, Kipnis DM. Plasma insulin responses to glucose and tolbutamide of normal weight and obese diabetic and nondiabetic subjects. Diabetes (1966) 15:867–74. doi: 10.2337/diab.15.12.867
24. Shen SW, Reaven GM, Farquhar JW. Comparison of impedance to insulin-mediated glucose uptake in normal subjects and in subjects with latent diabetes. J Clin Invest (1970) 49:2151–60. doi: 10.1172/JCI106433
25. Stumvoll M, Tataranni PA, Bogardus C. The hyperbolic law – a 25-year perspective. Diabetologia (2005) 48:207–9. doi: 10.1007/s00125-004-1657-3
26. Bergman RN, Phillips LS, Cobelli C. Physiologic evaluation of factors controlling glucose tolerance in man: measurement of insulin sensitivity and B-cell glucose sensitivity from the response to intravenous glucose. J Clin Invest (1981) 68:1456–67. doi: 10.1172/JCI110398
27. Buchanan TA, Metzger BE, Freinkel N, Bergman RN. Insulin sensitivity and B-cell responsiveness to glucose during late pregnancy in lean and moderately obese women with normal glucose tolerance or mild gestational diabetes. Am J Obstet Gynecol (1990) 162:1008–14. doi: 10.1016/0002-9378(90)91306-W
28. Holder T, Giannini C, Santoro N, Pierpont B, Shaw M, Duran E, et al. A low disposition index in adolescent offspring of mothers with gestational diabetes: a risk marker for the development of impaired glucose tolerance in youth. Diabetologia (2014) 57:2413–20. doi: 10.1007/s00125-014-3345-2
29. Lorenzo C, Wagenknecht LE, Rewers MJ, Karter AJ, Bergman RN, Hanley AJ, et al. Disposition index, glucose effectiveness, and conversion to type 2 diabetes: the Insulin Resistance Atherosclerosis Study (IRAS). Diabetes Care (2010) 33:2098–103. doi: 10.2337/dc10-0165
30. Palmer JP, Langefeld CD, Campbell JK, Williams AH, Saad M, Norris JM, et al. Genetic mapping of disposition index and acute insulin response loci on chromosome 11q: The Insulin Resistance Atherosclerosis Study (IRAS) Family Study. Diabetes (2006) 55:911–8. doi: 10.2337/diabetes.55.04.06.db05-0813
31. Weyer C, Hanson K, Bogardus C, Pratley RE. Long-term changes in insulin action and insulin secretion associated with gain, loss, regain and maintenance of body weight. Diabetologia (2000) 43:36–46. doi: 10.1007/s001250050005
32. Stefanovski D, Richey JM, Woolcott O, Lottati M, Zheng D, Harrison LN, et al. Consistency of the disposition index in the face of diet-induced insulin resistance: potential role of FFA. PloS One (2011) 6(3):e18134. doi: 10.1371/journal.pone.0018134
33. Broussard JL, Kolka CM, Castro AVB, Asare Bediako I, Paskiewicz RL, Szczepaniak EW, et al. Elevated nocturnal NEFA are an early signal for hyperinsulinaemic compensation during diet-induced insulin resistance in dogs. Diabetologia (2015) 58:2663–70. doi: 10.1007/s00125-015-3721-6
34. Broussard JL, Chaptot F, Abraham V, Day A, Delebecque F, Whitmore HR, et al. Sleep restriction increases free fatty acids in healthy men. Diabetologia (2015) 58:791–8. doi: 10.1007/s00125-015-3500-4
35. Bergman RN, Piccinini F, Kabir M, Kolka CM, Ader M. Hypothesis: Role of reduced hepatic insulin clearance in the pathogenesis of type 2 diabetes. Diabetes (2019) 68:1709–16. doi: 10.2337/db19-0098
36. Best JD, Kahn SE, Ader M, Watanabe RM, Ni T-C, Bergman RN. Role of glucose effectiveness in the determination of glucose tolerance. Diabetes Care (1996) 19:1018–30. doi: 10.2337/diacare.19.9.1018
37. Asare Bediako I, Paszkiewicz RL, Kim SP, Woolcott OO, Kolka CM, Burch MA, et al. Variability of directly measured first-pass hepatic insulin extraction and its association with insulin sensitivity and plasma insulin. Diabetes (2018) 67:1495–503. doi: 10.2337/db17-1520
38. Kim SP, Ellmerer M, Kirkman EL, Bergman RN. Beta-cell “rest” accompanies reduced first-pass hepatic insulin extraction in the insulin resistant, fat-fed canine model. Am J Physiol (2007) 292:1581–9. doi: 10.1152/ajpendo.00351.2006
39. Polidori DC, Bergman RN, Chung ST, Sumner AE. Hepatic and extrahepatic insulin clearance are differentially regulated: results from a novel model-based analysis of intravenous glucose tolerance data. Diabetes (2016) 65:1556–64. doi: 10.2337/db15-1373
40. Piccinini F, Polidori DC, Gower BA, Bergman RN. Hepatic but not extrahepatic insulin clearance is lower in African American than in European American women. Diabetes (2017) 66:2564–70. doi: 10.2337/db17-0413
41. Piccinini F, Polidori DC, Gower BA, Fernandez J, Bergman RN. Dissection of hepatic and extra-hepatic insulin clearance: ethnic differences in childhood. Diabetes Obes Metab (2018) 12:2869–75. doi: 10.1111/dom.13471
42. Najjar SM, Perdomo G. Hepatic insulin clearance: mechanism and physiology. Physiology (2019) 34:198–215. doi: 10.1152/physiol.00048.2018
43. Catalano KJ, Maddux BA, Szary J, Youngren JF, Goldfine ID, Schaufele F. Insulin resistance induced by hyperinsulinemia coincides with a persistent alteration at the insulin receptor tyrosine kinase domain. PloS One (2014) 9:e108693. doi: 10.1371/journal.pone.0108693
44. Rizza RA, Mandarino LJ, Genest J, Baker BA, Gerich JE. Production of insulin resistance by hyperinsulinemia in man. Diabetologia (1985) 28:70–5 doi: 10.1007/BF00279918
45. Shah MH, Piaggi P, Looker HC, Paddock E, Krakoff J, Chang DC. Lower insulin clearance is associated with increased risk of Type 2 diabetes in Native Americans. Diabetologia (2021) [online ahead of print]. doi: 10.1007/s00125-020-05348-5
46. Ader M, Pacini G, Yang YJ, Bergman RN. Importance of glucose per se to intravenous glucose tolerance: comparison of the minimal model prediction with direct measurements. Diabetes (1985) 34:1092–103. doi: 10.2337/diabetes.34.11.1092
47. McDonald C, Dunaif A, Finegood DT. Minimal-model estimates of insulin sensitivity are insensitive to errors in glucose effectiveness. J Clin Endocrinol Metab (2000) 85:2504–8. doi: 10.1210/jc.85.7.2504
48. Quon MJ, Cochran C, Taylor SI, Eastman RC. Non-insulin-mediated glucose disappearance in subjects with IDDM: discordance between experimental results and minimal model analysis. Diabetes (1994) 43:890–6. doi: 10.2337/diabetes.43.7.890
Keywords: diabetes, metabolism, mathematical model, disposition index, insulin clearance, glucose effectiveness
Citation: Bergman RN (2021) Origins and History of the Minimal Model of Glucose Regulation. Front. Endocrinol. 11:583016. doi: 10.3389/fendo.2020.583016
Received: 13 July 2020; Accepted: 22 December 2020;
Published: 15 February 2021.
Edited by:
Darko Stefanovski, University of Pennsylvania, United StatesReviewed by:
Kalyan C. Vinnakota, Gilbert Family Foundation, United StatesAdrian Vella, Mayo Clinic, United States
Copyright © 2021 Bergman. This is an open-access article distributed under the terms of the Creative Commons Attribution License (CC BY). The use, distribution or reproduction in other forums is permitted, provided the original author(s) and the copyright owner(s) are credited and that the original publication in this journal is cited, in accordance with accepted academic practice. No use, distribution or reproduction is permitted which does not comply with these terms.
*Correspondence: Richard N. Bergman, richard.bergman@cshs.org