Factors Predicting Collaborative Problem Solving: Based on the Data From PISA 2015
 Pan Tang1
  Hao Liu
- 1Collaborative Innovation Center of Assessment for Basic Education Quality, Beijing Normal University, Beijing, China
- 2Collaborative Innovation Center of Assessment for Basic Education Quality, Beijing Normal University at Zhuhai, Zhuhai, China
Collaborative problem solving (CPS) competency is critical in the twenty-first century. The Program for International Student Assessment (PISA) launched a large-scale assessment of CPS competency for the first time in 2015. Beijing, Shanghai, Jiangsu, and Guangdong provinces in China participated the assessment and scored an average of 496, which was slightly lower than the OECD average 500 and ranked 25th among the 51 countries and economies participating in the assessment. Therefore, this research was conducted to dig into the factors predicting students’ CPS competency, and help students improve it. Most research about CPS has fallen into the construction of the CPS framework and the effectiveness of CPS; research focusing on the factors predicting CPS competency is rare. Accordingly, a hierarchical linear model (HLM) was constructed to investigate the factors predicting students’ CPS competency in the current research. The model revealed that there was a large difference of students’ CPS competency among schools. In addition, among student-level variables, gender, grade, ESCS, ICT resources, students’ attitude toward CPS, and teacher unfairness were effective in predicting students’ CPS competency; among school-level variables, school location, schools’ ESCS and the proportion of all teachers fully certified predicted students’ CPS competency positively. The findings implied that in order to enhance students’ CPS competency, CPS competency training should be permeated through all the subjects; schools should employ teachers who are fully qualified; teachers should treat each student fairly; and students should be provided with more ICT resources and etc.
Introduction
Teenagers need a variety of “twenty-first century skills” to succeed in the future world. Although there is no universal consensus on “twenty-first century skills” on a global scale, they must include the ability to solve problems, think creatively and critically, and collaborate with others effectively (Wang, 2018). CPS competency is of great importance in the twenty-first century (Burrus et al., 2013). In September 2016, China issued the overall framework of Developing of Chinese Students’ Core Literacy, which regarded teamwork and offering assistance as the basic points of responsibility. The Assessment and Teaching of Twenty-First Century Skills (ATC21STM) project also valued CPS competency and made it the first item to be measured (Yang and Wang, 2019).
In 2015, the Organization for Economic Co-operation and Development (OECD) chose CPS as a new skill and ability to be measured in PISA for the 2015 international survey (Graesser et al., 2018). Nearly 10,000 15-year-old students from Beijing, Shanghai, Jiangsu province, and Guangdong province participated in the assessment of CPS competency of PISA 2015. CPS competency is essential, which is highly valued in college and in the workplace; therefore, students need to equip themselves with this ability (Bo and Lin, 2016; Oliveri et al., 2017). To help students master CPS competency, the factors predicting it must be analyzed thoroughly. The current research shed light on the factors predicting CPS at the student level and at the school level.
Literature Review
Theoretical Framework of CPS
The concept of CPS has evolved from the concept of problem solving. The operational definition of problem solving was first proposed in PISA 2003, emphasizing the cognitive development to solve real and interdisciplinary situational problems. In PISA 2012, problem solving competency was first tested via computers (Zhao et al., 2019). Compared with PISA 2012, CPS assessment in PISA 2015 underlined that there was a common goal in the group, which cannot be achieved by an individual alone; instead, it required all members to share their own understanding and exert themselves (Graesser et al., 2020).
In the PISA 2015 framework, CPS was defined as the ability of a person to cooperate with other agents effectively to solve problems (OECD, 2017a). To solve problems successfully, members needed to communicate with each other and exchange views while identifying the various parts of the problem and expounding the connections between the parts and finally presenting the shared solutions (Hesse et al., 2015). In this process, collaboration and cognitive skills which related to problem solving were required (Hesse et al., 2015; Care et al., 2016).
The CPS framework for PISA pinpointed three core competencies that were especially relevant to collaboration and four core competencies that are especially relevant to problem solving. A matrix of CPS skills was taken shape with three collaboration competencies crossing with four core problem solving competencies (OECD, 2016; see Table 1).
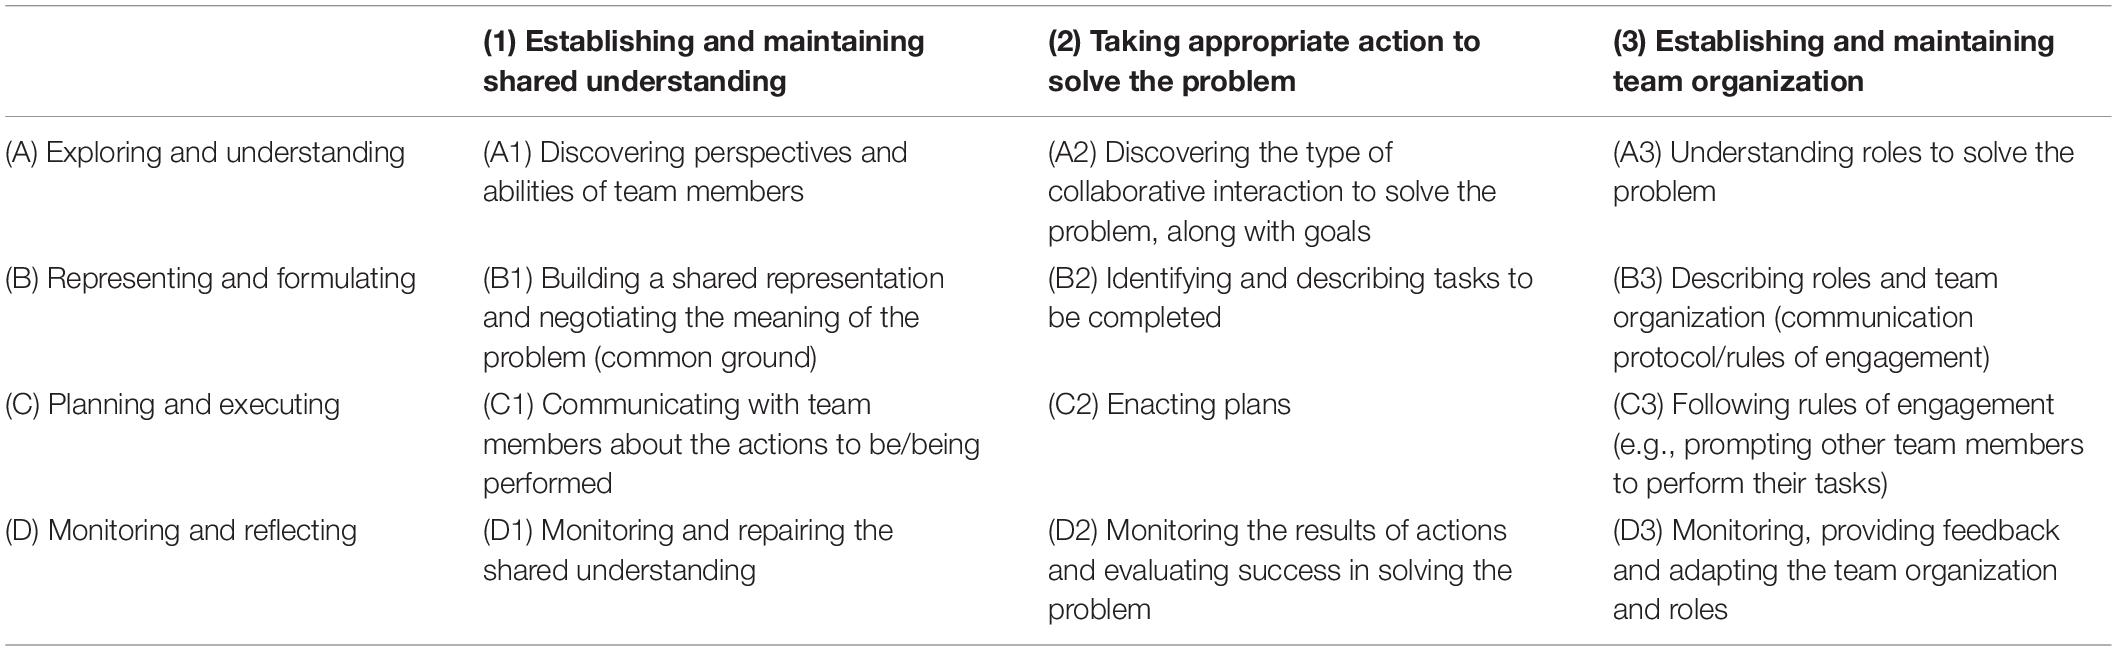
Table 1. Matrix of CPS skills for PISA 2015 (2016).
With the increasing emphasis on CPS, the assessment of CPS has been carried out broadly by educational and political initiatives, including PISA and ATC21S, in order to guarantee students’ proficiency in CPS skills before finishing their compulsory education and to ensure that students were well-prepared for the future global and computerized society (Herborn et al., 2018). PISA 2015 CPS was an assessment of individuals in CPS contexts with a human-agent approach (OECD, 2017a).
Test Structure of CPS Assessment
In the CPS assessment process, students were required to interact with at least one and up to three computer conversational agents and try to solve problems together in the predefined situations (Liu and Huang, 2019). The computer agents involved in the CPS assessment were simulated by artificial intelligence and did impersonations of real humans to work as students’ team members with various skills and competencies (Wang, 2016; Andrews-Todd and Forsyth, 2018; Stadler et al., 2019).
In the PISA 2015 CPS assessment, there were six units. Each unit contained multiple tasks, and each task contained several different questions, and each question was designed particularly to measure one of the 12 CPS skills; 117 questions were embodied in the assessment in total. Focusing on specific situations, all units were divided into 5–20 min of collaborative interactions, including exchanges, actions, results, and responses to tests. Ultimately, students would achieve an overall CPS score (Wang, 2016; Herborn et al., 2017; Zhao et al., 2019).
Moreover, a common feature of all questions in the PISA CPS assessment was that all questions stemmed from real-life problem scenarios. To make PISA CPS tasks more realistic, the computer agents were ascribed distinct characteristics, attitudes and CPS skills, and group sizes were different, with a minimum of two members and a maximum of four, in different settings. Students were ordered to perform different roles in the tasks, such as coordinator or decision-maker in the group (Wang, 2016; Tan et al., 2018; Stadler et al., 2019). Furthermore, the CPS assessment was controllable and standardized, which can place students in a variety of different collaborative situations, as well as control test time. In a given situation, when student’s attitude and willingness to cooperate change gradually, the computer agent’s response will alter accordingly (Wang, 2016).
Factors Predicting CPS Competency
In the light of previous research, student-level variables that may be predictors of CPS performance in PISA were students’ gender, grade, ESCS (economic, social, and cultural status), attitude toward cooperation, teachers’ unfairness, ICT (information and computer technology) resources and sports time.
In different countries or regions, the relationship between gender and students’ CPS competency were not the same. A study reported that gender had no statistical influence on Finnish students’ CPS abilities in the social or cognitive dimensions using ATC21S (Ahonen and Harding, 2018). However, Li and Liu (2017) found that female students were significantly more proficient than male students in CPS skills in Taiwan. Therefore, it’s of great importance to figure out whether gender can significantly predict students’ CPS competency in B-S-J-G.
Much research had confirmed that students in higher grades performed better in the CPS assessment. In general, grade level equaled to years of being educated, and better ability owing to developmental growth. Therefore, upper-year students had mastered stronger CPS skills (Ahonen and Harding, 2018).
According to the previous research, there was a significantly positive correlation between ESCS and students’ CPS competency (Wang, 2018; Xv and Li, 2019; Zhao et al., 2019). Zhao et al. (2019) found out that students’ socio-economic status differentiation was relatively obvious in China; furthermore, she also noted that school education had not been able to eliminate or balance the differences.
Students’ attitude toward CPS also could predict their CPS competency (Wang, 2018; Xv and Li, 2019). While collaborating with others to solve problems, students who valued the interpersonal relationships and students who value the perception of collaboration and its effect had better performance in CPS assessment (Xv and Li, 2019).
Whether teachers treat students fairly will predict students’ competency to solve problems collaboratively (Wang, 2018). Students’ perceptions of teacher support, teacher unfairness and the disciplinary climate were all good predictors of whether students valued relationships in a team (OECD, 2017b). Students spend a lot of time with their teachers in their school days; thus, teachers may have the opportunity to compensate for some awful experiences in their lives. Therefore, a positive and fair teacher-student relationship is important to students’ academic achievement, sense of belonging, and happiness. When teachers care about students and treat them fairly, students feel secure and more capable of participating in school activities and become more cooperative. Conversely, distrust, unfairness, and disrespect in teacher-student relationships may force students not to cooperate in school activities or even to leave school.
Some researchers reported that ICT resources was a significant predictor of students’ CPS performance (Scherer and Tiemann, 2012; Wang, 2018; Xv and Li, 2019). The PISA 2015 CPS assessment employed human-computer interaction to collaboratively solve problems, so students’ ICT literacy predicted their CPS competency. Thus, the ICT resources students own in school and at home may predict their CPS competency.
Physical activities also predicted students’ CPS competency (OECD, 2017b; Wang, 2018). Students who participated in moderate and vigorous physical activities had a positive cooperative attitude; students who took one or two physical education lessons per week performed better in CPS assessment.
According to previous research, school ESCS could predict students’ CPS performances in PISA. The present research predicted that at the school level, school location, school type, the proportion of all teachers fully certified, and school autonomy may also predict students’ CPS competency, and the reasons were as follows.
At the school level, the socio-economic status of schools explained most of the variation of students’ CPS competency, for socio-economic status was the total of all the students’ ESCS, which could provide students with more access to public libraries or museums, and collaborative and secure atmospheres to promote students’ CSP performance (Xv and Li, 2019; Zhao et al., 2019).
School location and school type probably predict students’ CPS competency in China. School location, to some extent, is a symbol of the resource school owns; schools located in large city almost always can obtain more government financial support than those in village. Likewise, school type also reflects resource school achieves. Generally speaking, public school and some private school can gain more financial support from government or education company.
The current research predicted that the proportion of all teachers fully certified can predict students’ CPS competency. Fully certified teachers had better mastery of instruction skills, and they may pay more attention to make students become well-rounded. Thus, they will organize students to involve themselves in group work, which requires CPS competency.
As for school autonomy, it may also be positively related to students’ CPS competency. If schools had their own right to decide which textbook to use, which kind of activity to hold, and which course content they would like to emphasize, some of the schools may give students more space and resources to generate their CPS competency.
Previous research of CPS fell into the construction of CPS framework (Roschelle and Teasley, 1995; Nelson, 1999; Oliveri et al., 2017; Sun et al., 2020), the effectiveness of CPS (Hou, 2011; Chang et al., 2017; Lu and Lin, 2017), and the social and cognitive dimensions of CPS (Hou, 2011; Andrews-Todd and Forsyth, 2018); research which focused on the factors predicting CPS competency were rare. What’s more, research exploring the factors predicting CPS competency were almost all qualitative; quantitative evidence was insufficient. The rare quantitative research probed into this issue through correlation analysis and multivariate regression, which ignored the nested structure of the data. For example, Griffin et al. (2006) adapted a qualitative method and came to a conclusion that school context variables play a role in facilitating successful collaboration. Scherer and Tiemann. (2012) conducted the correlation analysis and multivariate regression, and found that students’ prior knowledge, fluid intelligence, and familiarity with computers all can predict students’ problem solving performance; however, neither of these methods took into account the hierarchical structure of the data and was likely to make unreasonable or even incorrect interpretations of the data.
Therefore, the current research utilized the hierarchical linear model (HLM) which can provide more reliable results to investigate the factors predicting students’ CPS performance.
Research Questions
Based on the analysis above, the purpose of this research is to examine the factors that predict student CPS performance at the student and school level.
This research intends to examine the following questions:
(1) To what extent are the differences in students’ CPS achievement related to the differences in the schools they attend?
(2) At the student level, do students’ gender, grade, ESCS, attitude toward CPS, teacher’s unfair treatment, ICT resources and sports time predict students’ CPS performance?
(3) At the school level, do school variables such as school location, school type, schools’ ESCS, the proportion of the fully certified teachers and school autonomy predict students’ CPS performance?
Methodology
Data Source
The OECD Program for International Student Assessment (PISA) surveys, which take place every 3 years, have been designed to collect information about 15-year-old students in participating countries. The data collected during each PISA cycle are an extremely valuable source of information for researchers, policy makers, educators, parents and students. It is now recognized that the future economic and social wellbeing of countries is closely linked to the knowledge and skills of their populations (OECD, 2009a).
In PISA, the evaluation team adopted the probability proportionate to size (PPS) sampling method which made each school have the same probability of being randomly selected according to its size to ensure that the samples are representative (Lu, 2009). Moreover, a student level variable (W_FSTUWT) and a school level variable (W_FSCHWT) were employed as the student-level sample weight and the school-level sample weight, respectively, to decrease the unequal probability of sample selection and non-response bias (Xiang et al., 2018). The student level weight variable was directly provided by PISA 2015 dataset, and the school level weight variable of each school was the sum of all the student level weights in the school.
In PISA 2015, 9841 15-year-old students from 268 schools in Beijing, Shanghai, Jiangsu, and Guangdong in China participated the assessment. However, because of the missing data, which was deleted by HLM automatically, 9328 students from 259 different schools were involved in this research in the end. The data utilized in this research included student background information from the student questionnaire, school background information from the school questionnaire, and students’ CPS performance.
Variables
PISA 2015 gathered data about students’ CPS performance via a CPS test, student characteristics via a student questionnaire, and school characteristics via a school questionnaire (administered to principals).
Dependent Variable
The dependent variable in this research is student CPS achievement in PISA 2015. Since the CPS assessment contains 3 clusters, which contains 117 items in total, it will take too much time for them to finish all the items; thus, students need to finish one cluster of the three in the given time. Therefore, the CPS assessment in PISA 2015 computes 10 plausible values (PVs) which are defined as random values from the posterior distributions of students’ CPS competency for each student to represent students’ CPS competency (OECD, 2009b; Xiang et al., 2018). The present research followed the suggestions for addressing PVs in international large-scale assessments (Rutkowski et al., 2010), considering all 10 PVs simultaneously as the dependent variables for the purpose of obtaining unbiased and stable estimates. To be specific, first of all, statistics should be estimated using each plausible value separately. And then the reported statistic is the average of each plausible value statistic. For instance, if one is interested in the correlation coefficient between the ESCS and the CPS performance in PISA, then ten correlation coefficients should be computed and then averaged (OECD, 2009b).
Independent Variables
This research explores the factors that predict students’ CPS competency at the student level and at school level; those factors are characterized as nested data, with students clustered within schools. When considering the relationship between school-level variables and student CPS performance, the student-level predicting factors are controlled. The independent variables can be divided into two parts: student-level variables and school-level variables.
Student-level variables contain students’ gender, grade, ESCS, attitude toward CPS, teacher’s unfair treatment, ICT resources and sports time. In this research, ESCS was a composite score built by parental education, highest parental occupation, and home possessions via principal component analysis (PCA). The reliability of ESCS scale which was represented by Cronbach’s Alpha was 0.74. In addition, the questionnaire of students’ attitude toward CPS included eight questions regarding students’ collaboration and teamwork dispositions. These questions were used to build two scales, one was the enjoyment of cooperation, which focused on the relationship with others, and the other was the value of cooperation, which focused on the perception of collaboration and its effects (OECD, 2017a). The two scales’ reliabilities (Cronbach’s Alpha) were 0.677 and 0.821, respectively.
School-level variables contain school location, school type, schools’ ESCS, the proportion of all teachers fully certified, and school autonomy. Brief descriptions of the independent variables are given in Table 2.
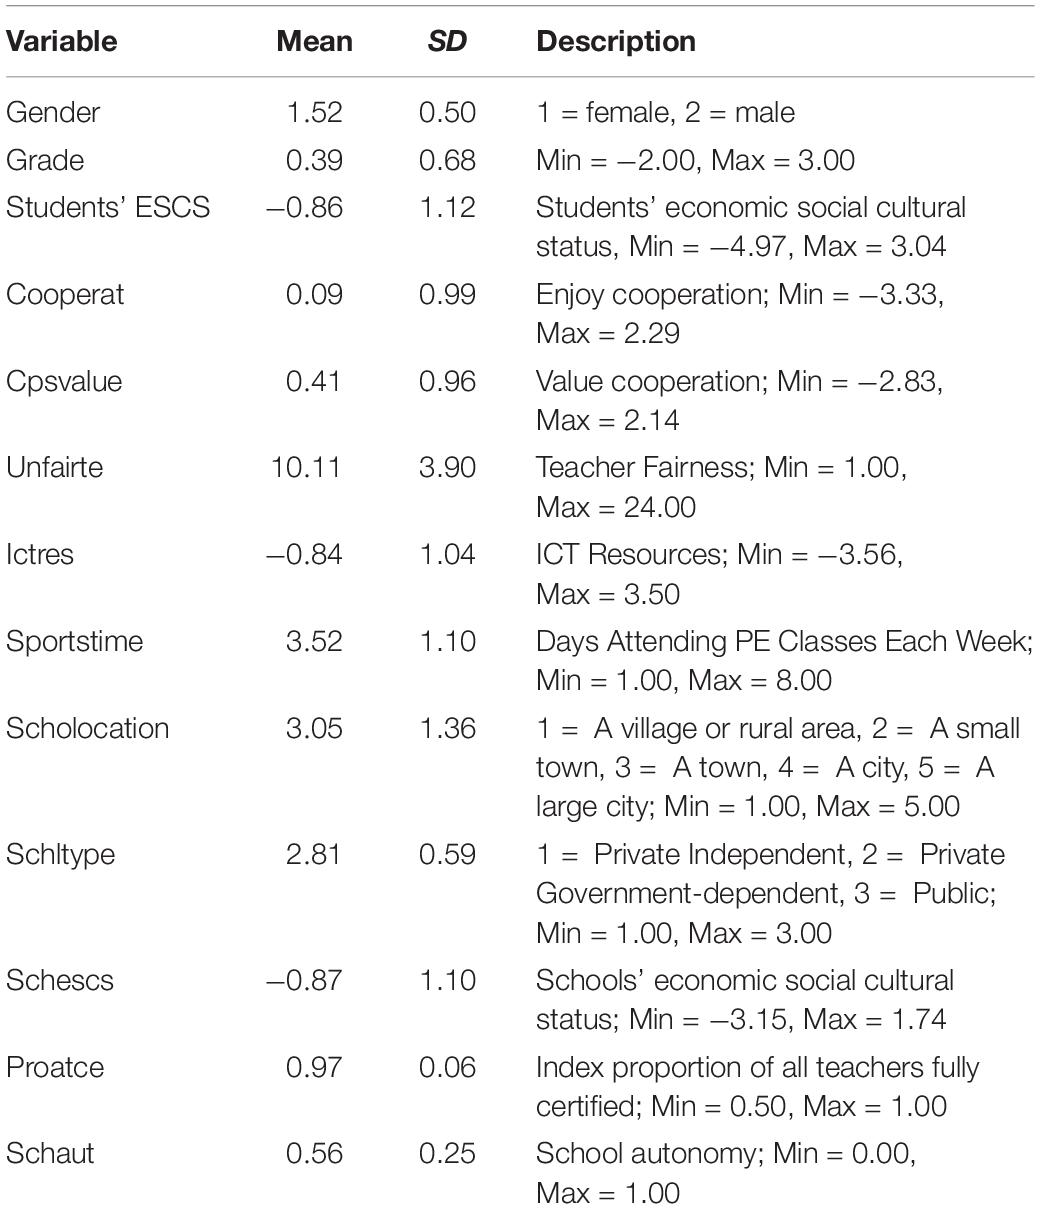
Table 2. Descriptive statistics of independent variables.
Data Analysis
In current research, 15-year-old student’s CPS performance in the PISA test was used as the dependent variable, and the student- and school-level predicting factors were used as independent variables. All derived continuous variables were standardized before the analysis. The hierarchical linear models were utilized to explore for data analysis. SPSS and IDB Analyzer were used to provide some description statistics with the data collected from student and school questionnaires. Software HLM 6.08 was employed to produce hierarchical linear models, which was mainly divided into null model, random effect models, and full random effect models.
Null Model
Null model was built with no variables. It separated the total variance into the variance between group which was caused by schools and variance within group which was caused by individual student. By calculating the intraclass correlation coefficient (ICC), null model in current research was utilized to decide whether the data needed to be analyzed hierarchically. The null model was as follows:
Level 1: student level
Level 2: school level
Random Effect Models
The random effect models in this research contained not only random intercepts, but random slopes, for, as shown in the modes below, every school had its own average CPS scores and the slopes of the student level variables were changed according to the schools. Random effect models merely contained variables in student level, which were utilized to judge the extents and ways of the school level predictors on students’ CPS competency. In addition, the intercepts and slopes of student level variables were assumed to be varied with schools, and thus the random errors, namely μ0j, μ1j, μ2j, μ3j, μ4j, and μ5j were added to the equations of the intercepts and coefficients. The random effect model was as follow:
Level 1: student level
Level 2: school level
Full Random Effect Models
Base on the random effect models above, some school level variables were added to the full random effect models. However, based on the data analysis results, there were no interactions between student level variables and school level variables; therefore, the school level variables were not necessary to be added to the slope equations of school level variables. Full random effect models demonstrated the relationships between student level variables and students’ CPS competency. In current research, the intercept β0j varied with schools, so it was be further analyzed in the full random effect models. The full random effect model was as follow:
Level 1: student level
Level 2: school level
Results
The Status Quo of Students’ CPS Competency
As Table 3 shows, the OECD average score was 500, and the average score of students in the four provinces (cities) of China was 496 which was slightly lower than the OECD average. However, there was a big gap between China and other three countries who performed well in CPS assessment. Singapore achieved the highest scores, 561, among the 51 countries and economies participating in the assessment; Japan, another Asian country, obtained 552. The world’s largest economy, the United States, scored an average of 520, which was also above the average performance of B-S-J-G.
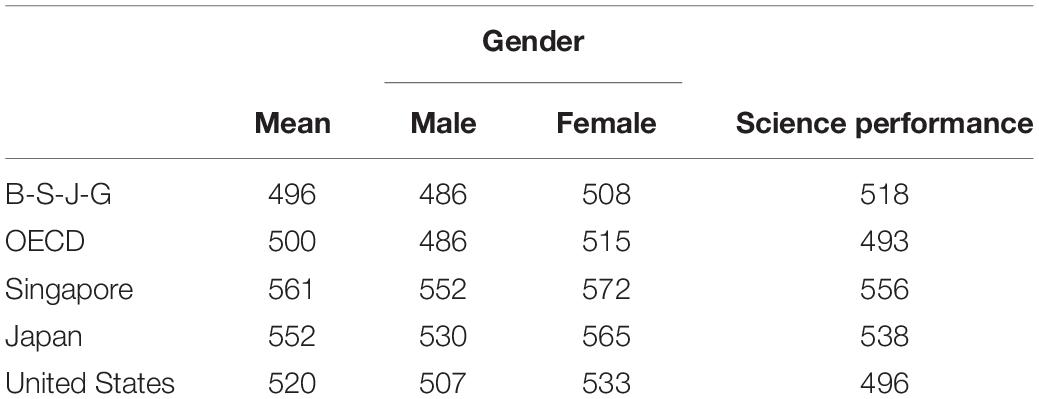
Table 3. The CPS competency of B-S-J-G, OECD, and other countries.
Students in B-S-J-G performed better in the science assessment than in the CPS assessment. In the science assessment, Chinese students achieved 518, which was above the OECD average, ranking 10th among all 71 countries or economies. Nevertheless, Chinese students ranked 27th in the overall 51 countries or economies in the CPS assessment, and their performance was slightly lower than the OECD average.
Female students acquired better problem solving skills than male students in the OECD and the four countries or regions. In B-S-J-G, male students’ CPS competency was at the same level as the OECD average; female students’ average score was slightly lower than the OECD average, but not significantly different from it.
Separating the Variance in CPS Performance
In accordance with the null model, a comparatively significant difference in students’ CPS competency existed at both the student and the school level (see Table 4). To be specific, 60.89% of the total variance was distributed at the student level, while the rest (39.11%) derived from the school level. Therefore, it was of great necessity to utilize hierarchical linear models.
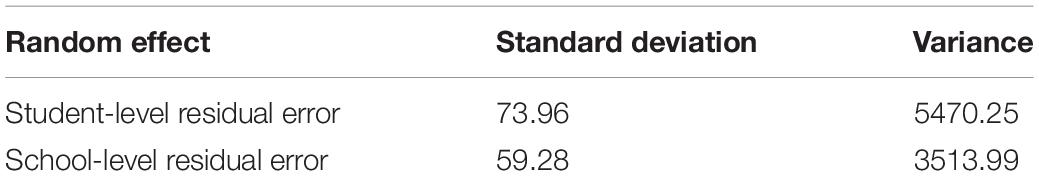
Table 4. The analysis result of the null model (Model 1).
Student-Level Variables Predicting CPS Competency
When examining the relationship between student-level variables and students’ CPS performance, the current research investigated divided the student-level variables into five main aspects: students’ demographic factors, students’ attitude toward CPS, teachers’ unfair treatment, students’ ICT resources, and their sports time per week. The results corresponded to Models 2–6, respectively (see Table 5 for details).
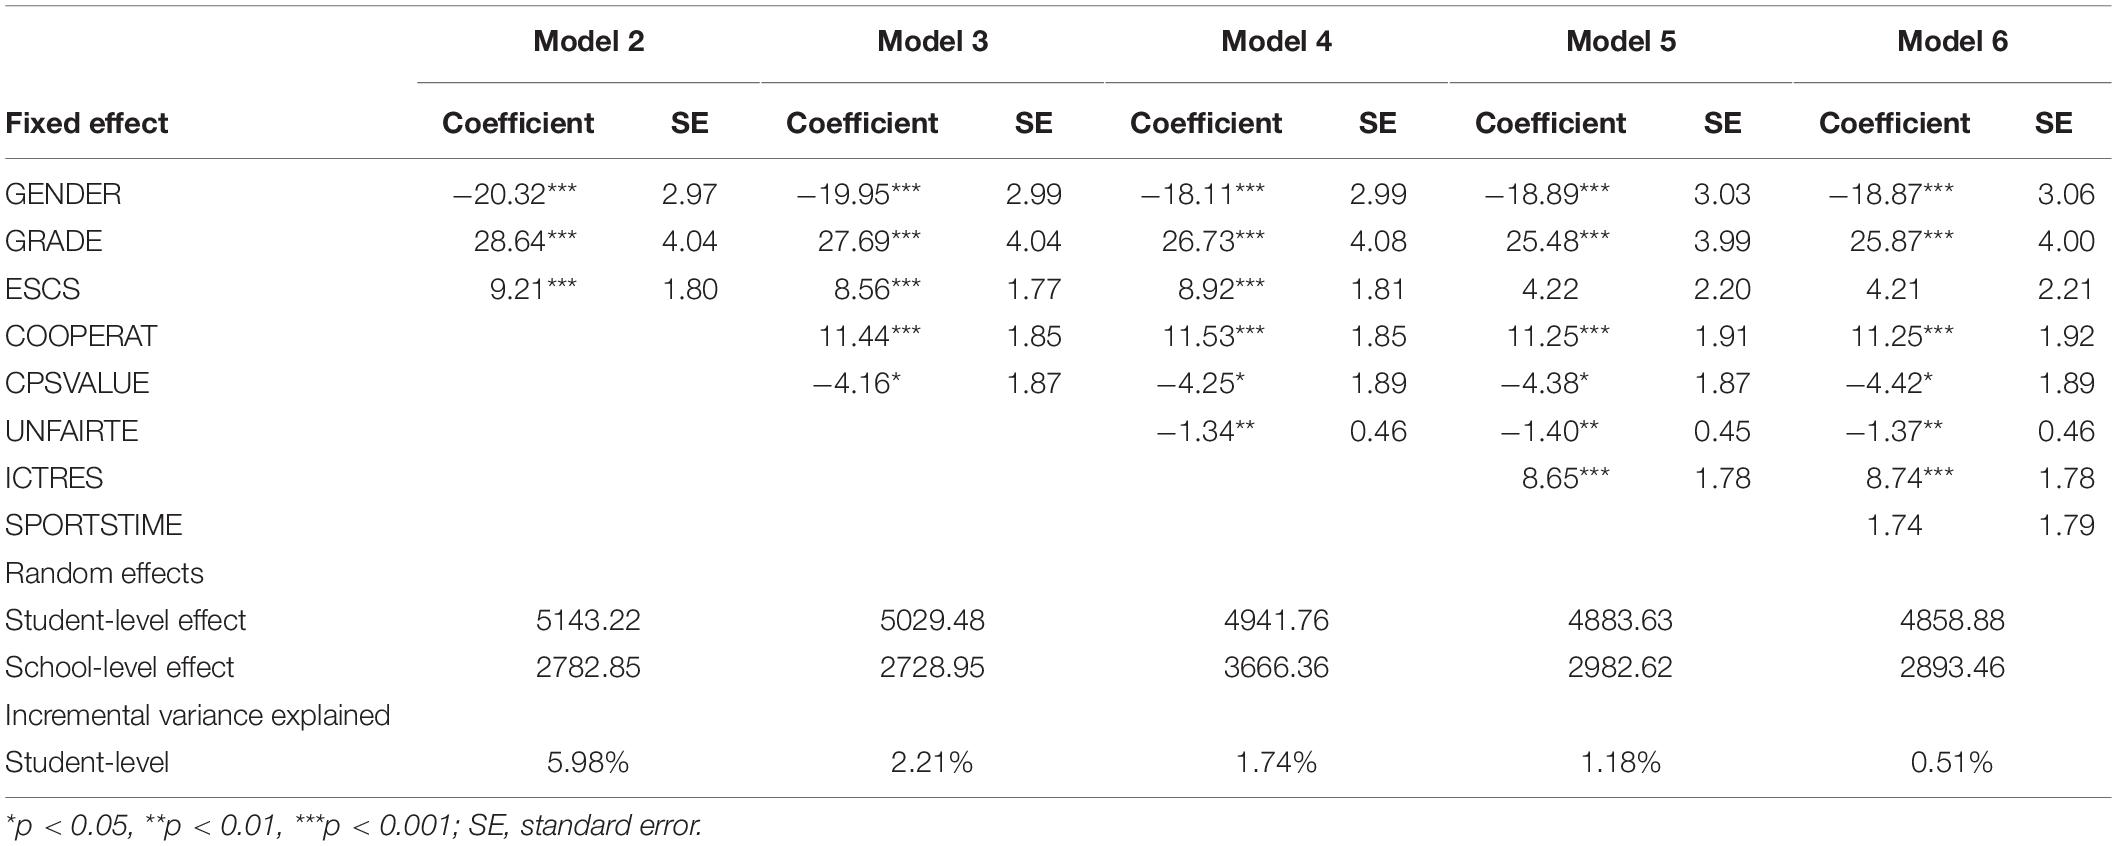
Table 5. The analysis result of the student-level model (Model 2–Model 6).
Model 2 mainly examined the role of the student’s demographic variables. In other words, three variables, student’ gender, grade and ESCS were added to Model 1. As shown in Table 5, the regression coefficients of gender, grade and ESCS were −20.32, 28.64, and 9.21, respectively. The variance at the student level was reduced by 327.03. Therefore, at the student level, the three predictors explained 5.98% variance of students’ CPS achievement. Models 3–6 can be analyzed in the same way. It can be seen from the Model 2 that student gender, grade and ESCS were effective in predicting students’ CPS achievement. Specifically, female students performed much better than male students in the CPS assessment (β = −20.32, p < 0.001); female students had CPS performance that was 20.32 points higher. Grade was positively related to student CPS achievement (β = 28.64, p < 0.001). At the same time, students’ ESCS also significantly predicted student CPS achievement (β = 9.21, p < 0.001). Students in higher grades and with higher ESCS had higher CPS scores. Model 3 aimed to investigate the relationship between students’ attitudes toward CPS and their CPS competency, and the results showed that students’ attitudes toward CPS significantly predicted their CPS achievement. Specifically, when students’ demographic variables had been controlled, students who valued interpersonal relationships performed better in CPS assessments (β = 11.44, p < 0.001), and students who valued teamwork tended to perform worse (β = −4.16, p < 0.05). Furthermore, those two variables explained 2.21% of the variance in students’ CPS performance. Model 4 was constructed to explore whether teachers’ unfair treatment predicted students’ CPS performance. According to the result, when the above five variables had been controlled, teachers’ unfair treatment hindered students’ CPS competency (β = −1.34, p < 0.01). Students who had been treated unfairly obtained 1.34 points less than those been treated fairly. In addition, teacher unfairness explained 1.74% of the variance in students’ CPS performance. Model 5 focused on examining the relationship between students’ ICT resources and their CPS performance. The results of Model 5 revealed that ICT resources did positively predict students’ CPS competency (β = 8.65, p < 0.001). Students owning more ICT resources performed better in CPS assessment. Moreover, ICT resources explained 1.18% of the variance in students’ CPS performance. Model 6 was intended to probe into the relationship between students’ sports time and their CPS performance. After controlling all the above variables, there was no statistically significant correlation between students’ sports time and their CPS performance (β = 1.74, p > 0.05). This variable accounted for 0.51% of the variance of students’ CPS performance.
School-Level Variables Predicting CPS Competency
The current research was based on four main aspects, namely, school background characteristics, schools’ ESCS, the proportion of fully certified teacher, and school instruction and management, to examine the relationship between school-level variables and students’ CPS performance. The corresponding models were Model 7 and Model 10, respectively (see Table 6 for details).
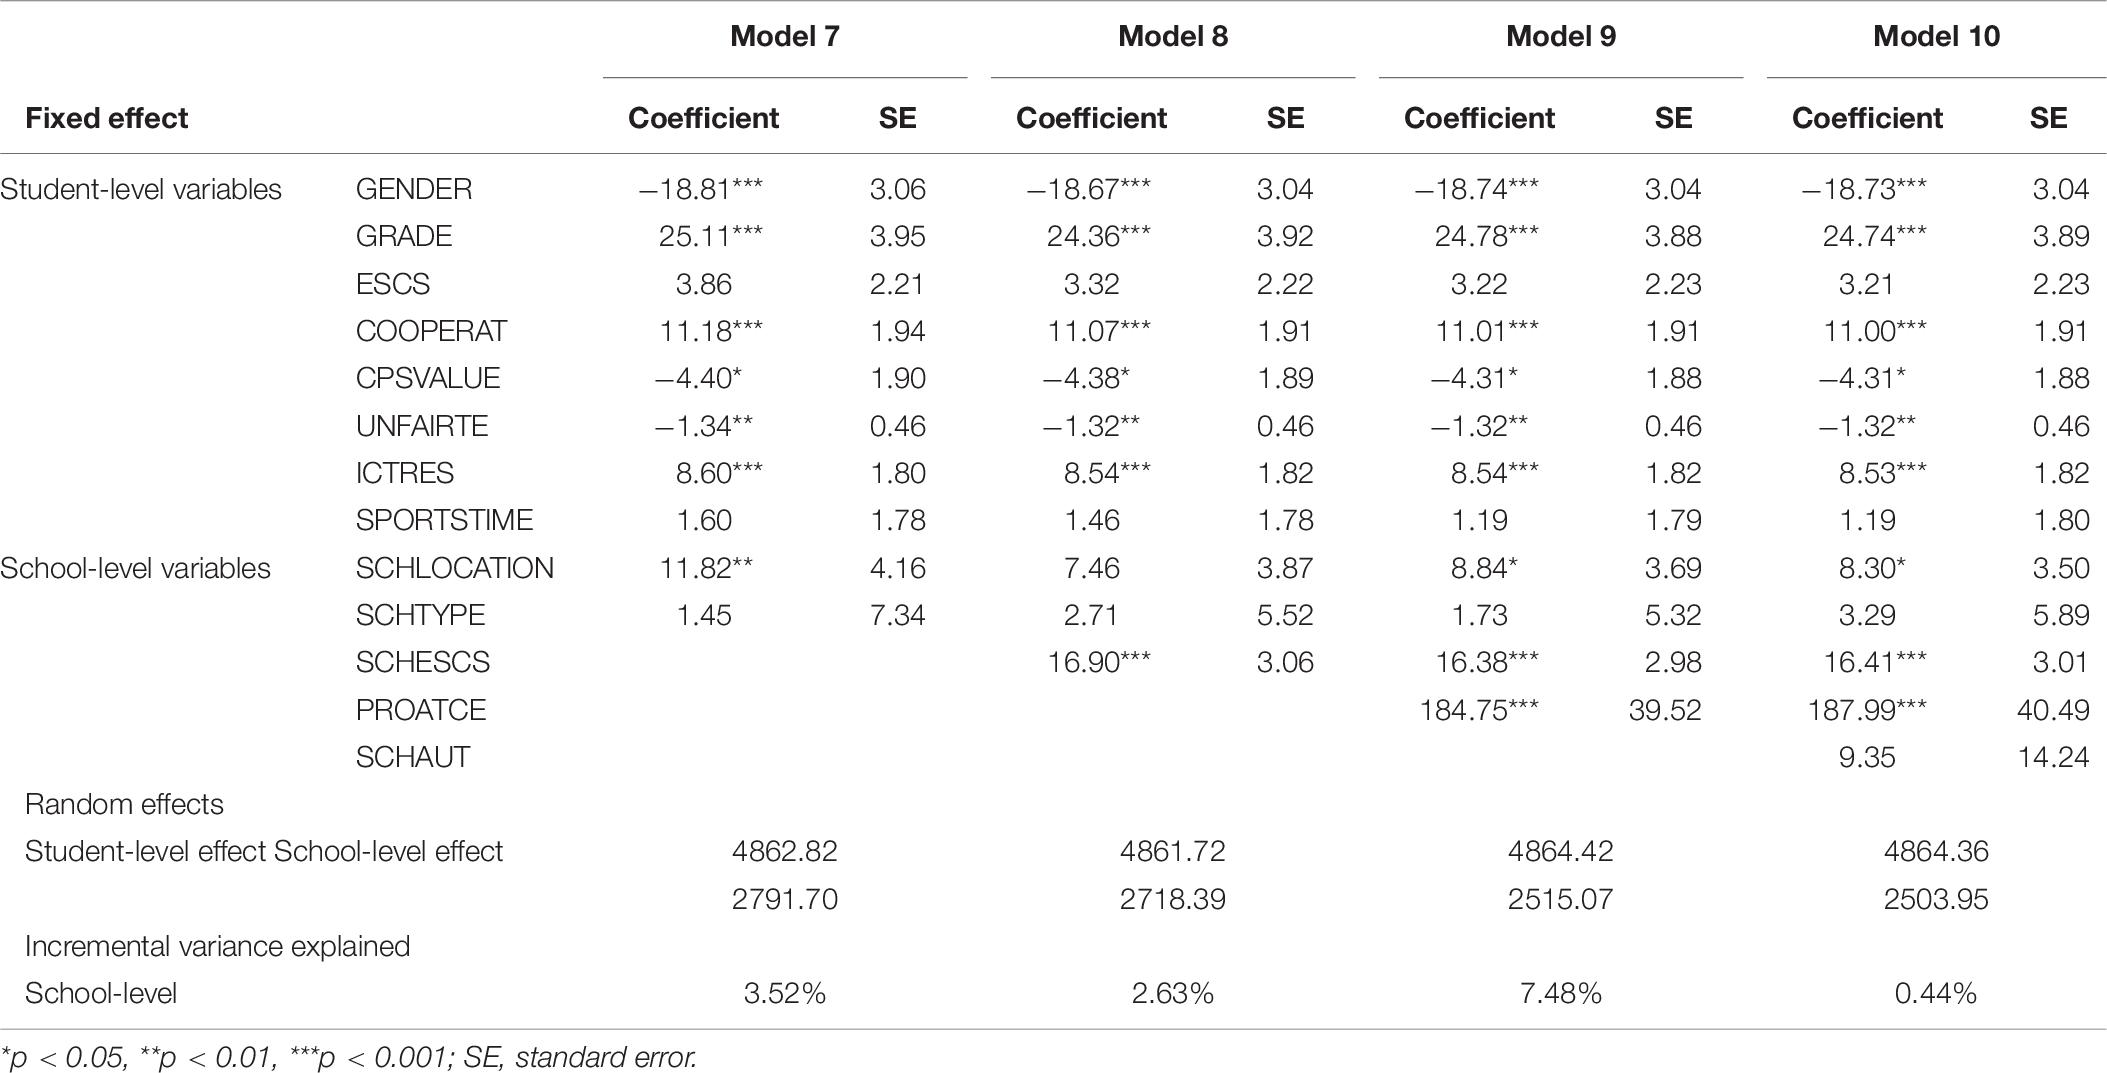
Table 6. The Analysis Result of the School-level Model (Model 7–Model 10).
Model 7 mainly explored the role of school background characteristic variables. In Model 7, eight student level independent variables were all added to equation of student level, and school location and school ownership were added to equation of school level. Then, the school level variance became 2791.70, which was less compared with the school level variance in Model 6. Therefore, at the school level, the two variables accounted for 3.52% of the school level variance in students’ CPS performance. After controlling the predicting factors at the student level, school location predicted students’ CPS performance significantly (γ = 11.82, p < 0.01), but school ownership didn’t (γ = 1.45, p > 0.05). Model 8 showed that after controlling the school location and ownership, the average school ESCS was effective in predicting students’ CPS performance (γ = 16.90, p < 0.001), and the average ESCS of school explained 2.63% of school level variance in students’ CPS performance. Model 9 indicated that the proportion of all teachers fully certified greatly predicted students’ CPS performance, and it explained 7.48% of the school level variance in students’ CPS performance (γ = 184.75, p < 0.001). With more qualified teachers, students’ CPS competency were better. Model 10 was reported that school autonomy couldn’t significantly predict students’ CPS performances (γ = 9.35, p > 0.05).
Discussion
Student-Level Variables Can Significantly Predict Students’ CPS Competency
As the results shows, grade can significantly predict students’ CPS competency. Students in higher grades had better CPS skills, for collaboration issues were usually involved interdisciplinary comprehensive practical problems; higher grade students had a better mastery of different disciplines. What’s more, students who valued interpersonal relationships performed better in CPS assessments, and students who valued teamwork tended to perform worse. Wang (2018) believed that due to cultural differences, students’ self-reporting of CPS attitudes may be inaccurate. However, the current research believed that students who thought highly of interpersonal relationship would be highly motivated and would utilize more communication skills to ensure the collaboration to be carried out more smoothly. In addition, teachers’ unfairness hindered students’ CPS competency significantly. Whether teachers treated students fairly predicted students’ competency to cooperate. Students spent a lot of time with their teachers every day, and teachers may have the opportunity to compensate for some of the bad experiences in their lives and encourage students to cooperate with others. Therefore, a positive and fair teacher-student relationship was important to students’ CPS achievement. When teachers cared about students and treated them fairly, students feel safer and more capable of participating in school activities and became more cooperative. In contrast, unfairness and disrespect from teachers would make students reject schooling and potentially leave school. Furthermore, ICT resources positively related to students’ CPS competency. The CPS assessment was conducted through computers. Students’ CPS competency can only be observed and evaluated when students had some basic ICT literacy. Students who were familiar with computers performed better in the CPS assessment. Therefore, students with low ICT literacy always achieved worse grades. In terms of the effectiveness of P.E. class time per week, the findings of this research showed that sports time didn’t predict CPS competency significantly. However, in previous research, their findings suggested that students who took 1–2 physical education lessons per week were better at CPS assessment than students who did not or took fewer physical education lessons (Wang, 2018). The present research believed that the inconsistency of the two studies was caused by different kinds of physical activities, because in general moderate physical activities required collaboration, while vigorous physical activities put an emphasis on competition.
School-Level Variables Can Significantly Predict Students’ CPS Competency
School location can predict CPS. Students living in large cities had more access to ICT resources than those living in rural areas or villages. However, school ownership was not significantly related to students’ CPS, for whether to have more CPS training was decided by the national education government, rather than school owners. Schools’ ESCS also predicted students’ CPS competency, and schools with high ESCS can provide students with more ICT resources and CPS training. The proportion of all teachers fully certified highly related to students’ CPS competency, which confirmed the researcher’s assumption. The current research indicated that fully certified teachers had mastered more instructional principles and skills and they clearly knew the significance of CPS in the further world. In their classes, they conveyed this idea to their students and organized more activities involving CPS competency. School autonomy also cannot significantly predict students’ CPS competency. Although, schools with high degree of autonomy could choose the textbook, determine course content, decide which courses are offered and so on, they paid less attention to cultivate students’ CPS competency in China.
Conclusion
This research investigated factors predicting students’ CPS competency in Beijing, Shanghai, Jiangsu, and Guangdong Provinces in China based on the PISA 2015 database. A hierarchical linear model (HLM) was constructed in the current research. The model revealed that there was a huge difference among schools. In addition, among student-level variables, gender, grade, ESCS, ICT resources, students’ attitude toward CPS, and teacher unfairness were effective in predicting students’ CPS competency; among school-level variables, both school location, schools’ ESCS and the number of full qualified teachers were positively related to students’ CPS competency.
According to the research findings, some implications to improve students’ CPS competency are provided. First, schools should carry out more interdisciplinary learning activities to enhance students’ CPS competency. For example, STEAM education is not a simple combination of these five disciplines but rather integrates multidisciplinary knowledge through school activities to cultivate students’ practical ability and CPS competency (Dong and Hu, 2017). Second, teachers can instruct students to conduct more group activities which require CPS in class. Through CPS tasks, students can develop mastery of communication skills, and attach more attention to interrelationships, thereby advancing CPS competency. Third, creating a better cooperative learning atmosphere is beneficial for students to improve their CPS competency. For instance, teachers should treat each student fairly, and policies about school bullying should be released. Fourth, students should be provided with more ICT resources. Students who are unfamiliar with computers will have difficulties in offering appropriate cooperative responses, which makes them perform worse in CPS assessment. Finally, schools should hire more teachers who are fully qualified, for those teachers treat students fairly and attach more importance to fostering students’ CPS competency.
Data Availability Statement
Publicly available datasets were analyzed in this study. This data can be found here: https://www.oecd.org/pisa/data.
Author Contributions
PT wrote the original draft. HL and HW reviewed and edited the draft. All authors contributed to the article and approved the submitted version.
Funding
This study was funded by the Youth Program of National Social Science Foundation of China (CN), and the award number is 20CTJ019.
Conflict of Interest
The authors declare that the research was conducted in the absence of any commercial or financial relationships that could be construed as a potential conflict of interest.
References
Ahonen, A. K., and Harding, S. M. (2018). Assessing online collaborative problem solving among school children in Finland: a case study using atc21stm in a national context. Int. J. Learn. Teach. Educ. Res. 17, 138–158. doi: 10.26803/ijlter.17.2.9
Andrews-Todd, J., and Forsyth, C. M. (2018). Exploring social and cognitive dimensions of collaborative problem solving in an open online simulation-based task. Comput. Hum. Behav. 104:105759. doi: 10.1016/j.chb.2018.10.025
Bo, Y., and Lin, P. T. (2016). The construction of cps concept—based on PISA 2015 cps studies. Prim. Second. School. Abroad 3, 52–56.
Burrus, J., Jackson, T., Xi, N., and Steinberg, J. (2013). Identifying the most important 21st century workforce competencies: an analysis of the occupational Information Network (O∗NET). ETS Res. Rep. Series 2013, i–55. doi: 10.1002/j.2333-8504.2013.tb02328.x
Care, E., Scoular, C., and Griffin, P. (2016). Assessment of collaborative problem-solving in education environments. Appl. Measure. Educ. 29, 250–264. doi: 10.1080/08957347.2016.1209204
Chang, C. J., Chang, M. H., Chiu, B. C., Liu, C. C., Fan Chiang, S. H., Wen, C. T., et al. (2017). An analysis of student collaborative problem-solving activities mediated by collaborative simulations. Comput. Educ. 114, 222–235. doi: 10.1016/j.compedu.2017.07.008
Dong, H. J., and Hu, X. Y. (2017). The research analysis and future prospect of STEAM in China. Modern Educ. Technol. 9, 115–121.
Graesser, A. C., Foltz, P. W., Rosen, Y., Shaffer, D. W., Forsyth, C., and Germany, M. (2018). “Challenges of assessing collaborative problem-solving,” in Assessment and Teaching of 21st Century Skills, eds E. Care, P. Griffin, and M. Wilson (Heidelberg: Springer), 75–91.
Graesser, A. C., Greiff, S., Stadler, M., and Shubeck, K. T. (2020). Collaboration in the 21st century: the theory, assessment, and teaching of collaborative problem-solving. Comput. Hum. Behav. 104:106134. doi: 10.1016/j.chb.2019.09.010
Griffin, C. C., Jones, H. A., and Kilgore, K. L. (2006). A qualitative study of student teachers’ experiences with collaborative problem-solving. Teach. Educ. Special Educ. 29, 44–55. doi: 10.1177/088840640602900106
Herborn, K., Mustafić, M., and Greiff, S. (2017). Mapping an experiment-based assessment of collaborative behavior onto collaborative problem-solving in PISA 2015: a cluster analysis approach for collaborator pro?les. J. Educ. Measure. 54, 103–122. doi: 10.1111/jedm.12135
Herborn, K., Stadler, M., Mustafić, M., and Greiff, S. (2018). The assessment of collaborative problem solving in PISA 2015: can computer agents replace humans? Comput. Hum. Behav. 104:105624. doi: 10.1016/j.chb.2018.07.035
Hesse, F., Care, E., Buder, J., Sassenberg, K., and Griffin, P. (2015). “A framework for teachable collaborative problem-solving skills,” in Assessment and Teaching of 21st Century Skills: Methods and Approach, eds P. Griffin and E. Care (Dordrecht: Springer), 37–56. doi: 10.1007/978-94-017-9395-7_2
Hou, H. T. (2011). A case study of online instructional collaborative discussion activities for problem-solving using situated scenarios: an examination of content and behavior cluster analysis. Comput. Educ. 56, 712–719. doi: 10.1016/j.compedu.2010.10.013
Li, C. H., and Liu, Z. Y. (2017). Collaborative problem-solving behavior of 15-year-old taiwanese students in science education. Eur. J. Math. Sci. Technol. Educ. 13, 6677–6695.
Liu, S. C., and Huang, X. T. (2019). The analysis of the cross-language equivalence in pisa2015 collaborative problem-solving assessment. China Exam. 322, 44–50.
Lu, H. K., and Lin, P. C. (2017). A study of the impact of collaborative problem-solving strategies on students’ performance of simulation-based learning—a case of network basic concepts course. Int. J. Inform. Educ. Technol. 7, 361–366. doi: 10.18178/ijiet.2017.7.5.895
Nelson, L. M. (1999). “Collaborative problem-solving,” in Instructional Design Theories and Models: A New Paradigm of Instructional Theory, Vol. 2, ed. C. M. Reigeluth (New York: Routledge), 241–267.
OECD (2009a). PISA 2006 Technical Report, PISA. Paris: OECD Publishing. doi: 10.1787/9789264048096-en
OECD (2009b). PISA Data Analysis Manual: SPSS, Second Edition, PISA. Paris: OECD Publishing. doi: 10.1787/9789264056275-en
OECD (2016). PISA 2015 Results (Volume I): Excellence and Equity in Education, PISA. Paris: OECD Publishing. doi: 10.1787/9789264266490-en
OECD (2017a). PISA 2015 Assessment and Analytical Framework: Science, Reading, Mathematic, Financial Literacy and Collaborative Problem Solving, revised edition, PISA. Paris: OECD Publishing. doi: 10.1787/9789264281820-en
OECD (2017b). PISA 2015 Results (Volume V): Collaborative Problem Solving, PISA. Paris: OECD Publishing. doi: 10.1787/9789264285521-en
Oliveri, E. M., Lawless, R., and Molloy, H. (2017). A Literature Review on Collaborative Problem-Solving for College and Workforce Readiness. ETS Research Report Series. (GRE Board Report No. 17-03). Princeton, NJ: Educational Testing Service. doi: 10.1002/ets2.12133
Roschelle, J., and Teasley, S. D. (1995). “The construction of shared knowledge in collaborative problem-solving,” in Computer Supported Collaborative Learning, ed. C. E. O’Malley (Heidelberg: Springer), 69–97. doi: 10.1007/978-3-642-85098-1_5
Rutkowski, L., Gonzalez, E., Joncas, M., and Von Davier, M. (2010). International large-scale assessment data: issues in secondary analysis and reporting. Educ. Res. 39, 142–151. doi: 10.3102/0013189x10363170
Scherer, R., and Tiemann, R. (2012). Factors of problem-solving competency in a virtual chemistry environment: the role of metacognitive knowledge about strategies. Comput. Educ. 59, 1199–1214. doi: 10.1016/j.compedu.2012.05.020
Stadler, M., Herborn, K., Mustafić, M., and Greiff, S. (2019). Computer-based collaborative problem-solving in pisa 2015 and the role of personality. J. Intell. 7:15. doi: 10.3390/jintelligence7030015
Sun, C., Shute, V. J., Stewart, A., Yonehiro, J., Duran, N., and D’Mello, S. (2020). Towards a generalized competency model of collaborative problem-solving. Comput. Educ. 143:103672. doi: 10.1016/j.compedu.2019.103672
Tan, H. L., Li, W. Y., and Wan, X. R. (2018). Assessment of collaborative problem-solving ability in international education assessment program: index framework, assessment standard and technical analysis. e-Educ. Res. 39, 125–130.
Wang, J. (2018). 15-year-old Chinese students’ performance in collaborative problem solving and the related factors: an analysis based on PISA 2015 data. Res. Educ. Dev. 38, 66–74.
Wang, L. (2016). Assessment and evaluation of key competences for student development-lessons from collaborative problem solving of PISA2015. Glob. Educ. 45, 24–30.
Xiang, H., Leung, F. K. S., and Yuan, T. (2018). The influence of culture on students’ mathematics achievement across 51 countries. Int. J. Sci. Math. Educ. 16, 7–24. doi: 10.1007/s10763-018-9899-6
Xv, S. H., and Li, M. J. (2019). Analysis on the student performance and influencing factors in the PISA2015 collaborative problem-solving assessment–A case study of B-S-J-G(China). Educ. Approach 277, 9–16.
Yang, R., and Wang, J. Y. (2019). International research progress and trend of collaborative problem solving: based on bibliometric analysis of educational studies in the web of science database. Prim. Second. School. Abroad 6, 10–18.
Keywords: PISA 2015, hierarchical linear model, ESCS, factors predicting CPS, collaborative problem solving
Citation: Tang P, Liu H and Wen H (2021) Factors Predicting Collaborative Problem Solving: Based on the Data From PISA 2015. Front. Educ. 6:619450. doi: 10.3389/feduc.2021.619450
Received: 20 October 2020; Accepted: 30 March 2021;
Published: 27 April 2021.
Edited by:
Yong Luo, Educational Testing Service, United StatesReviewed by:
Dandan Liao, American Institutes for Research, United StatesTing Wang, University of Missouri, United States
Copyright © 2021 Tang, Liu and Wen. This is an open-access article distributed under the terms of the Creative Commons Attribution License (CC BY). The use, distribution or reproduction in other forums is permitted, provided the original author(s) and the copyright owner(s) are credited and that the original publication in this journal is cited, in accordance with accepted academic practice. No use, distribution or reproduction is permitted which does not comply with these terms.
*Correspondence: Hao Liu, liuhao@bnu.edu.cn