Dynamic response of existing embankment dams in specific geotechnical and seismological conditions: contemporary framework for Serbian national guidelines
 Srđan Kostić1,2*
  Dragan Rakić
- 1Jaroslav Černi Water Institute, Belgrade, Serbia
- 2University of Novi Sad Faculty of Technical Sciences, Novi Sad, Serbia
- 3University of Kragujevac, Faculty of Engineering, Kragujevac, Serbia
- 4Geofizički biro Beograd, Belgrade, Serbia
We suggest a new approach for evaluating the dynamic response of existing embankment dams as a guideline for national engineering regulations in Serbia. This novel concept is applied to the case study of the existing embankment dam “Zavoj” (Serbia), built at the place of the previously formed natural dam (due to large landslide activity), and exposed to Mw7.4 Vrančea earthquake and under double impact of Kresna earthquake (Mw6.8 and Mw7.1). Results of transient FEM and direct dynamical analysis of the three-dimensional FEM model of the “Zavoj” dam indicate that the existing dam is stable in dynamic conditions, while the surrounding terrain is either on the verge of stability or becomes unstable, depending on the assumed geotechnical conditions and a relevant earthquake analyzed. As a result, we construct a landslide hazard map in dynamic conditions and the dam damage map, which enables the identification of unstable, damaged, or weak parts of the dam, its immediate surroundings, and the accumulation zone in general. The results indicate that direct dynamical analysis is obligatory when two succeeding earthquakes occur and temporal evolution of displacements in the model is required. Additionally, the application of the remaining bearing capacity criterion indicates a much larger zone of potential instability compared to the extent of equivalent plastic strain and the location of the old sliding surface. By following the proposed guidelines, one secures the inclusion of all the relevant influential factors in the comprehensive dynamic analysis of existing embankment dams, leading eventually to reliable decisions on further design, (re)construction, and/or monitoring activities.
1 Introduction
The rapid increase in dam design and construction started in Serbia (and former Yugoslavia) after World War II, i.e., in the period 1950–1970 over 70 high dams (structural height over 15 m) were built within the borders of former Yugoslavia (Verčon, 1971). Some of these dams represent a real peak of civil construction in that period, including Grančarevo (Bosnia and Herzegovina) in 1967 (123 m height) and Špilje (in Macedonia) in 1969 (112 m height). However, although these dams were designed and constructed using extensive geotechnical field data, which included large-scale rock mechanical testing, the majority of them were built without the proper seismic analysis. The reason for this lies in the following: before 1963 and the Skopje earthquake, there was no clear evidence of earthquake activity in this area, while instrumental recordings of earthquakes started after 1970 (Kostić et al., 2013). The only significant earthquake that was documented in detail before World War II and with the epicenter in Serbia was the earthquake that hit Svilajnac in 1893, with an estimated intensity of 9° according to the MSK-64 scale, which, apart from damage to structures, also caused the occurrence of significant ground deformation, including cracks, rockfalls and landslides (Kovačević, 2000). Apart from this seismic event, the earthquake with the epicenter in Berovo (Bulgaria) in 1904 is also well documented and it is considered the strongest earthquake that hit the Balkan peninsula in the XX century. The estimated intensity of this earthquake was 9–10°MSK-64, with a magnitude of 7.8. However, it was the earthquake in Skopje in 1963 that “triggered” the engineering community in Serbia to re-evaluate the domestic regulations and approach from engineering practice regarding the design of earthquake-resisting structures. The earthquake in Skopje had an estimated intensity of 9 °MSK-64, with a magnitude of 6.1, and a hypocentral depth of 5–13 km. It turned out that the timing for redefinition of domestic regulations in the area of seismic analysis was proper, since, after the Skopje earthquake, several more earthquakes hit the area of former Yugoslavia: Banja Luka in 1969 [I=80 MSK-64; M=6.4], Montenegro in 1979 [I=90 MSK-64; M=6.6] and Kopaonik in 1980 [I=80 MSK-64; M=6.0]1. In this period, domestic regulations have been changing several times, since the recorded seismic events enabled the re-evaluation of previously proposed approaches: seismological maps were proposed and published in 1948, 1950, 1973, 1982, and 1987, including the corresponding regulations. The year 1987 was crucial for the understanding of earthquake activity in this region since two major publications appeared: 1) Seismological Map of SFR Yugoslavia, with the presentation of earthquake intensity according to MSK-64 scale, for the return periods 100, 200, 500, 1000, and 10000 years (Vukašinović, 1987) and 2) Guidelines for design and calculation of engineering structures in seismic areas, which has never been officially adopted but is still being used in engineering practice. These two documents together with the Guidelines on regulations for building structures in seismic areas (Official Gazette of SFRY and 31/81, 2024) formed a basis for seismic calculations of structures in Serbia up until 2020, when Eurocode EC-8 regulations became obligatory in Serbia. However, EC-8 does not anticipate separate procedures for seismic analysis of dams, and the detailed procedure is left for a national annex to resolve. Since no such Annex exists in Serbia, there are still no formal guidelines for the seismic design of new dams, and, particularly, analysis of the stability of the existing dams. Therefore, in the present paper, we propose a concept for the seismic analysis of existing embankment dams, their immediate surroundings, and the corresponding accumulation zones.
Taking into account that the majority of embankment dams in Serbia were built more than 50 years ago, this time frame could be considered significant for reevaluating the dams’ seismic safety for the following reasons: 1) new earthquakes were recorded after the construction of these dams, some of them could have a crucial impact on the dam seismic hazard and risk, 2) strong development of computational and numerical methods in recent years has enabled the application of transient dynamic analysis, which is more relevant for estimation of seismic safety compared to traditional quasistatic approach. According to Wieland (Wieland and Earthquake safety of existing dams, 2006) until 1989 when the International Commission on Large Dams (ICOLD, 1989) published the guideline on ‘Selecting Seismic Parameters for Large Dams’ (Bulletin 72), it was common practice to design dams against earthquakes using the pseudo-static approach typically for a horizontal acceleration of 0.1 g. The largest ground shaking at a dam site caused by a strong shallow focus earthquake can greatly exceed the old pseudo-static design acceleration of 0.1 g. The peak ground acceleration (PGA) on rock can reach values of up to 1.0 g in the epicentral region of a shallow focus earthquake with a magnitude of around 6.5. This is the main reason why existing embankment dams need to be re-evaluated regarding their seismic safety.
In the present paper, we propose a new concept for the analysis of the stability of existing embankment dams and the accumulation zone in seismic conditions, which provides reliable and comprehensive results that could be further used as decision support. The suggested approach includes the following phases: 1) adequate geotechnical and seismological characterization of the dam area; 2) proper dynamic analysis of dam stability; 3) decision-making phase, regarding further design, reconstruction, remediation, and/оr monitoring activities.
The proposed concept is verified for the case study of the wider area of embankment dam “Zavoj” in eastern Serbia, which was designed during the 70s of the XX century, and whose construction was finished in 1984, before the regulations in 1987 were adopted. Two specific aspects of seismic hazard and risk are unique for the location of “Zavoj” dam: 1) specific seismic impact, including the strong influence of two epicentral zones producing earthquakes from different directions, and the unexpected occurrence of coupled seismic events from the Kresna epicentral zone; 2) specific geotechnical conditions, with dam partly founded on the landslide material, while the whole area within the dam and accumulation zone is prone to landslide (re)activation. For this case study, seismic impact is determined by thorough seismological analysis of the wider area of the dam site with a corresponding choice of relevant acceleration time series, based on the recordings of previous earthquakes within the dam site or in the wider area, or by choosing adequate accelerograms from the available databases.
We consider the applied approach novel for several main reasons. As far as we know, this is the first time that the 3D seismic stability of the existing embankment dam and its surroundings is examined. There are some previous studies on the 3D seismic stability of earth dams, including the work done by Mejia and Seed (Mejia and Seed, 1983), Elgamal (Elgamal, 1992), and Alavi et al., 2020. Still, none of them included the analysis of the behavior of the surrounding rock mass, with the possibility of analyzing the effect of the failure within the accumulation zone on the dam stability. Moreover, this is the first attempt to provide a comprehensive approach to the assessment of the seismic response of existing embankment dams in Serbia. One could consider it as the starting point for official guidelines. Also, our approach emphasizes the significant influence of the previous landslide activity (the existence of an old sliding surface) on the stability of the dam’s surrounding rock mass. Furthermore, the application of the remaining bearing capacity criterion, which was originally developed in our previous paper (Rakić et al., 2022), indicates a much larger zone of potential instability compared to the extent of the zone of equivalent plastic strain and the size of an old sliding surface. Therefore, this criterion is promoted to be used in further seismic analysis, enabling a clear overview of the remaining load-bearing capacity of each point of the model.
2 Concept description
The analysis of the dynamic response of existing embankment dams and the accumulation zone should be conducted in the following phases (Figure 1):
- Determination of the construction properties and composition of the existing embankment dam, based on the available design and construction documentation;
- Detailed geotechnical characterization of the study area, with special attention to the slope stability at the dam area and within the accumulation zone. This assumes the analysis of the history of the previously recorded landslide activity, including old, dormant, and ''fossil'' landslides. This phase could include the conduction of detailed field and laboratory geotechnical works if required;
- Detailed seismological characterization of the study area, with the determination of the position of active seismogenic faults and representative earthquakes recorded in the past, that have a relevant impact on the structure;
- Dynamic analysis of the dam and accumulation zone, using transient FEA analysis and direct dynamical analysis. The results of this phase are the stability of a dam (factor of safety and displacement) and the stability of the surrounding rock mass and the accumulation zone, with the possibility to calculate the location, extent, and volume of the damaged area (dam) and displaced material (in the surrounding rock mass and within the accumulation zone). This phase of the analysis also results in the map of landslide hazard and dam damage map. Additionally, one may check the dam response to the impact of design earthquakes, after recommendations by ICOLD, (2024) or similar;
- Based on the determined damaged zones in the dam (if any), one can further make reliable decisions on the design and construction of adequate remediation measures.
- Based on the produced hazard maps, one can make adequate decisions on the type of monitoring equipment and the location of the equipment installation.
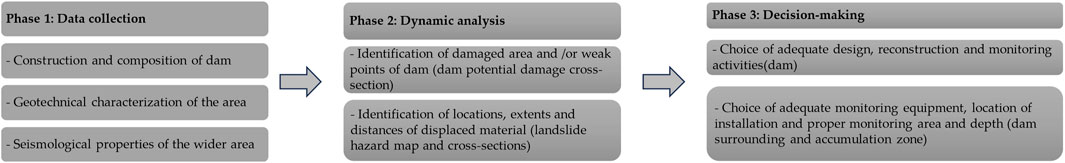
FIGURE 1. Concept of the analysis of the dynamic response of the existing embankment dams.
3 Case study
The dam and accumulation “Zavoj” were built on the river Visočica, about 13 km northeast of the city of Pirot (Serbia), Figure 2. The dam was built in the period from 1983 to 1989. The construction of the dam was completed in 1987, and the arrangement of the crown in 1989. The filling of the reservoir began in July 1989. The main purpose of the dam and the reservoir is to provide water for the production of electricity in the HPP “Pirot”. Additional purposes are to accept the flood wave, reduce sediment deposition in the Nišava river stream and the valley of the Southern and Great Morava, improve the quality of the Visočica and Temska river streams, possible water supply, etc.
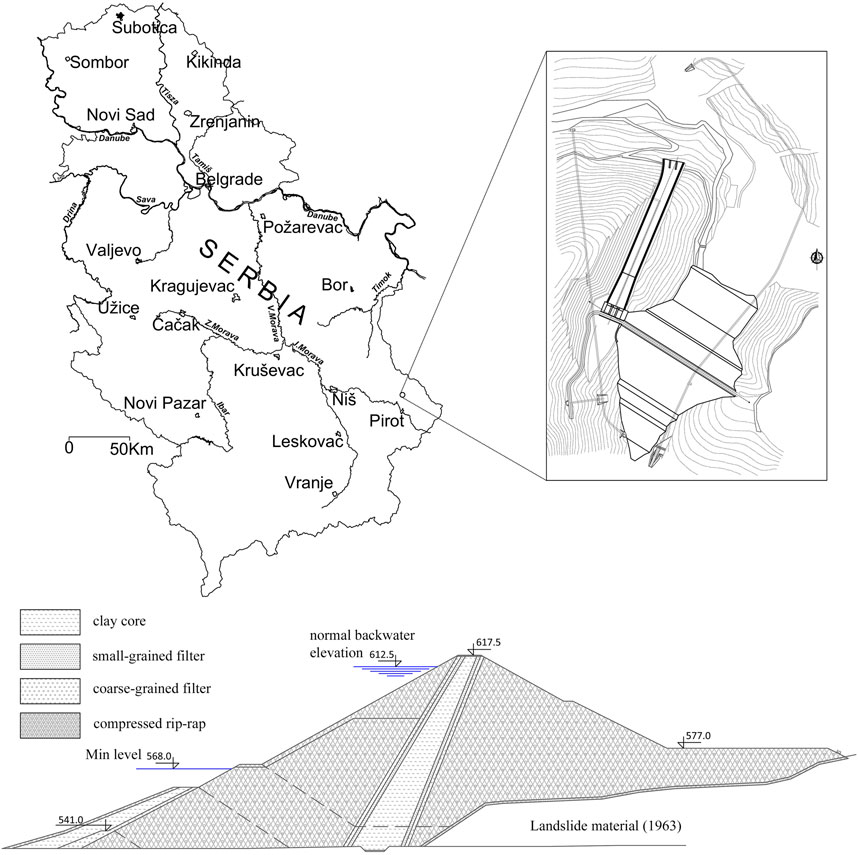
FIGURE 2. Location of the embankment dam “Zavoj” and typical dam cross-section (after (Jaroslav Černi Water Institute, 2020); amended).
3.1 Dam construction and composition properties
The dam is of the combined type with an upstream and downstream support body made of compacted stone, an upstream sloping clay core, and appropriate filter zones between the clay core and the stone (Jaroslav Černi Water Institute, 2020). The construction height of the dam is 86.0 m, and the length of the dam crest is 250.0 m. The crest of the dam is at an altitude of 617.5 m.a.s.l. (Figure 2).
The downstream stone embankment in the dam’s central part is founded on the landslide material (i.e., on the natural dam which was formed as a result of the large 1963 landslide), while the rest of the dam is based on the rock. A layer of coarse-grained filter was installed between the downstream stone embankment and the landslide material. The dam foundation on the landslide material in the central part prevents the normal outflow of downstream water through the old bed of the Visočica River, so all downstream water is drained through a drainage gallery (bypass tunnel) built at the right side of the dam. In the axis of the dam core, there is a concrete slab of variable width, from which the rock mass was injected to the maximum depth in the riverbed of 25.0 m. One should note that the grout curtain was also made on the sides of the dam.
3.2 Geotechnical characterization
From the engineering-geological viewpoint, the location of dam “Zavoj” is composed of dominantly Lower Triassic (T1) sandstones (0.3–0.5 m thick) and claystone (0.1–2 m thick), which build a flysch complex, with subordinate occurrence of limestones (up to 5 m thick), Figure 3.
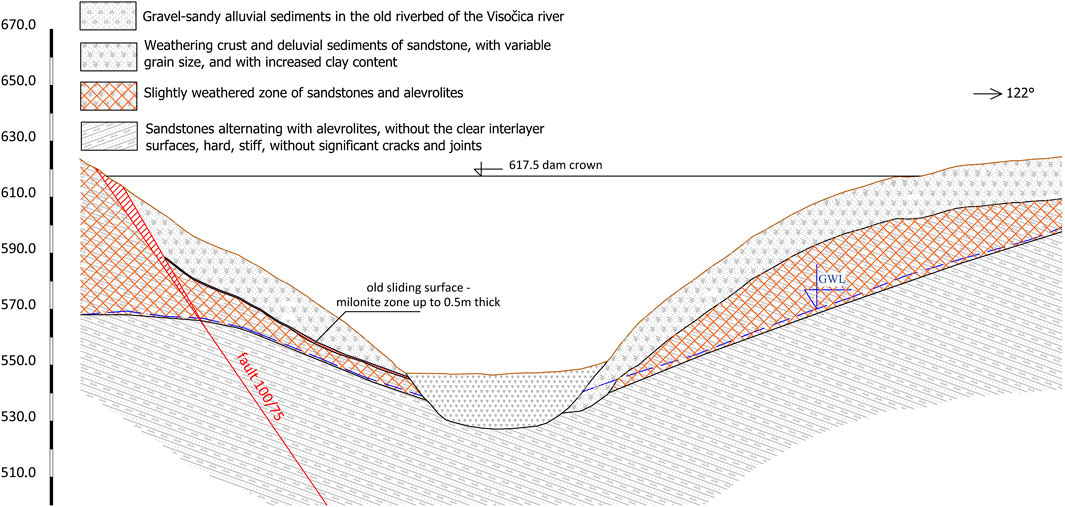
FIGURE 3. Illustration of the engineering-geological cross-section along the embankment dam “Zavoj” (after (Cvetković-Mrkić, 1995); amended).
Sediments at the dam location and neighboring dam structures represent moncline series with dip elements 180/20. These sediments are susceptible to weathering and have developed a thick weathering crust in the area of whole accumulation, with thickness occasionally over 10 m. This thick weathering crust, which becomes potentially unstable when saturated, together with the lower friction along the interlayer surfaces between sandstones and claystone, is considered to create favorable initial conditions for massive landslide activation in February 1963 (Supplementary Figure S1). The main triggering factor for landslide activation was the significant snow melting in the first half of February in 1963. The displaced mass had approximately 4.000.000 m3, with a 1.5 km long landslide, which cut the flow of the Visočica River and formed a natural 36 m high and 500 m wide earth dam (Gojgić et al., 1965). The formed lake was approximately 10 km long and had an accumulation of nearly 30.000.000 m3 of water, flooding the village of Zavoj, and threatening the downstream settlements all the way south to the city of Niš (Supplementary Figure S2). This natural lake existed for 22 months until the water was drained by digging a 600 m long tunnel.
Since no data on the geotechnical characterization and corresponding parameters exists, the values of Coulomb-Mohr parameters were determined through the estimation of GSI values and uniaxial compression strength, while the estimation of rock mass modulus was done using the Hoek-Diederich approach (Hoek and Diederichs, 2006):
- Old sliding surface - GT-1 (for slope height h=20 m), γ=17.5 kN/m3, c=25kPa, φ=20°, E=12.8 MPa, Damage factor D=0.8, Rock mass parameter mi=13, GSI=25, Ei = 450 kPa, Modulus Ratio MR=150, σci=3 MPa.
- Weathering crust—GT-2 (for σ3max=0.63 MPa), γ=18.0 kN/m3, c=89kPa, φ=24.78°, E=51.54 MPa, Damage factor D=0.75, Rock mass parameter mi=13, GSI=30, Ei = 1500 kPa, Modulus Ratio MR=150, σci=10 MPa.
- Slightly weathered sandstones and averolites - GT-3, γ=19.0 kN/m3, c=736kPa, φ=25°, E=192 MPa, Damage factor D=0.5, Rock mass parameter mi=17, GSI=37, Ei = 3000 kPa, Modulus Ratio MR=150, σci=20 MPa.
- Intact sandstones and claystones - GT-4, γ=22.0 kN/m3, c=1906kPa, φ=32°, E=1000 MPa, Damage factor D=0.3, Rock mass parameter mi=21, GSI=44, Ei = 7500 kPa, Modulus Ratio MR=200, σci=30 MPa.
One should note that the whole area of accumulation is susceptible to landslide activation (Jaroslav Černi Water Institute, 1995), which was confirmed by many recorded landslides in the previous period (Supplementary Figure S3).
4 Methodology applied
Based on the available geodetic data and determined terrain geological construction and geotechnical parameters, we develop a 3D geotechnical model that contains all the basic elements of the dam and the surrounding rock mass and consists of the following parts: dam body (clay core, multi-layer sand filters, upstream and downstream rockfill), grout curtain and concrete spillway section. The surrounding rock mass consists of 5 geotechnical units. The 3D model of the “Zavoj” dam with indicated geotechnical (GT) units is shown in Figure 4.
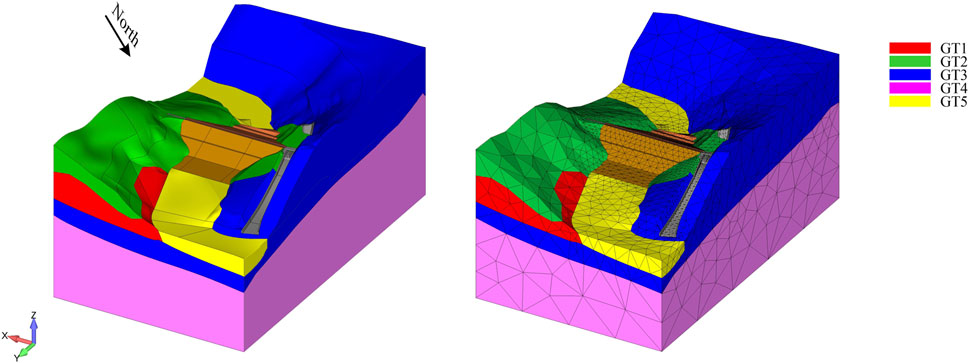
FIGURE 4. 3D geotechnical model of “Zavoj” dam and the corresponding FEM model.
In the next step, the finite element (FE) model of the dam and surrounding rock mass was generated for the developed 3D model. The FE model for numerical analysis was developed according to the previously defined zones, using tetrahedral finite elements, and consists of 30698 elements and 7433 nodes. The developed model has dimensions of 612 x 850 x 400 m.
The boundary conditions are set as follows: restricted horizontal displacement of the nodes in the direction perpendicular to the vertical model boundaries and restricted displacements of nodes at the model bottom. The first phase of the numerical simulation consisted of generating an initial stress state due to gravity load. In the case of quasi-static analysis, horizontal acceleration is applied in the x direction (for the Kresna earthquake) and the y direction (for the Vrančea earthquake). In the case of explicit dynamic analysis, the boundary conditions previously set on the vertical model boundaries in the direction of the x-axis and/or y-axis, depending on the acting earthquake, were replaced by prescribed earthquake acceleration.
The Mohr-Coulomb constitutive model was used to describe the mechanical behavior of the dam body and surrounding rock mass. Adopted material parameters are based on the previously estimated parameters given in Section 3.2:
- GT-1: E=1.0·104 kPa; ν=0.40; γ=17.5 kN/m3; c=25 kPa; φ=20°; k=1.0·10−6 m/s.
- GT-2: E=5.0·104 kPa; ν=0.30; γ=18.0 kN/m3; c=100 kPa; φ=25°; k=1.0·10−4 m/s.
- GT-3: E=2.0·105 kPa; ν=0.25; γ=19.0 kN/m3; c=750 kPa; φ=28°; k=1.0·10−6 m/s.
- GT-4: E=1.0·106 kPa; ν=0.20; γ=22.0 kN/m3; c=2000 kPa; φ=32°; k=1.0·10−7 m/s.
- GT-5: E=5.0·104 kPa; ν=0.35; γ=20.0 kN/m3; c=15 kPa; φ=26°; k=1.0·10−3 m/s.
Parameter values for gravel-sandy alluvial deposits of the Visočica River (GT-5) are estimated according to experience from engineering practice. For the explicit dynamic analysis, Rayleigh viscous damping was used. To obtain the Rayleigh damping coefficients, a modal analysis of the dam and the surrounding rock mass was first conducted.
The choice of the relevant earthquake (epicenter, magnitude/intensity/hypocenter) is made by analyzing the existing seismological maps and the recordings of historical earthquakes. We analyze seismological maps of Serbia and Bulgaria (the dam is located near the border with Bulgaria).
If a recorded accelerogram for the chosen historical earthquake exists, then we use this recorded acceleration time history as input for further dynamic analysis. This is the case of the Vrančea earthquake, for which the actual acceleration recording was made at the station located in Niš, which is relatively close to the dam location and could be considered relevant for the analysis of the seismic response of the Zavoj dam.
If there is no recorded acceleration time series for the chosen historical earthquake, as is the case of the Kresna earthquake, then we first need to determine the main parameters of the earthquake which will enable us to choose the corresponding acceleration time series from the database of the previous recorded earthquakes. Peak ground acceleration PGA, relevant ground oscillation period T corresponding to PGA, and the impulse width d of the oscillations with amplitude higher than 0.5PGA are determined using the following expressions (Aptikaev, 2012):
where M is the earthquake magnitude and R is the epicentral distance in Eqs 1–3. Parameter C in Eq. 2 is equal to −1 for reverse fault, 0 for normal fault, and 1 for transform fault. In Eq. 3 parameter C1 is equal to 0.25 for normal fault, 0 for transform fault, and 0.25 for reverse fault. Coefficient C2 is equal to −0.15 for 1st soil category (Vs.≥700 m/s, Vp/Vs=1.7–2.2), 0 for 2nd soil category (Vs=50–700 m/s, Vp/Vs=1.45–2.22, for unsaturated and 2.2–3.5 for water-saturated soils) and 0.40 for third soil category (Vs=150–250 m/s; 60–150 m/s for soils which are highly likely to liquefy during earthquakes with an intensity of more than VI degrees, Vp=3.5–7.0; 7.0–15 for soils susceptible to the occurrence of liquefaction). In the present study, we consider that earthquakes are generated by movement along the normal fault, while the soil at the dam location belongs to 2nd category of soil. Hence, in the present case, Eq. 3 has the following form:
Once these parameters are determined for the present location, we define the accelerogram from the available seismological database (Center for Engineering Strong-Motion Data CESMD, 2022), according to the method of representative accelerograms (Douglas and Aochi, 2008).
Numerical analysis of stability was carried out using two approaches: 1) quasi-static analysis, which is the approach currently being used in Serbia, with maximum seismic acceleration applied and based on the convergence criterion, and 2) explicit dynamic analysis, where adequate earthquake accelerograms were used (Kojić et al., 1999). Using the first approach, stability was analyzed by determining the factor of safety (FoS), while in the second approach, the relative displacement increment was used as a stability criterion. For this purpose, a special numeric wrapper was developed. According to this criterion, the structure is said to be stable as long as the displacements have a stable (approximately linear) increment. If the displacement increment starts to increase exponentially, as shown in Figure 5A, it is considered that the structure has lost its stability. The application of the displacement criterion is necessary since the explicit dynamic analysis has unconditional convergence, so the application of the convergence criterion in the assessment of stability is not possible.
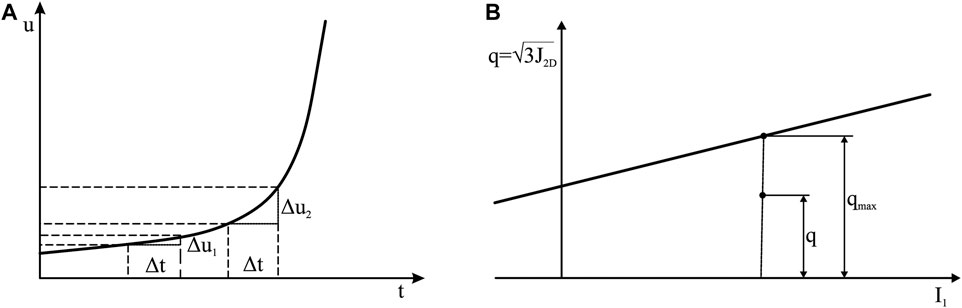
FIGURE 5. Analysis of stability: (A) criterion based on the displacement, (B) criterion based on the remaining load-bearing capacity.
To analyze the remaining bearing capacity of the structure, we introduce a new vector, which represents the distance of the stress point from the failure surface (Figure 5B). In particular, this vector shows the distribution of the mobilized strength of the material. The remaining load-bearing capacity can be calculated at each material point, according to the following Eq. 5:
where quantity q represents the distance of the stress point from the hydrostatic axis for a specific first stress invariant I1 while qmax represents the distance of the failure surface from the hydrostatic axis for the same value of I1.
In the case of quasi-static analysis, the peak values of seismic accelerations for two representative earthquakes were used (Kresna and Vrančea). Firstly, to couple the analysis of filtration with the stress-strain analysis of stability, a numerical simulation of the water flow through the porous media was carried out. As part of the quasi-static stability analysis, an analysis of the impact of the old sliding surface (material GT-1 in Figure 4) on the structure FoS was carried out, where two hypothetical cases were analyzed: 1) the case when GT-1 exists, and 2) the case when GT-1 does not exist, i.e., when this volume of soil has the same mechanical characteristics as the upper layer of the soil (GT-1=GT-2). In this way, the sensitivity of the model to the variation of the parameters of the old sliding surface is examined. Slight changes in the parameter values of other geotechnical units within the reasonable engineering range (10%) do not have any significant impact on the seismic response of the model. The factor of safety was determined using the shear strength reduction (SSR) method (Rakić et al., 2023). To determine the FoS of the dam, independent of the rock mass, the SSR method of the dam body was applied. In this way, it was shown that the loss of stability in the rock mass will occur earlier than the loss of stability of the dam body. The results of the quasi-static analysis are presented in the form of the field of plastic strain, the field of remaining load-bearing capacity, as well as the field of total displacements.
Explicit dynamic analysis was also carried out using the signals of two representative earthquakes. As a result of dynamic analysis, the translation of the dam crest, the translation of the point with the largest amplification of acceleration in the model, and the point with the largest total translation in the model are shown.
The contour conditions used in both analyses correspond to the maximum reservoir water level (rwl=615.9 m asl) and normal operating mode was simulated (there is no initial damage to the structural elements).
Numerical analyses are carried out using the PAK software created at the Faculty of Engineering University of Kragujevac. The PAK software represents an open-source solution based on the finite element method, so it is possible to modify and upgrade it according to the needs of the analysis.
5 Results
5.1 Seismological properties
According to seismic hazard maps in Serbia in the period 1950–1987, the location of the dam and accumulation ''Zavoj'' belongs to the area of different seismic activity:
-7° MCS according to the Seismological map of Yugoslavia in 1950 (Mihailović and Nedeljković, 1950), the Map of seismic regionalization of Serbia in 1974 (borderline of 6° and 7°) (Vukašinović, 1973), and the Temporary Seismological map of Yugoslavia in 1980 (Supplementary Figure S4) (Vukašinović, 1982);
-7° MSK-64 according to the Seismological map of Yugoslavia in 1987 for the return periods 50 and 100 years (Supplementary Figure S5)
-8° MSK-64 according to the Seismological map of Yugoslavia in 1987 for the return periods 200 and 500 years (Supplementary Figure S5).
The location of dam “Zavoj” at seismological maps of Bulgaria for return periods 100 years and 500 years are given in Supplementary Figure S6. It is clear that the dam is located within the zone of PGA=0.07 g for the return period of 100 years, and PGA=0.11–0.155 g for the return period of 500 years (Еврокод 8, 2012).
5.2 Choice of adequate accelerogram
Corresponding acceleration time series for the investigation area need to be chosen regarding their seismotectonic conditions and data on historical and recorded earthquakes within the area under study or in a wider zone. Regarding the seismotectonic conditions of the investigated area, B. Sikošek (Jaroslav Černi Water Institute, 1992) has made the seismotectonic map, with marked positions of epicentral zones that endanger the dam and accumulation (Supplementary Figure S7).
One can see from Supplementary Figure S7 that there are no seismoactive faults near the dam and accumulation. Faults which are recorded within the investigated area are not seismogenic. As for the earthquakes that endanger the area of investigation, two main directions are singled out:
- North-east direction, with shaking coming from Vrančea epicentral zone (Romania).
- South-east direction, with shaking coming from Kresna epicentral zone (Bulgaria).
The numerical model of the dam is oriented so that the X-axis coincides with the dam axis, the Y-axis is in the direction of the water flow, i.e., perpendicular to the dam axis, while the Z-axis is in the vertical direction upwards (Figure 4). Based on the adopted coordinate system, and the basis of the orientation of the dam in space, it was calculated that the X-axis overlaps the angle of 238° relative to the north. The coordinate axes thus adopted also represent the directions from which the seismic waves for the two analyzed earthquakes come: the direction of the Y-axis approximately corresponds to the direction of the Vrančea epicentral zone. In contrast, the direction of the X-axis corresponds approximately to the direction of the Kresna epicentral zone. The direction of the Vrančea earthquake is less favorable for the dam stability, while the orientation of the Kresna earthquake is less favorable for the slope stability downstream of the dam, within the zone of an old landslide.
Earthquakes in the area of Vrančea (Romania) have epicenters within latitude 45.5–45.8° and longitude 26.4–26.7°, with magnitude in the range MW=7.2–7.5, and hypocentral depth 90–120 km, and with the intensity on the surface 8°–9° MCS scale. This epicentral zone is approximately 350 km north-eastern from the investigated area. The hypocentral zone is approximately rectangular (30 x 60 km2), with an almost vertical block dipping into a depth of 180 km. The maximum intensity of earthquakes from this area is oriented towards the southwest. A good example of the impact of earthquakes on the investigated area is the earthquake that occurred on 4 March 1977, with magnitude Mw=7.4, which was recorded in Niš (Serbia), Figure 6A. It is considered one of the most violent earthquakes to hit Romania, resulting in major human and property losses (Pantea and Constantin, 2013). The maximum PGA for this earthquake was 42 cm/s2, with the highest amplitude in the interval of 0.4–3.4 s, which corresponds to the frequency range of 0.3–2.5 Hz. The recorded velocity corresponds to approximately VI degrees MCS scale, but it should be noted that the whole valley of the city of Niš was triggered to oscillation (about 30 m thick alluvial and Neogene deposits), and this effect was particularly emphasized for high buildings in Niš.
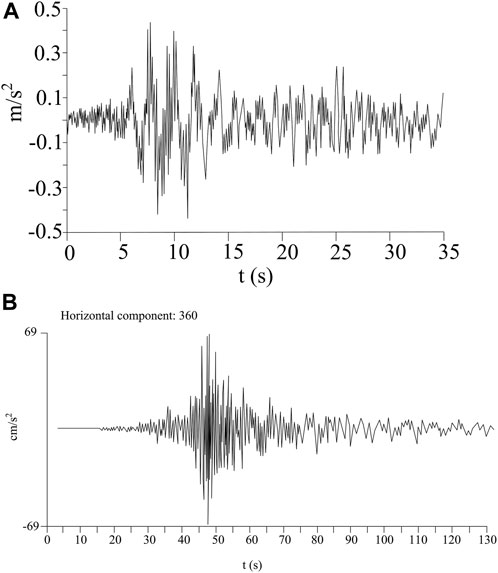
FIGURE 6. Acceleration time histories from earthquakes with epicenters in: (A) Vrančea (Romania), 4 March 1977, recorded in Niš (Serbia) at an epicentral distance of 484 km (Chiou and Youngs, 2013), (B) El Mayor-Cucapah earthquake recorded at station Mecca, CA-FS (USGS) on 4th April 2010, at a hypocentral distance of 160 km (Aptikaev, 2012)
Besides the Vrančea epicentral zone, there is a significant influence of strong earthquakes from the epicentral zone of Kresna-Simitli in Bulgaria. The strongest earthquake within this zone happened on the 4th of April 1904 when two succeeding earthquakes occurred. The first occurred at 10 h 5 min with magnitude Mw=6.8 and intensity of 90 MSK-64, which is considered as the strong foreshock (Уломов, 2010), while the second occurred at 10 h 26 min with magnitude Mw=7.1 and intensity of 10° MSK-64. The distance of this epicentral zone to the dam location is approximately 140 km. According to Ambraseys (Ambraseys, 2001) the dam location was in the zone of 5° MSK-64 scale. This earthquake is considered one of the largest shallow 20th-century events on land in the Balkans (Ambraseys, 2001). The single focal mechanism in the general area and regional morphology indicates normal faulting, with strikes varying between WNW and WSW, and with seismogenic depth of about 10 km. The distribution of intensity of this earthquake, according to the Rossi-Forrel scale, made by J. Mihajlović (Mihailović, 1906) is given in Supplementary Figure S8. Reinterpretation of the maps shown in Supplementary Figure S8 was done by Vukašinović in 1970 (Vukašinović, 1970), for the development of the Seismological map of Serbia. According to this report, the dam location was within the 7° MSC for this earthquake.
Regarding the Kresna earthquake, we first need to express Ms magnitude as Mw magnitude, by using the relationship Eq. 6 proposed by Scordilis (Scordilis, 2006):
which gives the value of Mw=7.4. In the next step, for the earthquake from the Kresna-Simtli epicentral zone using the approach suggested by Aptikaev (Aptikaev, 2012), the radius of the closer zone is estimated using the following expression logR0 = 0.33 M–0.61. Hence, for magnitude 7.4 radius of the closer zone is R0=68 km, so the dam location is situated within the distant zone of this earthquake. PGA for the distant zone is calculated using Eq. 2. For R=140 km and Ms=7.4, PGA is 44 cm/s2, with the upper value of 70 cm/s2. It should be emphasized that the next-generation attenuation (NGA) models are now widely being used as reliable models for the estimation of relevant earthquake parameters needed for further calculation of the dynamics responses of the target structures. These include models by Abrahamson and Silva (Abrahamson and Silva, 2008), Chiou and Youngs (Chiou and Youngs, 2008), Campbell and Bozorgnia (Campbell and Bozorgnia, 2008), Boore and Atkinson (Boore and Atkinson, 2008), and their further updates (Abrahamson et al., 2013; Boore et al., 2013; Campbell and Bozorgnia, 2013; Chiou and Youngs, 2013). Some of the NGA models were also derived for subduction earthquakes (Gregor et al., 2022). Although these models have proved to provide reliable results and are applied successfully in many case studies (Azarafza et al., 2019; Liu et al., 2024), and even used for correction of the previously adopted standards (Borcherdt, 2014), the choice of the relevant NGA model does not make any conceptual change but only affects the actual estimated values of the relevant earthquake parameters. In the present case, the approach by Aptikaev (Aptikaev, 2012) is chosen in accordance with common engineering practice in Serbia. A comparison of the estimated values of PGA with different attenuation relationships is given in Figure 7. The range of the estimated PGA values is 0.025–0.045 g, which corresponds well with the value estimated by Aptikaev (Aptikaev, 2012).
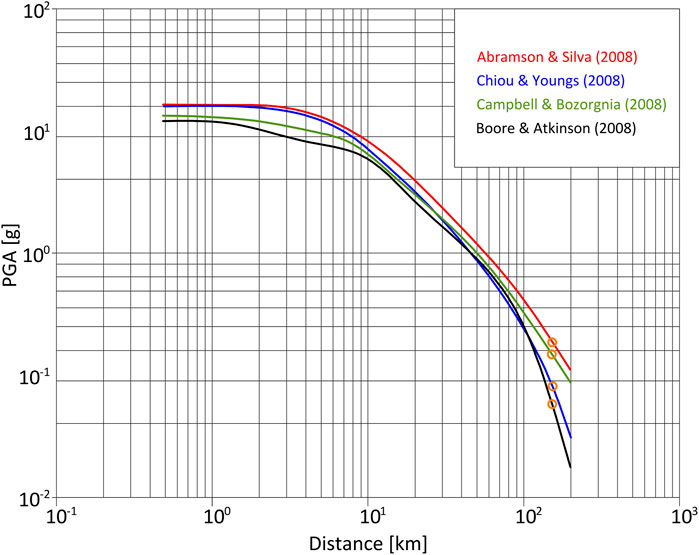
FIGURE 7. Estimation of PGA for Kresna Mw=7.4 earthquake, at R=140 km using different NGA models. PGA values for the Kresna earthquake are marked with orange circles.
The period that corresponds to PGA is in the interval 0.44 s < T < 1s, using Eq. 2. Duration of the oscillation with amplitude higher than 0.5 PGA is calculated using Eq. 4, and it equals 14 s. The total duration of oscillation is approximately 5 times longer; in this case, it is equal to 70 s.
Using these determined parameters of the acceleration time series, a search of the available earthquake database Strong Motion Virtual Data Center (Center for Engineering Strong-Motion Data CESMD, 2022) resulted in the choice of accelerogram from El Mayor-Cucapah earthquake, with an epicenter just south of the US-Mexico border (31.13 N, 115.30 W; Global Centroid-Moment-Tensor), hypocentral depth 4 km and with magnitude Mw=7.2, occurred on 4th April 2010 (Gonzalez-Ortega et al., 2014). For the current analysis, we use recording at station Mecca CA-FS (Station Latitude & Longitude: 33.5720, −116.0772; owned by USGS) with PGA=68.23 cm/s2 (horizontal component: 360) as the representative one for the Kresna 1904 earthquake (Figure 6B). The original recording is scaled so that PGA is equal to 70 cm/s2.
5.3 Results of dynamic analysis
In the first step, we conducted a numerical simulation of the water flow through the porous media. The resulting field of hydraulic potential and the field of pore pressure in the model cross-section are shown in Figure 8.
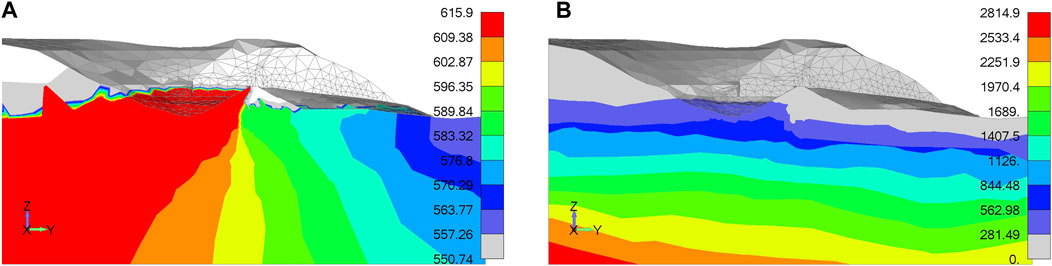
FIGURE 8. (A) Hydraulic potential (masl) and (B) pore pressure (kPa) in model cross-section.
5.3.1 Vrančea earthquake
For the case of seismic acceleration corresponding to the Vrančea earthquake (VE) in 1977, the procedure for determining the FoS was carried out using the shear strength reduction method (Rakić et al., 2023). As previously stated, the FoS was determined for two hypothetical scenarios: 1) with GT-1 unit, 2) when GT-1 does not exist, i.e., when GT-1=GT-2. The obtained FoS for two hypothetical scenarios under the impact of VE is 1.156 (with the assumed GT-1) and 1.812 (without GT-1).
In the case of VE, in both analyzed scenarios FoS greater than 1 was obtained, hence it can be concluded that during this earthquake there would be no loss of stability of the dam and the surrounding rock mass. By further reducing the shear strength of the material, there is a loss of stability due to the sliding of the surface soil mass on the right bank, downstream of the dam, as can be seen in Figure 9. Plastic strain develops on the right bank downstream of the dam.
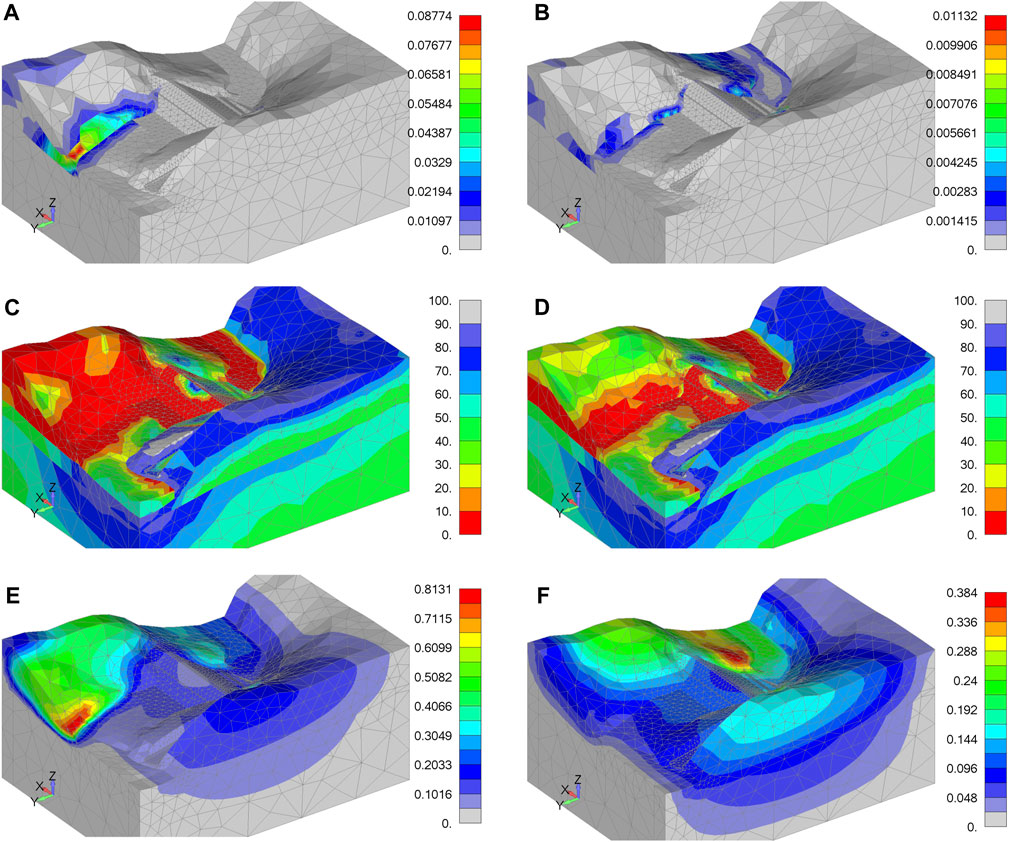
FIGURE 9. Results of dynamic analysis under the impact of VE: (A) equivalent plastic strain with GT-1 zone, (B) equivalent plastic strain when GT-1=GT-2; (C) remaining load-bearing capacity with GT1 zone, (D) remaining load-bearing capacity when GT-1=GT-2; (E) total translation with GT1 zone, (F) total translation when GT-1=GT-2.
In the case when GT-1 is assumed in the model, a slightly larger plastic strain was obtained, mainly in the GT-1 unit as shown in Figure 9A, while in the case when GT-1=GT-2 the plastic strain is significantly smaller (Figure 9B). Figures 9C,D show the remaining load-bearing capacity field. It can be concluded that the capacity reserve in the failure zone is completely consumed. From the total displacement field, it can be seen that there are significant displacements of a larger volume of the surface soil within the zone of the old landslide downstream of the dam (Figure 9E). In the case when GT-1=GT-2, the largest displacement occurs upstream of the dam (in the reservoir), but of much lower intensity (Figure 9F).
Based on the results of the quasi-static analysis of the dam stability exposed to the VE, it can be concluded that the loss of stability occurs along the old sliding surface (material GT-1), i.e., in the right bank downstream of the dam since maximum plastic strain develops within this volume. Also, in this zone, the remaining load-bearing capacity is completely used up, and the maximum displacements occur. Similar behavior of the model is also observed in the case when GT-1=GT=2, with slightly higher safety factors obtained.
In addition to the quasi-static analysis, an explicit dynamic analysis was carried out using the developed FE model. Since the explicit dynamic analysis has unconditional convergence, the displacement increment was used as the stability criterion (Figure 5). The field of plastic strain at the end of the earthquake is shown in Figure 10A. It can be seen that the field of plastic strain obtained by applying transient dynamic analysis corresponds to the field of plastic strain obtained by quasi-static analysis (place of occurrence of plastic strain), so it can be assumed that the FoS calculated by applying quasi-static analysis is appropriate in the assessment of stability.
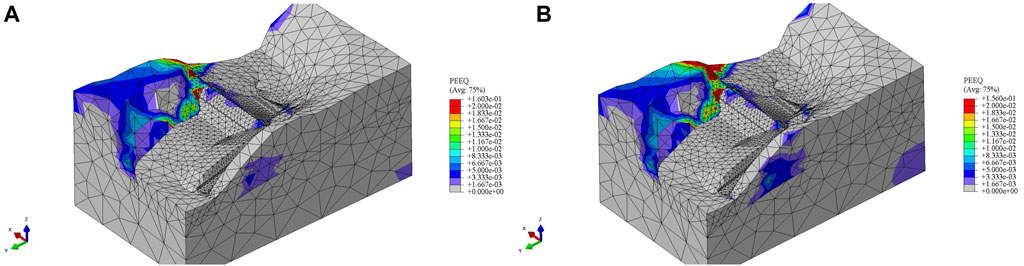
FIGURE 10. Equivalent plastic strain from explicit dynamic analysis under (A) Vrančea earthquake, (B) Kresna earthquake.
Figure 11A shows the following results of explicit dynamic analysis: total displacement of the point with the maximum displacement, dam crest displacement in the direction perpendicular to the dam axis, and displacement components of the point with the highest acceleration. Figure 11B shows the acceleration of the point with the highest acceleration amplification and the dam crest acceleration in the direction perpendicular to the dam axis.
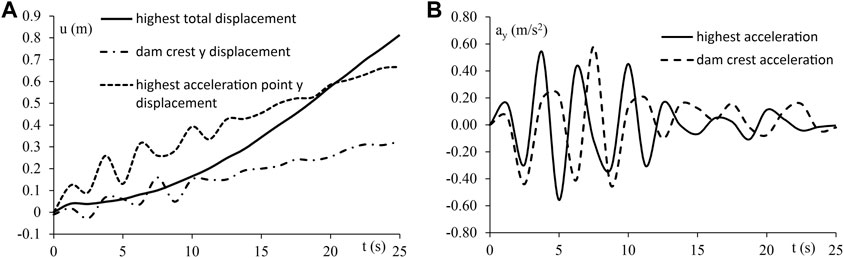
FIGURE 11. Results of explicit dynamic analysis - characteristic points of the model under the impact of the Vrančea earthquake: (A) displacements and (B) acceleration components.
One should note that all results are shown for the case when GT-1 is assumed in the model. Based on the displacement in the model shown in 11a, it could be concluded that there was no explicit increase in displacement increment during the earthquake, hence there was no loss of structural stability, which confirmed the results of the quasi-static analysis.
In the case of the impact of VE, the volume of soil on the right bank that would potentially lose stability, determined based on the volume of finite elements in which there is no remaining load-bearing capacity, amounts to approximately 5 x 10⁶ m3 of soil.
5.3.2 Kresna earthquake
The second case of stability analysis corresponds to the Kresna 1904 earthquake (KE), for whose impact the procedure for determining the safety factor using the SSR method was also carried out. As in the case of VE, two hypothetical scenarios were analyzed: 1) when GT-1 exists in the model and the case 2) when GT-1=GT-2. The obtained FoS for two hypothetical scenarios under the impact of KE is 0.593 (with the assumed GT-1) and 1.062 (with GT-1=GT-2). Hence, in the case of KE the obtained FoS is less than 1 when GT-1 is assumed in the model, which is supported by the fields shown in Figure 12. Since in the first analyzed case a FoS less than 1 was obtained, the displayed results correspond to the SRF at the moment of failure (SRF=FoS). The field of plastic strain is shown in Figures 12A,B. From the results shown, it can be seen that a large part of the rock mass volume on the right bank, downstream of the dam, exhibits a significant plastic strain, similar to the effect of VE. Figures 12C,D indicate that the remaining load-bearing capacity in this volume has been completely consumed, while according to Figures 12E,F, maximum displacements also occur on the right bank downstream of the dam. One should note that qualitatively similar behavior of the model occurs in both cases: when GT-1 is assumed in the model and when GT-1=GT-2.
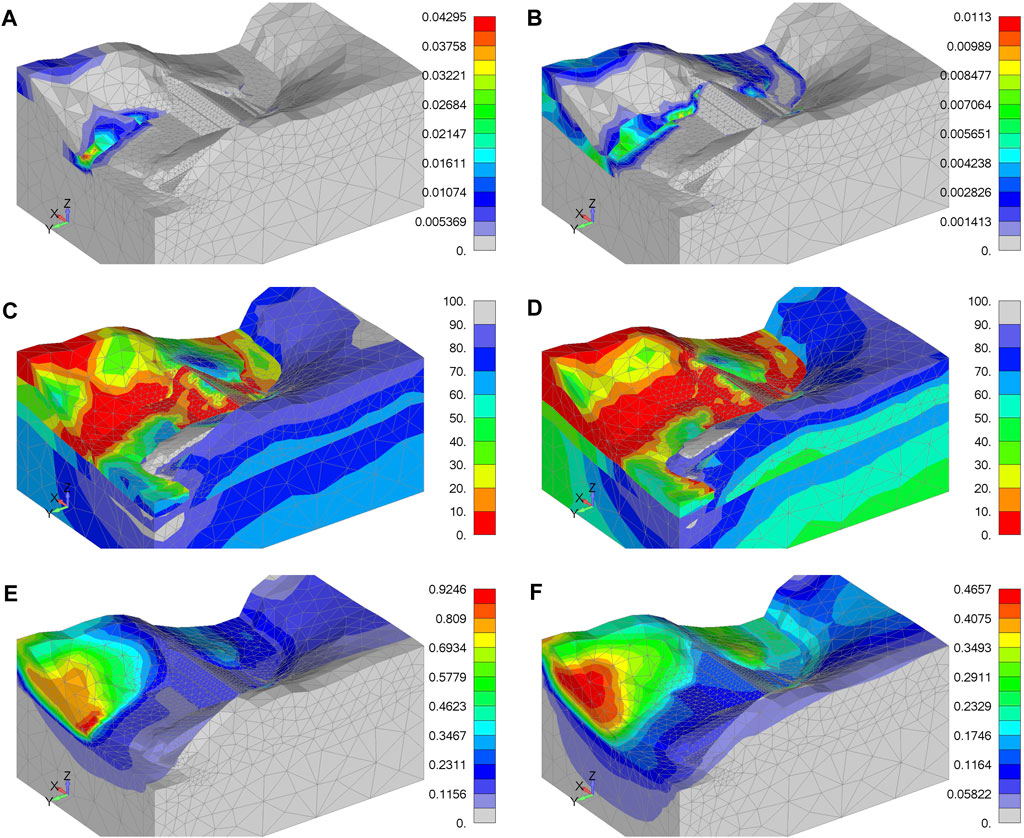
FIGURE 12. Effect of Kresna earthquake on the model: (A) equivalent plastic strain with GT1 zone assumed, (B) equivalent plastic strain for GT-1=GT-2; (C) remaining load-bearing capacity with GT-1 zone assumed, (D) remaining load-bearing capacity for GT-1=GT-2; (E) total translation with GT1 zone assumed, (F) total translation for GT-1=GT-2.
What should be particularly emphasized in this case is that the double impact of KE certainly leads to instability of the surrounding rock mass regarding the existence of the old sliding surface.
As in the case of VE impact, the transient dynamic analysis was also conducted for the effect of KE and the results are shown below. The field of plastic strain at the end of the impact of KE is shown in Figure 10B. It is clear that his field qualitatively corresponds to the field of plastic strain obtained by quasi-static analysis. Therefore, it is justified to assume that FoS determined by quasi-static analysis is appropriate in the stability assessment.
Figure 13A shows the total displacement of the point with the maximum displacement, dam crest displacement in the direction perpendicular to the dam axis, and displacement components of the point with the highest acceleration in the case of a single event of KE. Figure 13B shows the acceleration of the point with the highest acceleration amplification and the dam crest acceleration in the direction perpendicular to the dam axis.
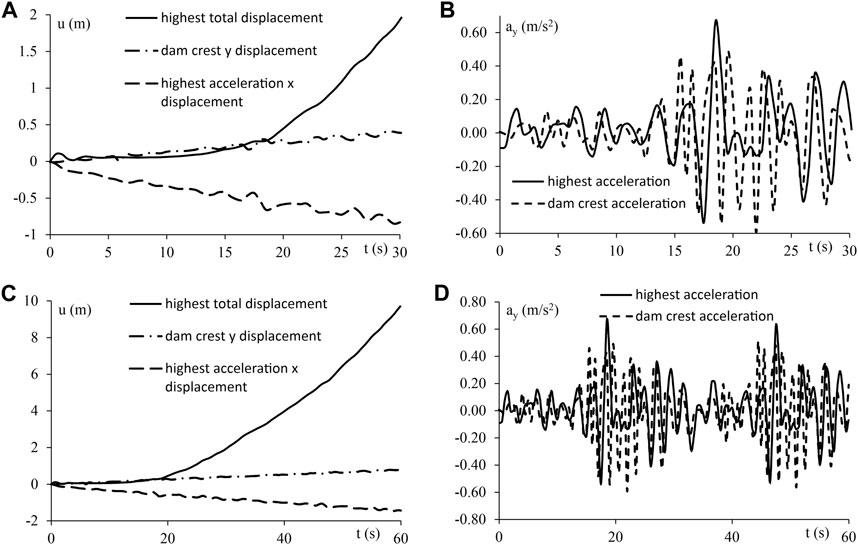
FIGURE 13. Results of explicit dynamic analysis - characteristic points of the model–the single impact of Kresna earthquake: (A) displacements and (B) acceleration; double impact of Kresna earthquake: (C) displacements and (D) accelerations.
Figure 13A shows that in 17 s of the simulation, there is a large increase in displacement, which corresponds to the time when the greatest acceleration amplification occurs, shown in Figure 13B. This significant increase in the displacement increment denotes the moment of stability loss, according to the previously adopted stability criterion, shown in Figure 5. All results are shown for the case when GT-1 is assumed in the model.
Results of direct dynamical analysis for the case of the double impact of KE are shown in Figures 13C, D. The displacement continues to increase after the first impact, where already in 17 s there was a loss of stability of the rock mass on the right bank (Figure 13C). It can also be observed that the displacement increment of the dam crest remains stable, which leads to the conclusion that the dam would remain safe in case of double impact of KE as well.
In the case of KE, the volume of the soil on the right bank that would potentially lose stability is determined based on the volume of finite elements in which there is no remaining load-bearing capacity, and it amounts to approximately 1.8 x 10⁶ m3.
One should note that the FoS of the dam body materials obtained by the SSR method is FoSdam=6.55, which is much higher than the FoS of the right bank. This means that the stability of the surrounding rock mass (specifically the right bank, downstream of the dam) would be lost rather than the stability of the dam.
5.4 Basis for decision-making phase
5.4.1 Dam reconstruction/monitoring
Identification of the “weak” zones within the dam body enables the generation of the so-called dam potential damage cross-sections, with a clear position of the critical areas (Figure 14). Based on the locations of the calculated deformation and its extent, one may further make reliable decisions and choose adequate reconstruction/monitoring measures. As can be seen in Figure 14A, the highest value of plastic strain under the effect of VE is reached in the lower right part of the dam, which coincides well with the location of the maximum translation. A qualitatively similar dam behavior is observed for the action of KE (Figure 14B), but with an obvious quantitative difference, indicating the dam is more sensitive to the effect of VE rather than KE. The reason for this lies in the fact that VE affects the dam in the y-direction, e.g., almost perpendicular to the dam axis, while KE acts in the x-direction, e.g., parallel to the dam axis. Regarding further activities, these “weak” spots of the dam in dynamic conditions could require subsequent investigation activities and the application of adequate reconstruction measures or monitoring activities.
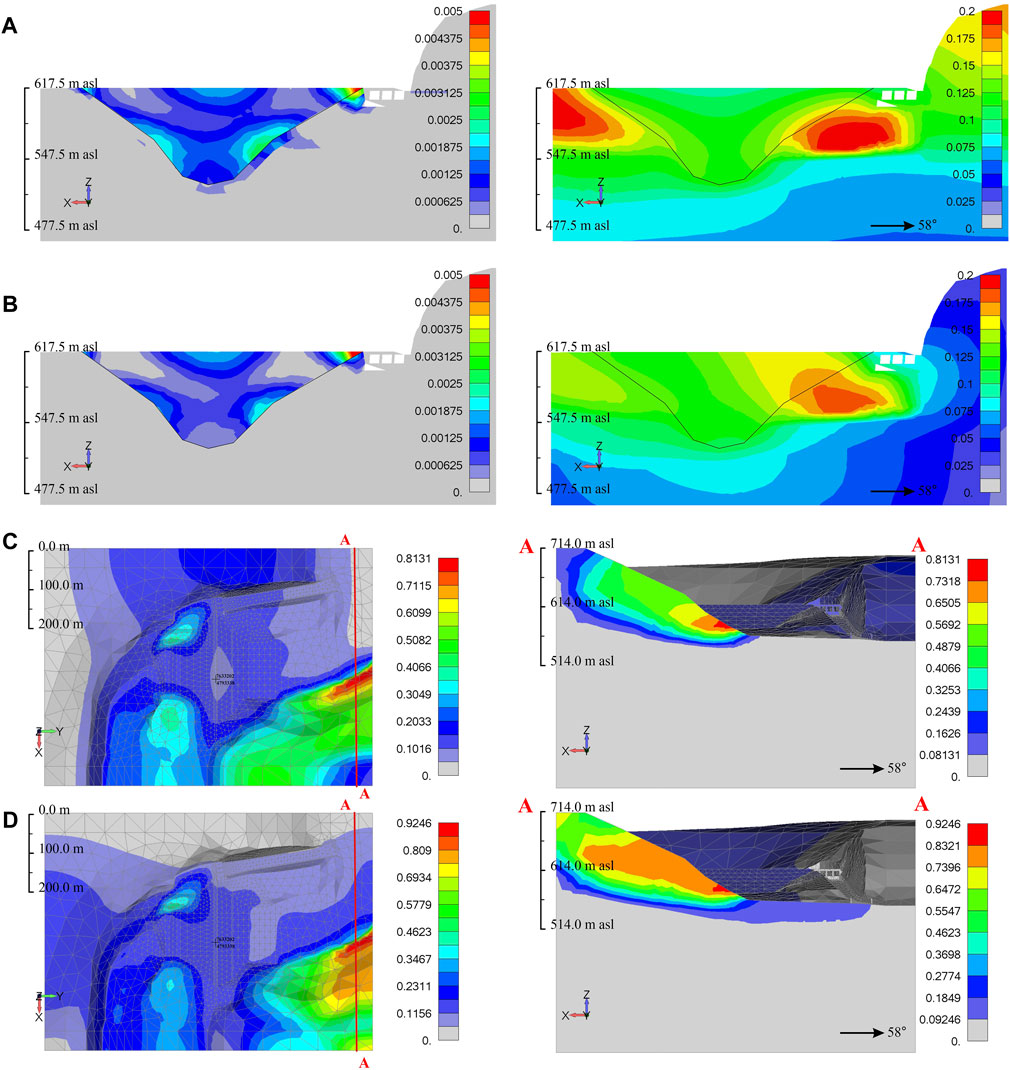
FIGURE 14. Dam potential damage cross-sections in dynamic conditions: (A) Vrančea earthquake—plastic strain and total translation; (B) Kresna earthquake—plastic strain and total translation. Landslide hazard map in dynamic conditions (total translation and corresponding cross-section): (C) Vrančea earthquake; (D) Kresna earthquake.
5.4.2 Monitoring of potentially unstable slopes
Based on the identified weak zones during the impact of the examined seismic events, one may generate a landslide hazard map and the corresponding cross-sections, for the specific cases, as shown in Figures 14C,D. In the general case, if the geological composition of the ground is known for the whole accumulation zone, and under the assumption that adequate geodetic data exists, such a landslide hazard map could be generated for specific seismic events for the whole accumulation zone. Moreover, based on the calculated volume and distances of the displaced material, one may further analyze the effect of the triggered landslides on the accumulation and possible generation of waves that may affect the stability of a dam.
5.5 Dam seismic response according to design earthquakes
Considering the fact that design guidelines for dam seismic analysis are constantly being modified and improved, one should also verify the seismic response of existing dams according to contemporary principles. For the sake of current analysis, following the recommendation by ICOLD (ICOLD), we analyzed the seismic response of the Zavoj dam for three design earthquakes: safety evaluation earthquake (SEE), operating basis earthquake (OBE), and maximum credible earthquake (MCE). Relevant return periods and PGA for these design earthquakes are the following:
- SEE, return period 200 years, I = 8° MSK-64, PGA=0.2 g.
- OBE, return period 1000 years, I = 8° MSK-64, PGA=0.2 g.
- MCE, return period 10000 years, I = 8° MSK-64, PGA=0.2 g.
Relevant PGA values are chosen according to the corresponding earthquake MSK-64 intensity for the relevant return period using the Seismological map of SFR Yugoslavia (Vukašinović, 1987).
For MCE we chose PGA for the return period of 10000 years since no active faults are identified in the relevant vicinity of Zavoj Dam.
Using the quasi-static stability analysis we calculated safety factors in the direction perpendicular to the axis of the dam (0.658) and in the direction parallel to the axis of the dam (0.435). In both cases, the loss of stability occurred along the old sliding surface on the right bank downstream from the dam, where maximum displacement values of about 2 m were obtained (Figure 15). The obtained displacement in the dam body is about 0.4 m, and the development of plastic strain occurs only in the clay core, so there is no loss of stability of the dam.
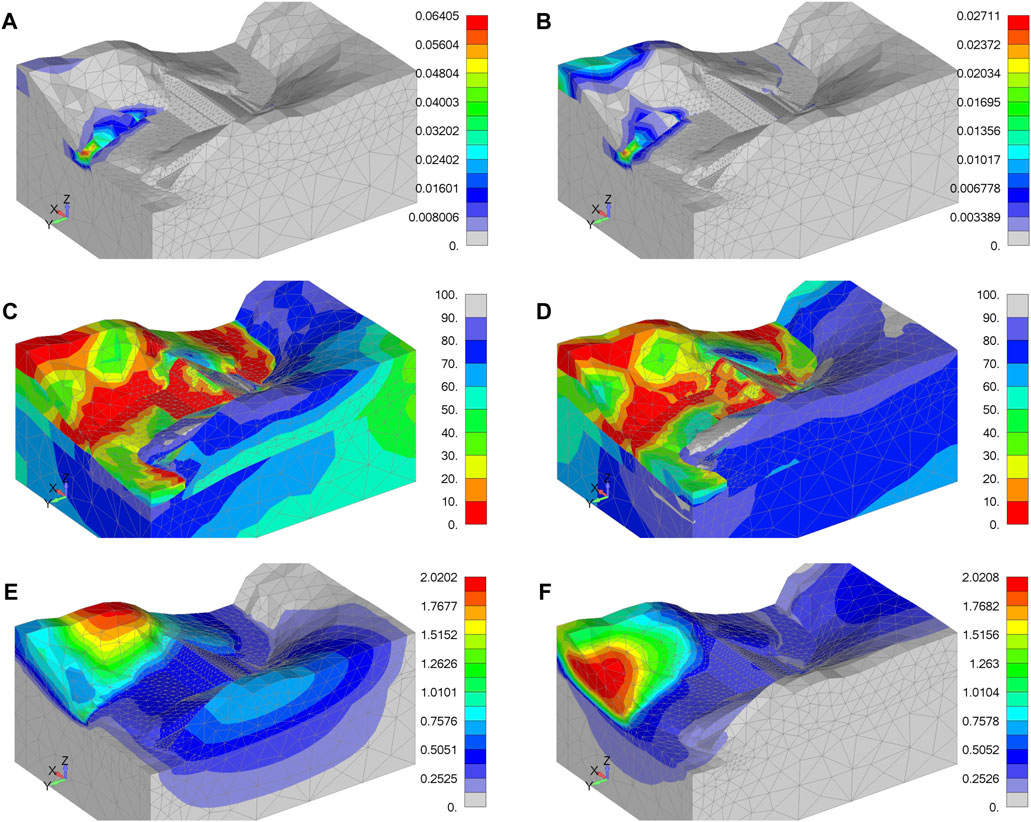
FIGURE 15. Effects of impact 0.2 g earthquake after the ICOLD recommendations–results of quasi-static approach: (A) impact in Y direction—equivalent plastic strain, (B) impact in X direction—equivalent plastic strain; (C) impact in Y direction—remaining load-bearing capacity, (D) impact in X direction—remaining load-bearing capacity; (E) impact in Y direction - total translation, (F) impact in X direction - total translation.
6 Discussion and conclusion
In the present paper, we propose a new conceptual approach for the dynamic analysis of existing embankment dams and their corresponding accumulation zones. This approach is defined through three main phases: 1) collection of data (geotechnical, seismological, and dam-related); 2) dynamic analysis (resulting in dam damage map and landslide hazard map); 3) decision-making phase (on dam reconstruction and accumulation zone monitoring). The main motivation for the performed research lies in the current inexistence of proper formal guidelines on the seismic design of new dams and existing ones in Serbia. Since Eurocode EC-8 requirements have become obligatory in Serbia since 2020, according to which seismic regulations for dams are left for national annexes to deal with, we believe this paper could provide a solid base for the definition of adequate national annex for seismic design of new and existing dams.
This concept is verified for the case study of the existing embankment dam “Zavoj” in eastern Serbia. The dam was built near the location in the river bed that was covered by the displaced material of a large landslide that was triggered in 1963. Concerning this, there is an existing old sliding surface near the right bank of the dam. Moreover, previous investigations have shown that the accumulation zone is susceptible to (re)activation of landslide activity. From the seismological viewpoint, the results of the performed research indicated the following. There are no seismically active faults within the dam location and accumulation nor in the wider area. Therefore, one could not expect the occurrence of seismogenic faults at the ground surface, and direct deformation of ground surface due to fault movement. The seismic impact on the dam location reveals itself in shaking. Two relevant epicentral zones from the dam location and accumulation are singled out: (a) Vrancea epicentral zone, which is approximately 450 km from the dam location, and (b) Kresna epicentral zone, which is approximately 170 km distant from the dam location. Unexpected seismic impact comes from the Kresna epicentral zone, where two close earthquakes with approximately the same high magnitude were recorded in 1904. Such an event is of uttermost influence on the dam’s stability since the state of the dam after the first impact determines its resistance to another impact. For the Vrancea epicentral zone, a relevant acceleration time series was chosen according to the real recording of the 1977 M7 Vrancea earthquake at station Niš, which is approximately 50 km from the dam location. For the Kresna epicentral zone, relevant acceleration time series was chosen from the existing database CESMD, for the El Mayor-Cucapah M7 earthquake, using hypocentral depth, distance, duration, and PGA in the horizontal plane as search parameters.
Based on the conducted quasi-static and transient dynamic analyses of the stability of the dam and the surrounding rock mass exposed to the action of two representative earthquakes, an assessment of the structure’s stability was made. The results of both analyses show that in the event of the Vrančea earthquake, the structure is stable, that is, there will be no loss of stability of the rock mass at the dam site, as indicated by the safety factors greater than 1 (obtained by the quasi-static analysis) and by the stable growth of the increment of the maximum displacement. (obtained by direct dynamical analysis). However, in the case of the Kresna earthquake, the quasi-static analysis resulted in smaller safety factors, even values less than 1 when the existence of an old sliding surface is assumed in the model. In case no old sliding surface is assumed in the model, a single impact of the Kresna earthquake results in the small FoS (near 1), which indicates that the model will become unstable under the impact of the second Kresna seismic event. Such conclusions are also supported by the result of a transient dynamic analysis, which showed that in the case of the Kresna earthquake, the increment of the maximum displacement begins to grow exponentially, which is a sign that instability has occurred in the structure.
What should be emphasized is the following. In the case of the Vrančea earthquake, loss of stability on the right bank occurs only if the old sliding surface is assumed to exist in the model. On the other hand, the effect of the Kresna earthquake is independent of this assumption, i.e., the loss of stability definitely occurs in the model even if no old sliding surface is assumed. One should note that the dam body remains stable under the effect of either of the examined earthquakes.
Based on the results of the performed analysis, we created a dam potential damage cross-section and a landslide hazard map in dynamic conditions, under the impact of both examined seismic events. This information could be further used for making adequate decisions on the proper choice of reconstruction measures and the type and location of monitoring equipment within the dam and accumulation zone, as well.
In a sense of the broader applicability of the approach presented in this paper, the proposed guidelines could be further used as a directive for defining official national rules in the area of seismic design, particularly for the verification of the safety of the existing embankment dams. It should be noted that if adequate geodetic and geological documentation exists, these guidelines could serve to assess the stability of not only the dam itself and its immediate surroundings, but the whole accumulation zone. Also, one may further use the proposed criterion for determining the remaining load-bearing capacity of each point of the structure. Additionally, the concept of the landslide hazard map in dynamic conditions and dam potential damage cross-sections could be further used for applying adequate remediation design or monitoring activities.
We consider that the presented approach is innovative from the aspect of the current state of regulations in the Republic of Serbia, At the same time, the proposed approach respects the previous experience in engineering practice, especially regarding the use of domestic PAK software for 3D FEM modeling, which was previously created at the Faculty of Engineering. PAK software represents an open-source solution based on the finite-element method, so it is possible to modify and upgrade it according to the requirements of the analysis. Additionally, the remaining bearing capacity criterion is for the first time applied for the analysis of the geologically heterogeneous model with the existing sliding surface.
The main contributions of the proposed approach are the following:
- A 3D model of the embankment dam and its surroundings (including the possibility of modeling the whole accumulation zone) enables not only the adequate assessment of the seismic response of a dam but also the rock mass in the surrounding area, which could be used for further assessment of the influence of the possible instabilities both on the accumulation and dam;
- Explicit dynamic analysis enables the determination of the time dependence of displacement at each model point and a numerical simulation of a double earthquake impact, which is not possible using the traditional quasi-static approach.
- The application of the vector representing the field of the remaining load-bearing capacity of each point of the structure shows that due to the reduction of the remaining bearing capacity, there may be a potential loss of stability of the rock mass in a wider zone compared to the extent of the field of plastic strain.
- The possibility of generation of landslide hazard maps in dynamic conditions and potential dam damage cross-sections enables the adequate design of proper remediation measures and/or monitoring activities.
The main limitations of the proposed approach are the following:
- There is no possibility to analyze the post-failure behavior of the seismically triggered instabilities, which is crucial for further analysis of their effect on the accumulation and dam. Therefore, some new techniques need to be involved for this purpose, such as smooth-particle hydrodynamics, as it is successfully being used in the analysis of landslide-generated waves in existing accumulations (Bu et al., 2022).
- Rather long computational time is required for numerical simulation (explicit dynamic analysis) due to the necessity of applying a small time increment.
- To avoid the influence of the boundary conditions during direct dynamic analysis, it is necessary that the boundaries of the model are moved far enough from the part of the structure that is the subject of the analysis. In this way, the dimensions of the model (the number of finite elements and nodes) are increased, and therefore the time required to carry out the numerical simulation is increased.
The results of the performed research imply the following:
- Explicit dynamic analysis is superior to the quasi-static approach when two succeeding earthquakes occur and when temporal evolution of displacements of different points in the model is required.
- 3D seismic analysis of existing embankment dam is required, i.e., the stability of the surrounding rock mass cannot be analyzed as a plain strain or plain stress state since three-dimensional effects occur due to the irregular geometry of the terrain.
- Adequate geotechnical characterization of the surrounding rock mass is required since the existence of weak geotechnical units in the surrounding rock mass could lead to the occurrence of instabilities even in the case of low ground acceleration.
- By introducing the remaining load-bearing capacity vector in the heterogeneous geological model with an old sliding surface, a clear overview of the remaining load capacity of the structure is obtained, so one can easily and reliably determine the potentially unstable parts of the structure, which are wider than the extent of the old sliding surface and the zone indicated by the field of plastic strain.
Although some previous studies indicated that 3D seismic stability of rockfill dams is required only in case of strong ground acceleration (more than 0.33 g), as suggested by Uddin (Uddin, 1999), in the present research we showed that even for low ground acceleration (0.05 g for Vrančea earthquake and 0.07 g for Kresna earthquake) 3D seismic stability is necessary due to irregular geometry of the terrain, which implies that valid seismic analysis could not be considered in a plain stran state of the model. The recommendation of Uddin (Uddin, 1999) may be valid for the dam itself without the surrounding rock mass, in which case a plane strain condition can be applied.
The proposed framework could be further evaluated by comparing its results with the result of the application of some other existing methods, using for instance the USACE approach. In case enough input data about the relevant earthquake exists, one may apply some of the latest NGA models. Also, further work should include methods that enable evaluation of the post-failure behavior of the dam and its surroundings, such as SPH methods or similar.
Data availability statement
The original contributions presented in the study are included in the article/Supplementary Material, further inquiries can be directed to the corresponding author.
Author contributions
SK: Conceptualization, Writing–original draft. DR: Formal Analysis, Writing–original draft. AB: Formal Analysis, Writing–original draft. SN: Formal Analysis, Writing–original draft. NM: Project administration, Writing–original draft.
Funding
The author(s) declare(s) that no financial support was received for the research, authorship, and/or publication of this article.
Acknowledgments
This research was done in memory of the late Prof. Duško Sunarić, whose contribution to the development of engineering seismology in Serbia is unmeasurable.
Conflict of interest
The authors declare that the research was conducted in the absence of any commercial or financial relationships that could be construed as a potential conflict of interest.
Publisher’s note
All claims expressed in this article are solely those of the authors and do not necessarily represent those of their affiliated organizations, or those of the publisher, the editors and the reviewers. Any product that may be evaluated in this article, or claim that may be made by its manufacturer, is not guaranteed or endorsed by the publisher.
Supplementary material
The Supplementary Material for this article can be found online at: https://www.frontiersin.org/articles/10.3389/feart.2024.1358928/full#supplementary-material
Footnotes
1One should know that after the Kopanik earthquake in 1980 only weak earthquakes were recorded in Serbia: the Mionica M5.7 earthquake in 1998 and the Kraljevo M5.4 earthquake in 2010. However, data received from these earthquakes did not have any effect on the previously defined maps in 1987, confirming their validity for estimating the seismological conditions in Serbia.
References
Abrahamson, N. A., and Silva, W. J. (2008). Summary of the Abrahamson & Silva NGA ground-motion relations. Earthq. Spectra 24 (1), 67–97. doi:10.1193/1.2924360
Abrahamson, N. A., Silva, W. J., and Kamai, R. (2013). Update of the AS08 ground-motion prediction equations based on the NGA-west2 data set. PEER report 2013/04 pacific earthquake engineering research center headquarters. Berkeley: University of California.
Alavi, N., Moghadam, A. S., Rostami, A., and Asghari, N. (2020). Seismic finite element analysis of nonhomogeneous embankment located in asymmetric valley. Innov. Infrastruct. Solutions 5, 107. doi:10.1007/s41062-020-00333-8
Ambraseys, N. N. (2001). The Kresna earthquake of 1904 in Bulgaria. Ann. Geofis. 44 (1), 95–117. doi:10.4401/ag-3614
Aptikaev, F. F. (2012). Instrumental scale of seismic intensity. Moscow: Science and Education, 176. (in Russian).
Azarafza, M., Ghazifard, A., and Kaljahi-Asghari, E. (2019). Earthquake hazard assessment in Assalouyeh area based on NGA seismicity model. J. Nat. Environ. Hazards 07 (18), 131–147. doi:10.22111/jneh.2017.20336.1258
Boore, D. M., and Atkinson, G. M. (2008). Ground-Motion prediction equations for the average horizontal component of PGA, PGV, and 5%-damped PSA at spectral periods between 0.01sand 10.0s. Earthq. Spectra 24 (1), 99–138. doi:10.1193/1.2830434
Boore, D. M., Stewart, J. P., Seyhan, E., and Atkinson, G. M. (2013). “NGA-West2 equations for predicting response spectral accelerations for shallow crustal earthquakes,” in PEER report 2013/05 pacific earthquake engineering research center headquarters. Berkeley: University of California.
Borcherdt, R. D. (2014). Implications of next generation attenuation ground motion prediction equations for site coefficients used in earthquake resistant design. Earthq. Engng Struct. Dyn. 43, 1343–1360. doi:10.1002/eqe.2400
Bu, S., Li, D., Chen, S., Xiao, C., and Li, Y. (2022). Numerical simulation of landslide-generated waves using a SPH-DEM coupling model. Ocean. Eng. 258, 111826. doi:10.1016/j.oceaneng.2022.111826
Campbell, K. W., and Bozorgnia, Y. (2008). NGA ground motion model for the geometric mean horizontal component of PGA, PGV, PGD and 5 % damped linear elastic response spectra for periods ranging from 0.01 to 10 s. Earthq. Spectra 24 (1), 139–171. doi:10.1193/1.2857546
Campbell, K. W., and Bozorgnia, Y. (2013). “NGA-West2 campbell-bozorgnia ground motion model for the horizontal components of PGA, PGV, and 5%-damped elastic pseudo-acceleration response spectra for periods ranging from 0.01 to 10 sec,” in PEER report 2013/06 pacific earthquake engineering research center headquarters. Berkeley: University of California.
Center for Engineering Strong-Motion Data (CESMD) (2022). Center for engineering strong-motion data (CESMD). Available at: https://www.strongmotioncenter.org/.
Chiou, B. S. J., and Youngs, R. R. (2008). An NGA model for the average horizontal component of peak ground motion and response spectra. Earthq. Spectra 24 (1), 173–215. doi:10.1193/1.2894832
Chiou, B.S.-J., and Youngs, R. R. (2013). “Update of the Chiou and Youngs NGA ground motion model for average horizontal component of peak ground motion and response spectra,” in PEER report 2013/07 pacific earthquake engineering research center headquarters (Berkeley: University of California).
Cvetković-Mrkić, S. (1995). Methods of geotechnical meliorative measures. Belgrade: University of Belgrade Faculty of Mining and Geology. (in Serbian).
Douglas, J., and Aochi, H. (2008). A survey of techniques for predicting earthquake ground motions for engineering purposes. Surv. Geophys 29, 187–220. doi:10.1007/s10712-008-9046-y
Еврокод 8. Проектиране на конструкциите за сеизмични въздействия. Част 1: Общи правила, сеизмични въздействия и правила за сгради. Национално приложение. Български институт за стандартизация, 2012.
Elgamal, A. W. (1992). Three dimensional seismic analysis of La Villita Dam. J. Geotech. Eng. Div. ASCE 118 (12), 1937–1958. doi:10.1061/(asce)0733-9410(1992)118:12(1937)
Gojgić, D., Janjić, M., and Luković, S. (1965). “Engineering-geological conditions for the occurrence of landslides, natural dams, and Lake Zavoj,” in Proceedings of the Institute for geological and geophysical research, Belgrade–173. (in Serbian).
Gonzalez-Ortega, A., Fialko, Y., Sandwell, D., Nava-Pichardo, A., Fletcher, J., Gonzalez-Garcia, J., et al. (2014). El Mayor-Cucapah (Mw7.2) earthquake: early near-field postseismic deformation from InSAR and GPS observations: El mayor-cucapah postseismic deformation. J. Geophys Res. Solid Earth 119, 1482–1497. doi:10.1002/2013jb010193
Gregor, N., Addo, K., Abrahamson, N. A., Linda, A. A., Atkinson, G. M., Boore, D. M., et al. (2022). Comparisons of the NGA-Subduction ground motion models. Earthq. Spectra 38, 2580–2610. doi:10.1177/87552930221112688
Hoek, E., and Diederichs, M. S. (2006). Empirical estimation of rock mass modulus. Int. J. Rock Mech. Min. Sci. 43, 203–215. doi:10.1016/j.ijrmms.2005.06.005
Jaroslav Černi Water Institute (1992). Study on water bearability of rock massive along the trace of supply tunnel during tunnel exploitation. Internal report, 86. (in Serbian).
Jaroslav Černi Water Institute (1995). State of the slope stability within the accumulation ''Zavoj. Belgrade: Internal report. (in Serbian).
Jaroslav Černi Water Institute (2020). Innovative Project of technical monitoring of the dam “Zavoj. Belgrade, Serbia: Jaroslav Černi Water Institute. (in Serbian).
Kojić, M., Slavković, R., Živković, M., and Grujović, N. (1999). PAK-finite element program for linear and nonlinear structural analysis and heat transfer. Kragujevac, Serbia: University of Kragujevac, Faculty of Mechanical Engineering.
Kostić, S., Vasović, N., Perc, M., Toljić, M., and Nikolić, D. (2013). Stochastic nature of earthquake ground motion. Phys. A 392 (18), 4134–4145. doi:10.1016/j.physa.2013.04.045
Kovačević, S. (2000). Ground seismodeformations during strong earthquakes in Serbia. Belgrade: University of Belgrade Faculty of Mining and Geology, magister paper, 128. (in Serbian).
Liu, X., Congress, S. S. C., Shen, J., Cai, G., and Chen, G. (2024). A simple site amplification model originating from the NGA project for deep soft soil deposits in Suzhou, China. Nat. Hazards 120, 107–129. doi:10.1007/s11069-023-06178-5
Mejia, L. H., and Seed, H. B. (1983). Comparison of 2-D and 3-D dynamic analyses of earth dams. J. Geotech. Eng. Div. ASCE 109 (11), 1383–1398. doi:10.1061/(asce)0733-9410(1983)109:11(1383)
Mihailović, J. (1906). Earthquake in Serbia in 1904: critical review with particular analysis of the earthquake on 2nd April. Issue Serbian R. Acad. Sci. Arts 43, 167. (in Serbian).
Mihailović, J., and Nedeljković, R. (1950). Seismological map of Yugoslavia. Belgrade: Seismological Service of Serbia. (in Serbian).
Official Gazette of SFRY, 31/81. (2024). Guidelines on regulations for building structures in seismic areas. (in Serbian).
Pantea, A., and Constantin, A. P. (2013). Re-evaluation of the macroseismic effects produced by the March 4, 1977, strong Vrancea earthquake in Romanian territory. Ann. Geophys. 56 (1), R0104. doi:10.4401/ag-5641
Rakić, D., Dunić, V., Živković, M., Radovanović, S., Divac, D., and Šumarac, D. (2023). Strength reduction method for a factor of safety determination of damaged concrete structures. Int. J. Dam Mech. 32, 1125–1143. doi:10.1177/10567895231183469
Rakić, D., Stojković, M., Ivetić, D., Živković, M., and Milivojević, N. (2022). Failure assessment of embankment dam elements: case study of the Pirot reservoir system. Appl. Sci. 12, 558. doi:10.3390/app12020558
Scordilis, E. M. (2006). Empirical global relations converting M S and m b to moment magnitude. J. Seismol. 10, 225–236. doi:10.1007/s10950-006-9012-4
Uddin, N. (1999). A dynamic analysis procedure for concrete-faced rock fill dams subjected to strong seismic excitation. Comput. Struct. 72 (1), 409–421. doi:10.1016/s0045-7949(99)00011-5
Verčon, M. (1971). Dams in Yugoslavia. Yugoslav committee on large dams on the occasion of the 39th executive meeting of ICOLD in dubrovnik.
Vukašinović, M. (1970). Technical documentation for the development of a map of the seismic regionalization of Serbia. internal report. Belgrade: Seismological Service of Serbia. (in Serbian).
Vukašinović, M. (1973). Map of seismic regionalization of SR Serbia with an overview of the earthquake protective measures. Belgrade: Seismological Service of Serbia. (in Serbian).
Vukašinović, M. (1982). Temporary seismological map of Yugoslavia – Serbia. Belgrade: Seismological service of SR Serbia. (in Serbian).
Vukašinović, M. (1987). Seismological map of SFR Yugoslavia – part for Serbia. Belgrade: Society for Seismology. (in Serbian).
Wieland, M.Earthquake safety of existing dams (2006). First European conference on earthquake engineering and seismology (a joint event of the 13th ECEE & 30th general assembly of the ESC) Geneva, Switzerland. Paper Number: Keynote Address K10.
Keywords: embankment dam, landslide, earthquake, 3D dynamic analysis, remaining bearing capacity
Citation: Kostić S, Rakić D, Bodić A, Nedeljković S and Milivojević N (2024) Dynamic response of existing embankment dams in specific geotechnical and seismological conditions: contemporary framework for Serbian national guidelines. Front. Earth Sci. 12:1358928. doi: 10.3389/feart.2024.1358928
Received: 20 December 2023; Accepted: 30 January 2024;
Published: 21 February 2024.
Edited by:
Hans-Balder Havenith, University of Liège, BelgiumReviewed by:
Milan Stojkovic, Institute for Artificial Intelligence R&D Serbia, SerbiaMohammad Azarafza, University of Tabriz, Iran
Copyright © 2024 Kostić, Rakić, Bodić, Nedeljković and Milivojević. This is an open-access article distributed under the terms of the Creative Commons Attribution License (CC BY). The use, distribution or reproduction in other forums is permitted, provided the original author(s) and the copyright owner(s) are credited and that the original publication in this journal is cited, in accordance with accepted academic practice. No use, distribution or reproduction is permitted which does not comply with these terms.
*Correspondence: Srđan Kostić, srdjan.kostic@jcerni.rs, srdjan.kostic@uns.ac.rs