Landslide susceptibility assessment using statistical and machine learning techniques: A case study in the upper reaches of the Minjiang River, southwestern China
 Sixiang Ling1
  Siyuan Zhao
- 1Faculty of Geosciences and Environmental Engineering, Southwest Jiaotong University, Chengdu, China
- 2State Key Laboratory of Hydraulics and Mountain River Engineering, College of Water Resources and Hydropower, Sichuan University, Chengdu, China
- 3Sichuan Transportation Construction Group Co Ltd, Chengdu, China
Landslides have frequently occurred in deeply incised valleys in the upper reaches of the Minjiang River. Long-term interactions between rock uplift and river undercutting developed widely distributed landslides in this catchment, which recorded the typical tectonic geomorphology in the eastern margin of the Tibetan Plateau. In this study, we examined the landslides in the Minjiang catchment and aimed to compare the prediction ability of the statistical and machine learning (ML) models in landslide susceptibility assessment. We adopted the statistical models of the frequency ratio (FR) and information value (IV) models, and the ML models represented by a logistic model tree (LMT) and radial basis function classifier (RBFC) for landslide prediction. An inventory map of 668 landslides was compiled, and the landslides were randomly divided into training (80%) and validation (20%) datasets. Furthermore, 11 control factors of landslides based on topography, geology, hydrology, and other environments were applied for the analysis. The comprehensive performance of the four models was validated and compared using accuracy and area under the receiver operating characteristic curve (AUC). The results indicated that both sides of the valley along the Mingjiang and Heishuihe Rivers are in the high and very high susceptibility zones; in particular, the river segment from Wenchuan to Maoxian County has the highest susceptibility. The AUC values of the FR, IV, LMT, and RBFC models with the training data were 0.842, 0.862, 0.898, and 0.894, respectively, while the validation dataset illustrated the highest AUC value of 0.879 in the LMT model, followed by the RBFC (0.871), IV (0.869), and FR (0.839) models. Moreover, the LMT and RBFC models had higher accuracy values than the FR and IV models. This suggests that the ML models are superior to the statistical models in generating adequate landslide susceptibility maps, and the LMT model is the most efficient one for landslide prediction in the study region. This study provides a typical case in a landslide-prone region in the plateau margin to advance the understanding of landslide susceptibility assessment.
1 Introduction
Landslides commonly occur in mountainous terrains and pose a serious threat to the safety of local residents and ecological environments (Hungr et al., 2014; Huang et al., 2020). The southeastern and eastern margins of the Tibetan Plateau are characterized by intense tectonic activity and strong landscape evolution, where landslides frequently occur (Ouimet et al., 2007; Zhao et al., 2019; Ling et al., 2021; Cui et al., 2022; Zhao et al., 2022). In particular, the upstream area of the Minjiang River in the eastern plateau is a transition zone between the Sichuan Basin and Tibetan Plateau, and an increasing number of landslides have been induced in recent years (Dai et al., 2011; Fan et al., 2012; Hong et al., 2017; Fan et al., 2018; Zhao et al., 2018; Ling and Chigira, 2020; Cui et al., 2021). Therefore, it is essential to produce a reliable landslide susceptibility map for predicting and managing disasters in such a landslide-prone region (Saha et al., 2021).
With the technical advances in geographic information systems (GIS) and remote sensing, the statistical and machine learning (ML) models for landslide prediction are widely used to reveal the correlations between landslide development and causative factors (Pham et al., 2017; Pourghasemi and Rahmati 2018; Hong et al., 2019; Tanyu et al., 2021). Different models have their particular qualities and drawbacks, and the performance of each model varies according to the input data, model structure, and accuracy (Nachappa et al., 2020). The statistical models basically require a large amount of basic data to produce reliable results (Chen et al., 2018), while the ML models handle complex nonlinear data; however, the black-box property quantitatively enables us to reveal the statistical regularity among variables, which is helpful for analyzing the impact of the external environment on landslides (Tang et al., 2020). It has been proposed that ML techniques have a higher predictive capacity than conventional statistical models (Yilmaz 2009; Chen et al., 2016; Aditian et al., 2018; Jiao et al., 2019). Huang et al. (2020) studied the prediction performances of eight models on landslide susceptibility, which demonstrated that the ML models have a higher accuracy of the area under the receiver operating characteristic curve (AUC) than the general statistical and heuristic models. Yilmaz (2009) illustrated comparison of the frequency ratio (FR), logistic regression (LR), and artificial neural network (ANN) methods applied to landslide susceptibility in northern Turkey, reporting that the ANN models perform with better prediction accuracy. Poudyal et al. (2010) suggested that the FR model outperformed the ANN model in regard to landslide susceptibility assessment in the Nepal Himalayas. It is necessary to note that no consensus has been reached on the most suitable and efficient technique for every single region, and the prediction ability of the model largely depends on the available data and local geo-environmental conditions (Huang et al., 2022). Thus, it is crucial to compare different models to achieve reliable landslide susceptibility results in a specific region for local disaster prevention.
Landslides developed in the upper reaches of the Minjiang River have caused serious threats to local residents. In these regions, previous studies applied the ML or statistical methods to study the susceptibility of the landslides that occurred during and after the Wenchuan earthquake (Xu et al., 2013a; Xu et al., 2013b; Li H et al., 2022). Few studies have been carried out on the comparative analysis of two major model types focusing on landslides in the Minjiang catchment, which can offer more slope failure samples to improve the performance of landslide susceptibility prediction. Moreover, two representative statistical models, FR and IV, and two representative ML models, logistic model tree (LMT) and radial basis function classifier (RBFC), have not been comparatively studied in regard to landslide susceptibility in this high-relief region. Hence, this study aimed to 1) identify and interpret landslides and compile a landslide inventory for the upstream of the Minjiang River, 2) compare the performance of the statistical and ML methods to choose the most appropriate model for landslide susceptibility, and 3) generate accurate and reliable landslide susceptibility maps and validate the results using the AUC and statistical indicators. This study offers a good case for exploring the high efficiency and accuracy of landslide susceptibility assessment in high-relief mountainous terrains.
2 Data sources
2.1 Study area
The upper reaches of the Minjiang River are situated in Sichuan Province, China, within 31°21′–33°90′ N latitude and 102°35′–103°57′ E longitude (Figure 1A), covering a total area of 14,210.64 km2. The elevations in the study area range from 1,336 to 5,474 m asl from southeast to northwest (Figure 1B). The Minjiang River is located on the eastern margin of the Tibetan Plateau with active tectonics. The main active faults in the area include the Xueshan fault (F1), Minjiang fault (F2), Songpinggou fault (F3), and Longmenshan fault (Yingxiu–Beichuan (F4) and Maoxian–Wenchuan faults (F5)), all of which are seismogenic faults. The region has diverse lithologies, and sedimentary, metamorphic, and volcanic rocks are distributed in the study area. The rock strata are mainly composed of Mesoproterozoic to Cenozoic strata, while Cretaceous, Jurassic, and Ordovician strata are absent in the study area. The catchment has a plateau monsoon climate with an average temperature of ∼9.7°C and annual rainfall of ∼609 mm/year.
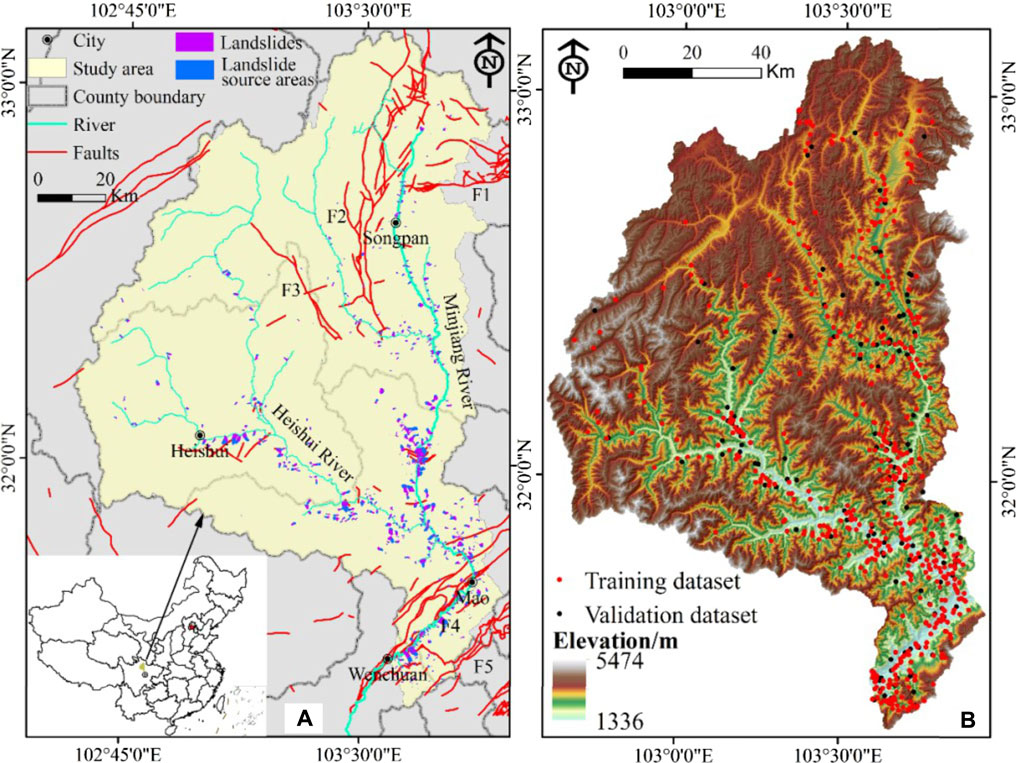
FIGURE 1. Geography map of the study area. (A) The location of the study area. (B) Topography and landslide inventory of the Minjiang catchment. F1: Xueshan faults, F2: Minjiang faults, F3: Songpinggou faults, F4: Yingxiu-Beichuan faults, F5: Maoxian-Wenchuan faults.
2.2 Landslide inventory
Landslide inventory is an essential input data for landslide modeling because accurate landslide locations can obtain rich environmental conditions, which is conducive to clarifying the relationships between the conditioning factors and landslide occurrences (Dou et al., 2020). A landslide inventory map was prepared using historical records and interpretations of satellite images. Landslides can be detected from high-resolution satellite imagery (e.g., postdisaster aerial photographs) according to geomorphological features (e.g., rock exposure and vegetation damage). Afterward, field investigations were carried out to verify the interpreted results. The landslides were identified as the headscarf, tension cracks, grab ends, undrained depressions, bulges, and lobes (e.g., Van Den Eeckhaut et al., 2011; Pánek et al., 2019). The small landslides less than 0.001 km2 were not included in the landslide inventory. Landslides in the study area were categorized as shallow landslides, deep-seated landslides, and rock avalanches based on the classification proposed by Hungr et al. (2014) (Figure 2). Finally, a total of 668 landslides were identified in the study area. The total landslide area was 303.73 km2, and the sizes of landslides varied from 1853 m2 to 8.49 km2. The selection of landslide pixels can affect the effectiveness of landslide susceptibility modeling, and the centroid method is a common landslide-positioning technique used to convert a polygon into a single point (Pourghasemi et al., 2020). In this study, the centroid of the landslide source area was pointed to represent the entire landslide body. The same number of nonlandslide points (n = 668) was randomly selected in the landslide-free areas. From the training and validation datasets ratio, previous research studies considered that the higher training data would increase the accuracy of the training model and test data (Tsangaratos and Ilia, 2016; Shirzadi et al., 2019; Huang et al., 2021; Li et al., 2021), indicating that the optimum ratios of training and validation datasets ranged from 70:30 to 80:20. Given that the increase in training data can improve the testing accuracy, both landslide and nonlandslide points were randomly divided into training and validation datasets at a ratio of 80:20 in the upper reaches of the Minjing River.
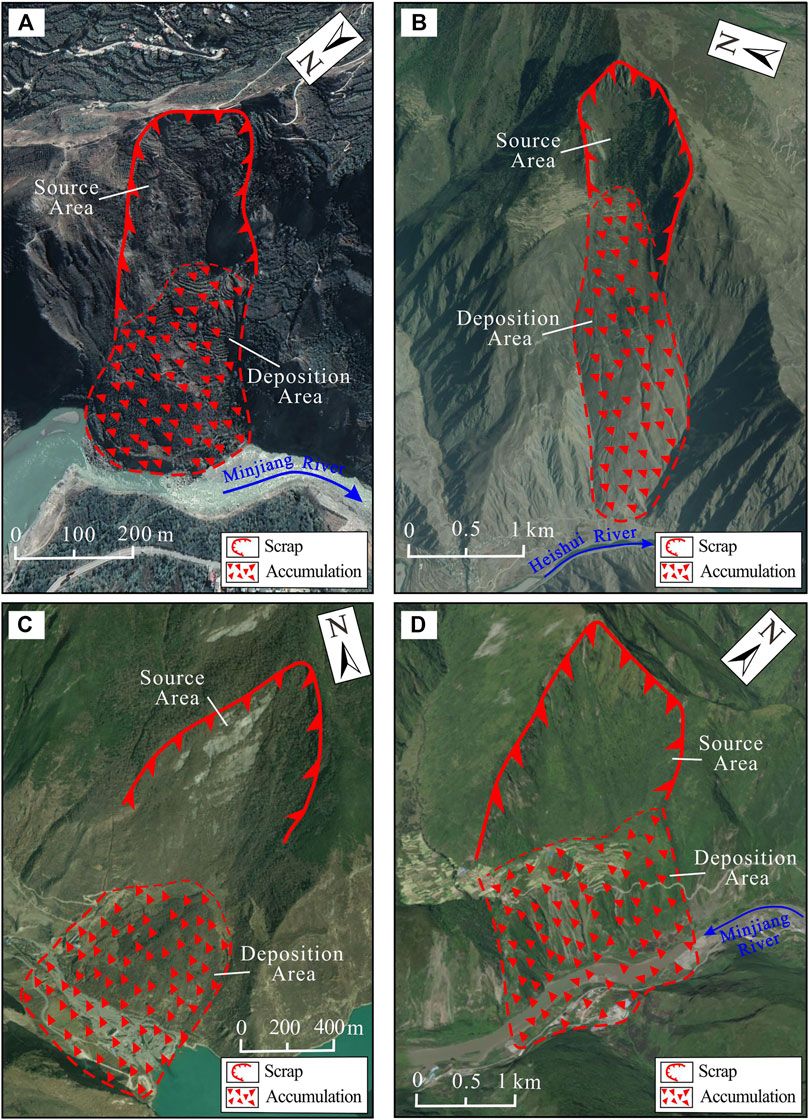
FIGURE 2. Typical landslides in the upper reaches of the Minjiang River catchment. (A) Shallow landslide occurred near the Nanxin Town (31°33′N, 103°43′E). (B) Deep-seated landslide occurred at the Seergu Town (31°55′N, 103°26′E). (C) Rock avalanche occurred near the Diexi Town (32°03′N, 103°40′E). (D) High-relief rock avalanche occurred at Muer Village (32°05′N, 103°42′E).
2.3 Landslide conditioning factors
LCFs were identified based on a review of the previous literature, the general features of the geo-environment, and the availability of data. In total, 11 LCFs are based on topography (elevation, slope angle, slope aspect, curvature, and relative relief), geology (lithology and distance to faults), hydrology (distance to rivers and topographic wetness index (TWI)), and environment (normalized difference vegetation index (NDVI) and rainfall) were selected for analysis in this study, as shown in Figure 3 and Table 1. All thematic layers were converted into a 30 m spatial resolution using QGIS software.
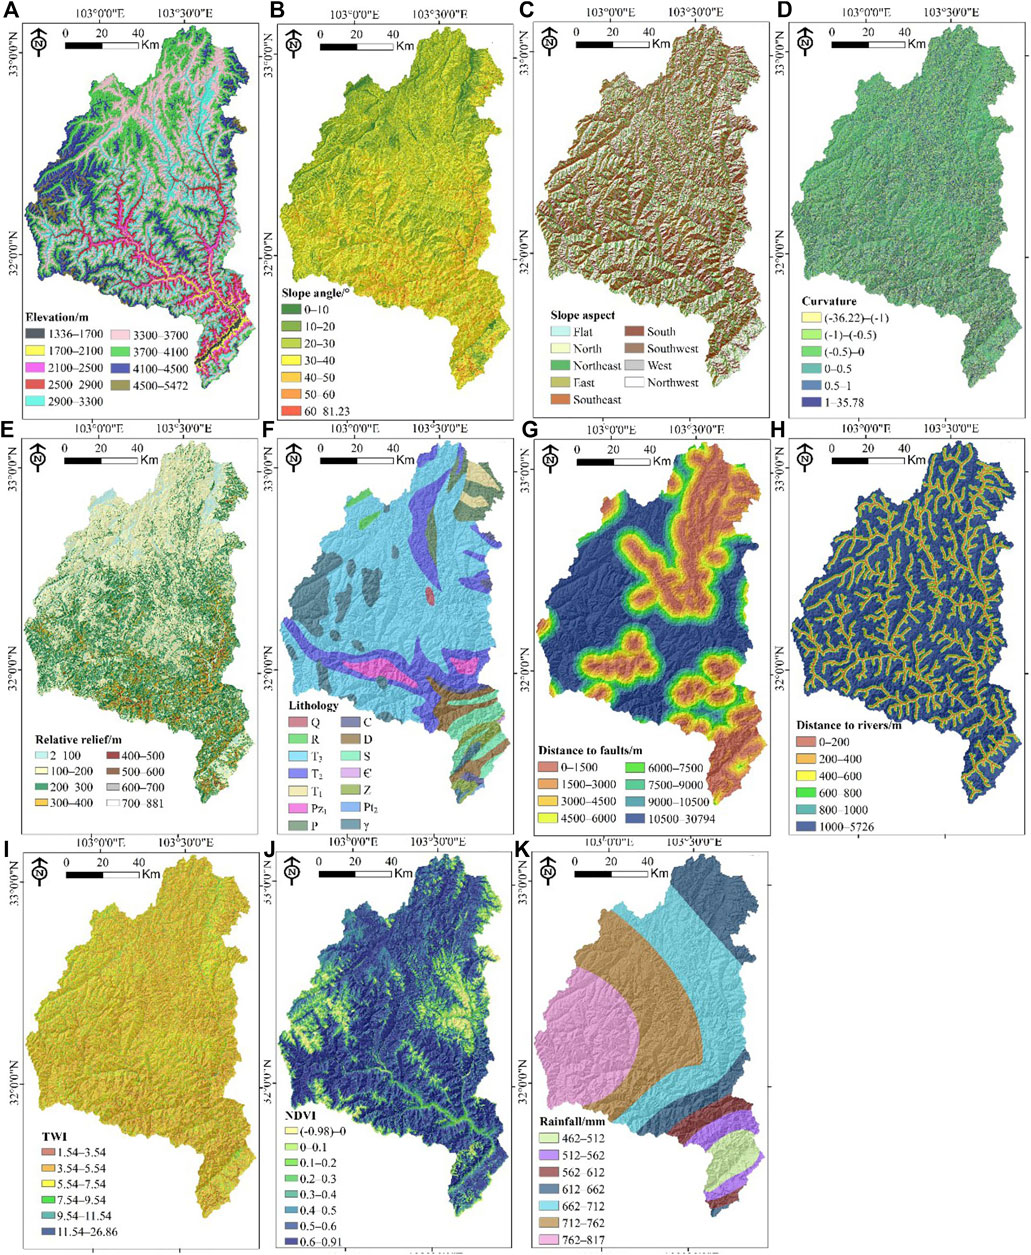
FIGURE 3. Landslide conditioning factors: (A) elevation, (B) slope angle, (C) slope aspect, (D) curvature, (E) relative relief, (F) lithology, (G) distance to faults, (H) distance to rivers, (I) topographic wetness index (TWI), (J) NDVI, and (K) rainfall.
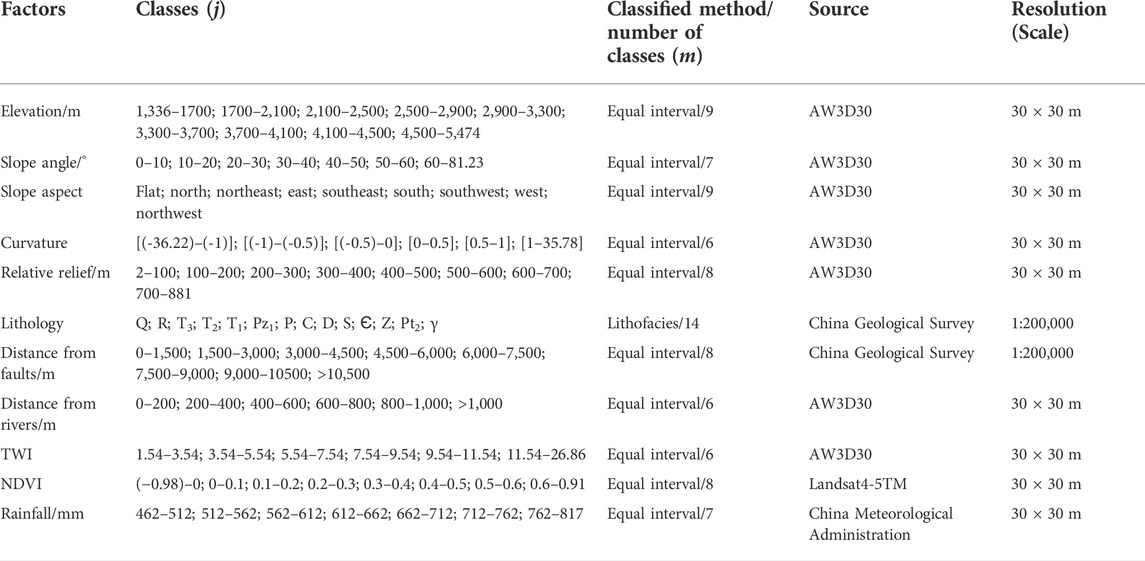
TABLE 1. The spatial database used for modeling and analyses.
2.3.1 Topographic factors
The 30-m digital surface model data named Advanced Land Observing Satellite (ALOS) World 3D (AW3D30) was applied to generate the topographic factors. Elevation is an important factor controlling hillslope stability, which determines the potential energy of the slope. The elevations were categorized into 9 classes with an interval of 400 m (Figure 3A). Slope angles determine the stress distribution of the hillslope, which were divided into 7 classes with an interval of 10° (Figure 3B). The slope aspects indicate the direction of the hillslope, which is relevant to weathering and wetness determined by solar exposure, rainfall, and vegetation cover (Chen and Chen 2021). A slope aspect map was made by 9 categories of directions: flat, north, northeast, east, southeast, south, southwest, west, and northwest (Figure 3C). Curvature denotes the ground surface shape, which influences the flow speed, sediment, and erosion (Ali et al., 2021). The curvature map was arranged into 6 classes (Figure 3D). Relative relief is defined as the difference between the maximum and minimum elevation values in a circle area with a radius of 300 m, which can reflect the relative height in a local terrain (Chauhan et al., 2010). The relative relief ranges from 2 to 881 m, which was divided into 8 classes with an interval of 100 m (Figure 3E).
2.3.2 Geological factors
A 1:200,000 geological map provided by the China Geological Survey was adopted to obtain lithology and fault information. According to the geological age and lithofacies of the lithological units, the study area was classified into 14 groups (Figure 3F): Quaternary clay, silt, and gravelly soil (Q), Tertiary siltstone and sandstone (R); Upper Triassic sandstone, limestone, and phyllite (T3); Middle Triassic metamorphic sandstone, slate, and phyllite (T2); Lower Triassic limestone and siltstone (T1); Lower Paleozoic phyllite (Pz1); Permian melaphyre, phyllite, and limestone (P); Carboniferous limestone (C); Devonian quartzite, phyllite, and limestone (D); Silurian phyllite, crystalline limestone, and sandstone (S); Cambrian metamorphic tuffaceous sandy conglomerate and phyllite (Є); Sinian dolomite and sand shale (Z); Mesoproterozoic quartz schist and anorthosite (Pt2); and granite and diorite (γ). The distances to faults were generated using the Euclidean distance tool in GIS software (Figure 3G) and then classified into 8 buffer zones at an interval of 1,500 m.
2.3.3 Hydrological factors
The distance to rivers and the TWI were also obtained from DEM data. It has been proven that rivers can erode the slope toe and reduce the stability of the hillslope (Chen and Zhang 2021). In this study, the distance to rivers was classified into 6 classes with an equal interval of 200 m (Figure 3H). The TWI was used to study the spatial scale effect of hydrological processes, which can quantitatively describe soil wetness in watersheds. TWI can be computed using Eq. 1:
where α and β represent the contributing area and slope angle, respectively. TWI values in the study area were rearranged into 6 groups (Figure 3I).
2.3.4 Environmental factors
The NDVI can quantitatively reflect the relationships between vegetation coverage and slope stabilities (Abraham et al., 2021). The NDVI values were derived from Landsat4-5TM images with a 30-m spatial resolution acquired on 11 August 2011 (http://www.gscloud.cn). They can be calculated as follows:
where NIR and R denote the near-infrared band and red band, respectively. In the study area, NDVI values varied from −0.98 to 0.91, which were divided into 8 classes (Figure 3J).
Rainfall is an important external dynamic factor in inducing landslides. The annual rainfall data (1981–2010) were collected from the China Meteorological Administration, and the kriging spatial interpolation method was adopted to create a mean annual rainfall contour map in the GIS environment. Rainfall in the study area varied from 462 to 817 mm, which was classified into 7 classes with an interval of 50 mm (Figure 3K).
3 Methodologies
Landslide susceptibility assessment in this study mainly consisted of the following steps (Figure 4): 1) preparation of the landslide inventory map and LCFs; 2) feature selection using a multicollinearity test and correlation attribute evaluation (CAE); 3) modeling process using the FR, IV, LMT, and RBFC models; 4) generation of landslide susceptibility maps; and 5) model validation and comparison.
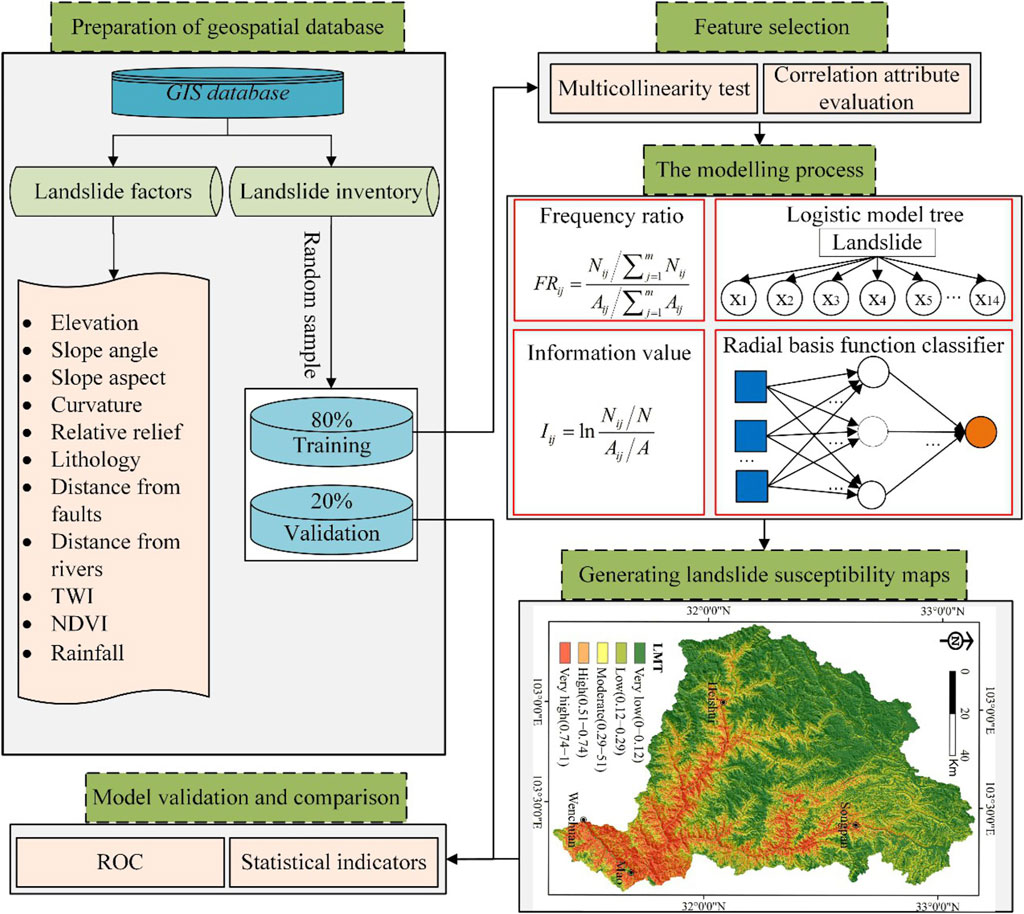
FIGURE 4. Study flowchart for landslide susceptibility for the upper reaches of the Minjiang River.
3.1 Multicollinearity test for landslide conditioning factors
The multicollinearity test of conditional factors is vital for landslide susceptibility mapping, as multicollinearity may interfere with the prediction ability of the model. In this study, tolerance (TOL) and variance inflation factor (VIF) were applied to judge multicollinearity, which can be calculated as follows (e.g., Di Napoli et al., 2020):
where Rj2 is the coefficient of determination for the regression analysis of all other factors. In general, a value of VIF <5 or TOL >0.1 indicates that there is no multicollinearity (Chen and Chen, 2021).
3.2 Selection of significant landslide conditioning factors
In landslide susceptibility evaluation, it is essential to evaluate the contributions of all LCFs to landslide occurrence (Pham and Prakash 2019). Some factors that are not important to the occurrence of landslides should be removed to reduce noise and transition fitting problems to improve the prediction accuracy of the model. The significant LCFs are often selected using the CAE method, which estimates the contribution of factors by measuring Pearson’s correlation between factors and classes (Chen et al., 2016).
3.3 Statistical models
3.3.1 Frequency ratio model
The FR model is one of the most widely adopted models for landslide susceptibility mapping. FR is the ratio of the area where landslides occurred in the whole study area and is also the ratio of a landslide occurrence probability to a nonoccurrence probability for each factor (Regmi et al., 2014). First, FRij is calculated for class j of Factor i, and then all frequency ratios are spatially overlaid to calculate the landslide susceptibility index (LSI) in the GIS environment.
where Nij is the number of landslide points within class j of Factor i, Aij is the area for class j of Factor i, and m is the total number of classes in the corresponding variable.
3.3.2 Information value model
The IV model is a bivariate statistical method for landslide spatial prediction developed from information theory (Yin and Yan 1988). Through the statistics of historical landslide data, the information value for each class was calculated to characterize the relationship between conditioning factors and landslides (Ghobadi et al., 2017). Finally, all IVs were summed for LSI. Therefore, the IV model can be calculated as follows (e.g., Yin and Yan 1988; Sharma et al., 2015):
where Iij is the information value of class j in Factor i, N is the total number of landslides, and A is the total area.
3.4 Machine learning models
3.4.1 Logistic model tree
As a new classification algorithm, LMT is the integration of LR and C4.5 DT (Quinlan 1993). In LMT, the information gain is applied to splitting nodes and leaves, whereas the logit boost algorithm is employed for fitting the LR functions at a tree node (Landwehr et al., 2005). The classification and regression tree (Breiman et al., 1984) in the LMT model could be used to prune to prevent the overfitting problem (Bui et al., 2016).
3.4.2 Radial basis function classifier
RBFC is a supervised neural network for function approximation using minimizing squared error with the Broyden–Fletcher–Goldfarb–Shanno (BFGS) method. This algorithm is composed of three layers: the input layer, masked layer, and output layer (Haykin 1994). The elements of each layer are linked to transmit information (Pham et al., 2020). The masked layer is usually represented by the Gaussian function. The initial centers for the Gaussian radial basis functions are found using simple KMeans. The initial sigma values are set to the maximum distance between any center and its nearest neighbor in the set of centers.
3.5 Model comparison and validation
To validate and compare the models, various popular statistical indicators, including susceptibility, specificity, accuracy, and the area under the curve (AUC) of the receiver operating characteristic (ROC), was applied in this study. The ROC curve is a graph based on the “sensitivity” as the y-axis and “1−specificity” as the x-axis (Panahi et al., 2022). Generally, the higher the values of susceptibility, specificity, accuracy, and AUC, the better the model is. These statistical metrics can be calculated using the following formulae (Sahana et al., 2020):
where TP (true positive) and TN (true negative) are the numbers of landslide and nonlandslide pixels correctly classified, respectively; FP (false positive) and FN (false negative) represent the number of landslide and nonlandslide pixels incorrectly classified, respectively (Ali et al., 2021); and P and N are the total numerals of landslide and nonlandslide pixels, respectively.
4 Results
4.1 Multicollinearity assessment
The results of all factors under the multicollinearity test are shown in Table 2, indicating that VIF values were below 2.982, and TOL values were above 0.335. Therefore, there was no collinearity problem among all factors in this study.
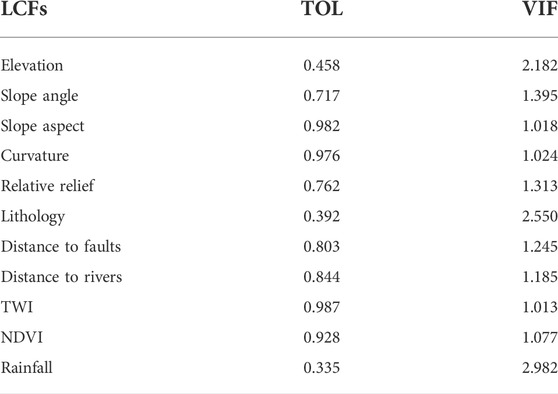
TABLE 2. Multicollinearity analysis.
4.2 Landslide conditioning factors’ assessment
The relative importance of the 11 LCFs was based on the CAE method using training data. The average merit (AM) values signified the predictive capability of LCFs, and the results are shown in Figure 5. According to these results, elevation was the most important factor, with an AM value of 0.2066, which was followed by relative relief (0.1862), distance to rivers (0.1727), lithology (0.1660), slope angle (0.1296), rainfall (0.1271), distance to faults (0.1185), TWI (0.0916), NDVI (0.0902), curvature (0.0657), and slope aspect (0.0318). Therefore, all factors were applied to landslide susceptibility modeling in this study.
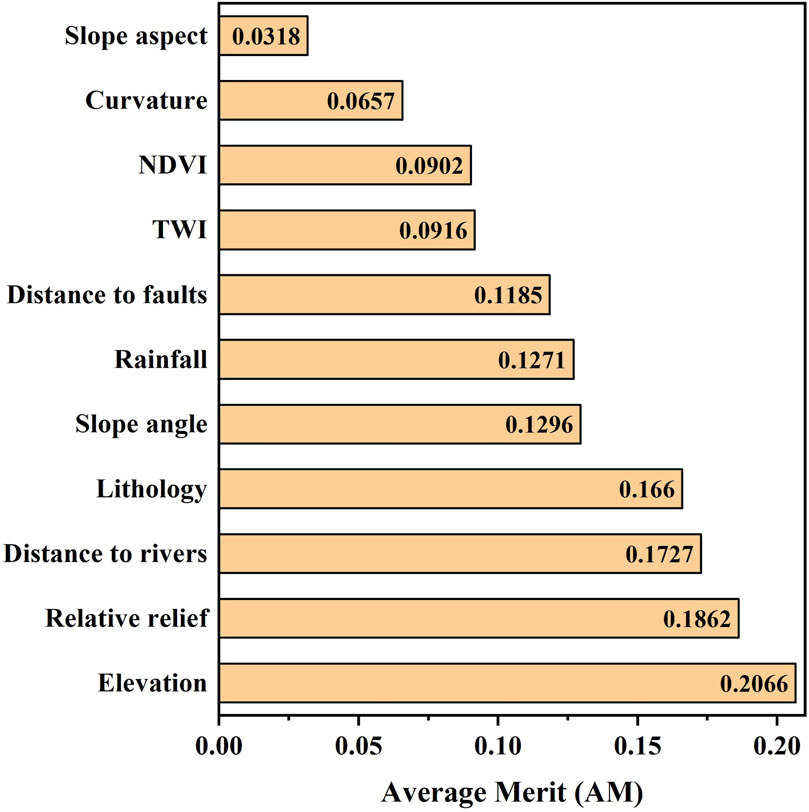
FIGURE 5. Predictive capabilities of LCFs using the CAE method.
4.3 Landslide susceptibility mapping
4.3.1 Landslide susceptibility mapping using the frequency ratio model
The results of LSM using the FR, IV, LMT, and RBFC models are presented in Figures 6, 7. The FR values for different classes of LCFs were calculated using the training dataset, and the results are shown in Table 3. Among the 88 classes of the 11 factors, 42 classes have positive relations with landslide occurrences. The LSI values in the study area were calculated based on Eq. 6 in the GIS environment, which varied from 3.63 to 34.16. Low LSI values indicate lower susceptibility to landslides, while higher LSI values indicate higher susceptibility to landslides (Wang et al., 2019). Then, the LSI values were normalized and classified into five susceptibility classes (very low, low, moderate, high, and very high) using the natural break method (Figure 6A). The area proportion and landslide proportion in each landslide susceptibility class are shown in Figure 7. The low class had the largest coverage area (45.19%), followed by moderate (22.01%), very low (20.69%), high (8.93%), and moderate (3.18%) classes. In addition, 24.40% of landslides fell in the very high susceptibility zones.
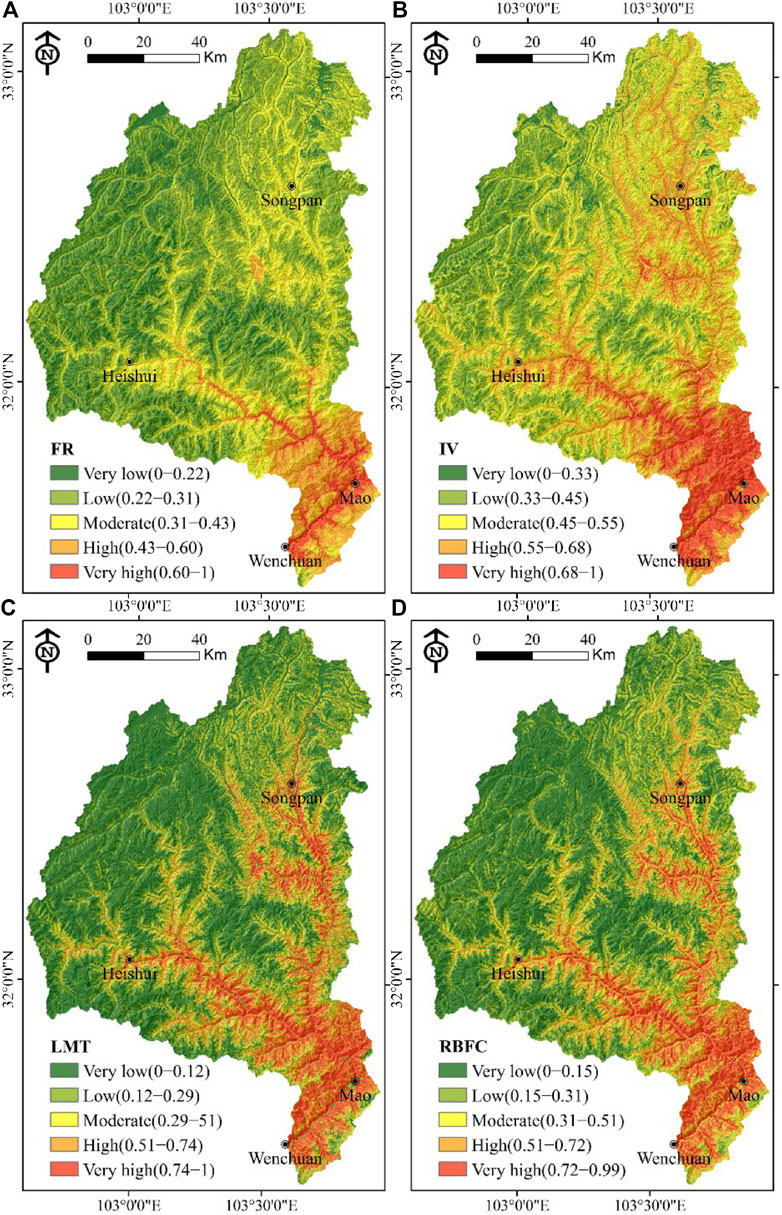
FIGURE 6. Landslide susceptibility map produced using (A) the FR model, (B) the IV model, (C) the LMT model, and (D) the RBFC model.
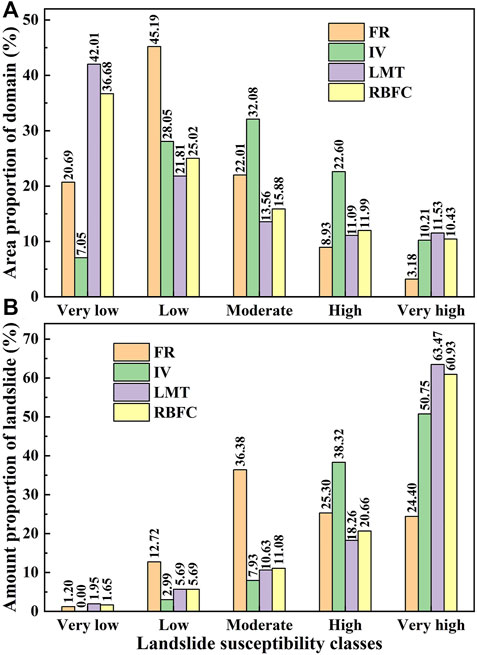
FIGURE 7. Quantitative analysis of the landslide susceptibility maps. (A) Area proportion of domain in each susceptibility class. (B) Amount proportion of landslide in each susceptibility class.
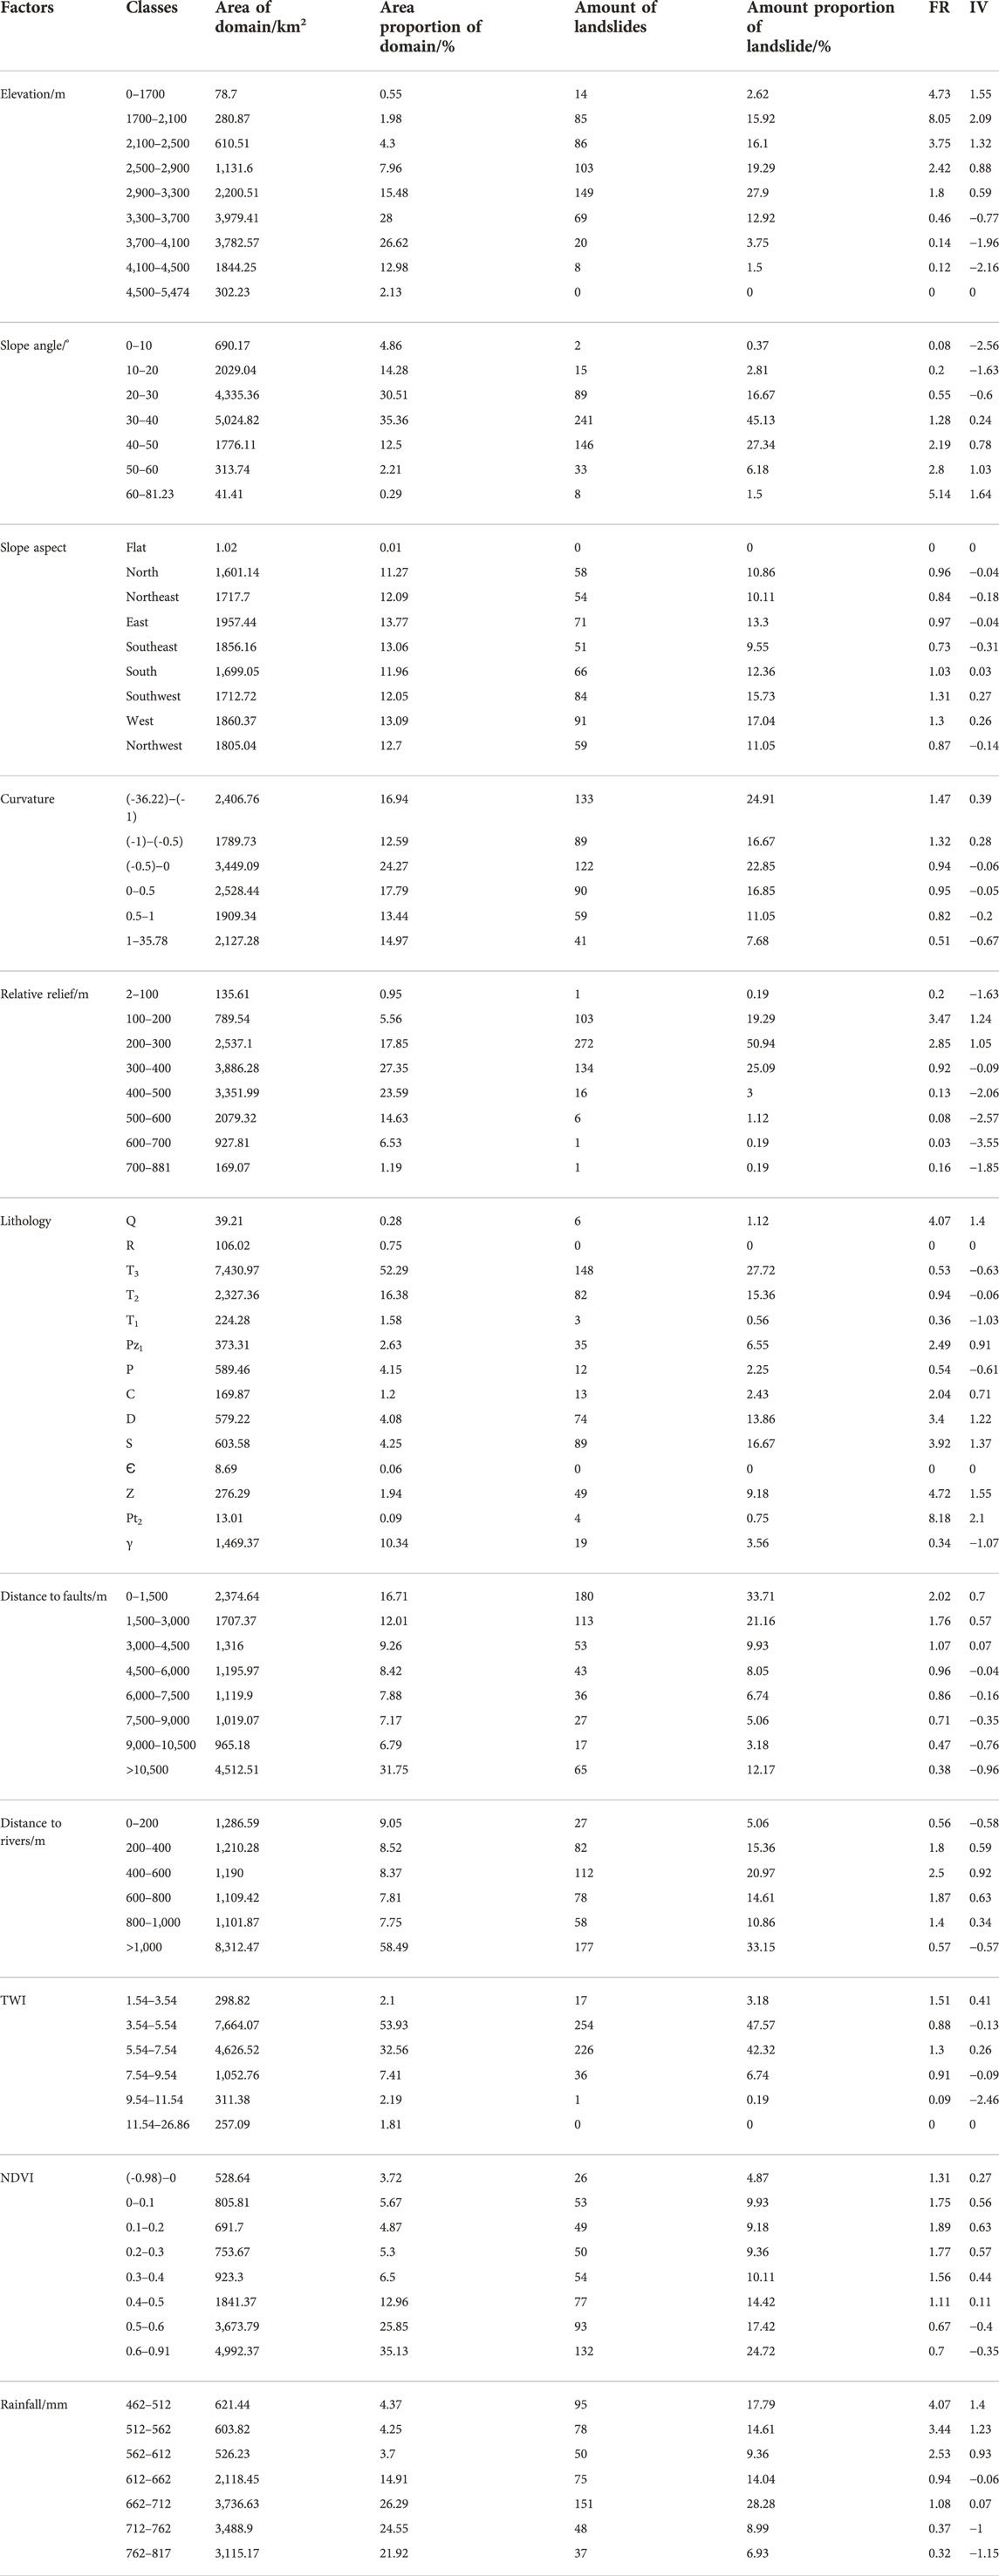
TABLE 3. Spatial relationship between landslide conditioning factors and landslides from the FR and IV models.
4.3.2 Landslide susceptibility mapping using the information value model
The spatial relationship between training landslides and conditioning factors using the IV model is shown in Table 3. It is notable that the higher the IV value, the greater the possibility of landslides. The LSI value was calculated by summing the IV values of all factors, and the values vary from -13.47 to 10.23. The LSI is also grouped into five landslide susceptibility classes of very low (7.05%), low (28.05%), moderate (32.08%), high (22.60%), and very high (10.21%) (Figures 6, 7). The very high, high, moderate, and low landslide susceptibility zones occupied 50.75, 38.32, 7.93, and 2.99% of the total landslides, respectively.
4.3.3 Landslide susceptibility mapping using the logistic model tree model
The LMT model can be implemented using the training dataset by the Waikato Environment for Knowledge Analysis (WEKA) software, and then the validation dataset was used to test the prediction ability of the training model. Finally, the LSI of each pixel in the study area was calculated using the trained LMT model. In this case, the LSI values derived from the LMT model are between 0 and 1, which were divided into 5 categories by the natural break method: very high, high, moderate, low, and very low (Figure 6C). These zones accounted for 11.53, 11.09, 13.56, 21.81, and 42.01% of the total study area, respectively. The very high and high landslide-prone areas contained 63.47 and 18.26% of the total landslides, respectively. However, 10.63, 5.69, and 1.95% of the total landslides fell in the moderate, low, and very low landslide susceptibility categories, respectively (Figure 7).
4.3.4 Landslide susceptibility mapping using the radial basis function classifier model
The RBFC model was also constructed by the training dataset, and the LSI values derived from the RBFC model ranged from 0 to 0.99. According to Figure 6D, the area percentages for the very high, high, moderate, low, and very low zones were 10.43, 11.99, 15.88, 25.02, and 36.68%, respectively. Additionally, 60.93% of the landslides were distributed in the very high landslide zones, while the landslide proportions of the low and very low zones were 5.69 and 1.65%, respectively (Figure 7).
4.4 Validation of the models
To evaluate the performance of the four models, the statistical indices were used by the training and validation datasets (Table 3). Concerning the training dataset, the IV model had the highest value of sensitivity (94.76%), followed by LMT (82.96%), RBFC (82.40%), and FR (39.33%). In the case of specificity, FR ranked first, with specificity = 93.82%, followed by RBFC (82.58%), LMT (82.21%), and IV (50.75%). In terms of ACC, LMT was the best method, with a value of 82.58%, followed by RBFC (82.49%), IV (72.75%), and FR (66.57%). For the validation dataset, the results also demonstrated that the LMT model (sensitivity=79.10%, specificity=78.36%, and ACC=78.73%) performed best, followed by RBFC (sensitivity=79.10%, specificity=76.87%, and ACC=77.99%), IV (sensitivity=97.01%, specificity=58.21%, and ACC=77.61%), and FR (sensitivity=35.82%, specificity=92.54%, and ACC=64.18%).
The AUC of the ROC curve was also used for the overall performance of the applied models (Figure 8). For the training dataset, all models had acceptable performances. Specifically, the LMT model (AUC= 0.898) was more efficient than other three models, RBFC (0.894), IV (0.862), and FR (0.842) (Figure 8A). For the validation dataset, the results were also the same as those for training. The LMT model achieved the highest predictive accuracy, with an AUC value of 0.879, followed by RBFC (0.871), IV (0.869), and FR (0.839) (Figure 8B).
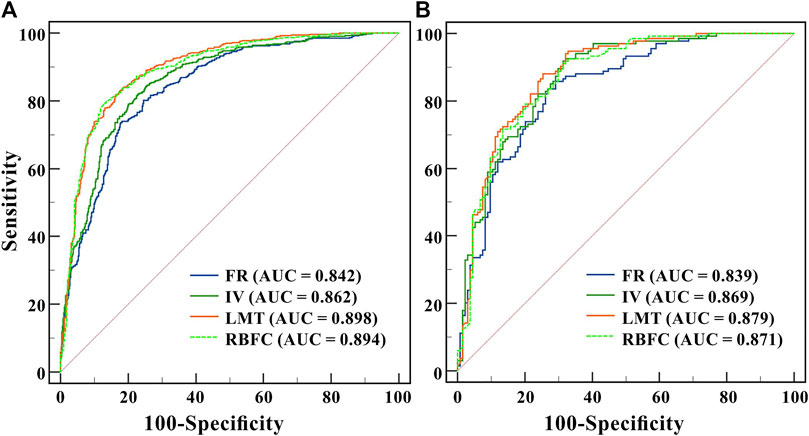
FIGURE 8. ROC curves and AUC for the FR, IV, LMT, and RBFC models: (A) training dataset and (B) validation dataset.
5 Discussion
The spatial relations between LCFs and landslides using the training dataset suggested that all the factors have a positive impact on the occurrence of landslides in some classes (Table 3, Figure 5). The elevations of 1,300–3,300 m for each interval had FR values >1 and IV values >0, indicating a vertical zonation feature owing to the various microclimate and geological environments at different elevations (Table 3; Chen and Zhang 2021). The FR and IV values increased with the increase of slope angle, and slope aspects in the southwest (FR=1.31, IV=0.27), west (FR=1.30, IV=0.26), and south (FR=1.03, IV=0.03) exhibited a higher probability of landsliding on account of the impacts of rainfall and sunshine (He and Kusiak., 2017; Bui et al., 2020; Huang et al., 2022). For curvature, the negative correlation between FR and IV values suggested that concave hillslopes had a higher probability of landslide occurrence due to the water enrichment, which could greatly reduce the shear strengths of hillslopes (Xu et al., 2016; Zhou et al., 2021; Li S et al., 2022). The relative reliefs with classes of 100–300 m had the highest FR and IV values, as a result of the control of river undercutting on the landslides. Regarding lithology, rock formations of Q, Pz1, C, D, S, Z, and Pt2 had the larger FR and IV values, which were mainly composed of stratified and laminated rock types. The distances to rivers had a positive influence on landslide formations, further supporting the notion that landslides are controlled by river incision. For the TWI, the areas in the classes of 1.54–3.54 and 5.54–7.54 were most prone to sliding. For the NDVI, the maximum FR and IV values had a class of 0.1–0.2. For rainfall, the class of 462–512 mm had the largest FR and IV values (Table 3). In summary, the factors of elevation, relative relief, and distance to rivers played the most significant roles in the evolution of landslides, which was consistent with previous studies (Chen et al., 2017; Zhao et al., 2019; Bui et al., 2020).
The comparisons of the four models using the AUC showed that all the models had good performance (AUC=0.8–0.9). In general, the ML models were better than the traditional statistical models in this study. The LMT model with the largest AUC (=0.879) outperformed other models in terms of predictive capacity. However, the prediction abilities of RBFC, IV, and FR with the AUC of 0.008, 0.01, and 0.04 were lower than that of LMT. Similarly, the LMT model with an ACC of 78.73% was 0.74% higher than that of RBFC. However, the ACC values obtained by the two statistical models were relatively low. This was because the ML techniques could use algorithms to learn the relationship between landslide occurrence and related predictors, and avoid starting with an assumed structural model (Pourghasemi and Rahmati 2018). Furthermore, the ML models have advantages in that it does not require statistical assumptions and consider the nonlinear characteristics of landslides. In contrast, the FR and IV models examine the relationship between landslide occurrence and factors, yet they do not comparatively consider the differences among the factors. It is unreasonable to regard each conditioning factor layer with the same weight (Guo et al., 2021).
The landslide susceptibility maps generated by the RBFC and LMT models were well coincident with each other, while they were different from the results created by the FR and IV models. From the area ratios of the corresponding landslide susceptibility classes of these models, the proportion and distribution obtained by the ML and statistical models were quite different among the five susceptibility classes. For the very low class, the coverage areas from the FR and IV models were 20.69 and 7.05%, respectively. On the other hand, the proportions of LMT and RBFC in the very low classes were 36.68–42.01%. For the very high susceptibility classes, the area proportions obtained by LMT and RBFC were 11.53 and 10.43%, respectively, which were mainly distributed nearby the stem of the Minjiang River and its tributary, the Heishui River. However, only 3.18% of the overall area obtained by the FR model fell in the very high susceptibility zone. It is notable that the statistical model performed well for the southern portion of the study area (such as Wenchuan County and Mao County), but the ML model fulfilled the prediction well for the whole region (Figure 6). According to the proportion of landslides at different levels, the ML model illustrated a larger area of a very high susceptibility class than the statistical model. Based on a comprehensive comparison of the sensitivity, specificity, accuracy, AUC, and susceptibility class distribution, the LMT map was determined to be a more efficient model for predicting landslides in this region. Thus, LMT is recommended as a robust model for landslide susceptibility assessment in similar environmental settings.
Landslide susceptibility mapping is considered to be an important step in landslide risk assessment, which is of great significance for disaster prevention and mitigation (e.g., Tang et al., 2020). From the susceptibility maps, we found that the areas of very high and high proneness to landslides were mainly distributed on both banks of the river. Many towns, villages, and highways are located along the river valley, where humans, communities, transportation, and tourists are threatened by landslides. These landslide susceptibility maps are helpful for decision-makers, engineers, and authorities to formulate systematic measures to reduce disaster risks along the Minjiang and Heishui Rivers.
6 Conclusion
This study compared the performances of the popular statistical models (FR and IV) and the ML models (LMT and RBFC) for landslide susceptibility mapping. The upper reaches of the Minjiang River in the eastern margin of the Tibetan Plateau served as a typical case for disaster assessment in plateau margins. Multiple factors of elevation, slope angle, slope aspect, curvature, relative relief, lithology, distance to faults, distance to rivers, TWI, NDVI, and rainfall were selected for landslide susceptibility analysis. The major findings are as follows:
1) A multicollinearity test revealed that there was no collinearity issue among the 11 LCFs. The relative contribution of LCFs using the CAE method indicated that elevation, relative relief, and distance to rivers were the major influential factors for the landslide occurrences in the study area.
2) The comparative analysis of all the models using the AUC and statistical indices showed that the LMT model had the largest AUC of 0.879 and a high ACC of 78.73%, followed by RBFC (AUC=0.871, ACC=77.99%), IV (AUC=0.869, ACC=77.61%), and FR (AUC=0.839, ACC=64.18%). It can be inferred that the ML models have better prediction performances than the statistical models. LMT is the most robust model to predict the landslide-prone areas in this region. The LMT model is recommended to be adopted in similar geo-environmental regimes for landslide susceptibility mapping.
3) The susceptibility maps produced via the four models showed that very high landslide susceptibility zones are mainly distributed nearby the mainstream of the Minjiang River and its tributary, the Heishui River. These findings could be applied to mitigate landslide hazards and provide references for land-use planning.
Data availability statement
The original contributions presented in the study are included in the article/supplementary material; further inquiries can be directed to the corresponding author.
Author contributions
SZ and SL conceptualized the research and contributed to data analysis and investigation. JH contributed to the study methodology and the writing of the original draft. XZ contributed to the field surveys and draft modifications. All authors have agreed to the publication of the manuscript.
Funding
This study is financially supported by the National Natural Science Foundations of China (No. 41907228; No. 42007248), the Sichuan Science and Technology Program (No. 2020YFS0297), and the Fundamental Research Funds for the Central Universities.
Conflict of Interest
The author XZ was employed by the company Sichuan Transportation Construction Group Co Ltd.
The remaining authors declare that the research was conducted in the absence of any commercial or financial relationships that could be construed as a potential conflict of interest.
Publisher’s note
All claims expressed in this article are solely those of the authors and do not necessarily represent those of their affiliated organizations, or those of the publisher, the editors, and the reviewers. Any product that may be evaluated in this article, or claim that may be made by its manufacturer, is not guaranteed or endorsed by the publisher.
References
Abraham, M. T., Satyam, N., Lokesh, R., Pradhan, B., and Alamri, A. (2021). Factors affecting landslide susceptibility mapping: Assessing the influence of different machine learning approaches, sampling strategies, and data splitting. Land 10, 989. doi:10.3390/land10090989
Aditian, A., Kubota, T., and Shinohara, Y. (2018). Comparison of GIS-based landslide susceptibility models using frequency ratio, logistic regression, and artificial neural network in a tertiary region of Ambon, Indonesia. Geomorphology 318, 101–111. doi:10.1016/j.geomorph.2018.06.006
Ali, S. A., Parvin, F., Vojtekova, J., Costache, R., Linh, N. T. T., Pham, Q. B., et al. (2021). GIS-based landslide susceptibility modeling: A comparison between fuzzy multi-criteria and machine learning algorithms. Geosci. Front. 12, 857–876. doi:10.1016/j.gsf.2020.09.004
Breiman, L., Friedman, J. H., Olshen, R. A., and Stone, C. J. (1984). Classification and regression trees. Belmont: Wadsworth. doi:10.1201/9781315139470
Bui, D. T., Tsangaratos, P., Nguyen, V.-T., Liem, N. V., and Trinh, P. T. (2020). Comparing the prediction performance of a Deep Learning Neural Network model with conventional machine learning models in landslide susceptibility assessment. Catena 188, 104426. doi:10.1016/j.catena.2019.104426
Bui, D. T., Tuan, T. A., Klempe, H., Pradhan, B., and Revhaug, I. (2016). Spatial prediction models for shallow landslide hazards: A comparative assessment of the efficacy of support vector machines, artificial neural networks, kernel logistic regression, and logistic model tree. Landslides 13, 361–378. doi:10.1007/s10346-015-0557-6
Chauhan, S., Mukta, S., and Arora, M. K. (2010). Landslide susceptibility zonation of the Chamoli region, Garhwal Himalayas, using logistic regression model. Landslides 7, 411–423. doi:10.1007/s10346-010-0202-3
Chen, W., Wang, J., Xie, X., Hong, H., Nguyen Van, T., Bui, D. T., et al. (2016). Spatial prediction of landslide susceptibility using integrated frequency ratio with entropy and support vector machines by different kernel functions. Environ. Earth Sci. 75, 1344. doi:10.1007/s12665-016-6162-8
Chen, W. W., and Zhang, S. (2021). GIS-based comparative study of Bayes network, Hoeffding tree and logistic model tree for landslide susceptibility modeling. Catena 203, 105344. doi:10.1016/j.catena.2021.105344
Chen, W., Xie, X. S., Peng, J. B., Shahabi, H., Hong, H. Y., Bui, D. T., et al. (2018). GIS-based landslide susceptibility evaluation using a novel hybrid integration approach of bivariate statistical based random forest method. Catena 164, 135–149. doi:10.1016/j.catena.2018.01.012
Chen, W., Xie, X., Wang, J., Pradhan, B., Hong, H., Bui, D. T., et al. (2017). A comparative study of logistic model tree, random forest, and classification and regression tree models for spatial prediction of landslide susceptibility. Catena 151, 147–160. doi:10.1016/j.catena.2016.11.032
Chen, X., and Chen, W. (2021). GIS-based landslide susceptibility assessment using optimized hybrid machine learning methods. Catena 196, 104833. doi:10.1016/j.catena.2020.104833
Cui, S., Pei, X., Jiang, Y., Wang, G., Fan, X., Yang, Q., et al. (2021). Liquefaction within a bedding fault: Understanding the initiation and movement of the Daguangbao landslide triggered by the 2008 Wenchuan Earthquake (Ms = 8.0). Eng. Geol. 295, 106455. doi:10.1016/j.enggeo.2021.106455
Cui, S., Wu, H., Pei, X., Yang, Q., Huang, R., and Guo, B. (2022). Characterizing the spatial distribution, frequency, geomorphological and geological controls on landslides triggered by the 1933 Mw 7.3 Diexi Earthquake, Sichuan, China. Geomorphology 403, 108177. doi:10.1016/j.geomorph.2022.108177
Dai, F., Xu, C., Yao, X., Xu, L., Tu, X., and Gong, Q. (2011). Spatial distribution of landslides triggered by the 2008 Ms 8.0 Wenchuan earthquake, China. J. Asian Earth Sci. 40, 883–895. doi:10.1016/j.jseaes.2010.04.010
Di Napoli, M., Carotenuto, F., Cevasco, A., Confuorto, P., Di Martire, D., Firpo, M., et al. (2020). Machine learning ensemble modelling as a tool to improve landslide susceptibility mapping reliability. Landslides 17, 1897–1914. doi:10.1007/s10346-020-01392-9
Dou, J., Yunus, A. P., Bui, D. T., Merghadi, A., Sahana, M., Zhu, Z. F., et al. (2020). Improved landslide assessment using support vector machine with bagging, boosting, and stacking ensemble machine learning framework in a mountainous watershed, Japan. Landslides 17, 641–658. doi:10.1007/s10346-019-01286-5
Fan, X., Juang, C. H., Wasowski, J., Huang, R., Xu, Q., Scaringi, G., et al. (2018). What we have learned from the 2008 wenchuan earthquake and its aftermath: A decade of research and challenges. Eng. Geol. 241, 25–32. doi:10.1016/j.enggeo.2018.05.004
Fan, X., van Westen, C. J., Korup, O., Gorum, T., Xu, Q., Dai, F., et al. (2012). Transient water and sediment storage of the decaying landslide dams induced by the 2008 Wenchuan earthquake, China. Geomorphology 171, 58–68. doi:10.1016/j.geomorph.2012.05.003
Ghobadi, M. H., Nouri, M., Saedi, B., Jalali, S. H., and Pirouzinajad, N. (2017). The performance evaluation of information value, density area, LNRF, and frequency ratio methods for landslide zonation at Miandarband area, Kermanshah Province, Iran. Arab. J. Geosci. 10, 430. doi:10.1007/s12517-017-3202-y
Guo, X. Y., Fu, B. H., Du, J., Shi, P. L., Chen, Q. Y., and Zhang, W. Y. (2021). Applicability of susceptibility model for rock and loess earthquake landslides in the eastern Tibetan plateau. Remote Sens. 13, 2546. doi:10.3390/rs13132546
Haykin, S. S. (1994). Neural networks: A comprehensive foundation. New York: Macmillan College Publishing Company. 0-02-352781-7.
He, Y., and Kusiak, A. (2017). Performance assessment of wind turbines: Data-derived quantitative metrics. IEEE Trans. Sustain. Energy 9, 65–73. doi:10.1109/tste.2017.2715061
Hong, H. Y., Liu, J. Z., and Zhu, A. X. (2019). Landslide susceptibility evaluating using artificial intelligence method in the Youfang district (China). Environ. Earth Sci. 78, 488. doi:10.1007/s12665-019-8415-9
Hong, H. Y., Pradhan, B., Bui, D. T., Xu, C., Youssef, A. M., and Chen, W. (2017). Comparison of four kernel functions used in support vector machines for landslide susceptibility mapping: A case study at suichuan area (China). Geomatics Nat. Hazards Risk 8, 544–569. doi:10.1080/19475705.2016.1250112
Huang, F. M., Cao, Z. S., Guo, J. F., Jiang, S. H., Li, S., and Guo, Z. Z. (2020). Comparisons of heuristic, general statistical and machine learning models for landslide susceptibility prediction and mapping. Catena 191, 104580. doi:10.1016/j.catena.2020.104580
Huang, F. M., Ye, Z., Jiang, S.-H., Huang, J. S., Chang, Z. L., and andChen, J. W. (2021). Uncertainty study of landslide susceptibility prediction considering the different attribute interval numbers of environmental factors and different data-based models. Catena 202, 105250. doi:10.1016/j.catena.2021.105250
Huang, J. P., Ling, S. X., Wu, X. Y., and Deng, R. (2022). GIS-based comparative study of the bayesian network, decision table, radial basis function network and stochastic gradient descent for the spatial prediction of landslide susceptibility. Land 11, 436. doi:10.3390/land11030436
Hungr, O., Leroueil, S., and Picarelli, L. (2014). The Varnes classification of landslide types, an update. Landslides 11, 167–194. doi:10.1007/s10346-013-0436-y
Jiao, Y., Zhao, D., Ding, Y., Liu, Y., Xu, Q., Qiu, Y., et al. (2019). Performance evaluation for four GIS-based models purposed to predict and map landslide susceptibility: A case study at a World heritage site in southwest China. Catena 183, 104221. doi:10.1016/j.catena.2019.104221
Landwehr, N., Hall, M., and Frank, E. (2005). Logistic model trees. Mach. Learn. 59, 161–205. doi:10.1007/s10994-005-0466-3
Li, H., Deng, J., Yuan, S., Feng, P., Arachchige, D., and Cheng, Q. (2021). Short-term nacelle orientation forecasting using bilinear transformation and ICEEMDAN framework. Front. Energy Res. 9, 799039. doi:10.3389/fenrg.2021.780928
Li, H., He, Y., Xu, Q., Deng, J., Li, W., and Wei, Y. (2022). Detection and segmentation of loess landslides via satellite images: A two-phase framework. Landslides 19, 673–686. doi:10.1007/s10346-021-01789-0
Li, S., Ni, Z. Y., Zhao, Y. B., Hu, W., Long, Z. R., Ma, H. Y., et al. (2022). Susceptibility analysis of Geohazards in the longmen mountain region after the wenchuan earthquake. Int. J. Environ. Res. Public Health 19, 3229. doi:10.3390/ijerph19063229
Ling, S. X., and Chigira, M. (2020). Characteristics and triggers of earthquake-induced landslides of pyroclastic fall deposits: An example from Hachinohe during the 1968 M7.9 Tokachi-Oki earthquake, Japan. Eng. Geol. 264, 105301. doi:10.1016/j.enggeo.2019.105301
Ling, S. X., Sun, C. W., Li, X. N., Ren, Y., Xu, J. X., and Huang, T. (2021). Characterizing the distribution pattern and geologic and geomorphic controls on earthquake-triggered landslide occurrence during the 2017 M(s)7.0 Jiuzhaigou earthquake, Sichuan, China. Landslides 18, 1275–1291. doi:10.1007/s10346-020-01549-6
Nachappa, T. G., Ghorbanzadeh, O., Gholamnia, K., and Blaschke, T. (2020). Multi-hazard exposure mapping using machine learning for the state of salzburg, Austria. Remote Sens. 12, 2757. doi:10.3390/rs12172757
Ouimet, W. B., Whipple, K. X., Royden, L. H., Sun, Z., and Chen, Z. (2007). The influence of large landslides on river incision in a transient landscape: Eastern margin of the Tibetan Plateau (Sichuan, China). Geol. Soc. Am. Bull. 119, 1462–1476. doi:10.1130/B26136.1
Panahi, M., Rahmati, O., Rezaie, F., Lee, S., Mohammadi, F., and Conoscenti, C. (2022). Application of the group method of data handling (GMDH) approach for landslide susceptibility zonation using readily available spatial covariates. Catena 208, 105779. doi:10.1016/j.catena.2021.105779
Pánek, T., Břežný, M., Kapustová, V., Lenart, J., and Chalupa, V. (2019). Large landslides and deep-seated gravitational slope deformations in the Czech Flysch Carpathians: New LiDAR-based inventory. Geomorphology 346, 106852. doi:10.1016/j.geomorph.2019.106852
Pham, B. T., Bui, D. T., and Prakash, I. (2017). Landslide susceptibility assessment using bagging ensemble based alternating decision trees, logistic regression and J48 decision trees methods: A comparative study. Geotech. Geol. Eng. (Dordr). 35, 2597–2611. doi:10.1007/s10706-017-0264-2
Pham, B. T., Phong, T. V., Nguyen, H. D., Qi, C. C., Al-Ansari, N., Amini, A., et al. (2020). A comparative study of kernel logistic regression, radial basis function classifier, multinomial naive bayes, and logistic model tree for flash flood susceptibility mapping. Water 12, 239. doi:10.3390/w12010239
Pham, B. T., and Prakash, I. (2019). A novel hybrid model of Bagging-based Naive Bayes Trees for landslide susceptibility assessment. Bull. Eng. Geol. Environ. 78, 1911–1925. doi:10.1007/s10064-017-1202-5
Poudyal, C. P., Chang, C., Oh, H.-J., and Lee, S. (2010). Landslide susceptibility maps comparing frequency ratio and artificial neural networks: A case study from the Nepal himalaya. Environ. Earth Sci. 61, 1049–1064. doi:10.1007/s12665-009-0426-5
Pourghasemi, H. R., Kornejady, A., Kerle, N., and Shabani, F. (2020). Investigating the effects of different landslide positioning techniques, landslide partitioning approaches, and presence-absence balances on landslide susceptibility mapping. Catena 187, 104364. doi:10.1016/j.catena.2019.104364
Pourghasemi, H. R., and Rahmati, O. (2018). Prediction of the landslide susceptibility: Which algorithm, which precision? Catena 162, 177–192. doi:10.1016/j.catena.2017.11.022
Quinlan, J. R. (1993). C4.5: Programs of machine learning. San Mateo, CA: Morgan Kaufmann. 1-55860-238-0.
Regmi, A. D., Yoshida, K., Pourghasemi, H. R., Dhital, M. R., and Pradhan, B. (2014). Landslide susceptibility mapping along Bhalubang - shiwapur area of mid-Western Nepal using frequency ratio and conditional probability models. J. Mt. Sci. 11, 1266–1285. doi:10.1007/s11629-013-2847-6
Saha, S., Arabameri, A., Saha, A., Blaschke, T., Ngo, P. T. T., Nhu, V. H., et al. (2021). Prediction of landslide susceptibility in Rudraprayag, India using novel ensemble of conditional probability and boosted regression tree-based on cross-validation method. Sci. Total Environ. 764, 142928. doi:10.1016/j.scitotenv.2020.142928
Sahana, M., Pham, B. T., Shukla, M., Costache, R., Thu, D., Chakrabortty, R., et al. (2020). Rainfall induced landslide susceptibility mapping using novel hybrid soft computing methods based on multi-layer perceptron neural network classifier. Geocarto Int. 37, 2747–2771. doi:10.1080/10106049.2020.1837262
Sharma, L. P., Patel, N., Ghose, M. K., and Debnath, P. (2015). Development and application of Shannon’s entropy integrated information value model for landslide susceptibility assessment and zonation in Sikkim Himalayas in India. Nat. Hazards (Dordr). 75, 1555–1576. doi:10.1007/s11069-014-1378-y
Shirzadi, A., Solaimani, K., Roshan, M. H., Kavian, A., Chapi, K., Shahabi, H., et al. (2019). Uncertainties of prediction accuracy in shallow landslide modeling: Sample size and raster resolution. Catena 178, 172–188. doi:10.1016/j.catena.2019.03.017
Tang, Y. M., Feng, F., Guo, Z. Z., Feng, W., Li, Z. G., Wang, J. Y., et al. (2020). Integrating principal component analysis with statistically-based models for analysis of causal factors and landslide susceptibility mapping: A comparative study from the loess plateau area in shanxi (China). J. Clean. Prod. 277, 124159. doi:10.1016/j.jclepro.2020.124159
Tanyu, B. F., Abbaspour, A., Alimohammadlou, Y., and Tecuci, G. (2021). Landslide susceptibility analyses using Random Forest, C4.5, and C5.0 with balanced and unbalanced datasets. Catena 203, 105355. doi:10.1016/j.catena.2021.105355
Tsangaratos, P., and Ilia, I. (2016). Comparison of a logistic regression and Naïve Bayes classifier in landslide susceptibility assessments: The influence of models complexity and training dataset size. Catena 145, 164–179. doi:10.1016/j.catena.2016.06.004
Van Den Eeckhaut, M., Poesen, J., Gullentops, F., Vandekerckhove, L., and Hervás, J. (2011). Regional mapping and characterisation of old landslides in hilly regions using LiDAR-based imagery in Southern Flanders. Quat. Res. 75, 721–733. doi:10.1016/j.yqres.2011.02.006
Wang, Q. Q., Guo, Y. H., Li, W. P., He, J. H., and Wu, Z. Y. (2019). Predictive modeling of landslide hazards in Wen County, northwestern China based on information value, weights-of-evidence, and certainty factor. Geomatics Nat. Hazards Risk 10, 820–835. doi:10.1080/19475705.2018.1549111
Xu, C., Xu, X. W., Dai, F. C., Wu, Z. D., He, H. L., Shi, F., et al. (2013a). Application of an incomplete landslide inventory, logistic regression model and its validation for landslide susceptibility mapping related to the May 12, 2008 Wenchuan earthquake of China. Nat. Hazards (Dordr). 68, 883–900. doi:10.1007/s11069-013-0661-7
Xu, C., Xu, X. W., Yao, Q., and Wang, Y. Y. (2013b). GIS-based bivariate statistical modelling for earthquake-triggered landslides susceptibility mapping related to the 2008 Wenchuan earthquake, China. Q. J. Eng. Geol. Hydrogeology 46, 221–236. doi:10.1144/qjegh2012-006
Xu, Q., Liu, H., Ran, J., Li, W., and Sun, X. (2016). Field monitoring of groundwater responses to heavy rainfalls and the early warning of the Kualiangzi landslide in Sichuan Basin, southwestern China. Landslides 13, 1555–1570. doi:10.1007/s10346-016-0717-3
Yilmaz, I. (2009). Landslide susceptibility mapping using frequency ratio, logistic regression, artificial neural networks and their comparison: A case study from kat landslides (tokat-Turkey). Comput. Geosci. 35, 1125–1138. doi:10.1016/j.cageo.2008.08.007
Yin, K. L., and Yan, T. Z. (1988). “Statistical prediction models for slope instability of metamorphosed rocks,” in Proc 5th international symposium on landslides (Switzerland: Lausanne), 1269–1272.
Zhao, S., Chigira, M., and Wu, X. (2018). Buckling deformations at the 2017 Xinmo landslide site and nearby slopes, Maoxian, Sichuan, China. Eng. Geol. 246, 187–197. doi:10.1016/j.enggeo.2018.09.033
Zhao, S., Chigira, M., and Wu, X. (2019). Gigantic rockslides induced by fluvial incision in the Diexi area along the eastern margin of the Tibetan Plateau. Geomorphology 338, 27–42. doi:10.1016/j.geomorph.2019.04.008
Zhao, S., He, Z., Deng, J., Li, H., Dai, F., Gao, Y., et al. (2022). Giant river-blocking landslide dams with multiple failure sources in the Nu River and the impact on transient landscape evolution in southeastern Tibet. Geomorphology 413, 108357. doi:10.1016/j.geomorph.2022.108357
Keywords: landslide, Minjiang River, landslide susceptibility, statistical model, machine learning model
Citation: Ling S, Zhao S, Huang J and Zhang X (2022) Landslide susceptibility assessment using statistical and machine learning techniques: A case study in the upper reaches of the Minjiang River, southwestern China. Front. Earth Sci. 10:986172. doi: 10.3389/feart.2022.986172
Received: 04 July 2022; Accepted: 25 July 2022;
Published: 31 August 2022.
Edited by:
Shenghua Cui, Chengdu University of Technology, ChinaReviewed by:
Chengrui Chang, The University of Tokyo, JapanJiren Xie, Central South University, China
Copyright © 2022 Ling, Zhao, Huang and Zhang. This is an open-access article distributed under the terms of the Creative Commons Attribution License (CC BY). The use, distribution or reproduction in other forums is permitted, provided the original author(s) and the copyright owner(s) are credited and that the original publication in this journal is cited, in accordance with accepted academic practice. No use, distribution or reproduction is permitted which does not comply with these terms.
*Correspondence: Siyuan Zhao, zhaosiyuan@scu.edu.cn