Study on the Microscopic Pore Structures of Coal Measure Reservoirs in the Shanxi Formation, Eastern Ordos Basin
 Jiao Pengfei
 Wang Pengwan2*
 - 1PetroChina Research Institute of Petroleum Exploration and Development, Beijing, China
- 2PetroChina Hangzhou Institute of Petroleum Geology, Hangzhou, China
- 3PetroChina Key Laboratory of Unconventional Oil and Gas, Langfang, China
- 4Exploration and Development Research Institute, Changqing Oilfield, PetroChina, Xi’an, China
- 5Tuha Branch Office, China Petroleum Logging Co.LTD., Shangshan, China
The Carboniferous-Permian coal measures in China contain abundant natural gas resources. Shale, coal and tight sandstone reservoirs are developed in coal measures, and the quantitative characterization of the pore structures of different types of reservoirs can provide scientific guidance for the sweet spot prediction of tight reservoirs. In this study, taking the Shan 2 Member coal measure of the Shanxi Formation in the eastern Ordos Basin as an example, the pore structures of shale, coal rock and tight sandstone were systematically studied based on organic geochemistry, scanning electron microscopy, high-pressure mercury injection, and low-temperature N2 and CO2 adsorption experiments. The results show that the microscopic pore structures of different types of reservoirs in the Shan 2 Member coal measures are quite different. Shale and tight sandstone mainly develop clay mineral pores at mesopore scale, followed by intragranular and dissolution pores developed in quartz and feldspar minerals, while organic pores are rarely developed. A large number of macro-scale clay mineral pores and micro-fractures are developed in tight sandstone, meanwhile the pore connectivity of tight sandstone is better than that of shale. A large number of micro to nano-scale organic pores are developed in coal, and the specific surface area of micropores in coal is much larger than that of mesopores in shale and tight sandstone. Sandstone, shale, and coal are frequently interbedded in coal measure strata. Tight sandstone provide the main storage space for free gas, and pores in shale and coal absorb a large amount of natural gas. Sandstone-shale-coal assemblages and sandstone-coal assemblages are the key targets for the exploration of hydrocarbons in the Shanxi Formation coal measures in the study area.
Introduction
The Carboniferous-Permian coal measures in the Ordos Basin of China contain abundant natural gas resources, including conventional sandstone gas and unconventional natural gas (coalbed methane, shale gas, and tight sandstone gas) (Dong et al., 2016; Sun et al., 2017; Wang and Wang., 2021). Coal measures refer to sedimentary systems with similar symbiotic relationship in terms of genesis (Qin et al., 2018; Qin, 2018). Generally, the source rocks in coal measures are mainly Type III kerogen developed in coal seams, dark shales and oil shales. Furthermore, different types of natural gas generated through thermal evolution are called coal measure gas (Xue et al., 2021; Yi et al., 2018), for example, free tight sandstone gas, adsorbed coalbed methane, and both free and adsorbed shale gas (Cheng M. et al., 2018; Yao et al., 2018; Yin et al., 2018). Affected by complex depositional conditions, different types of reservoirs exhibit interbedded and cyclical characteristics in space (Liang, 2016; Yin et al., 2019; Zhang et al., 2019). The coal-measure source rocks of the Upper Paleozoic in the Ordos Basin are mainly coal seams, shale and mud-bearing biological limestone, of which coal and shale are the main gas source rocks. In addition, various types of superimposed source rocks have stable thickness and wide coverage. These factors provide a good material basis for the accumulation of coal-measure gas.
In the past, there were many examples of exploration and development of a single type of coal-measure gas. For example, the Sulige and Daniudi Gas Fields mainly develop tight sandstone gas (He et al., 2022; Qu et al., 2015); the commercial development of Upper Paleozoic gas reservoirs in the eastern margin of the Ordos Basin is mainly for coalbed methane resources (Yi et al., 2018); China’s first marine-continental transitional shale gas demonstration project will be conducted in the Daning—Jixian Block. Some scholars believe that the development of a single coal measure gas will cause waste for other types of natural gas. Furthermore, the idea of co-exploration and co-production of three types of coal measure tight gas (coalbed methane, shale gas, and tight sandstone gas) is proposed (Chen et al., 2021; Li and Li., 2021; Qin et al., 2018; Qin, 2018; Yi et al., 2018; Yin et al., 2020). The co-exploration and co-production of different types of natural gas requires a fine study of the properties of the entire coal-measure reservoirs, especially the systematic study of the gas-bearing properties and microscopic pore structures of the reservoirs (Zhang et al., 2015; Wu et al., 2017; Wu et al., 2022). High-pressure mercury intrusion experiments are usually used to analyze the microscopic pore structures of tight sandstone reservoirs. Coal rock has the characteristics of easy crushing and high ash content, so low-temperature N2 adsorption experiments are often used to study its microscopic pore structures. Pores of different scales are developed in shale reservoirs. Therefore, high-pressure mercury intrusion, low-temperature N2 and CO2 adsorptions are often combined to quantitatively characterize pore structures of different scales (Xu et al., 2020). In this study, taking the Shan 2 Member coal measure of the Shanxi Formation in the eastern Ordos Basin as an example, the pore structures of shale, coal rock and tight sandstone were systematically studied based on organic geochemistry, scanning electron microscopy, high-pressure mercury injection, and low-temperature N2 and CO2 adsorption experiments. Through this study, the dominant pore types and combinations of different types of coal-measure strata reservoirs have been clarified, which can provide a scientific basis for the co-exploration and co-production of three gases (tight sandstone gas, shale gas and coalbed methane).
Geological Background
The study area is located in the eastern margin of the Ordos Basin (Figure 1). More than 600 wells have been drilled in the study area, and the main exploration horizon is the Shan 2 Member of the Permian Shanxi Formation. The Permian in the study area belongs to the marine-continental transitional facies sediments. Among them, the lithologies of the Taiyuan Formation include quartz sandstone, shale, interbeded limestone and coal seam; while the lithologies of the Shanxi Formation include quartz sandstone, lithic quartz sandstone, medium to coarse-grained or unequal-grained lithic sandstone, while interbeded black shale, sandstone and coal seams can be seen locally. The Shan 2 Member generally has 3-5 coal-forming periods, and its lithological assemblage is mainly gray, dark gray or gray-brown medium-fine-grained sandstone and siltstone intercalated with black shale, with a thickness of about 40–60 m. According to coal measure assemblages and sedimentary cycles, the Shan 2 Member is divided into three sub-layers, Shan 21, Shan 22 and Shan 23 sub-members. Coal 4# and 5# are the boundary marker layers of Shan 21 and Shan 22, and Shan 22 and Shan 23, respectively.
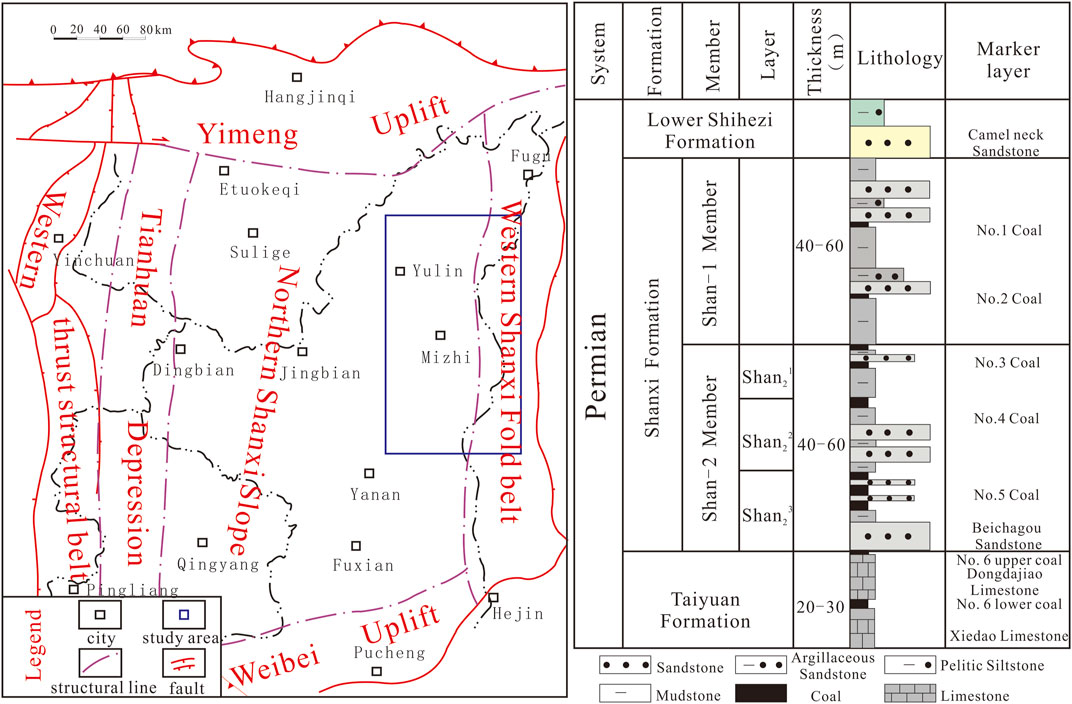
FIGURE 1. Location of the study area and lithologic histogram of the Shanxi Formation.
Materials and Methods
Samples
In this study, 20 samples were collected from the Shan 2 Member of Shanxi Formation in Well M5 in the study area, including 3 coal samples, 4 shale and 13 tight sandstone samples. The sample depth and specific lithology (including color, particle size and approximate composition content) are shown in Table 1. The particle size of tight sandstone changes frequently, and shale and coal are interspersed, which is enough to explain the rapid change of sedimentary environment. Targeted experiments were carried out on all samples.
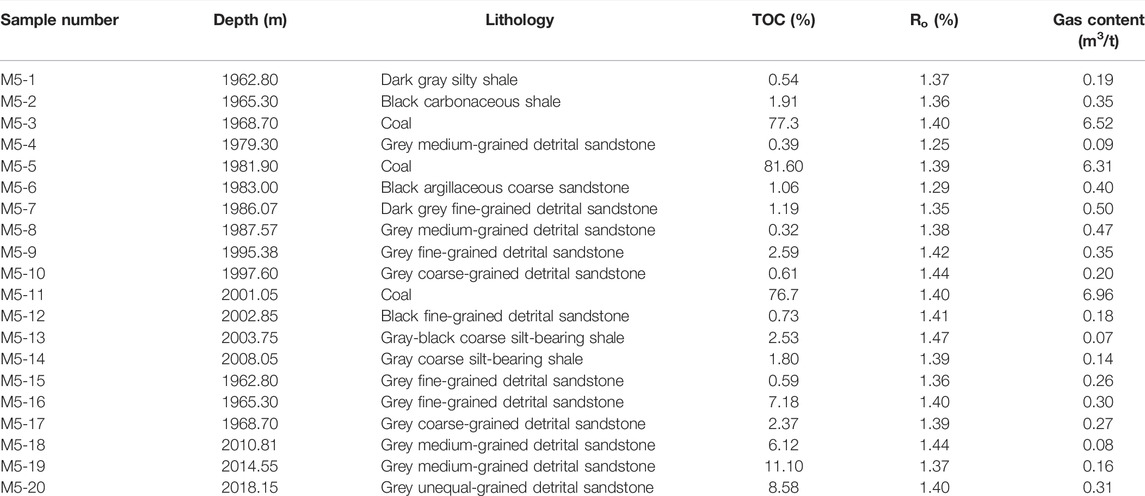
TABLE 1. Test results of organic geochemical parameters and gas-bearing properties of coal-measure samples collected from the Shanxi Formation in the study area.
Experimental Methods
Field gas content tests were conducted for different lithologies of coal measure strata in the Shan 2 Member of M5 well. Both decomposed and residual gases can be completed at the drilling site. The cores out of the barrel are immediately put into the desorption tank to be sealed and heated to the reservoir temperature. Then, a gas flow meter is used to record the analytical gas volume. The analytical gas volume test ends when the average analytical volume per day is less than or equal to 10 ml. Furthermore, the last recorded value is corrected in the standard state to obtain the analytical gas content (Zhou et al., 2019a). After the natural desorption is completed, a part of the sample is taken out, weighed, ground to below 60 mesh, and decomposed again at the reservoir temperature until the desorption amount is no more than 10 ml per day. This part of the analytical quantity is the residual gas content (National Energy Board, 2014). The time when the coring barrel is raised to half the depth of the wellbore and the time when the core enters the tank seal is recorded, and the difference between the two times is the lost time. Finally, the USBM method is used to calculate the lost gas content (Xue et al., 2013), and the sum of the analytical gas, residual gas and lost gas content is the on-site gas content.
The prepared bulk samples were polished (4 h) and carbon-plated (20 min) with a PECS II 685 argon ion polisher to enhance the flatness and conductivity of the samples. Furthermore, two-dimensional images of rock samples were performed using FEI Helios 650 dual-beam scanning electron microscope (FIB-SEM) in backscattering mode (BSE) and secondary electron mode (SE), respectively, and different minerals, organic matter and pores were distinguished (Zhou et al., 2016). A specific area on the 2D image is selected for ion beam cutting, and the electron beam is imaged for each cut. In addition, an Avizo software was utilized to perform digital core analysis on several hundred consecutively cut images, and data such as porosity, pore size, and coordination number were obtained (Zhou et al., 2018a).
A Micromeritics Instrument IV 9510 mercury porosimeter was used to perform high-pressure mercury porosimetry experiments with a maximum pressure of 60,000 psia (413 MPa). The pore throat diameter can be obtained from the relationship between the recorded injection pressure and mercury saturation, and using the Washburn equation (Washburn, 1921). Moreover, the Young-Duper equation (Guan et al., 2020) was used to obtain pore specific surface area and average pore size data. These data can be used to quantitatively characterize the microstructural features of macropores and micropores.
The Surface Area and Porosity Analyzer 2420 from Micromeritics Company was used to perform low temperature N2 and CO2 adsorption experiments on rock samples below 200 mesh. The low-temperature N2 adsorption experiments were conducted at 77 K. At this temperature, the saturated vapor pressure p0 of N2 is 0.11117 MPa, the maximum equilibrium pressure p of the experiment is atmospheric pressure (0.1013 MPa), and the relative pressure of adsorption varies from 0.0095 to 0.995. In addition, the BJH method (Barrett et al., 1951) can be used to analyze the distribution characteristics of mesopore pore size and calculate the average pore size and total pore volume; the specific surface area of the samples can be calculated by the BET equation (Brunauer et al., 1938; Zhou et al., 2019b). At this temperature, the saturated vapor pressure p0 of CO2 is 3.48 MPa. The maximum equilibrium pressure p of the experiment is consistent with the N2 adsorption, so the relative pressure of CO2 adsorption varies from 0.00001 to 0.03.
In this study, we also compared nanopore diameter, total pore volume, and specific surface area data for the shale, tight sandstone, and coal samples. The adsorption gas content of coal rock is higher than that of tight sandstone and shale. Therefore, the CO2 adsorption experiment at 273.15 K temperature was carried out on the coal rock samples. The NLDFT method (Liu et al., 2018; Zhang et al., 2017) was used to analyze the pore size distribution characteristics of coal rock micropores and was used to obtain the micropore volume, and the DR method (Dubinin and Astakhov, 1971) was used to obtain the coal rock micropore specific surface area. Furthermore, the pore volume and specific surface area of mesopores and micropores in coal rocks were compared. The above results are an important basis for judging the type of reservoir space in the rock.
Results
TOC, Maturity, Gas Content, and Mineral Compositions
The TOC content of coal-measure shale samples is between 0.54% and 2.53%, with an average value of 1.69%; the TOC content of coal samples is between 76.70% and 81.60%, with an average value of 78.53%; and the TOC value of tight sandstone samples is between 0.32% and 11.10%, with an average value of 3.29%. The organic matter maturity is between 1.25% and 1.47%, with an average value of 1.38%. The coal measure samples are in the high maturity stage, and the organic matter type is mainly type III, which mainly produces gas. The gas content of shale is between 0.07 m3/t and 0.35 m3/t, with an average value of 0.19 m3/t; the gas content of coal is between 6.31 m3/t and 6.96 m3/t, with an average value of 6.60 m3/t; and the gas content of tight sandstone is between 0.08 m3/t and 0.50 m3/t, with an average value of 0.27 m3/t (Table 1).
The TOC content of the coal samples from the Shan 2 Member in the study area is extremely high, and organic matter is the main component, followed by clay minerals, and there are almost no brittle minerals. The clay mineral content in the shale samples is higher than that in the tight sandstone, with an average value of 55.2%. However, the quartz mineral content in the shale samples is lower than that of the tight sandstone, with an average value of 40%. The content of clay minerals in the sandstone samples is not much different from that of quartz minerals. The average content of clay minerals and quartz minerals is 44.9% and 45.4%, respectively. In addition, a small amount of feldspar minerals and siderite are also developed in the sandstone samples, but pyrite is not developed (Figure 2A).
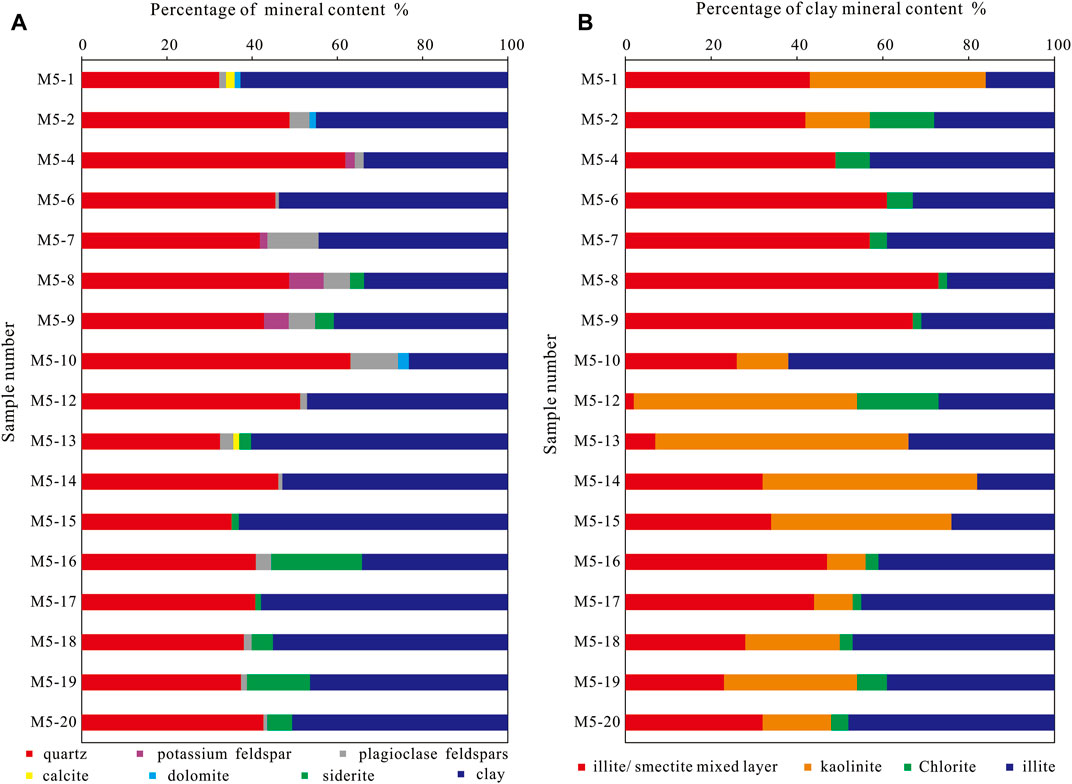
FIGURE 2. Content of mineral components in samples with different lithologies. (A) percentage of mineral content; (B) percentage of clay mineral content.
The clay minerals of shale and dense sandstone less than 2000 m mainly develop illite/smectite mixed layer and illite, but the content of illite/smectite mixed layer is higher; In addition to the development of illite/smectite mixed layer and illite, the content of kaolinite is also high in shale and dense sandstone with a buried depth of more than 2000 m, but the content of illite is higher than that of Yimeng mixed layer. Most samples contain a small amount of chlorite (Figure 2B).
Scanning Electron Microscope Observations
Observing a large number of SEM images, it is found that, unlike the marine shales of the Wufeng Formation-Longmaxi Formation in the Sichuan Basin with high organic matter content, only a small amount of organic matter can be observed in the shale and tight sandstone samples of the Shan 2 Member in the study area. A small amount of organic matter pores developed at the edge of organic matter and its contact with clay minerals (Figure 3A, Figure 3F). The organic matter edge fractures are easily formed at the parts where the organic matter is in contact with the brittle minerals (Figure 3H). Some organic matter edge fractures cut through the organic matter, thus effectively connecting the pore clusters in different parts. Unlike shale and tight sandstone, the coal rock in the target layer has a high content of organic matter, and a large area of organic matter can be seen on the SEM image of the coal rock (Figure 3K). The study found that organic pores in coal rocks are not well developed (Figure 3L), but there are a large number of micro-fractures in the edges and interiors of organic matter in coal rocks. In addition, no organic bubble pores were found in the coal measure strata. The reason is that the type of organic matter in the Shan 2 Member coal-measure strata is mainly type III, which mainly produces gas and hardly produces liquid hydrocarbons. At the same time, the reflectivity of vitrinite is less than 1.5%, and it is in a high maturity stage. There is no liquid hydrocarbon cracking and gas generation process, and organic matter bubble pores cannot be formed.
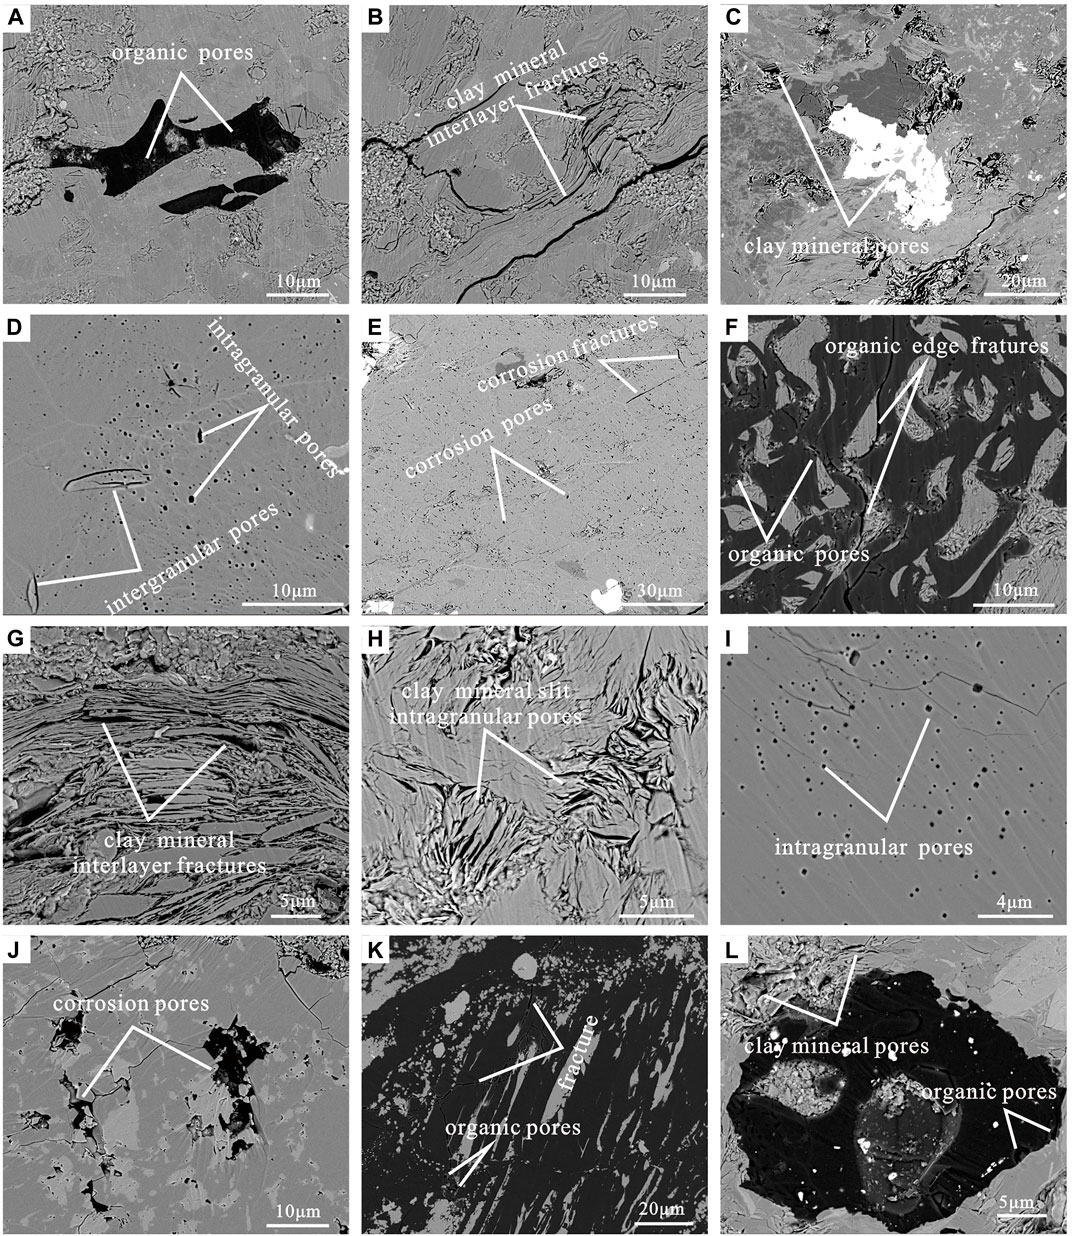
FIGURE 3. Development characteristics of different types of pores of the coal measure samples collected from the M5 well in the Shan 2 Member. Notes: (A) M5-1, Organic pores in shale; (B) M5-1 and (C) M5-14, Interlayer micro-fractures and pores in clay minerals in shale; (D) M5-14 Intragranular and intergranular pores in shale; (E) M5-13, Feldspar dissolution pores and micro-fractures in shale; (F) M5-16, Organic pores and organic edge micro-fractures in tight sandstones; (G) M5-7 and (H) M5-9, Interlayer micro-fractures and micropores in clay minerals in tight sandstone; (I) M5-7, Quartz intragranular pores in tight sandstone; (J) M5-4, Feldspar dissolution pores in tight sandstone; (K) M5-3, Organic pores and micro-fractures developed in coal; (L) M5-11, Clay mineral pores in coal.
Clay mineral pores (Figures 3C,H,L) are the most common type of mineral matrix pores within different lithologies in coal measure strata. Smectite and Aemon mixed layer clay minerals are dominated by slit-like pores. The pores of montmorillonite clay minerals are book-like (Figure 3L), and the long axis of the pore diameter is very long; while the pores of clay minerals with higher illite content are hair-like and the long axis of the pore diameter is short (Figure 3C). Clay minerals are mostly sheet-like structures, and the hydrodynamic conditions under which they are deposited are very weak. Layered clay minerals are formed by gravitational accumulation in a suspended state. Therefore, the interlayer fractures of clay minerals in the Shan 2 Member coal measure strata are very developed (Figures 3B,G), which increases the connectivity with other pores. A large number of round or elliptical intragranular pores are developed in brittle minerals in the Shan 2 Member shale and tight sandstone (Figures 3D,I). Feldspar and calcite minerals are easily dissolved by formation fluids to form dissolution pores (Figures 3E,J), and they are easily eroded to form dissolution micro-fractures under strong extrusion. In addition, a small number of slit-like intergranular pores are visible in the brittle minerals (Figure 3D). Compared with tight sandstone, the dissolution pores of shale have smaller pore size, more regular shape, and a certain fixed expansion direction.
High Pressure Mercury Intrusion Results
The high-pressure mercury intrusion curves of the three samples with different lithologies in the coal measure strata are quite different (Figure 4). It shows that there are great differences in the development of pores and the connectivity between pores among the samples. The mercury injection pressure of coal-measure shale is about 1 MPa. When the mercury injection pressure is less than 1 MPa, there is almost no mercury injection, indicating that pores larger than 1 μm are not developed. Moreover, the amount of mercury injected in the pressure range of 1–10 MPa is less, indicating that the pores of 100 nm–1 μm are less developed. However, when the pressure is between 10 and 100 MPa, the mercury injection rate increases rapidly, and pores of 10–100 nm are well-developed. When the pressure is greater than 100 MPa, the mercury injection amount quickly reaches the maximum value, indicating that the pores smaller than 10 nm in the shale are extremely developed. Compared with shale, there are few pores with pore size larger than 1 μm in the Shan 2 Member coal rock, and pores with pore size in the range of 50 nm–1 μm are hardly developed, but pores with pore size less than 50 nm are very developed. In the coal-measure strata, the pores with pore size larger than 1 μm are less developed in the tight sandstone, and the pores smaller than 1 μm are very developed. The mercury removal efficiency of tight sandstone is between 20% and 40%, indicating that its pore connectivity is poor. The mercury removal efficiency of shale and coal is much higher than that of tight sandstone. Due to the excessive pressure in the coal rock and shale in the later stage of the mercury injection process, the opening of micro-fractures can allow the mercury to exit quickly.
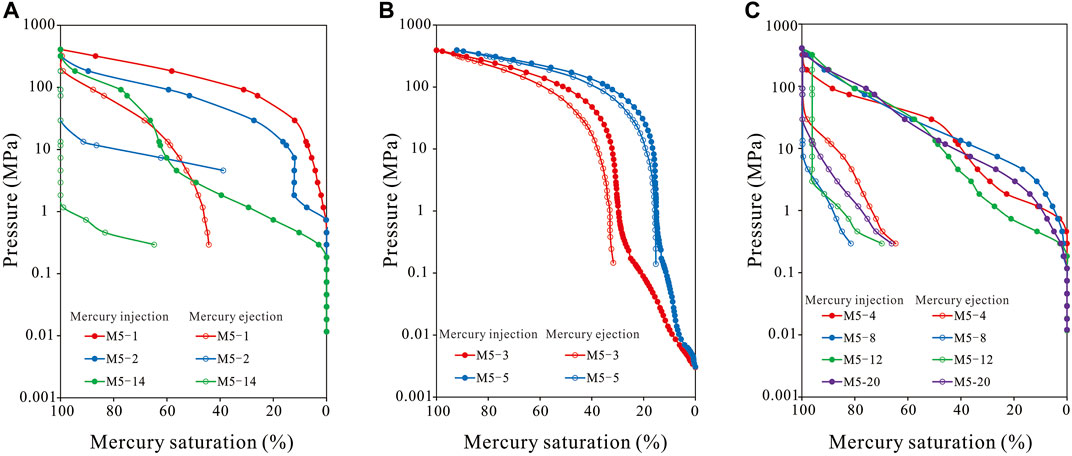
FIGURE 4. High pressure mercury intrusion curves of typical samples collected from the Shan 2 Member. (A) Shale; (B) Coal; (C) Tight sandstone.
High-pressure mercury intrusion can characterize the pore structures of microscopic pores in the range of 3 nm–410 μm. According to the pore size distribution curve of shale samples (Figure 5A), it can be judged that pores smaller than 10 nm and larger than 20 μm are relatively developed, and pores between 10 nm and 20 μm are basically not developed; pores larger than 20 μm may be caused by micro-fractures formed by excessive injection pressure. The mercury intrusion pore size distribution curve of coal rock (Figure 5B) shows that pores below 100 nm are very developed, and pores or micro-fractures with pore size larger than 1 μm are developed as well. For tight sandstones (Figure 5C), the mercury intrusion pore size distribution curve results show that the pores with full pore size from 3 nm to 410 μm are relatively developed, and the pores smaller than 1 μm are more developed than those in other intervals, and the pores or micro-fractures larger than 1 μm are also more well-developed.
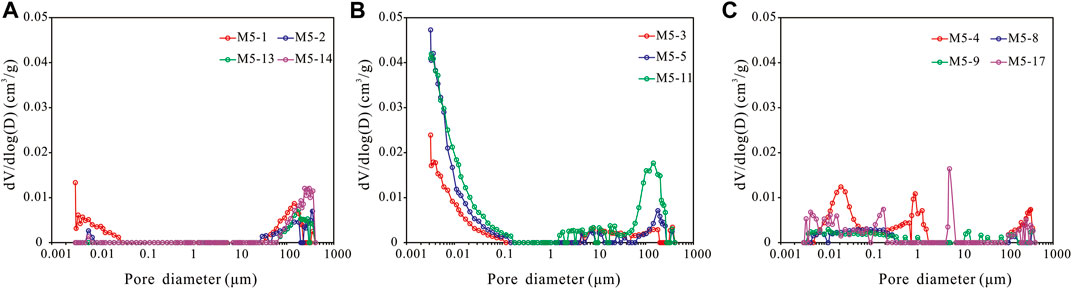
FIGURE 5. Typical mercury intrusion pore size distribution curves for samples with different lithologies that collected from the Shan 2 Member. (A) Shale; (B) Coal; (C) Tight sandstone.
Low Temperature N2 Adsorption Results
The nitrogen adsorption isotherms of shale, coal and tight sandstone samples taken from the Shan 2 Member coal measures are all S-type, that is, typical IV-type isotherms (Xi et al., 2016; Zhou et al., 2018b) (Figure 6). The shale and tight sandstone samples in the coal measure have similar nitrogen adsorption capacity, and their hysteresis loop is obvious (H3 type), which means that the mesopores are relatively developed. And their desorption branches all experienced sudden evaporation when p/p0 = 0.45. It shows that there are fine neck-shaped pores or ink bottle-shaped pores (Liu et al., 2018) in both shale and tight sandstone in coal measures. The nitrogen adsorption capacity of the coal rock in the Shan 2 Member is very low, and the hysteresis loop is very small. The adsorption and desorption curves almost coincided. This shows that the coal rock mainly develops semi-open pores, which are favorable for natural gas adsorption, but not conducive to gas flow. The adsorption branches of the three types of rocks in the marine-continental transitional coal measure have obvious capillary condensation when the p/p0 is about 0.9. That is, the amount of adsorption increases sharply and does not reach saturation. This shows that the shale, coal and tight sandstone in the coal measures all develop micro-fractures or parallel plate-like pores.
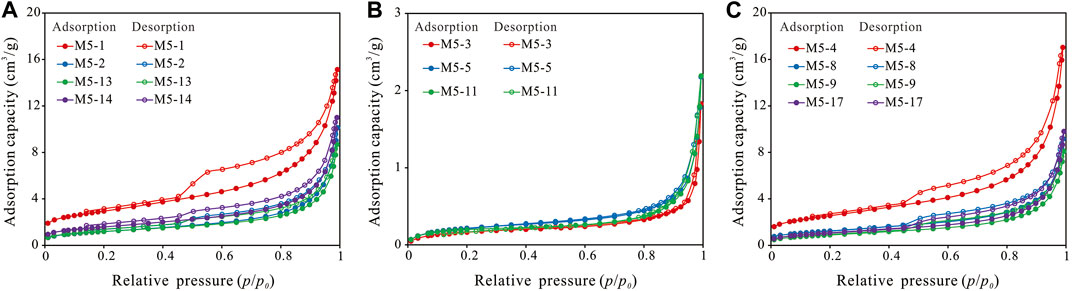
FIGURE 6. N2 adsorption curves of different samples. (A) Shale; (B) Coal; (C) Tight sandstone.
The nitrogen adsorption curves of shale and tight sandstone in coal measures are similar, and the pore size distribution curves obtained by the BJH method are also similar (Figure 7). There is a lower peak at the pore size between 2 and 4 nm, and the pore volume change rate increases rapidly in the pore size range of 5–40 nm, and then a wider peak appears. Although the first peak with a pore size between 2 and 4 nm is relatively low, because the single pore size is very small, the micropores at the peak position are very developed. On the contrary, the broad peak after 40 nm has a large single pore volume, but the number of pores is small. By comparison, it is found that pores between 2 and 10 nm in shale and tight sandstone in coal measures are well developed, pores between 10 and 50 nm are also well developed, and pores with pore diameter larger than 50 nm are rare. The broad peak of the tight sandstone is wider than that of the shale, indicating that the pore size of the tight sandstone is larger than that of the shale. The pore size distribution curve of coal is quite different from that of shale and tight sandstone, and the two peaks are not obvious. In addition, the pore volume change rate of coal is an order of magnitude smaller than that of shale and tight sandstone, indicating that pores with a pore size larger than 2 nm are less developed in coal.
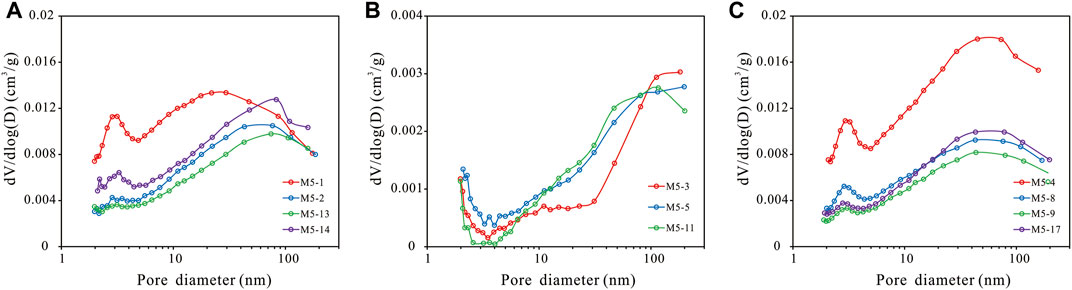
FIGURE 7. Nitrogen adsorption pore size distribution curves of different samples. (A) Shale; (B) Coal; (C) Tight sandstone.
Low Pressure CO2 Adsorption Results
The pore size distribution characteristics of macropores show that pores with pore diameters less than 100 nm are more developed in coal rocks than in shale and tight sandstones. This result is consistent with the gas content of coal generally higher than that of shale and tight sandstone. However, the distribution of mesopore size shows that pores with a pore size larger than 2 nm are not well developed in coal rocks. The natural gas in the coal rock mainly exists in the form of adsorption, and the coal rock mainly develops micropores with a diameter of less than 2 nm. Therefore, we conducted the low-temperature CO2 adsorption experiment of coal rock for its special pore size. Comparing the CO2 and N2 adsorption curves of coal rocks in coal measures (Figure 8A), it can be seen that the maximum adsorption capacity of CO2 adsorption is about 5 times that of N2 adsorption. It is almost equal to the N2 adsorption capacity of shale and tight sandstone, indicating that there is a larger actual total specific surface area in coal. The study also found that the pore volume change rate of micropores inside coal rocks in coal measures is an order of magnitude larger than that of mesopores in shale and tight sandstone (Figure 8B). This indicates that the actual total pore volume of the coal rock is relatively large, and the micropores in the two intervals of 0.5–0.7 nm and 0.8–0.9 nm are extremely developed.
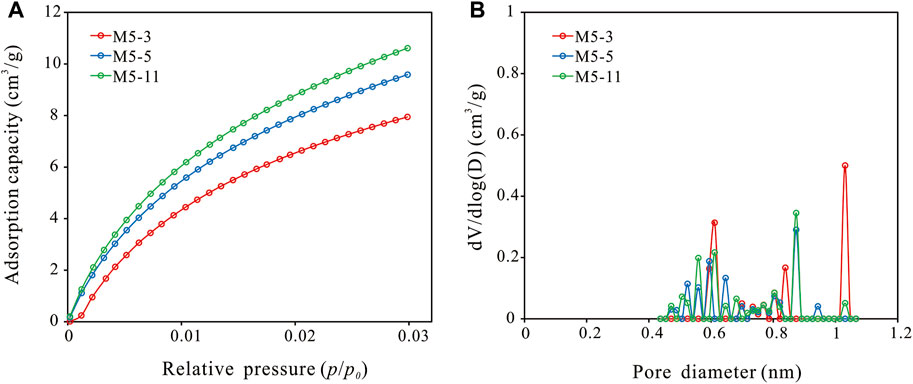
FIGURE 8. CO2 adsorption characteristics and micropore size distribution of coal samples. (A) Low temperature carbon dioxide isotherm adsorption curves; (B) Pore size distribution.
Discussion
Comparison of Specific Surface Area and Pore Volume
In this study, BET specific surface area and BJH pore volume were used to compare the differences in the microscopic pore structures of shale, coal and tight sandstone in coal measures. The BET specific surface area of shale ranges from 4.25 m2/g to 10.40 m2/g, with an average value of 6.15 m2/g; the total pore volume of BJH ranges from 0.0134 ml/g to 0.0232 ml/g, with an average value of 0.0174 ml/g; the average pore diameter is 12.82 nm. The BET specific surface area of coal rock is in the range of 0.63 m2/g–0.81 m2/g, with an average value of 0.72 m2/g; the total pore volume of BJH is in the range of 0.0028 ml/g–0.0034 ml/g, with an average value of 0.0032 ml/g; the average pore diameter is 20.93 nm. The BET specific surface area of tight sandstone ranges from 2.05 m2/g to 9.12 m2/g, with an average value of 5.03 m2/g; the total pore volume of BJH ranges from 0.0099 ml/g to 0.0269 ml/g, with an average value of 0.0173 ml/g; the average pore diameter is 14.20 nm.
The pore characteristics of shale and tight sandstone in the Shan 2 Member coal measures are similar. Most shale and tight sandstones have BET specific surface areas below 6 m2/g (Figure 9A) and BJH pore volumes within 0.02 ml/g (Figure 9B). This shows that the development of pores in the mesopore range of shale and tight sandstone is similar. However, due to the rapid changes in the sedimentary environment of the marine-continental transition facies reservoir, and the different hydrodynamic conditions, the sedimentary particle size and arrangement of the tight sandstone are different, resulting in a large heterogeneity of its own pore structures. On the other hand, the shale sedimentary water body is calm and the sedimentary particle size is uniform, so the pore structure heterogeneity of shale is small.
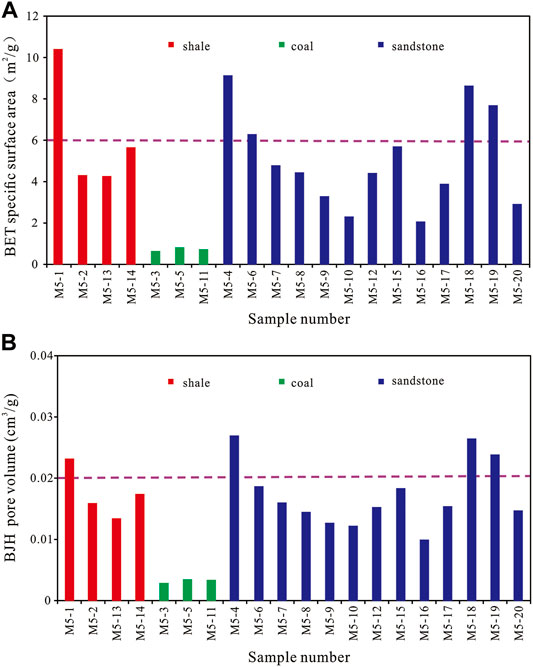
FIGURE 9. Comparison of BET specific surface area and BJH pore volume of different kinds of samples. (A) BET specific surface area; (B) BJH pore volume.
The BET specific surface area and BJH pore volume of coal in the Shan 2 Member are much smaller than those of shale and tight sandstone. Comparing the relationship between the BET specific surface area and gas content (Figure 10A), it is found that the coal rock has a small BET specific surface area and a high gas content, which is not in line with common sense. Using the DR equation, the micropore specific surface area in the coal sample is 121.63 m2/g, which is much higher than the BET specific surface area of the shale and tight sandstone samples in the coal measure. It further proves that the micropores of coal rocks in coal measure are extremely developed. It can be seen from Figure 10B that the high specific surface area of coal is matched with its high gas content. Previous studies have found that the DR specific surface area and DR pore volume of shale are far less than those of coal, and it is also proved that the specific surface area of coal and shale is positively correlated with gas content (Zhou et al., 2019c).
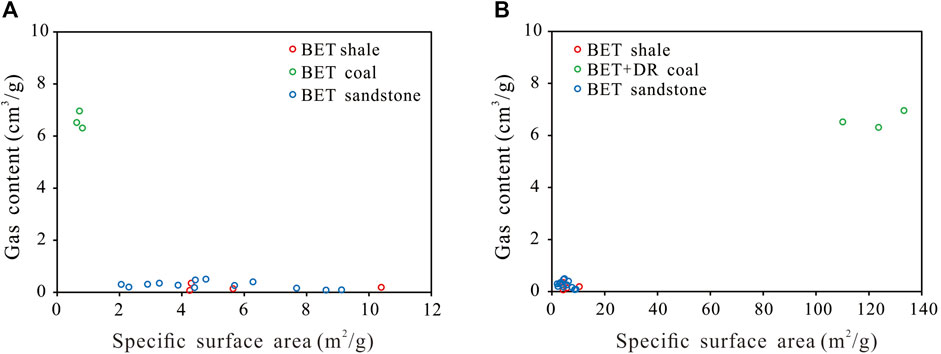
FIGURE 10. Correlation analysis between specific surface area and gas content. (A) Correlation analysis between BET specific surface area and gas content. (B) On the basis of Panel A, the BET specific surface area of coal is added with Dr specific surface area.
Development Degree and Connectivity of Pores
Scanning electron microscope image analysis shows that clay mineral pores and clay mineral interlayer fractures are mainly developed in the shale and tight sandstone of the Shan 2 Member. Followed by a large number of round or angular intragranular pores and irregular dissolution pores developed in quartz and feldspar minerals. However, organic matter bubble pores do not develop. The pore size distribution analysis shows that the mesopores in the shale and tight sandstone in the coal measures are relatively developed, that is, the pores with the pore diameter of 2–10 nm are developed, and the pores with the pore diameter of 10–50 nm are also relatively developed. Pores with a pore size larger than 50 nm are more developed in tight sandstone than in shale. In addition, shale and tight sandstone in coal measures are mainly composed of clay minerals and quartz minerals, and clay mineral pores and clay mineral interlayer micro-fractures are the main types of pores. Therefore, the content of clay minerals is the main factor affecting the development of pores; the pores of organic matter are hardly developed, and it is speculated that the content of organic matter has little effect on the development of pores.
In order to verify the accuracy of the inference, the clay mineral content, quartz mineral content and TOC content of shale and tight sandstone were linearly fitted with the BET specific surface area and BJH pore volume, respectively. The analysis found that clay mineral content had a good positive correlation with BET specific surface area (Figure 11A) and BJH pore volume (Figure 11D). This indicates that the increase of clay mineral content makes clay mineral pores and clay mineral interlayer fractures more developed. The content of quartz minerals has a relatively obvious negative correlation with them (Figures 11B,E). An increase in the content of quartz minerals resulted in a decrease in the content of clay minerals. Although there are many intragranular pores developed in quartz minerals, the content of intragranular pores cannot be compared with that of clay minerals, so the total number of pores will decrease. There was no obvious correlation between organic carbon content and BET specific surface area (Figure 11C) and BJH pore volume (Figure 11F). This is because organic pores are not well developed in shale and tight sandstone in coal measures.
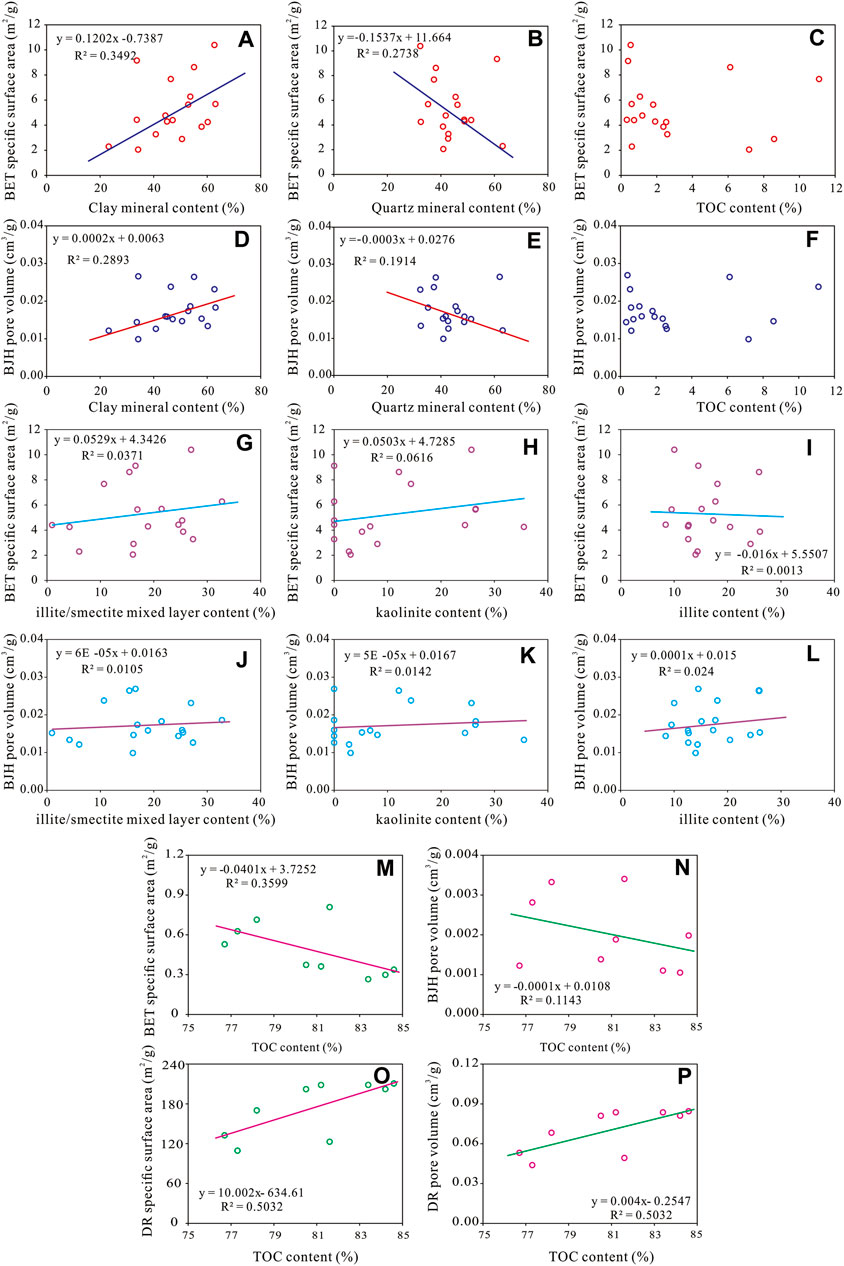
FIGURE 11. Correlation analysis of factors influencing pore development. (A–C) Correlation between clay, quartz, organic carbon and BET specific surface area in shale and tight sandstone. (D–F) Correlation between clay, quartz, organic carbon and BJH pore volume in shale and tight sandstone. (G–I) Correlation between illite/smectite mixed layer, kaolinite, illite and BET specific surface area in shale and tight sandstone. (J–L) Correlation between illite/smectite mixed layer, kaolinite, illite and BJH pore volume in shale and tight sandstone. (M) Correlation between TOC and BET specific surface area in coal. (N) Correlation between TOC and BJH pore volume in coal. (O) Correlation between TOC and DR specific surface area in coal. (P) Correlation between TOC and DR pore volume in coal.
In order to clarify which clay mineral is the most important factor affecting the pore development of coal measure shale and tight sandstone, the content of different types of clay minerals is regressed with the specific surface area and volume of mesopores. Because the content of chlorite is low and chlorite is not developed in some samples, chlorite is not analyzed. The results show that none of the three clay minerals has a very obvious effect on pore development. The increase of illite/smectite mixed layer and kaolinite content has a weak promoting effect on BET specific surface area and BJH pore volume (Figures 11G,H,J,K), while the illite content has no obvious correlation with mesopore specific surface area (Figure 11I), but has a weak positive effect on mesopore volume (Figure 11L). Therefore, it is inferred that the pores developed by a single clay mineral do not play a key role in the increase of BET specific surface area and BJH pore volume, but the development of pores of a variety of clay minerals jointly promote the growth of mesoporous reservoir space.
The main component of coal rock in the Shan 2 Member coal measures is organic matter. At the same time, the analysis of pore size distribution shows that there are mainly micropores smaller than 2 nm in the coal rock, while there are few mesopores. Therefore, the content of organic matter is the main factor affecting the development of pores. Due to the limited number of data points, we added the coal samples of Taiyuan Formation and Benxi Formation in the same well, which belong to the coal measure strata of marine-continental transitional. The correlations between BET specific surface area (Figure 11M), BJH pore volume (Figure 11N), DR specific surface area (Figure 11O) and DR pore volume (Figure 11P) and organic matter content were compared respectively. It can be clearly seen from the figure that the TOC content of coal samples is negatively correlated with the specific surface area and volume of mesopores, but opposite to the specific surface area and volume of micropores. It shows that the organic matter in coal mainly develops micropores, and the development of micropores has an obvious inhibitory effect on mesopores.
The 2D SEM image can be used to clearly observe the structure of a certain section of the pore, and it can also be used to extract the equivalent circle diameter of the pore and calculate the surface porosity based on image analysis software (Bai et al., 2018; Cheng Z. H. et al., 2018; Jiao et al., 2014). Surface porosity data can only be equivalent to porosity when the formation is homogeneous. However, coal measures have strong heterogeneity, so it is impossible to accurately analyze the pore microstructure using only two-dimensional image analysis data.
A large number of clay mineral pores are developed in the shale and tight sandstone in the target layer. Therefore, areas with well-developed clay mineral pores were selected for section imaging, from a black carbonaceous shale sample (M5-2) and a dark grey fine-grained detrital sandstone sample (M5-7). Furthermore, 3D digital core simulation was performed using Avizo software (Wang et al., 2021) (Figures 12A,D), and clay mineral pores were extracted separately for analysis (Figures 12B,E). 2878 clay mineral pores were extracted from the coal measure shale sample. The pore diameter is between 6.57 and 504.56 nm, with an average value of 29.92 nm; and 3217 clay mineral pores were extracted from the tight sandstone sample. The pore size is in the range of 7.28–960.97 nm, with an average value of 54.20 nm. This indicates that the clay mineral pores in the tight sandstone sample in the Shan 2 Member coal measures are more developed than those in the shale. In addition, we calculated the porosity of two rock samples, 1.08% for the shale sample and 4.04% for the tight sandstone sample. Tight sandstone can provide more storage space for natural gas.
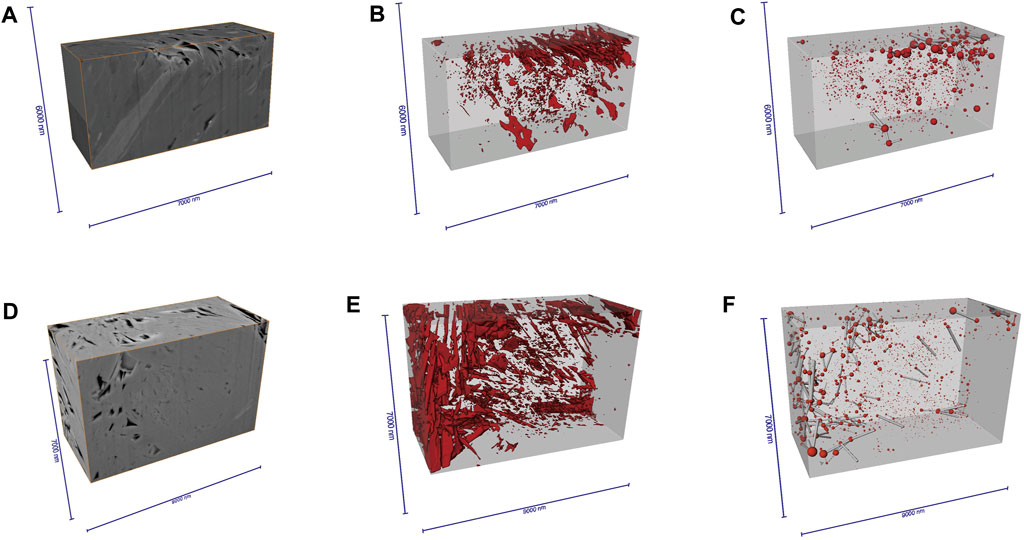
FIGURE 12. Digital cores of shale and tight sandstone samples. (A), (B) and (C) M5-2 well, black carbonaceous shale; (D), (E) and (F) M5-7 well, Dark grey fine-grained detrital sandstone.
The pore network models of clay minerals in shale and tight sandstone in the Shan 2 Member are shown in Figure 12C and Figure 12F. The pore coordination numbers of the extracted samples are shown in Figure 13. Pore coordination number refers to the number of throats connecting a single pore to other pores. The greater the frequency of high coordination number, the better the connectivity between pores. The comparison shows that the coordination numbers of shale and tight sandstone are mainly between 1 and 2, indicating that their pore connectivity is poor. However, the frequency of tight sandstone coordination numbers between 1 and 2 is about three times that of shale, and there are coordination numbers in the range of 3–7. It shows that the connectivity of pores in the tight sandstone in the Shan 2 Member is higher than that in shale, which is beneficial to the flow of natural gas.
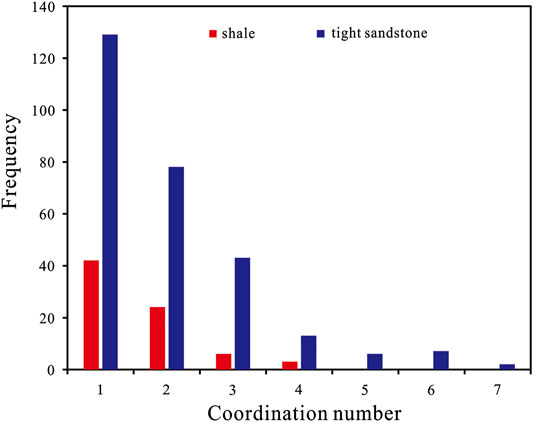
FIGURE 13. Histograms of frequency distributions of coordination numbers for shale and tight sandstone samples.
Pore Assemblages of Coal Measures
A large number of organic matter nanopores are developed in the marine shale of the Wufeng-Longmaxi Formation in the Sichuan Basin (Zou et al., 2018; Ma et al., 2020a; Ma et al., 2020b). Micropores and mesopores provide the main storage space for adsorbed and free gases. At the same time, most of the free gas occurs in macropores larger than 50 nm. Various scales of organic pores are developed in marine shale (Zou et al., 2017; Dong et al., 2018; Hu et al., 2017), and both free gas and adsorbed gas account for a large proportion. Therefore, marine shale gas wells can achieve high production in the early stage of production, and can maintain stable production for a long time. Considering the whole coal measure of the Shan 2 Member as a gas-bearing whole, the coal rock develops a large number of micropores less than 2 nm, which can absorb a large amount of natural gas. The organic pores in shale and tight sandstone are not well developed, but a large number of mesoporous clay mineral pores and quartz mineral intragranular pores are developed. The pore surface of clay minerals has strong adsorption capacity and can absorb a large amount of natural gas. Intragranular pores of quartz minerals can provide storage space for free gas. There are also a large number of micron-scale clay mineral interlayer micro-fractures and pores in the tight sandstone, which can store a large amount of free gas.
The pore assemblage of the entire coal measure is similar to the pore system of different scales inside the marine shale (Figure 14). Sandstone, shale and coal are frequently interbedded in the marine-continental transitional coal measures, and the natural gas generated from shale and coal can quickly migrate to the nearby tight sandstone through the interlayer fractures of clay minerals, and can also be adsorbed in the pores of clay minerals and coal. Free gas in tight sandstone can achieve high initial production, and adsorbed gas in coal and shale can ensure long-term stable production. Therefore, a better interbed combination of sandstone, shale and coal is expected to achieve high-efficiency three-gas commingled production. Among coal measures, interbedded sandstone and coal assemblages are also a good combination for coal measure gas exploitation, and sandstone and coal assemblages are extremely common.
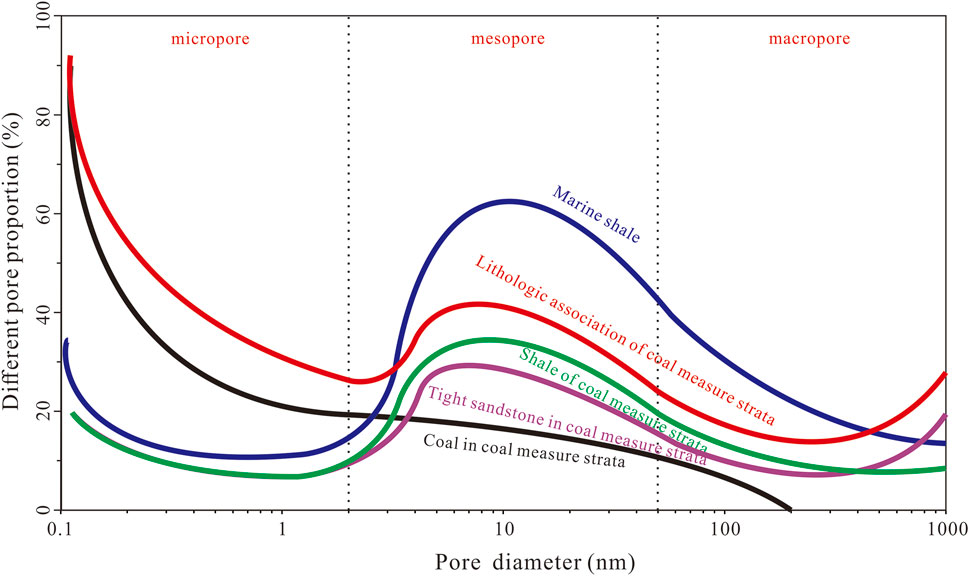
FIGURE 14. Proportion of pores of different scales in different types of coal measure reservoirs.
Conclusion
In this study, taking the Shan 2 Member coal measure of the Shanxi Formation in the eastern Ordos Basin as an example, the pore structures of shale, coal rock and tight sandstone were systematically studied based on organic geochemistry, scanning electron microscopy, high-pressure mercury injection, and low-temperature N2 and CO2 adsorption experiments. The conclusions are as follows:
1) The microscopic pore structures of different types of reservoirs in Shan 2 Member coal measures are quite different. Shale and tight sandstone mainly develop clay mineral pores at mesopore scale, followed by intragranular pores and dissolution pores developed in quartz and feldspar minerals, while organic pores are rarely developed. A large number of macro-scale clay mineral pores and micro-fractures are developed in tight sandstone, so its pore connectivity is better than that of shale. A large number of micropore-scale organic nano-pores are developed in coal, and the micropore specific surface area of coal is much larger than the mesopore specific surface area of shale and tight sandstone.
2) The content of clay minerals is the main factor affecting the development of pores in coal-measure shale and tight sandstone. The content of clay minerals is significantly positively correlated with BET specific surface area and BJH pore volume, but negatively correlated with quartz mineral content. There was no obvious correlation between TOC content and BET specific surface area and BJH pore volume.
3) Sandstone, shale, and coal are frequently interbedded in coal measure strata. Tight sandstone can provide the main storage space for free gas, and pores in shale and coal can absorb a large amount of natural gas. Sandstone-shale-coal assemblages and sandstone-coal assemblages are the key targets for hydrocarbon exploration in the Shanxi Formation coal measures in the study area.
Data Availability Statement
The original contributions presented in the study are included in the article/Supplementary Materials, further inquiries can be directed to the corresponding author.
Author Contributions
JP: experiment, data analysis and interpretation, writing papers WP: provide theoretical guidance ZS: experimental theory and operation guidance WH: provide some information CX: provide some information.
Funding
This study was jointly funded by the National Natural Science Foundation of China (Grant No. 2020YFA0710601-01-01) and the science and technology project of CNPC (Grant No. kt2021-06-03).
Conflict of Interest
The authors JP and ZS are employed by PetroChina Research Institute of Petroleum Exploration and Development. The author WP is employed by PetroChina Hangzhou Institute of Petroleum Geology. The author ZS is employed by PetroChina Key Laboratory of Unconventional Oil and Gas. The author WH is employed by Changqing Oilfield, PetroChina. The author CX is employed by China Petroleum Logging Co.LTD.
Publisher’s Note
All claims expressed in this article are solely those of the authors and do not necessarily represent those of their affiliated organizations, or those of the publisher, the editors and the reviewers. Any product that may be evaluated in this article, or claim that may be made by its manufacturer, is not guaranteed or endorsed by the publisher.
References
Bai, M, G., Xia, X. H., Zhang, C., Meng, F-Y, Yang, Y-R, Zhang, C-H, et al. (2018). Study on Shale Organic Porosity in the Longmaxi Formation, AnYe - 1 Well Using Field Emission-Scanning Electron Microscopy and PerGeos System. Rock Mineral Analysis 37 (03), 225–234. doi:10.15898/j.cnki.11-2131/td.201803260030
Barrett, E. P., Joyner, L. G., and Halenda, P. P. (1951). The Determination of Pore Volume and Area Distributions in Porous Substances. I. Computations from Nitrogen Isotherms. J. Am. Chem. Soc. 73 (73), 373–380. doi:10.1021/ja01145a126
Brunauer, S., Emmett, P. H., and Teller, E. (1938). Adsorption of Gases in Multimolecular Layers. J. Am. Chem. Soc. 60 (60), 309–319. doi:10.1021/ja01269a023
Chen, G. B., Li, T., Yang, L., Zhang, G. H., Li, J. W., and Dong, H. J. (2021). Mechanical Properties and Failure Mechanism of Combined Bodies with Different Coal-Rock Ratios and Combinations. J. Min. Strata Control Eng. 3 (2), 023522. doi:10.13532/j.jmsce.cn10-1638/td.20210108.001
Cheng, M., Fu, X. H., Zhang, M., Cheng, W-P, and Qu, L-Z, (2018a). Comparative Study on Porosjity and Permeability in Net Confining Stress of Three Natural Gases in Coal Series Reservoirs in Guxian County, Qinshui Basin. Nat. Gas. Geosci. 29 (08), 1163–1171. doi:10.11764/j.issn.1672-1926.2018.05.013
Cheng, Z., Xue, H., Li, W., Lu, S., and Zhou, N, (2018b). Quantitative Characterization of Reservoir Space of Tight Sandsto;nes Based on a Large-View FE-SEM Splicing Technology: a Case Study on the Hetaoyuan Formation in Biyang Sag. China Pet. Explor. 23 (05), 79–87. doi:10.3969/j.issn.1672-7703.2018.05.010
Dong, D., Wang, Y., Li, X., Zou, C., Guan, Q., Zhang, C., et al. (2016). Breakthrough and Prospect of Shale Gas Exploration and Development in China. Nat. Gas. Ind. 36 (01), 19–32. doi:10.1016/j.ngib.2016.02.002
Dong, D., Shi, Z., Giang, Q., Jiang, S., Zhang, M., Zhang, C., et al. (2018). Progress, Challenges and Prospects of Shale Gas Exploration in the Wufeng-Longmaxi Reservoirs in the Sichuan Basin. Nat. Gas. Ind. 38 (04), 67–76. doi:10.1016/j.ngib.2018.04.011
Dubinin, M. M., and Astakhov, V. A. (1971). Description of Adsorption Equilibria of Vapors on Zeolites over Wide Ranges of Temperature and Pressure. Adv. Chem. 102, 69–85. doi:10.1021/ba-1971-0102.ch044
Guan, M., Liu, X., Jin, Z., and Lai, J. (2020). The Heterogeneity of Pore Structure in Lacustrine Shales: Insights from Multifractal Analysis Using N2 Adsorption and Mercury Intrusion. Mar. Petroleum Geol. 114, 104150. doi:10.1016/j.marpetgeo.2019.104150
He, D. B., Ji, G., and Jiang, Q. F. (2022). Differential Development Technological Measures for High-Water-Cut Tight Sandstone Gas Reservoirs in Western Area of Sulige Gas Field. Nat. Gas. Ind. 42 (1), 73–82. doi:10.3787/j.issn.1000-0976.2022.01.007
Hu, H., Hao, F., Lin, J., Lu, Y., Ma, Y., and Li, Q. (2017). Organic Matter-Hosted Pore System in the Wufeng-Longmaxi (O 3 W-S 1 1) Shale, Jiaoshiba Area, Eastern Sichuan Basin, China. Int. J. Coal Geol. 173, 40–50. doi:10.1016/j.coal.2017.02.004
Jiao, K., Yao, S. P., Wu, H., Li, M., and Tang, Z (2014). Advances in Characterization of Pore System of Gas Shales. Geol. J. China Univ. 20 (01), 151–161. doi:10.16108/j.issn1006-7493.2014.01.009
Li, L., and Li, S. J. (2021). Evolution Rule of Overlying Strata Structure in Repeat Mining of Shallow Close Distance Seams Based on Schwarz Alternating Procedure. J. Min. Strata Control Eng. 3 (2), 023515. doi:10.13532/j.jmsce.cn10-1638/td.20210225.001
Liang, B., Shi, Y. S., Sun, W. J., and Liu, Q (2016). Reservoir Forming Characteristics of “The Three Gases” in Coal Measure and the Possibility of Commingling in China. J. China Coal Soc. 41 (01), 167–173. doi:10.13225/j.cnki.jccs.2015.9016
Liu, K., Ostadhassan, M., and Kong, L. (2018). Multifractal Characteristics of Longmaxi Shale Pore Structures by N2 Adsorption: A Model Comparison. J. Petroleum Sci. Eng. 168, 330–341. doi:10.1016/j.petrol.2018.04.072
Ma, X. H., Xie, J., and Yong, R. (2020a). Geological Characteristics and High Production Control Factors of Shale Gas in Silurian Longmaxi Formation, Southern Sichuan Basin, SW China. Petroleum Explor. Dev. 47 (05), 1–15. doi:10.1016/s1876-3804(20)60105-7
Ma, X., Li, X., Liang, F., Wan, Y, Shi, Q, Wang, Y, et al. (2020b). Key Control Factors of Well Performance and Development Strategies Optimization in the Weiyuan Shale Gas Play, Sichuan Basin, SW China. Petroleum Explor. Dev. 47 (03), 1–9. doi:10.1016/s1876-3804(20)60076-3
National Energy Board. (2014). SY/T6940-2013 Shale Gad Content Determination Method[S]. Beijing: Petroleum Industry Press.
Qin, Y., Wu, J. G., and Shen, J. (2018). Frontier Research of Geological Technology for Coal Measure Gas Joint-Mining. J. China Coal Soc., 43(6): 1504–1516. doi:10.13225/j.cnki.jccs.2018.4034
Qin, Y. (2018). Research Progress of Symbiotic Accumulation of Coal Measure Gas in China. Nat. Gas. Ind. 38 (04), 26–36. doi:10.1016/j.ngib.2018.04.013
Qu, X. Y., Chen, X., and Qiu, L. W. (2015). Genesis of Secondary Pore of Quartz Dissolution Type and its Influences on Reservoir: Taking the Tight Sandstone Reservoir in the Upper Paleozoic of Daniudi Gas Field as an Example. Oil Gas Geol. 36 (5), 804–813. doi:10.11743/ogg20150512
Sun, Z. P., Wang, Y. L., and Wei, Z. F. (2017). Shale Gas Content and Geochemical Characteristics of Marine-Continental Transitional Shale: A Case from the Shanxi Formation of Ordos Basin. J. China Univ. Min. Technol. 46 (04), 859–868. doi:10.13247/j.cnki.jcumt.000663
Wang, J., and Wang, X. L. (2021). Seepage Characteristic and Fracture Development of Protected Seam Caused by Mining Protecting Strata. J. Min. Strata Control Eng. 3 (3), 033511. doi:10.13532/j.jmsce.cn10-1638/td.20201215.001
Wang, G., Qin, X., Han, D., and Liu, Z. (2021). Study on Seepage and Deformation Characteristics of Coal Microstructure by 3D Reconstruction of CT Images at High Temperatures. Int. J. Min. Sci. Technol. 31, 175–185. doi:10.1016/j.ijmst.2020.11.003
Washburn, E. W. (1921). Note on a Method of Determining the Distribution of Pore Sizes in a Porous Material. Proc. Natl. Acad. Sci. U. S. A. 7 (7), 115–116. doi:10.1073/pnas.7.4.115
Wu, J., Tang, D. Z., and Li, S. (2017). Characteristics and Influence Factors of Pore Structure of Coal Reservoirs in the Eastern Margin of Ordos Basin. Coal Geol. Explor. 45 (05), 58–65. doi:10.3969/j.issn.1001-1986.2017.05.011
Wu, P., Gao, L. J., and Li, Y. (2022). An Evaluation Method for Shale Gas Potential of Marine-Continent Transitional Facies with Frequent Interbedded Lithology: A Case Study on the Lower Permian Shanxi Formation in Linxing Block of the Ordos Basin. Nat. Gas. Ind. 42 (2), 28–39. doi:10.3787/j.issn.1000-0976.2022.02.004
Xi, Z. D., Tian, Z. B., and Tang, S. H. (2016). Characteristics and Main Controlling Factors of Shale Gas Reservoirs in Transitional Facies on the Eastern Margin of Ordos Basin. Geol. China 43 (6), 2059–2069. doi:10.12029/gc20160616
Xu, Z., Shi, W., Zhai, G., Peng, N., and Zhang, C. (2020). Study on the Characterization of Pore Structure and Main Controlling Factors of Pore Development in Gas Shale. J. Nat. Gas Geoscience 5, 255–271. doi:10.1016/j.jnggs.2020.09.003
Xue, X. H., Yue, X. J., and Wei, W. (2013). Some Suggestions in Shale Gas Content Measuring Process. Coal Geol. China 25 (04), 27–29. doi:10.3969/j.issn.1674-1803.2013.04.07
Xue, F., Liu, X. X., and Wang, T. Z. (2021). Research on Anchoring Effect of Jointed Rock Mass Based on 3D Printing and Digital Speckle Technology. J. Min. Strata Control Eng. 3 (2), 023013. doi:10.13532/j.jmsce.cn10-1638/td.20201020.001
Yi, T. S., and Gao, W. (2018). Reservoir Formation Characteristics as Well as Co-exploration and Co-mining Orientation of Upper Permian Coalbearing Gas in Liupanshui Coalfield. J. China Coal Soc. 43 (06), 1553–1564. doi:10.13225/j.cnki.jccs.2018.4018
Yin, S., and Wu, Z. (2020). Geomechanical Simulation of Low-Order Fracture of Tight Sandstone. Mar. Petroleum Geol. 117, 104359–104416. doi:10.1016/j.marpetgeo.2020.104359
Yin, S., Lv, D. W., and Ding, W. L. (2018). New Method for Assessing Microfracture Stress Sensitivity in Tight Sandstone Reservoirs Based on Acoustic Experiments. Int. J. Geomechanics 18 (4), 1–16. doi:10.1061/(ASCE)GM.1943-5622.0001100
Yin, S., Xie, R., Wu, Z., Liu, J., and Ding, W. (2019). In Situ stress Heterogeneity in a Highly Developed Strike-Slip Fault Zone and its Effect on the Distribution of Tight Gases: A 3D Finite Element Simulation Study. Mar. Petroleum Geol. 99 (1), 75–91. doi:10.1016/j.marpetgeo.2018.10.007
Zhang, J. Z., Li, X. Q., and Wang, Y. (2015). Accumulation Conditions and Reservoir Characteristics of Marine-Terrigenous Facies Coal Measures Shale Gas from Longtan Formation in South Sichuan Basin. J. China Coal Soc. 40 (08), 1871–1878. doi:10.13225/j.cnki.jccs.2015.0320
Zhang, L., Xiong, Y., Li, Y., Wei, M., Jiang, W., Lei, R., et al. (2017). DFT Modeling of CO 2 and Ar Low-Pressure Adsorption for Accurate Nanopore Structure Characterization in Organic-Rich Shales. Fuel 204, 1–11. doi:10.1016/j.fuel.2017.05.046
Zhang, J., Ju, Y., and Zhang, Q. (2019). Low Ecological Environment Damage Technology and Method in Coal Mines. J. Min. Strata Control Eng. 1 (1), 013515. doi:10.13532/j.jmsce.cn10-1638/td.2019.02.005
Zhou, S., Yan, G., Xue, H., Guo, W., and Li, X. (2016). 2D and 3D Nanopore Characterization of Gas Shale in Longmaxi Formation Based on FIB-SEM. Mar. Petroleum Geol. 73, 174–180. doi:10.1016/j.marpetgeo.2016.02.033
Zhou, G. Z., Xu, S. Y., and Ran, X. J. (2018a). Pore Structure Characteristics and Control Factors of Shale in the Da’anzhai Formation Centrale of Sichuan Basin. J. Northwest Univ. Nat. Sci. Ed. 48 (05), 718–728. doi:10.16152/j.cnki.xdxbzr.2018-05-014
Zhou, S., Ning, Y., Wang, H., Liu, H., and Xue, H. (2018b). Investigation of Methane Adsorption Mechanism on Longmaxi Shale by Combining the Micropore Filling and Monolayer Coverage Theories. Adv. Geo-Energy Res. 2 (3), 269–281. doi:10.26804/ager.2018.03.05
Zhou, S. W., Wang, H. Y., and Liu, H. (2019a). A New Calculation Method for Lost Gas Content of Shale Based on Arps Production Decline Analysis Model. Nat. Gas. Geosci. 30 (01), 102–110. doi:10.11764/j.issn.1672-1926.2018.10.021
Zhou, S., Zhang, D., Wang, H., and Li, X. (2019b). A Modified BET Equation to Investigate Supercritical Methane Adsorption Mechanisms in Shale. Mar. Petroleum Geol. 105, 284–292. doi:10.1016/j.marpetgeo.2019.04.036
Zhou, S., Liu, H., Chen, H., Wang, H., Guo, W., Liu, D., et al. (2019c). A Comparative Study of the Nanopore Structure Characteristics of Coals and Longmaxi Shales in China. Energy Sci. Eng. 7 (6), 2768–2781. doi:10.1002/ese3.458
Zou, C., Zhao, Q., Dong, D., Yang, Z., Qiu, Z., Liang, F., et al. (2017). Geological Characteristics, Main Challenges and Future Prospect of Shale Gas. Nat. Gas. Geosci. 28 (12), 1781–1796. doi:10.1016/j.jnggs.2017.11.002
Keywords: coal measure, Ordos Basin, Shan 2 Member, pore structure, clay mineral pores
Citation: Pengfei J, Pengwan W, Shangwen Z, Huaichang W and Xiangyang C (2022) Study on the Microscopic Pore Structures of Coal Measure Reservoirs in the Shanxi Formation, Eastern Ordos Basin. Front. Earth Sci. 10:903588. doi: 10.3389/feart.2022.903588
Received: 24 March 2022; Accepted: 28 April 2022;
Published: 16 May 2022.
Edited by:
Wenlong Ding, China University of Geosciences, ChinaReviewed by:
Changan Shan, Xi’an Shiyou University, ChinaBing Zhang, Chengdu University of Technology, China
Copyright © 2022 Pengfei, Pengwan, Shangwen, Huaichang and Xiangyang. This is an open-access article distributed under the terms of the Creative Commons Attribution License (CC BY). The use, distribution or reproduction in other forums is permitted, provided the original author(s) and the copyright owner(s) are credited and that the original publication in this journal is cited, in accordance with accepted academic practice. No use, distribution or reproduction is permitted which does not comply with these terms.
*Correspondence: Wang Pengwan, wangpw_hz@petrochina.com.cn