Spatio-Temporal Differentiation Characteristic and Evolution Process of Meteorological Drought in Northwest China From 1960 to 2018
 Hui Li
 Enke Hou
 - College of Geology and Environment, Xi’an University of Science and Technology, Xi’an, China
Against the backdrop of global climate change, the response characteristic of meteorological drought is of great concern, especially in the arid or semi-arid regions. By employing the Standardized Precipitation Index (SPI), TPFW-MK test, Run Theory, Moran’s I, and General G, the spatio-temporal evolution characteristic of drought was clarified and the spatial autocorrelation of local and global drought characteristic variables was explored based on the meteorological data from 122 stations in Northwest China (NWC) during 1960–2018. The results indicated that the drought situation of NWC was improving regardless of annual or seasonal scale. According to the Z-statistics by the TPFW-MK test, there existed an obvious wet trend in west NWC and a slight dry trend in east NWC. The center of gravity migration model revealed that the gravity center of SPI moved towards higher latitude over the last decades, there was a northwest (1960–1990) and northeast (1990–2018) variation in the covering shapes of the standard deviational ellipses of SPI, and the spatial distribution of SPI tended to be concentrated. Meanwhile, the distribution pattern of drought characteristics suggested that more droughts occurred in east of NWC, which were less harmful while fewer droughts happened in west NWC, which brought greater drought damage. The results of global Moran’s I (GMI) indicated that both annual and seasonal drought variables were characterized with significant spatial autocorrelation, the spatial distribution of winter drought variables was more disperse than other seasons, while the damage of summer and autumn drought was bigger than that in spring and winter. Besides, the results of local Moran’s I (LMI) showed that there was obvious agglomeration in the overall distribution of drought characteristic variables, which had a seesaw effect. The spatial distribution of hot spots and cold spots at different confidence levels indicated that Shaanxi Province experienced the most droughts but with shortest duration and lowest severity while northwest Xinjiang had the fewest droughts with longest duration and highest severity. The results of revealing the drought development process and identifying the location of drought aggregation will provide references for supporting climate adaptation strategies and preventing drought-related loss.
1 Introduction
Global warming is expected to accelerate the global hydrological cycle and change the spatio-temporal patterns of precipitation, which will give rise to weather-related hazards such as droughts and floods, and aggravate the contradiction between water resource and the distribution of geographic productivity (Shi et al., 2015; Chen et al., 2016; Naumann et al., 2018; Hu et al., 2019). Therefore, water planning and management are far more complex during drought periods, particularly against the backdrop of serious concerns about water security, socioeconomic development, and ecological sustainability.Drought is a natural and recurring meteorological disaster that mainly resulted from prolonged precipitation deficit (Mishra et al., 2015; Deng et al., 2018; Campozano et al., 2020). As the initial stage of a drought, the meteorological drought determines the scale of a drought episode and has presented a great challenge to regional agriculture, ecological environment, and livelihoods (Mondal and Mujumdar, 2015; Spinoni et al., 2019). In fact, the global economic losses caused by meteorological drought was up to 6–8 billion dollars a year, far more than other meteorological disasters (Udmale et al., 2014; Montaseri and Amirataee, 2017; Lin and Shelton, 2020). China has an instable monsoon climate and a complex terrain, which result in maldistribution of water-heat and frequent droughts. Statistics showed that from 1981 to 2014, about 23 million hectares of crop area per year in China have been suffering from droughts (MWR, 2015; National Bureau of Statistics of China, 2015; Wang et al., 2017).
Given the damage that drought causes, attention has been paid to drought identification or the calculation of basic drought characteristic. Huang et al. (2015) proposed a Nonparametric Multivariate Standardized Drought Index (NMSDI) to investigate the spatial and temporal features of drought structure in the Yellow River Basin (YRB) of China, and found that the drought structure in terms of drought duration, onset, and termination transition periods in the YRB is stable and no significant change trend was detected. By comparing the SPI and the SPEI, Tirivarombo et al. (2018) and Oikonomou et al. (2020) respectively assessed the drought characteristics of Kafue basin and Europe. Kalisa et al. (2020) analyzed the spatio-temporal characteristics of drought and its return periods over the East African region. A detailed description of drought events contains multiple characteristic variables, such as drought duration, severity, and frequency, which have important implications for drought identification and can explain the complexity and extensive influence of drought events (Yusof et al., 2013; Brito et al., 2018; Sun et al., 2019; Oikonomou et al., 2020). For example, Guo et al. (2018) discussed the spatial and temporal drought characteristic variables such as drought duration and severity in Central Asia by using Run Theory. Xu et al. (2015) analyzed the variation of drought frequency in Southwest China by integrating the effects of drought duration, affected area, and severity into the 3-D joint probability distribution with a trinary function. In order to provide references for making adaption strategies, drought hazards using statistical methods have also been analyzed in some research. Azimi et al. (2020) studied the spatial interpolation of drought steady-state probabilities based on a Markov chain model, and the results showed an average drought increase of 62% in the steady-state condition in Iran. Ayantobo et al. (2017) evaluated drought hazards of mainland China from 1961 to 2013 based on a univariate frequency analysis, and found that the distribution of drought frequency in China decreased both from west of east and from north to west. Ogunrinde et al. (2021) explored the variation of drought severity and its correlation with climate change in the Sahel region of Nigeria from 1981 to 2015 by Mann–Kendall test, the findings demonstrated that the drought severity exhibited an increasing trend, and a slight change of rainfall will not have a significant effect on drought or the severity of drought increase.
Northwest China (NWC) is widely regarded as one of the driest areas in the world, which mainly depend on eco-agricultural economy. Situated in the inland with extremely fragile ecological environment, drought has been considered as the one of the major factors limiting the social and economic development in NWC (Sternberg, 2018; Wei et al., 2021). Against the backdrop of global warming, the precipitation of NWC has exhibited an upward trend over the last 20 years, which offered some relief to drought conditions (Liu et al., 2016a; Yang et al., 2018; Li et al., 2021).According to Wang and Qin (2017) and Yang et al. (2018a), the climate of NWC tended to be more humid and warmer from the 1960s to the 2010s, as well as the drought severity was relieved. However, due to the complex territory and nonlinear nature in different climate conditions, water scarcity and the uneven distribution of water resource are still the major factors affecting ecosystem and economy (Hu et al., 2021). Meanwhile, the redistribution of water-heat caused by global climate change has exerted a great effect on the spatial and temporal distribution characteristic of drought in NWC (Chen and Sun, 2015; Mo et al., 2018; Li et al., 2020). Gu et al. (2018) found that the drought frequency and drought duration are projected to decrease in NWC while the drought severity will be heavier in the next 30 years based on the bias-corrected CESM1 and CSIRO ensembles.
Influenced by the underlying surface conditions, drought frequency, duration, and intensity will change during the spread of a drought event (Burke et al., 2010; Naumann et al., 2015; Liu et al., 2016b). Previous studies were mainly focused on the spatio-temporal variation of drought events or the characteristic of drought variables such as drought frequency and drought duration, which failed to describe the whole process of drought evolution characteristic and the spatial autocorrelation of multiple drought events. Besides, every drought event has a certain duration and a range of influence; drought indexes used in past research were based on single rain gauges that could not explore the influence area of a single drought event. Considering the calculated drought indexes are affected by topography, elevation, and climate, the variation of drought characteristic variables in adjacent sites or regions would exhibit similar characteristics. Therefore, analyzing the correlation of drought events in different distances is important for identifying the spatial similarity and heterogeneity of drought.
Accordingly, the primary objectives of this paper are (1) to explore the spatio-temporal variation characteristic of drought in NWC based on the SPI values of 123 rain gauges; (2) to identify the drought events from hydrometeorological series and to reveal the spatial evolution features of drought characteristic variables; (3) to visualize the development process of drought in NWC; and (4) to investigate the spatial heterogeneity and similarity of drought variables.
2 Study Area
NWC is in the hinterland of Eurasia, which accounts for 31.7% of the total land area of China and geographically includes five administrative provinces (Xinjiang, Qinghai, Gansu, Shaanxi, and Ningxia) (Figure 1). Because of its geographic position and the topographic features with high mountains all around, it is difficult for the water vapor to transport from the ocean to the study area; thus, NWC is one of the driest places in the same latitude, which is characterized by cold winters and hot summers with low precipitation; the annual average temperature and precipitation from 1960 to 2018 were 6.3°C and 248.2 mm, respectively. Besides, the terrain and physical geographical features of NWC varied greatly (the landscape includes deserts, basins, plateaus, plains, and mountains), which result in different climatic characteristics, and the precipitation gradually decreases from southeast to northwest.
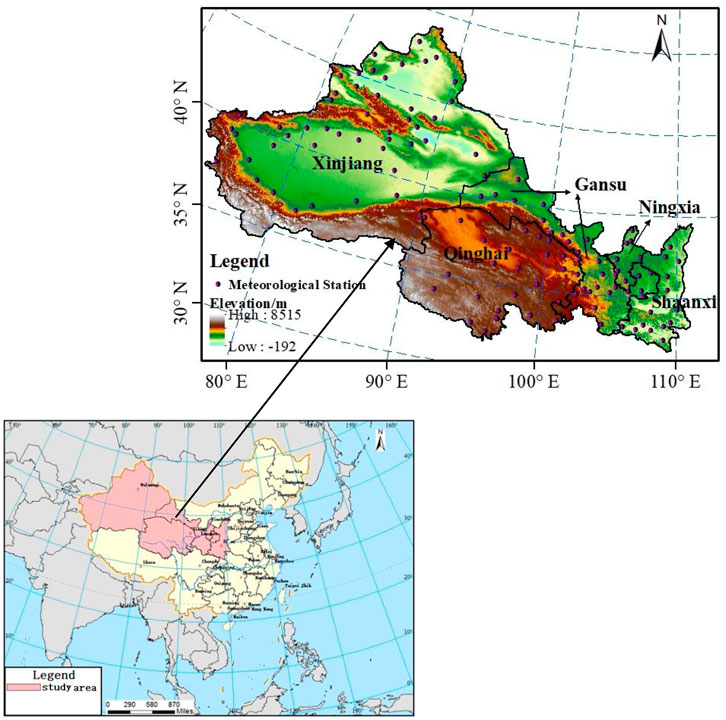
FIGURE 1. Location and the meteorological details of the study area.
3 Dataset and Methodology
3.1 Data Availability
The precipitation data are obtained from China Meteorological Data Sharing Service System (http://www.cma.gov.cn) for the 1960–2018 periods from 122 meteorological stations. In order to ensure high-quality series, data series with a cumulative absence of more than 1 year were excluded, and the homogeneity of the dataset was checked and corrected by using the standardized toolkit RHtestsV4. The geographical distribution of the rain gauges is shown in Figure 1.
3.2 Methodology
3.2.1 SPI
The Standardized Precipitation Index (SPI) and the Standardized Precipitation Evapotranspiration Index (SPEI) are the most commonly used indices for drought assessment, which are able to detect drought events at different time scales (Kalisa et al., 2020; Bonaccorso et al., 2015). The SPI employs precipitation to calculate the drought index while the SPEI incorporates both temperature and precipitation to identify drought (Fung et al., 2020). Though the temperature has played an important role on drought identification especially in arid regions, the climate conditions with lower variability of temperature than the variability in precipitation indicated that the precipitation is the major driver of droughts (Tirivarombo et al., 2018; Beguería et al., 2014). Besides, the near-zero potential evapotranspiration in winter of some regions and the calculation of potential evapotranspiration by empirical formula may add to the uncertainty of the results.Therefore, considering this paper is mainly aimed at studying the spatio-temporal differentiation characteristic and evolution process of meteorological drought in NWC, the evapotranspiration has more spatio-temporal effects on soil moisture availability and water resources planning in the face of agriculture drought, and for simplicity of calculation, this study employed the SPI to analyze the variation characteristic of drought in NWC. Based on the theory, the SPI is determined as follows (Raziei et al., 2014; Haroon et al., 2016):
or
where:
where α, β are the scale and shape parameter of Gamma function:
where
The constants in Eq. 1 and Eq. 2 are given as follows: C0 = 2.515517; d1 = 1.432788; C1 = 0.802853; d2 = 0.189269; C2 = 0.010328, d3 = 0.001308.
The positive values of SPI indicate greater than mean precipitation and are related to wet conditions, while the negative values suggest less than mean precipitation and are related to dry conditions. SPI-1, SPI-3, SPI-6, and SPI-12 represent monthly, seasonal, semi-annual, and annual accumulated drought condition, respectively. Therefore, SPI-3 and SPI-12 were selected to monitor drought in this research.
3.2.2 Run Theory
SPI was mainly adopted to demonstrate the spatial and temporal variation of drought events, which limited the identification the multiple attributes of drought events. Therefore, Run Theory was employed to separate drought characteristic variables (drought frequency, duration, and severity) from SPI series and reveal the basic attributes of drought (Amirataee et al., 2020; Wu et al., 2020; Leng et al., 2020). According to the theory, three truncation levels X0 = −0.5 (light drought occurs when SPI < −0.5), X1 = −0.3 (drought is also expected when the SPI values of one period or multiple time periods are kept between −0.5 and −0.3), and X2 = 0 (drought may happen when the run length of SPI is negative) were set to identify drought events; the identification process of drought events is as follows:
1) If the SPI value is less than x1, it would be preliminarily considered that a drought event occurs (Figure 2 shows four droughts, I, II, III and IV).
2) If the drought event lasts only 1 month (I, IV) and the corresponding SPI value is less than x0, it would be considered that a drought event occurs (I); otherwise, there is no drought in this month (IV).
3) If the time interval between two adjacent drought events (II and III) is 1 month and the corresponding SPI value is less than x2, the two adjacent drought events would be merged as one drought event, and then the drought duration D = DII + DIII+1 and the drought severity S = SII + SIII. Otherwise, they would be considered as two independent drought events.
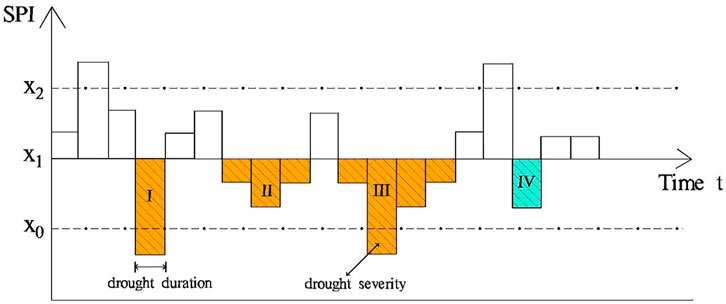
FIGURE 2. Drought event identification process by Run Theory.
3.2.3 TFWP-MK
Since the positive correlation of time series may cause the major source of uncertainty by Mann–Kendall test, trend-free pre-whitening (TFWP-MK) was employed to eliminate the effect of serial correlation (Dinpashoh et al., 2011; Gocic and Trajkovic, 2013; Ji et al., 2014). The procedure of TFPW-MK can be represented as:
The slope, an index indicating the direction and quantity of the trend, was estimated using the Theil–Sen regression estimator by:
where Xj and Xi are the data values at time i and j.
Then the lag-1 serial correlation coefficient of the sample data is obtained by:
where r1 is the Xt and E (Xt) is the mean of the sample data.
If ri is not significantly different from zero, the time series are considered to be independent and the Mann–Kendall test can be used directly. Otherwise, it should be pre-whitened by:
Then, βi is added again to the residual dataset of Eq. 10.
where Yi″ is the pre-whitened series (final series).
Finally, the Mann–Kendall test is used to detect the trend of the pre-whitened time series (Jhajharia et al., 2011; Machiwal et al., 2017).
3.2.4 Geostatistical Methods
In this research, we use Moran’s I, General G, and Gravity Migration Model to explore the spatial correlation drought characteristic variables, and identify the evolution characteristic of drought in NWC.
3.2.4.1 Center of Gravity Migration Model
The temporal and spatial evolution features of drought were investigated by the center of gravity migration model:
where Xj, Yj are the longitude and latitude coordinate of SPI gravity center of j year, Cij is the SPI value of unit i in year j, Xi and Yi are the longitude and latitude coordinate of geometrical center of unit i, and n is the number of research units.
3.2.4.2 Moran’s I
Moran’s I is used to identify the autocorrelation of spatial elements or the similarity of neighboring data, which can be classified as Global Moran’s I index (GMI) and Local Moran’s I index (LMI) (Sheng et al., 2002; Wang et al., 2016). This research employed the GMI to determine whether there existed spatial autocorrelation of drought characteristic variables, and the LMI was used to identify the property of the cluster or the disperse variables. The GMI is given as:
where n is the number of research units; xi is the drought variable value of unit i; xj is the drought variable value of unit j;
Additionally, the LMI is computed as the following:
The meaning of the parameters were the same as that in Eq. 14 and Eq. 15.
3.2.4.3 General G
Though the GMI can be used to classify the cluster pattern, it cannot figure out whether the property of the clustered variable are hot spots (have high values) or cold spots (have low values). Thus, the Getis-Ord General G is applied to identify locations that spatially clustered with either high or low values (Chen, 2021).
where d is the distance between the unit i and unit j, and wij is the same spatial weight used for obtaining GMI as Eq. 14 and Eq. 15. High positive values of Gi(d) indicate that the locations are clustered with hot spots while negative values indicate a spatial cluster with cold spots.
For the purpose of statistically identifying the hot spots or cold spots, the Z score of Gi(d) is calculated by:
where E(Gi) is the expected value of Gi; SD(Gi) is the standard deviation of Gi. To decide whether the Z score is statistically significant, the absolute value would have to be greater than 1.65, 1.96, and 2.57, which were the significant level of 0.1, 0.05, and 0.01, respectively (Huang et al., 2013).
4 Results
4.1 Spatio-Temporal Variation of Drought
As shown in Figure 3, both SPI-3 series and SPI-12 series have been in a significant fluctuation, droughts and floods alternated frequently, and both series exhibited slightly increasing trends, suggesting a weakening drought in the NWC. Late 1980s was the turning point of drought, after which positive values were dominant and this trend was more prominent in the 2010s.
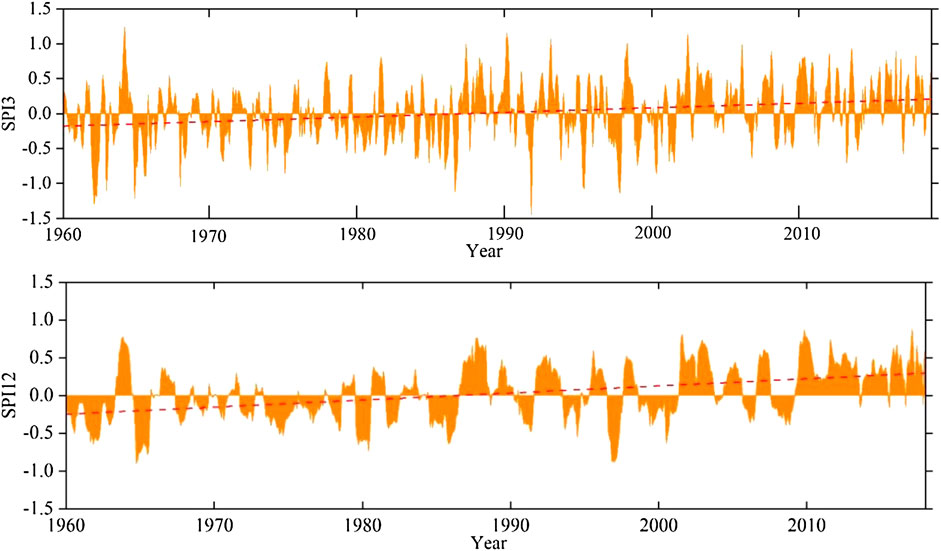
FIGURE 3. Variation of SPI series from 1960 to 2018 in NWC.
Figure 4 illustrated the temporal variation characteristics of seasonal drought based on the SPI-3 in NWC from 1960 to 2018. All the SPI series presented with upward trends, which indicated that the drought situation of all seasons in NWC was relieved. According to the Z-statistic test by TFPW-MK, the SPI series of winter passed the significant test at level 0.05 while the series of spring, summer, and autumn did not, suggesting that the SPI series of winter presented a significant increasing trend while the SPI series of spring, summer, and autumn slightly increased. Besides, as can be seen from Figure 4, the SPI values of spring and summer varied greatly; prolonged droughts of spring and summer were detected before the 1990s. No significant change of autumn drought series was observed until the 2010s. Winter humidification was identified after the late 1980s.

FIGURE 4. Variation of seasonal SPI series from 1960 to 2018 in NWC.
Figure 5 demonstrated the spatial distribution characteristics of annual and seasonal SPI values in NWC. The annual and seasonal SPI were the average station-based SPI values from 1960 to 2018. Affected by the geography, topography, vegetation, and other factors, the spatial distribution of SPI exhibited significant spatial differences. For annual scale (Figure 5A), except for southern Xinjiang, most areas of NWC experienced dry conditions. The minimum SPI values mainly occurred in east Xinjiang and south Qinghai, suggesting that these areas had more severe droughts. The distribution of SPI values in spring and summer showed that the NWC has suffered extensive summer and spring droughts (Figures 5B,C). Autumn and winter droughts in NWC were much lighter than that of spring and summer. Autumn drought mainly appeared at south Qinghai and northwest Xinjiang (Figure 5D), and winter drought mainly occurred in local areas of west Xinjiang (Figure 5E).
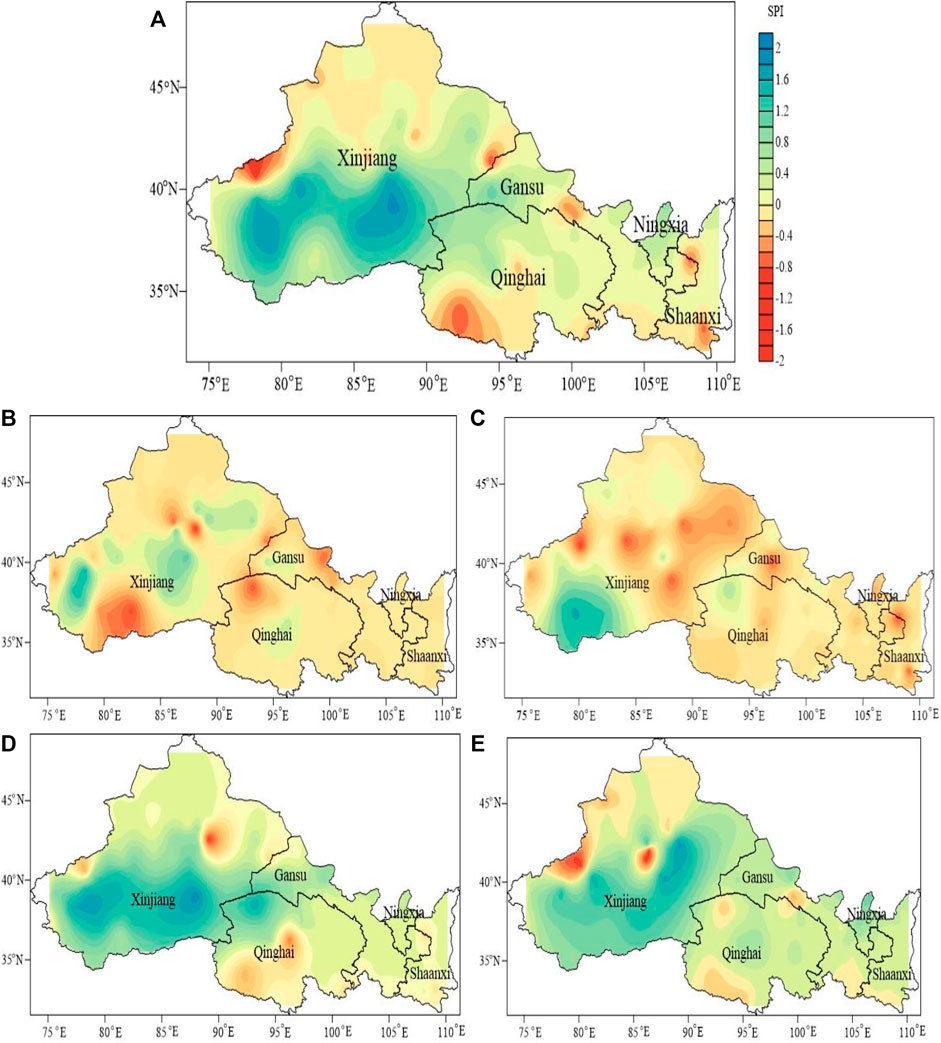
FIGURE 5. Spatial distribution of average SPI from 1960 to 2018 in NWC.
4.2 Trend Analysis
Figure 6 shows the geographical distribution of annual and seasonal test Z-statistics of SPI series. According to the results, both annual and seasonal drought series of NWC exhibited a typical distribution pattern—positive trends in the west and negative trends in the east. In fact, Z-statistics by the TFPW-MK test of annual SPI values revealed that 89 stations (73.0%) had increasing trends while 33 stations (27.0%) had decreasing trends, of which 72 stations have passed the positive significant test at level 0.05 while 19 stations have passed the negative significant test, indicating an obvious wet tendency in west NWC and a slight dry tendency in east NWC.
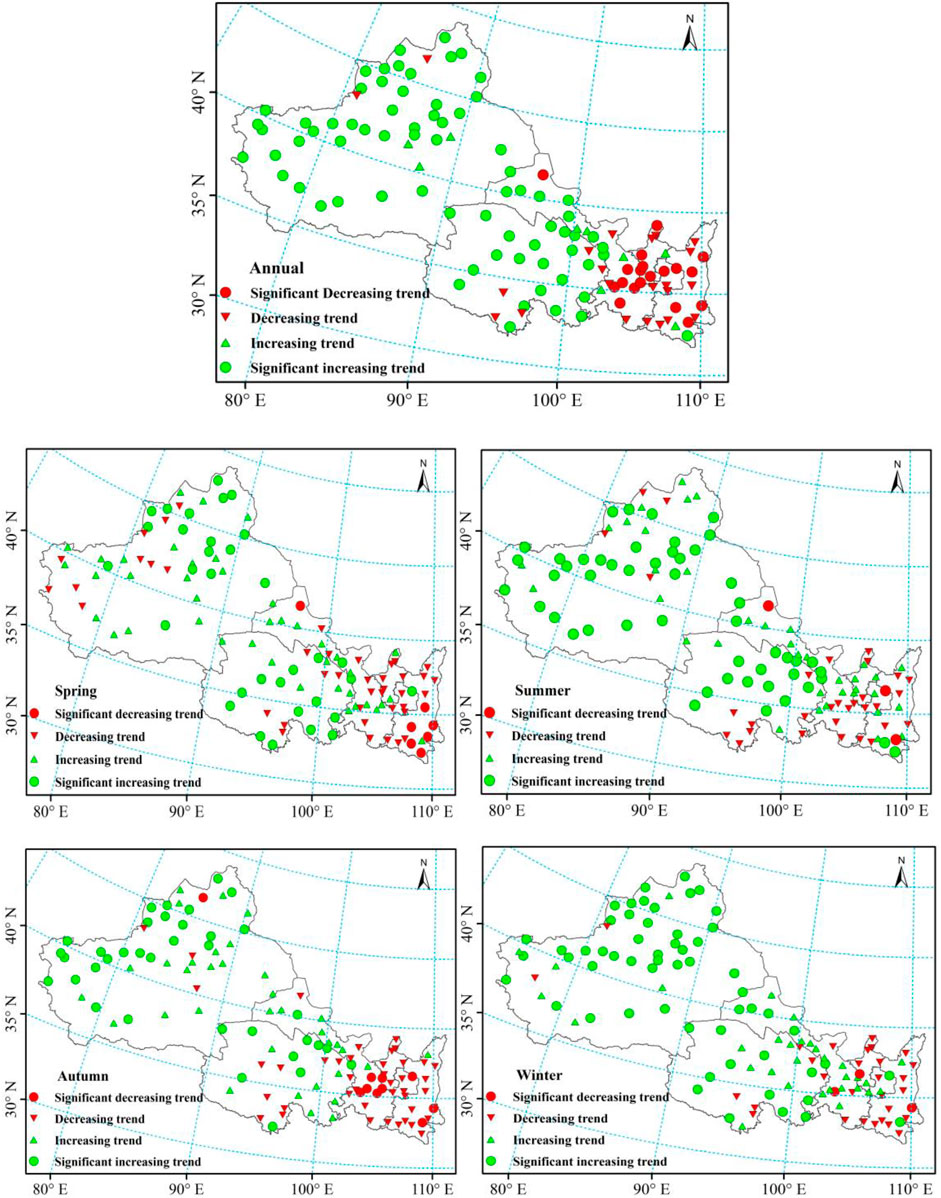
FIGURE 6. Spatial distribution of annual and seasonal Z-statistics of SPI by TFPW-MK.
The spring drought series showed positive trends at 68.9% of the stations, and 33 stations of these passed the significant test at level 0.05. South Qinghai and northwest Xinjiang experienced distinct wetting conditions. Significant decreasing trends were detected in south Shaanxi, suggesting a remarkable aggravation of spring drought in such area. In summer, 98 stations (80.3%) showed positive trends, 51 stations of which have passed the significant test at 0.05 level and these stations mainly occurred in Xinjiang and Qinghai, which indicated that the summer drought in Xinjiang and Qinghai were greatly relieved from 1960 to 2018. The results obtained by elaborating the autumn droughts were similar to those relative to spring and summer. In this case, 81 out of 122 stations presented positive trends, 36 stations passed the significant tests and these stations were presented at Tianshan Mountain area in western Xinjiang. The significant decreasing trends of south Gansu indicated that these areas have experienced an obvious intensifying autumn drought. The results of winter Z-statistics demonstrated that 81.9% of the stations had increasing trends and the significant positive trends mostly occurred in Xinjiang and south Qinghai and east Gansu.
In addition, the droughts in eastern regions, such as Shaanxi, Ningxia, and west Gansu, were aggravating while the droughts in west NWC, such as Xinjiang and Qinghai, were alleviating or tended to be wet. Besides, in winter and summer, more than 50% of the stations passed the significant test, suggesting that the winter and summer drought experienced greater change compared with spring and autumn droughts.
4.3 Migration Characteristic of Drought
Based on the model of Gravity Migration, the spatial evolution of annual SPI values in NWC was revealed. The results showed that the distribution center of SPI in 1960 was (103.54°E, 36.38°N), while the center in 2018 was (82.32°E, 41.64°N), suggesting a great climate change in NWC. According to the gravity migration paths (Figure 7), the gravity center of SPI moved from southeast to northwest and then turned from southwest Xinjiang to northeast Xinjiang, which indicated that the drought in NWC was alleviating from southeast to northwest during 1960–2018. Moreover, the average migration distances (57.32 km.year−1) of SPI centers in NWC from 1960 to 1990 were much greater than that from 1990 to 2018 (16.08 km.year−1), suggesting that the wetting area in west NWC was much larger than the drying area in east NWC. The reason why the SPI centers moved towards high latitudes in NWC may be related to the strengthened moisture current from south for the past few years especially in Xinjiang.
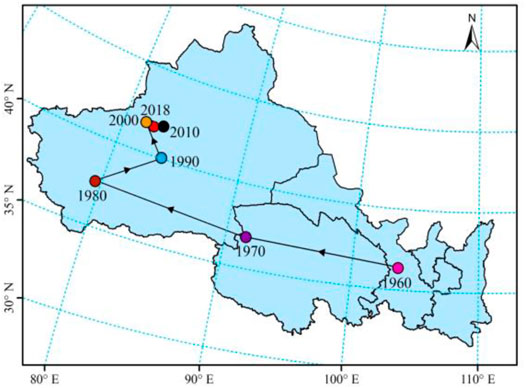
FIGURE 7. Migration of gravity center of SPI.
As Figure 8 showed, the standard deviation ellipse of SPI values in 1960 almost covered the middle and east regions of NWC, suggesting that the droughts had large spatial differences in 1960. After then, the coverage of ellipse exhibited a decreased trend, indicating that the spatial distribution of SPI values has turned from disperse to concentrated. That is, the spatial distribution of drought in NWC tended to be concentrated during 1960–2018. Meanwhile, from 1960 to 1980, the ellipses flattened and moved towards northwest, further illustrating that the variation of SPI values had exhibited a direction of northwest–southeast. Besides, the difference between the ellipsoidal shape of 1980 and the ellipse of 1990 was much greater compared with other adjacent decades, which was consistent with the previous reports that the climate in NWC has turned from dry to wet since 1986.
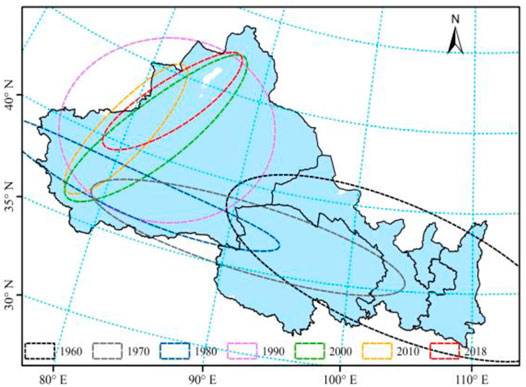
FIGURE 8. Standard deviation ellipse of SPI.
4.4 Spatial Evolution Characteristic of Drought Variables
Based on Run Theory, the drought characteristic variables (drought frequency, drought duration, and drought severity) were separated from SPI series and are shown in Figure 9 and Figure 10. As can be seen from Figure 9, the annual drought frequency in most areas of NWC was between 65 and 75 times from 1960 to 2018. The highest drought frequency (85 times) occurred in Ankang of Shaanxi Province; the minimum value (51 times) happened in Wusu of Xinjiang, with a difference of 34 times. Annual drought duration in most areas of NWC from 1960 to 2018 lay in the range of 3.1–4.7 months; Shaanxi experienced the shortest drought duration (3.3 months in average) while west Xinjiang had the longest duration (4.2 months in average). The spatial distribution of annual drought severity was similar to drought duration, and the highest drought severity (4.5) happened in Kelamayi of Xinjiang, suggesting that it went through the worst drought in NWC. The lowest drought severity (3.1) appeared at Huinong of Ningxia. Overall, on an annual scale, drought frequency decreased from southeast to northwest, while drought duration and severity increased from southeast to northwest, suggesting that more droughts occurred in east of NWC, which were less harmful, while less drought presented at west NWC, which brought greater drought damage.
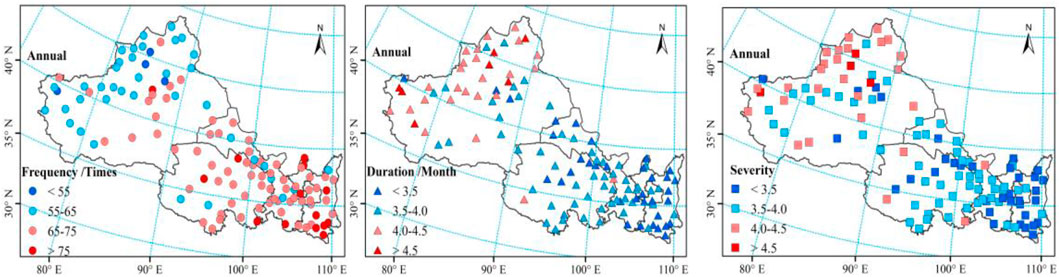
FIGURE 9. Spatial distribution of annual drought characteristic variables.
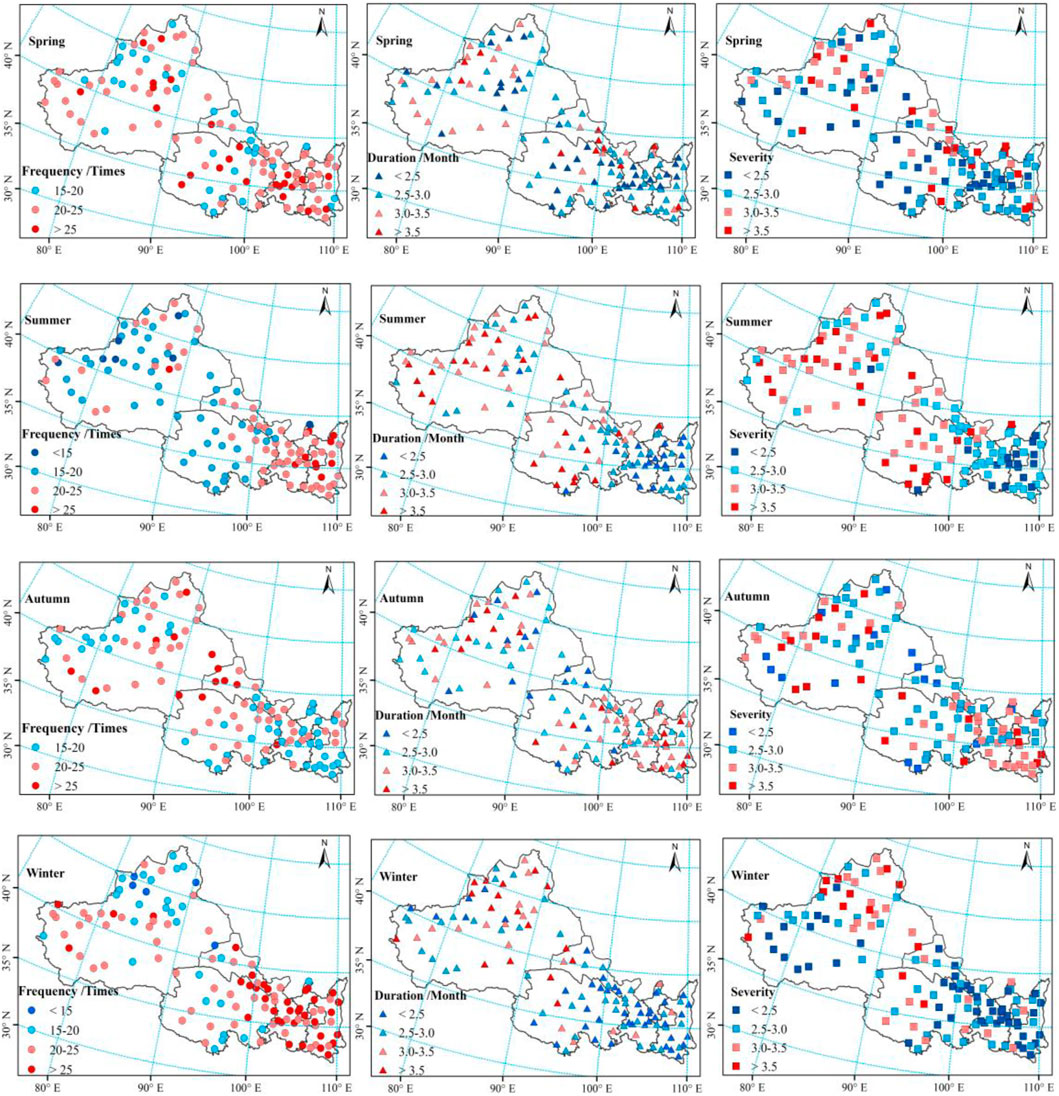
FIGURE 10. Spatial distribution of seasonal drought characteristic variables.
Except for autumn, the distribution patterns of seasonal drought characteristics were similar to that of annual drought characteristics (Figure 10). The drought frequency of spring, summer, and winter showed a downward trend from east to west while drought duration and severity exhibited an upward trend from east to west, and the drought characteristics of autumn presented with opposite trends. In spring and winter, most areas experienced more frequent droughts with shorter duration and lower severity. Serious spring and winter droughts appeared at northwest Xinjiang. Meanwhile, Shaanxi, Ningxia, and Gansu endured the most frequent winter droughts. In summer, the distribution boundary of drought variables between east and west was more clear than others’; more summer droughts occurred in east NWC with shorter duration and lighter severity, while fewer summer droughts with longer duration and higher severity were found in west NWC. Autumn drought with longer duration and higher severity mainly happened in Ningxia, south Shaanxi, and west Xinjiang. The average drought frequency of spring, summer, autumn, and winter was 22.5, 20.8, 21.1, and 22.8 times, respectively. Seasonal drought duration varied from 2.1 to 4.6 months; 35 stations in spring and winter experienced longer drought duration above 3 months, 54 stations’ drought duration in summer were longer than 3 months, and 64 stations in autumn went through more than 3 months of drought duration. Seasonal drought severity of the study area ranged from 1.7 to 6.3; the average values of spring, summer, autumn, and winter were 2.9, 3.1, 3.0, and 2.7, respectively.
The statistics of seasonal drought frequency, duration, and severity of 122 meteorological stations were shown as violin box plots. As can be seen from Figure 11, winter drought variables of different stations had the greatest differences, while autumn drought variables had the smallest differences. Though the average drought frequency of summer and autumn was smaller, the drought duration and severity of summer and autumn were greater than that of spring and winter, demonstrating that the damage of a drought event in autumn and summer was bigger than in spring and winter; a summer and autumn drought would be more severe and widespread.
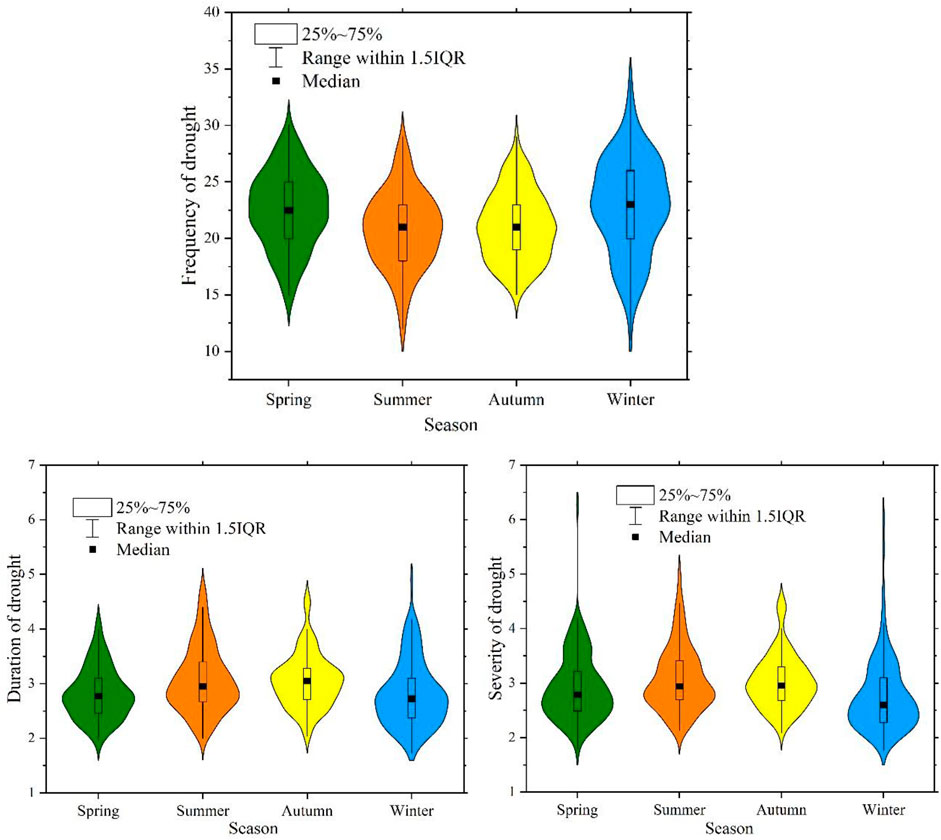
FIGURE 11. Statistics of seasonal drought variables of 122 meteorological stations.
In conclusion, the spatial distribution of seasonal drought characteristic variables in NWC had much difference. Winter droughts were the most frequent. Summer drought situation in west of NWC was more severe than other seasons, while autumn drought situation in east of NWC was more severe than other seasons, suggesting that the contradiction between supply and demand of water resources was more prominent in these areas. Drought duration and drought severity had the same varying tendency, which indicated that a longer drought duration tend to cause a severe drought event. Meanwhile, the contrasting distribution patterns between drought frequency, drought duration, and drought severity demonstrated that the drought duration and drought severity tended to be weakened with the increasing number of drought. That is, the drought situation of NWC exhibited as low frequency with long duration and strong severity, or high frequency with short duration and light severity. Besides, the drought variables presented a characteristic of spatial concentration, suggesting a potential interdependence. Therefore, it is of great significance to identify the spatial correlation of drought factors.
4.5 Spatial Autocorrelation of Drought Variables
4.5.1 Analysis of Global Spatial Autocorrelation
As shown in Figure 12, all the GMI values of drought variables were above zero and passed the confidence test at level 95%, suggesting that the spatial distributions of annual or seasonal drought variables in NWC were significantly autocorrelated. That is, the drought variables were characterized with regional similarity. The higher GMI values of annual drought variables indicated a better spatial autocorrelation than that of seasonal drought variables. Except for the winter GMI, the GMI of seasonal drought frequency in spring, summer, and autumn was greater than that of drought duration and severity, which demonstrated that the spring, summer, and autumn drought frequency had stronger spatial autocorrelation than their drought duration and severity while the spatial autocorrelation of drought frequency in winter was weaker than its duration and severity. The greater GMI (0.21–0.43) of drought frequency demonstrated a higher spatial correlation of drought frequency in NWC; a local drought may increase the risk of drought occurrence in adjacent regions. Furthermore, the similar variation trend and the small difference between drought duration and drought severity further verified their good long-range correlations.
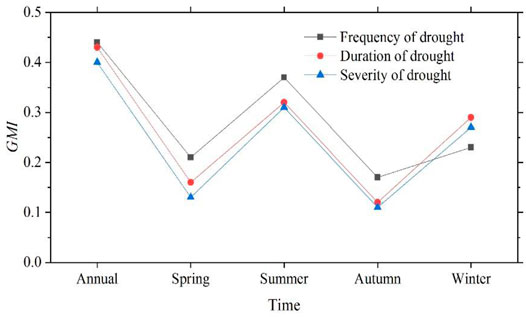
FIGURE 12. GMI of seasonal drought characteristic variables in NWC.
4.5.2 Analysis of Local Spatial Autocorrelation
According to the scatter plots of LMI for annual and seasonal drought variables (Figure 13), the points in the first and third quadrant were much more than that in the second and fourth quadrant, suggesting that drought variables of most areas in NWC showed an aggregation state of High–High value or Low–Low value; the areas with High–Low value or Low–High value were relatively small.
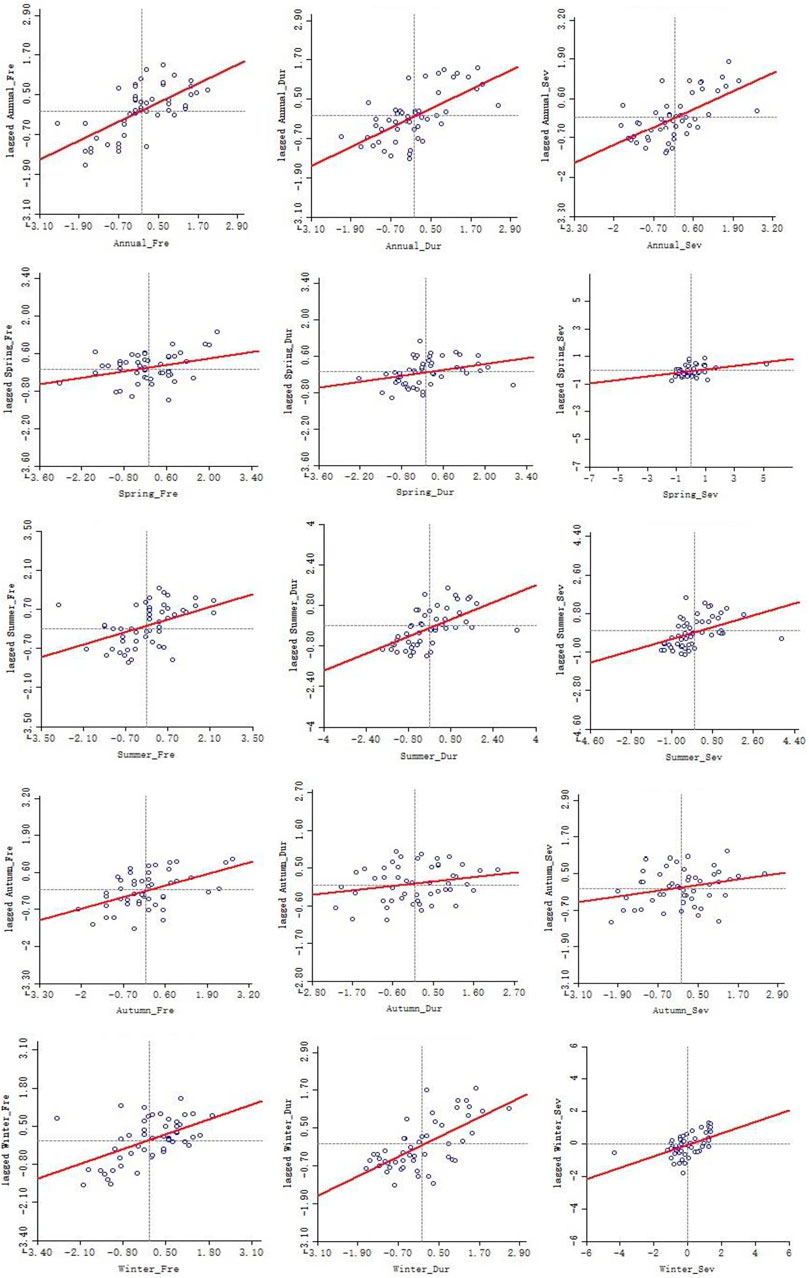
FIGURE 13. Scatter plots of LMI for the drought characteristic variables.
The spatially clustered locations with features of either high or low values (hot or cold spots) were identified by General G.As can be seen from Figures 14, 15, the hot and cold spots of drought characteristic variables in NWC were obviously spatial distribution features. On an annual scale, Shaanxi, Ningxia, and southeast Gansu presented with hot spots of drought frequency and cold spots of drought duration and severity, while northwest Xinjiang (Tacheng, Yili, Aletai, Akesu, Changji, and Tulufan) was characterized with cold spots of drought frequency and hot spots of drought duration and severity, which indicated that the drought frequency of Shaanxi, Ningxia, and southeast Gansu was more than the average values of adjacent areas while the duration and severity of such areas were shorter and milder than their nearby regions, and that the drought frequency of northwest Xinjiang was less than its neighboring area while the duration and severity were longer and more intense than the adjacent areas. Meanwhile, the distribution of hot spots and cold spots at 99% confidence level suggested that Shaanxi experienced the most droughts with shortest duration and lowest severity, while northwest Xinjiang had the fewest droughts with longest duration and highest severity.

FIGURE 14. Spatial autocorrelation pattern of annual drought variables.
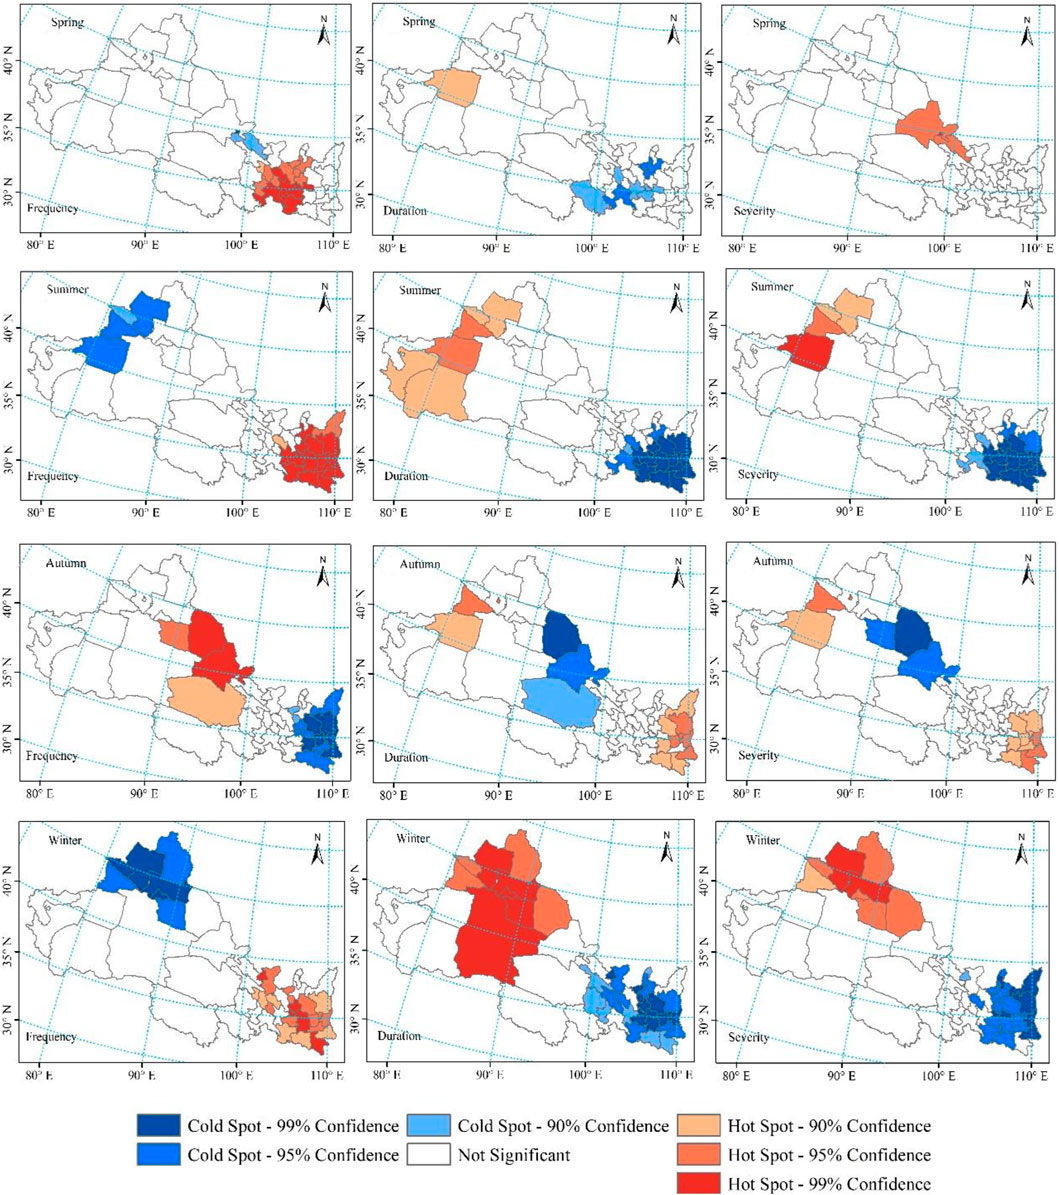
FIGURE 15. Spatial autocorrelation pattern of cold hot spots of seasonal drought variables.
The hot spots of drought frequency in spring mainly occurred in southeast Gansu, indicating that the frequency of spring drought in such areas was more than its nearby regions. As for spring drought duration, the cold spots were scattered in local areas of south Gansu and east Qinghai, and only the hot spot at 95% confidence level was discovered in Akesu of Xinjiang. The hot spots of spring drought severity appeared at Jiuquan and Zhangye, suggesting a higher drought severity in such regions.
In summer, south-central Shaanxi and southeast Gansu presented with cold spots of drought duration and severity at 99% confidence level, suggesting a much lighter summer drought in these areas. The hot spots of drought duration and severity in west Xinjiang indicated a regional heavier summer drought.
In autumn, the hot spots of drought frequency happened in Hexi Corridor and north Qinghai, which also exhibited with cold spots of drought duration and severity, demonstrating that these areas were characterized with more autumn droughts, which were in a lighter situation. Likewise, Shaanxi appeared with cold spots of drought frequency and hot spots with drought duration and severity, which means that these areas suffered a more severe autumn drought but with less frequency.
The spatial distributions of hot and cold spots of the three drought variables in winter were similar to that in summer, but the area presented with significant correlation expanded. Most areas of east NWC (including Shaanxi, Ningxia, and central-south Gansu) exhibited hot spots of drought frequency and cold spots of drought duration and severity while northwest Xinjiang (Changji, Tacheng, Kelamayi) showed cold spots of drought frequency and hot spots of drought duration and severity, indicating a light winter drought in east NWC and a more severe winter drought in northwest Xinjiang. Besides, the hot spots of drought duration and severity in Tacheng and Changji were at a confidence level of 99%, suggesting a much more serious winter drought in such areas.
On the whole, G values of the three drought variables in east NWC were opposite to the west. Shaanxi and Xinjiang were at the highest confidence level regardless of cold or hot spots, suggesting that the climate conditions in this area were complicated; more drought monitoring should be conducted in such areas in order to investigate causes and improve drought resistance.
5 Conclusion and Discussion
As drought in NWC is partially a large-scale phenomenon and exhibited regional characteristics, it is necessary to provide a comprehensive assessment of drought in terms of drought indexes, the distribution of drought characteristic variables (frequency, duration, and severity), the spatio-temporal evolution features of drought, and the spatial similarity of drought characteristic variables. This research analyzed the spatio-temporal variation of SPI in NWC during 1960–2018; characteristic variables of drought (including drought frequency, drought duration, and drought severity) were identified and their distribution patterns were studied based on Run Theory; the evolution process of drought was discussed and spatial autocorrelation of drought characteristic variables was revealed by TFPW-MK, GMI, LMI, and General G.
From 1960 to 2018, the drought in NWC was alleviating, which was in accordance with the previous reports that the climate in NWC has turned from warm dry to warm wet (Yuan et al., 2017; Huang et al., 2019; Cao et al., 2020). Affected by the complicated topography and various climate conditions, the variation of drought had obvious regional differences; west NWC with an arid or semi-arid climate was presented with significant wet tendency, while east NWC with a semi-humid climate experienced an increasing trend in dryness. The migration path of the gravity center of SPI showed that SPI moved towards higher latitude in NWC. On an annual scale, the average drought frequency in NWC from 1960 to 2018 was 71 times, while the average drought duration and severity were 3.8 months and 4.0, respectively. The spatial distribution of drought frequency decreased from southeast to northwest, while drought duration and severity increased from southeast to northwest, illustrating that east NWC experienced more frequent droughts that were less harmful while west NWC experienced fewer droughts that brought greater drought damage. Regardless of time scale, drought duration was positively correlated to drought severity; a longer drought duration tends to cause a severer drought event. Summer and autumn were characterized with longer duration and higher severity while spring and winter were characterized with shorter duration and lower severity. According to GMI, all the seasonal drought variables presented with significant positive spatial correlation. The results of LMI showed that there was a significant difference in the local spatial autocorrelation of seasonal drought variables. The hotspots of annual drought frequency mainly concentrated in Shaanxi while the hotspots of annual drought duration and severity mainly occurred in northwest Xinjiang, suggesting that there was significant positive correlation between Shaanxi and its surrounding areas, and between northwest Xinjiang and its adjacent areas. That is, there existed regional similarity of drought characteristics in Shaanxi and surrounding areas (more droughts, shorter duration, and lower severity), while northwest Xinjiang and adjacent areas exhibited the same drought characteristic with fewer but more severe droughts.
Compared with previous studies, this study considered the spatial heterogeneity and similarity of drought, the combination of the drought index map, drought characteristic variable map, Z-statistics of SPI by TFPW-MK, the barycenter model, and standard deviation ellipse, and the spatial autocorrelation analysis can be expected to explore the spatio-temporal evolution characteristics of meteorological drought in NWC. However, though the drought of NWC has been relieved, the average precipitation (less than 300 mm year−1) increased only by 10%, which was not enough to change the basic state of climate in NWC; the drought issue is still a major factor limiting the economic development of NWC. Meanwhile, the cause mechanism of drought evolution characteristics in NWC was simply mentioned due to space constraints; root cause analysis and how long can the wetting tendency last in NWC will be the next research topics.
This study employed SPI for drought identification without considering the effects of potential evapotranspiration, which may have an impact on the results. Further study on the application conditions of SPEI and SPI for drought assessment in NWC should be conducted.
Data Availability Statement
The data analyzed in this study are subject to the following licenses/restrictions: The datasets analyzed in this study are only available upon request directed to the China Meteorological Data Sharing Service System (http://www.cma.gov.cn). Requests to access these datasets should be directed to http://www.cma.gov.cn.
Author Contributions
HL: Data curation, Funding Acquisition, Writing—original draft, Methodology, and Validation. EH: Validation and Writing—review and editing. JD: Methodology and Writing—review and editing.
Funding
This work is financially supported by the National Natural Science Foundation of China (No. 42007186).
Conflict of Interest
The authors declare that the research was conducted in the absence of any commercial or financial relationships that could be construed as a potential conflict of interest.
Publisher’s Note
All claims expressed in this article are solely those of the authors and do not necessarily represent those of their affiliated organizations, or those of the publisher, the editors, and the reviewers. Any product that may be evaluated in this article, or claim that may be made by its manufacturer, is not guaranteed or endorsed by the publisher.
Acknowledgments
We sincerely thank the China Meteorological Data Sharing Service System for providing the meteorological data, and we wish to thank the editors and reviewers for reviewing the manuscript and providing insightful comments to improve the quality of this paper.
References
Amirataee, B., Montaseri, M., and Rezaie, H. (2020). An Advanced Data Collection Procedure in Bivariate Drought Frequency Analysis. Hydrological Process. 34 (21), 4067–4082. doi:10.1002/hyp.13866
Ayantobo, O. O., Li, Y., Song, S., and Yao, N. (2017). Spatial Comparability of Drought Characteristics and Related Return Periods in mainland China over 1961-2013. J. Hydrol. 550, 549–567. doi:10.1016/j.jhydrol.2017.05.019
Azimi, S., Hassannayebi, E., Boroun, M., and Tahmoures, M. (2020). Probabilistic Analysis of Long-Term Climate Drought Using Steady-State Markov Chain Approach. Water Resour. Manag. 34 (15), 4703–4724. doi:10.1007/s11269-020-02683-5
Beguería, S., Vicente-Serrano, S. M., Reig, F., and Latorre, B. (2014). Standardized Precipitation Evapotranspiration index (SPEI) Revisited: Parameter Fitting, Evapotranspiration Models, Tools, Datasets and Drought Monitoring. Int. J. Climatol. 34, 3001–3023. doi:10.1002/joc.3887
Bonaccorso, B., Peres, D. J., Castano, A., and Cancelliere, A. (2015). SPI-based Probabilistic Analysis of Drought Areal Extent in Sicily. Water Resour. Manage. 29 (2), 459–470. doi:10.1007/s11269-014-0673-4
Brito, S. S. B., Cunha, A. P. M. A., Cunningham, C. C., Alvalá, R. C., Marengo, J. A., and Carvalho, M. A. (2018). Frequency, Duration and Severity of Drought in the Semiarid Northeast Brazil Region. Int. J. Climatol 38, 517–529. doi:10.1002/joc.5225
Burke, E. J., Perry, R. H. J., and Brown, S. J. (2010). An Extreme Value Analysis of UK Drought and Projections of Change in the Future. J. Hydrol. 388, 131–143. doi:10.1016/j.jhydrol.2010.04.035
Campozano, L., Ballari, D., Montenegro, M., and Avilés, A. (2020). Future Meteorological Droughts in Ecuador: Decreasing Trends and Associated Spatio-Temporal Features Derived from CMIP5 Models. Front. Earth Sci. 8, 17. doi:10.3389/feart.2020.00017
Cao, D., Zhang, J., Yan, H., Xun, L., Yang, S., Bai, Y., et al. (2020). Regional Assessment of Climate Potential Productivity of Terrestrial Ecosystems and its Responses to Climate Change over China from 1980-2018. IEEE Access 8, 11138–11151. doi:10.1109/access.2019.2963458
Chen, H., and Sun, J. (2015). Changes in Drought Characteristics over China Using the Standardized Precipitation Evapotranspiration index. J. Clim. 28 (13), 5430–5447. doi:10.1175/jcli-d-14-00707.1
Chen, Y. D., Zhang, Q., Xiao, M., Singh, V. P., and Zhang, S. (2016). Probabilistic Forecasting of Seasonal Droughts in the Pearl River basin, China. Stoch Environ. Res. Risk Assess. 30 (7), 2031–2040. doi:10.1007/s00477-015-1174-6
Chen, Y. G. (2021). An Analytical Process of Spatial Autocorrelation Functions Based Moran's index. Plos One 16 (4), e0249589. doi:10.1371/journal.pone.0249589
Deng, S., Chen, T., Yang, N., Qu, L., Li, M., and Chen, D. (2018). Spatial and Temporal Distribution of Rainfall and Drought Characteristics across the Pearl River basin. Sci. Total Environ. 619-620, 28–41. doi:10.1016/j.scitotenv.2017.10.339
Dinpashoh, Y., Jhajharia,Fakheri-Fard, D. A., Vijay, P. S., and Ercan, K. (2011). Trends in Reference Crop Evapotranspiration over Iran. J. Hydrol. 399, 422–433. doi:10.1016/j.jhydrol.2011.01.021
Fung, K. F., Huang, Y. F., and Koo, C. H. (2020). Assessing Drought Conditions through Temporal Pattern, Spatial Characteristic and Operational Accuracy Indicated by SPI and SPEI: Case Analysis for Peninsular Malaysia. Nat. Hazards 103, 2071–2101. doi:10.1007/s11069-020-04072-y
Gocic, M., and Trajkovic, S. (2013). Analysis of Changes in Meteorological Variables Using Mann-Kendall and Sen's Slope Estimator Statistical Tests in Serbia. Glob. Planet. Change 100, 172–182. doi:10.1016/j.gloplacha.2012.10.014
Gu, L., Chen, J., Xu, C. Y., Wang, H. M., and Zhang, L. P. (2018). Synthetic Impacts of Internal Climate Variability and Anthropogenic Change on Future Meteorological Droughts over China. Water 10 (11), 1702. doi:10.3390/w10111702
Guo, H., Bao, A., Liu, T., Jiapaer, G., Ndayisaba, F., Jiang, L., et al. (2018). Spatial and Temporal Characteristics of Droughts in Central Asia during 1966-2015. Sci. Total Environ. 624, 1523–1538. doi:10.1016/j.scitotenv.2017.12.120
Haroon, M. A., Zhang, J., and Yao, F. (2016). Drought Monitoring and Performance Evaluation of MODIS-Based Drought Severity index (DSI) over Pakistan. Nat. Hazards 84 (2), 1349–1366. doi:10.1007/s11069-016-2490-y
Hu, Z., Chen, X., Chen, D., Li, J., Wang, S., Zhou, Q., et al. (2019). “Dry Gets Drier, Wet Gets Wetter”: A Case Study over the Arid Regions of central Asia. Int. J. Climatol 39 (2), 1072–1091. doi:10.1002/joc.5863
Hu, Z., Chen, X., Li, Y., Zhou, Q., and Yin, G. (2021). Temporal and Spatial Variations of Soil Moisture over Xinjiang Based on Multiple GLDAS Datasets. Front. Earth Sci. 9, 654848. doi:10.3389/feart.2021.654848
Huang, J. Q., Ma, J. R., Guan, X. D., Li, Y., and He, Y. L. (2019). Progress in Semi-arid Climate Change Studies in China. Adv. Atmos. Sci. 36 (9), 922–937. doi:10.1007/s00376-018-8200-9
Huang, J., Sun, S., and Zhang, J. (2013). Detection of Trends in Precipitation during 1960–2008 in Jiangxi Province, Southeast China. Theor. Appl. Climatol 114 (1–2), 237–251. doi:10.1007/s00704-013-0831-2
Huang, S. Z., Huang, Q., Chang, J. X., Zhu, Y. L., Leng, G. Y., and Xing, L. (2015). Drought Structure Based on a Nonparametric Multivariate Standardized Drought index across the Yellow River basin, China. J. Hydrol. 530, 127–136. doi:10.1016/j.jhydrol.2015.09.042
Jhajharia, D., Dinpashoh, Y., Kahya, E., Singh, V. P., and Fakheri-Fard, A. (2011). Trends in Reference Evapotranspiration in the Humid Region of Northeast India. Hydrol. Process. 26 (3), 421–435. doi:10.1002/hyp.8140
Ji, F., Wu, Z., Huang, J., and Chassignet, E. P. (2014). Evolution of Land Surface Air Temperature Trend. Nat. Clim Change 4 (4), 462–466. doi:10.1038/nclimate2223
Kalisa, W., Zhang, J., Igbawua, T., Ujoh, F., Ebohon, O. J., Namugize, J. N., et al. (2020). Spatio-temporal Analysis of Drought and Return Periods over the East African Region Using Standardized Precipitation Index from 1920 to 2016. Agric. Water Manage. 237, 106195. doi:10.1016/j.agwat.2020.106195
Leng, X., Liu, X., Gao, Y., Liu, Y., Yang, Q., Sun, G., et al. (2020). Drought Assessment of Southwestern China Based on HadGEM2-ES Model under Representative Concentration Pathway 4.5 Scenario. Nat. Hazards 102, 307–334. doi:10.1007/s11069-020-03928-7
Li, H., Gao, Y., and Hou, E. (2021). Spatial and Temporal Variation of Precipitation during 1960-2015 in Northwestern China. Nat. Hazards 109 (3), 2173–2196. doi:10.1007/s11069-021-04915-2
Li, S.-Y., Miao, L.-J., Jiang, Z.-H., Wang, G.-J., Gnyawali, K. R., Zhang, J., et al. (2020). Projected Drought Conditions in Northwest China with CMIP6 Models under Combined SSPs and RCPs for 2015-2099. Adv. Clim. Change Res. 11 (3), 210–217. doi:10.1016/j.accre.2020.09.003
Lin, Z., and Shelton, S. (2020). Interdecadal Change of Drought Characteristics in Mahaweli River Basin of Sri Lanka and the Associated Atmospheric Circulation Difference. Front. Earth Sci. 8, 306. doi:10.3389/feart.2020.00306
Liu, Z., Menzel, L., Dong, C., and Fang, R. (2016a). Temporal Dynamics and Spatial Patterns of Drought and the Relation to ENSO: a Case Study in Northwest China. Int. J. Climatol. 36, 2886–2898. doi:10.1002/joc.4526
Liu, Z., Wang, Y., Shao, M., Jia, X., and Li, X. (2016b). Spatiotemporal Analysis of Multiscalar Drought Characteristics across the Loess Plateau of China. J. Hydrol. 534, 281–299. doi:10.1016/j.jhydrol.2016.01.003
Machiwal, D., Kumar, S., Dayal, D., and Mangalassery, S. (2017). Identifying Abrupt Changes and Detecting Gradual Trends of Annual Rainfall in an Indian Arid Region under Heightened Rainfall Rise Regime. Int. J. Climatol. 37 (5), 2719–2733. doi:10.1002/joc.4875
Ministry of Water Resources, P.R. China (MWR) (2015). Bulletin of Flood and Drought Disaster in China 2015. Beijing: China Water Power Press.
Mishra, A. K., Sivakumar, B., and Singh, V. P. (2015). Drought Processes, Modeling, and Mitigation. J. Hydrol. 526, 1–2. doi:10.1016/j.jhydrol.2015.03.054
Mo, X. G., Hu, S., Lu, H. J., Lin, Z. H., and Liu, S. X. (2018). Drought Trends over the Terrestrial China in the 21st century in Climate Change Scenarios with Ensemble GCM Projections. J. Nat. Resour. 33 (7), 1244–1256. (in Chinese). doi:10.31497/zrzyxb.20170666
Mondal, A., and Mujumdar, P. P. (2015). Return Levels of Hydrologic Droughts under Climate Change. Adv. Water Resour. 75, 67–79. doi:10.1016/j.advwatres.2014.11.005
Montaseri, M., and Amirataee, B. (2017). Comprehensive Stochastic Assessment of Meteorological Drought Indices. Int. J. Climatol. 37, 998–1013. doi:10.1002/joc.4755
National Bureau of Statistics of China, P.R. China (NBS) (2015). China Statistical Yearbook 2014. Xicheng District, Beijing: NBS.
Naumann, G., Alfieri, L., Wyser, K., Mentaschi, L., Betts, R. A., Carrao, H., et al. (2018). Global Changes in Drought Conditions under Different Levels of Warming. Geophys. Res. Lett. 45, 3285–3296. doi:10.1002/2017gl076521
Naumann, G., Spinoni, J., Vogt, J. V., and Barbosa, P. (2015). Assessment of Drought Damages and Their Uncertainties in Europe. Environ. Res. Lett. 10, 124013. doi:10.1088/1748-9326/10/12/124013
Ogunrinde, A. T., Enaboifo, M. A., Olotu, Y., Bao, P., and Tayo, A. B. (2021). Characterization of Drought Using Four Drought Indices under Climate Change in the Sahel Region of Nigeria: 1981–2015. Theor. Appl. Climatol 143 (1-2), 843–860. doi:10.1007/s00704-020-03453-4
Oikonomou, P. D., Karavitis, C. A., Tsesmilis, D. E., Kolokytha, E., and Maia, R. (2020). Drought Characteristics Assessment in Europe over the Past 50 Years. Water Resour. Manag. 34 (15), 4757–4772. doi:10.1007/s11269-020-02688-0
Raziei, T., Martins, D. S., Bordi, I., Santos, J. F., Portela, M. M., Pereira, L. S., et al. (2014). SPI Modes of Drought Spatial and Temporal Variability in Portugal: Comparing Observations, PT02 and GPCC Gridded Datasets. Water Resour. Manage. 29, 487–504. doi:10.1007/s11269-014-0690-3
Shi, P., Wu, M., Qu, S., Jiang, P., Qiao, X., Chen, X., et al. (2015). Spatial Distribution and Temporal Trends in Precipitation Concentration Indices for the Southwest China. Water Resour. Manage. 29 (11), 3941–3955. doi:10.1007/s11269-015-1038-3
Spinoni, J., Barbosa, P., De Jager, A., McCormick, N., Naumann, G., Vogt, J. V., et al. (2019). A New Global Database of Meteorological Drought Events from 1951 to 2016. J. Hydrol. Reg. Stud. 22, 100593. doi:10.1016/j.ejrh.2019.100593
Sternberg, T. (2018). Moderating Climate hazard Risk through Cooperation in Asian Drylands. Land 7 (1), 1–13. doi:10.3390/land7010022
Sun, F., Mejia, A., Zeng, P., and Che, Y. (2019). Projecting Meteorological, Hydrological and Agricultural Droughts for the Yangtze River basin. Sci. Total Environ. 696, 134076. doi:10.1016/j.scitotenv.2019.134076
Tirivarombo, S., Osupile, D., and Eliasson, P. (2018). Drought Monitoring and Analysis: Standardised Precipitation Evapotranspiration Index (SPEI) and Standardised Precipitation Index (SPI). Phys. Chem. Earth, Parts A/B/C 106, 1–10. doi:10.1016/j.pce.2018.07.001
Udmale, P., Ichikawa, Y., Manandhar, S., Ishidaira, H., and Kiem, A. S. (2014). Farmers׳ Perception of Drought Impacts, Local Adaptation and Administrative Mitigation Measures in Maharashtra State, India. Int. J. Disaster Risk Reduction 10, 250–269. doi:10.1016/j.ijdrr.2014.09.011
Wang, H., Zhang, J. F., Zhu, F. B., and Zhang, W. W. (2016). Analysis of Spatial Pattern of Aerosol Optical Depth and Affecting Factors Using Spatial Autocorrelation and Spatial Autoregressive Model. Environ. Earth Sci. 75 (9), 822. doi:10.1007/s12665-016-5656-8
Wang, Y.-J., and Qin, D.-H. (2017). Influence of Climate Change and Human Activity on Water Resources in Arid Region of Northwest China: an Overview. Adv. Clim. Change Res. 8 (4), 268–278. in Chinese. doi:10.1016/j.accre.2017.08.004
Wang, Z., Li, J., Lai, C., Zeng, Z., Zhong, R., Chen, X., et al. (2017). Does Drought in China Show a Significant Decreasing Trend from 1961 to 2009? Sci. Total Environ. 579, 314–324. doi:10.1016/j.scitotenv.2016.11.098
Wei, W., Zhang, H., Zhou, J., Zhou, L., Xie, B., and Li, C. (2021). Drought Monitoring in Arid and Semi-arid Region Based on Multi-Satellite Datasets in Northwest, China. Environ. Sci. Pollut. Res. 28, 51556–51574. doi:10.1007/s11356-021-14122-y
Wu, J., Chen, X., Yao, H., and Zhang, D. (2021). Multi-timescale Assessment of Propagation Thresholds from Meteorological to Hydrological Drought. Sci. Total Environ. 765, 144232. doi:10.1016/j.scitotenv.2020.144232
Xu, K., Yang, D., Xu, X., and Lei, H. (2015). Copula Based Drought Frequency Analysis Considering the Spatio-Temporal Variability in Southwest China. J. Hydrol. 527, 630–640. doi:10.1016/j.jhydrol.2015.05.030
Yang, S. Y., Meng, D., Li, X. J., and Wu, X. L. (2018). Multi-scale Responses of Vegetation Changes Relative to the SPEI Meteorological Drought index in North China in 2001-2014. Acta Ecol. Sin 38, 1028–1039. doi:10.5846/stxb201611242398
Yang, X., Wood, E. F., Sheffield, J. L., Ren, L., Zhang, M., and Wang, Y. (2018a). Bias Correction of Historical and Future Simulations of Precipitation and Temperature for China from CMIP5 Models. J. Hydrometeorol 19 (3), 609–623. doi:10.1175/jhm-d-17-0180.1
Yuan, Q., Wu, S., Dai, E., Zhao, D., Zhang, X., and Ren, P. (2017). Spatio-temporal Variation of the Wet-Dry Conditions from 1961 to 2015 in China. Sci. China Earth Sci. 60 (11), 2041–2050. doi:10.1007/s11430-017-9097-1
Yue, S., Pilon, P., Phinney, B., and Cavadias, G. (2002). The Influence of Autocorrelation on the Ability to Detect Trend in Hydrological Series. Hydrol. Process. 16 (9), 1807–1829. doi:10.1002/hyp.1095
Keywords: meteorological drought, Run Theory, differentiation characteristic, spatial similarity, evolution process, Northwest China
Citation: Li H, Hou E and Deng J (2022) Spatio-Temporal Differentiation Characteristic and Evolution Process of Meteorological Drought in Northwest China From 1960 to 2018. Front. Earth Sci. 10:857953. doi: 10.3389/feart.2022.857953
Received: 19 January 2022; Accepted: 16 February 2022;
Published: 24 March 2022.
Edited by:
Luis Gimeno, University of Vigo, SpainReviewed by:
Zengyun Hu, Chinese Academy of Sciences (CAS), ChinaHuopo Chen, Institute of Atmospheric Physics (CAS), China
Copyright © 2022 Li, Hou and Deng. This is an open-access article distributed under the terms of the Creative Commons Attribution License (CC BY). The use, distribution or reproduction in other forums is permitted, provided the original author(s) and the copyright owner(s) are credited and that the original publication in this journal is cited, in accordance with accepted academic practice. No use, distribution or reproduction is permitted which does not comply with these terms.
*Correspondence: Hui Li, lihui@xust.edu.cn