Using Eruption Source Parameters and High-Resolution Grain-Size Distributions of the 7.7 ka Cleetwood Eruption of Mount Mazama (Oregon, United States) to Reveal Primary and Secondary Eruptive Processes
 Joshua Wiejaczka
 Thomas Giachetti
- Department of Earth Sciences, University of Oregon, Eugene, OR, United States
Numerical simulations of real-time volcanic ash dispersal forecasts and ensuing tephra hazard assessments rely on field-derived Eruption Source Parameters (ESPs) such as plume height, erupted volume, mass eruption rate and the Total Grain-Size Distribution (TGSD) of particles ejected from a volcano into the atmosphere. Here we calculate ESPs for the ∼7.7 ka Cleetwood eruption of Mount Mazama (Crater Lake/giiwas, Oregon, United States) that immediately preceded the caldera-forming eruption. We also introduce a novel approach to produce high-resolution grain-size distributions (GSDs) of individual samples over a wide range of particle sizes (0.00035–35 mm) by combining laser diffraction with dynamic image analysis. Detailed field analysis allows us to divide the Cleetwood eruptive sequence into a series of two distinct and consecutive VEI four eruptions: the lower (∼0.98 km3) and upper (∼0.20 km3) Cleetwood units. The lower Cleetwood was the most intense with a plume height of ∼19 km and an average mass discharge rate of ∼3.1×10⁷ kg s−1. Its Total Grain-Size Distribution yields a fractal dimension D∼3.1, like other similar eruptions. All twelve high-resolution GSDs produced in this study exhibit two systematic breaks in slope from a power-law relationship at ∼0.125 mm and ∼0.510 mm. These breaks in slope create three segments: S1 (<0.125 mm), S2 (0.125–0.510 mm), and S3 (>0.510 mm) that can be fit by power-law relationships with fractal dimensions of D1=2.5 ± 0.2, D2=0.5 ± 0.1, and D3=3.6 ± 1.1, respectively. Together with ESPs and detailed componentry, D values at various locations give insight into magma fragmentation and tephra transport. We find that D1 values are positively correlated with the median grain-size and are similar to values found in rapid decompression magma fragmentation experiments. We infer that D1 values reflect the size distribution of the primary products of magma fragmentation and could thus be used to infer the potential energy at fragmentation. We interpret the relatively low values of D2 to an increase in dense components due to particle rafting. Our work shows that comparing high-resolution grain-size distributions at several locations on the dispersal axis can further constrain primary and secondary eruptive processes which prove crucial to improving tephra hazard assessments and dispersal forecasting.
1 Introduction
Volcanic plumes and tephra fallout from explosive eruptions are the most far reaching of the volcanic hazards and have the potential to cause fatalities, disrupt the global economy, and affect climate (McCormick et al., 1995; Robock, 2000; Sigl et al., 2015; Choumert-Nkolo et al., 2021). Tephra dispersion and sedimentation models are used before and during an eruption to forecast and mitigate impacts to air traffic and communities in the path of an evolving volcanic ash cloud (Bonadonna et al., 2005; Schwaiger et al., 2012). The accuracy of these forecasts largely depends on that of input eruption source parameters (ESPs) such as plume height (Ht), erupted volume (V), mass eruption rate (MER), and the Total Grain-Size Distribution (TGSD) of particles ejected by a volcano into the atmosphere. These initial eruption source parameters are challenging to constrain in real time and thus rely on information obtained from detailed field studies of analogous eruptions. The construction of isopach and isopleth maps and the collection of individual grain size distributions, which are all needed to calculate ESPs, are at times challenging, in part because proximal deposits are usually too thick to be accurately measured and described, and distal deposits are often missing. It is thus crucial to better understand the relationships between eruption source parameters and the characteristics of the deposit (e.g., thickness and grain size distribution as a function of location compared to the vent and main dispersal axis).
The TGSD of a given eruption evolves with time from fragmentation in the conduit to final deposition on the Earth’s surface. The primary products of magma fragmentation exhibit cumulative grain-size distributions (i.e., the ‘primary TGSD’) that can be fit with a power-law relationship, (N > d) = λd−D, where N is the number density of particles, d is the equivalent particle diameter, λ is a scaling factor, and D is the power-law exponent or fractal dimension (Kaminski and Jaupart, 1998; Kueppers et al., 2006; Giachetti et al., 2021). Experimental fragmentation of volcanic products in particular yields D values that are always <3 and mostly around 2.5 ± 0.3 (Turcotte, 1997; Kaminski and Jaupart, 1998; Kueppers et al., 2006; Perugini and Kueppers, 2012). Kueppers et al. (2006) further showed that the fractal dimension of the size distributions of the products of experimental magma fragmentation by rapid decompression is positively correlated with the potential energy for fragmentation, and thus that D reflects the explosivity of an eruption. After fragmentation in the conduit, the primary TGSD evolves due to processes that can either increase (e.g., expansion, amalgamation and sintering; Rust and Cashman, 2011; Giachetti et al., 2021) or decrease (e.g., disruption, attrition, comminution, abrasion; Dufek and Manga, 2008; Dufek et al., 2012; Kueppers et al., 2012; Jones and Russell, 2017) the size of pyroclasts, making the TGSD one of the most difficult ESPs to constrain (Pioli et al., 2019). This overprinting of post fragmentation processes on the ‘final TGSD’ of tephra makes the primary TGSD, and thus the potential energy for fragmentation, challenging to determine. Additionally, the TGSD that needs to be implemented in tephra dispersion and deposition models (e.g., Tephra2, Bonadonna et al., 2005; FALL3D, Folch et al., 2020; NAME, Jones et al., 2007; Ash3D, Schwaiger et al., 2012), and its evolution with time and space, are poorly constrained because both the location and extent of secondary fragmentation in the conduit and/or the plume remain unclear. Provided the processes that affect the final TGSD can be disentangled, the latter can be used to gain information such as the depth and mechanisms of fragmentation, eruption column heights, the state of the magma at fragmentation, and the energy released by explosive fragmentation (Kueppers et al., 2006; Perugini and Kueppers, 2012; Rossi et al., 2019).
The final TGSD of an explosive eruption, later simply referred to as ‘TGSD’, is interpolated from individual grain-size distributions (GSDs) of the tephra deposit measured after the eruption at multiple locations (e.g., Murrow et al., 1980; Walker, 1980; Walker, 1981a; Walker, 1981b; Sparks et al., 1981; Carey and Sigurdsson, 1982; Parfitt 1998; Bonadonna and Houghton, 2005; Costa et al., 2016; Pioli et al., 2019). Due to secondary fragmentation and transport-related processes, individual GSDs vary from location to location and differ from both the final TGSD (Pioli et al., 2019; Mele et al., 2020) and the primary TGSD (Kaminski and Jaupart, 1998; Dufek et al., 2012; Giachetti et al., 2021). How these GSDs vary with direction, distance from the vent, and ESPs can illuminate processes that occur during transport and affect particles differently depending on their size, density, and shape (e.g., ash aggregation; Rose and Durant, 2011; Saxby et al., 2018; Rossi et al., 2021). It might thus be possible to glean information about both primary and secondary eruptive processes by comparing detailed GSDs of a single deposit obtained at different locations.
In this study, we calculate ESPs for the ∼7.7 ka Cleetwood eruption of Mount Mazama (Crater Lake/giiwas, Oregon, United States; Young, 1990), which immediately preceded the climactic caldera-forming eruption of the same volcano, one of the largest eruptions of the Holocene (Bacon, 1983; Buckland et al., 2021). Additionally, we apply a novel approach to produce high-resolution grain-size distributions of tephra samples over the range 0.00035–35 mm, by combining laser diffraction and dynamic image analysis techniques. Together with ESPs and detailed componentry, the high-resolution of these grain-size distributions from individual locations within the Cleetwood deposit provides insight into magma fragmentation, tephra transport, and how the Cleetwood eruption evolved over time.
2 Geologic background
Located in Oregon in western North America, Mount Mazama is one of the major stratovolcanoes making up the Cascade Volcanic Arc. Mount Mazama is especially known for the approximately 8×10 km2 diameter caldera that formed during the ∼7.7 ka climactic eruption and which now contains Crater Lake (referred to as giiwas by the Klamath tribes) within it. The Mazama edifice began forming ∼420 ka ago with the emplacement of basaltic andesite to dacitic lava flows. Mainly effusive activity continued until ∼27 ka ago with andesitic and dacitic compositions being volumetrically dominant (Bacon, 1983). The eruption of a rhyodacitic lava flow ∼27 ka ago marked the first eruption from the magma chamber that would later serve the climactic caldera-forming eruption (Bacon and Lanphere, 2006). The climactic eruption was preceded by two Plinian eruptions, Llao Rock and Cleetwood. The ∼7.9 ka Llao Rock eruption deposited a tephra fall unit of 2.27 km3 (non-DRE) followed by a rhyodacitic lava flow of ∼0.5 km3 (Bacon, 1983; Young, 1990). The Cleetwood eruption (described in detail below) followed and began with a Plinian phase that erupted a total of 1.54 km3 (non-DRE) of pyroclastic fall material according to Young (1990). Explosive activity then transitioned to an effusive stage, with no apparent break, extruding a rhyodacitic lava flow with a minimum volume of ∼0.6 km3 (Bacon, 1983). Although the exact timing of the Cleetwood eruption is still unclear, the back-flowing of the Cleetwood flow into the caldera and the fact that pumice from the climactic eruption are oxidized and welded to the top of the Cleetwood flow suggest that it occurred within weeks to no more than 100 years before the onset of the climactic eruption (Bacon, 1983; Kamata et al., 1993). The climactic caldera-forming eruption of Mount Mazama occurred 7633 ± 49 cal yr BP (Egan et al., 2015) in two distinct but continuous phases and erupted ∼176 km3 of tephra (61 km3 DRE; Buckland et al., 2020). The first phase consisted of a single-vent Plinian eruption followed by column collapse and the emplacement of the Wineglass Welded Tuff ignimbrite. The second, ring-vent phase produced a voluminous ash-flow and led to the formation of the caldera (Bacon, 1983; Young, 1990). The products forming four volcanic edifices were erupted after the caldera formed, with the extrusion of a 0.074 km3 unnamed dome ∼4.8 ka ago being the most recent volcanic activity at Crater Lake (Bacon et al., 2002).
2.1 The Cleetwood Eruption
To the best of our knowledge, all currently available information concerning the physical characteristics of the Cleetwood eruption of Mount Mazama comes from the works of Bacon (1983), Young (1990), Bourgeois (1998), and Wearn (2002). A summary of these studies related to the main deposit features and eruptive parameters is provided here.
The vent associated with the Cleetwood deposit is allegedly located near Cleetwood Cove in the low hills NE of the Crater Lake Rim Drive (Bacon, 1983) (Figure 1). At ∼35 km ESE of this vent, the Cleetwood tephra deposit is still >1 m thick and exhibits two units, the main/lower Cleetwood, herein referred to as lower, and the thinner upper Cleetwood, following Young’s nomenclature (Young, 1990). The lower Cleetwood unit (1.15 km3 non-DRE; Young, 1990) is characterized by strong normal grading and presents two distinct normally graded packages in thicker sections. The break within the lower Cleetwood unit does not affect the overall normal grading of the unit and does not represent a significant pause in eruptive activity (Young, 1990). The upper Cleetwood unit (0.39 km3 non-DRE; Young, 1990) is characterized by strong reverse grading, with a grey ash layer at the base that rapidly grades into coarser material primarily composed of pumice and obsidian pyroclasts. Due to the nature of proximal deposits and their tendency to obscure characteristics created from changes in eruption dynamics, the lower and upper Cleetwood units are indistinguishable at exposures on the caldera walls (Cleetwood Cove, Wineglass, and Skell Head; Young, 1990; Bourgeois, 1998). The Cleetwood fall deposit is ∼20 m thick at Cleetwood Cove, where individual lithic blocks can reach up to 1 m in diameter. This location contains alternating layers of lapilli/blocks and ash that decrease in thickness upwards through the section. The ash layers have been interpreted as intra-Plinian pyroclastic flows (Young, 1990).
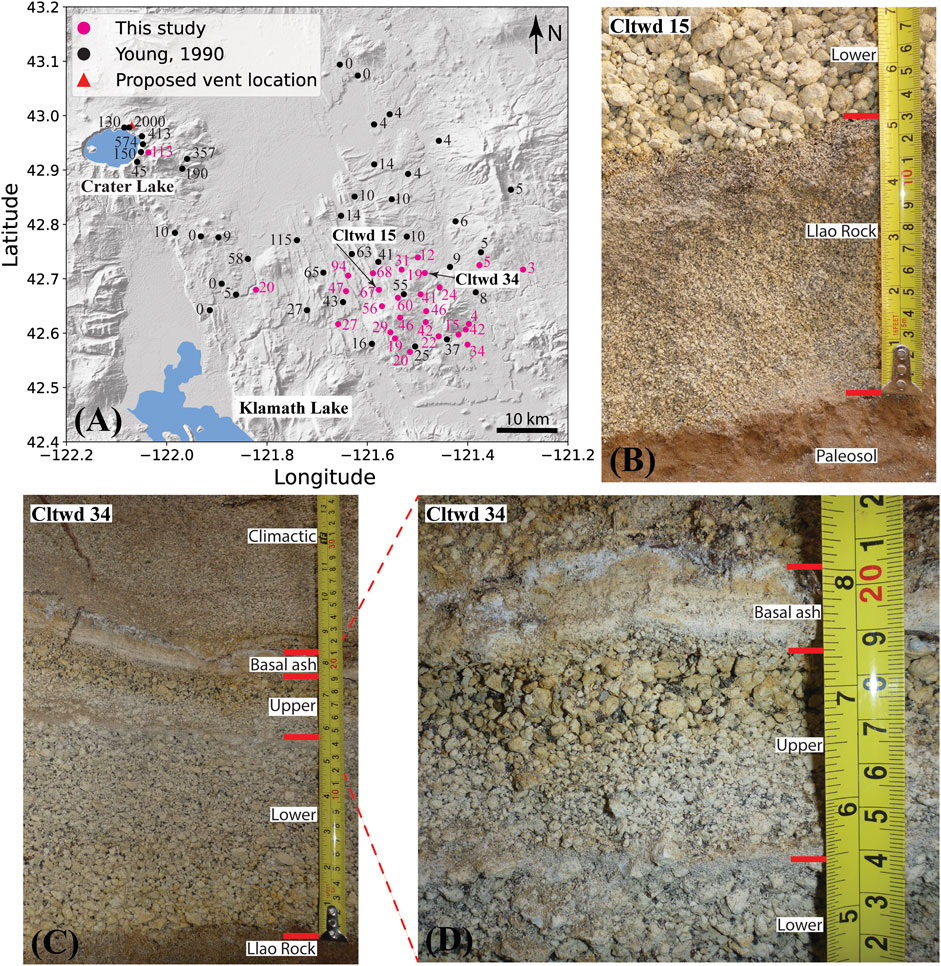
FIGURE 1. (A) Location of collected samples with total Cleetwood eruption thicknesses (cm) from this study, in pink, and Young (1990), in black. Proposed vent location from Bacon (1983) and background is global Earth relief (Tozer et al., 2019). (B) Photograph showing all of Llao Rock and the contact between Llao Rock and the lower Cleetwood unit at location Cltwd 15. Note the drastic increase in size of pyroclasts from Llao Rock to the lower Cleetwood. (C) Stratigraphic sequence showing lower Cleetwood, upper Cleetwood, and the overlying Climactic deposit at location Cltwd 34. Llao Rock is not present at this location. (D) Closeup photograph showing the end of the lower Cleetwood, upper Cleetwood, and the Basal ash layer, which marks the beginning of the Climactic deposit (Young, 1990). Note the gray fine ash layer defining the boundary between the lower and upper Cleetwood units. Measuring tape is in both inches (left) and centimeters (right).
The Cleetwood deposit is poor in finer material. In medial deposits where two distinct packages are present, lithic content is highest at the base of both packages and generally decreases with stratigraphic height. The abundance of lithics at these two positions within the stratigraphy suggests vent initiation and clearance (Young, 1990). Obsidian pyroclasts are the most abundant in the upper Cleetwood unit and generally increase with stratigraphic height at proximal exposures. The general decrease in lithics and increase in obsidian pyroclasts with time suggests a conduit that is progressively annealed with obsidian. This annealed obsidian is later eroded during the final explosive phase (Young, 1990; Bourgeois, 1998; Wearn, 2002). Observations at proximal locations suggest that the eruption column was sustained through time (Bourgeois, 1998), although the normally graded lower Cleetwood unit and the reversely graded upper Cleetwood unit indicate fluctuations in column height. The Cleetwood eruption is estimated to have an initial column height of 30 ± 5 km and an average mass eruption rate of (2 ± 1)×108 kg s−1 (Young, 1990). Explosive activity then transitioned to an effusive stage, with no apparent break, and extruded a ∼0.6 km3 rhyodacitic lava flow. ESPs and the continuity of the Cleetwood eruption are reevaluated herein.
3 Methods
3.1 Field
Field work was conducted in 2018 and 2021 on the Cleetwood tephra fall deposit, 6 km–71 km southeast of the proposed vent location (Figure 1). Twenty-eight pits were dug by hand until the bottom of the Cleetwood tephra deposit was reached. At each location, the deposit was divided into subunits based on visible changes in grading, particle size, color, and/or componentry, if applicable. Subunits were then described in detail, measured for their thickness, photographed, and several hundred grams to a few kilograms of each subunit were collected. Sampling the Cleetwood deposit itself was sometimes challenging due to the massive amount of tephra produced by the climactic eruption of Mount Mazama that lie atop the Cleetwood tephra fall, reaching up to 2.3 m in this field area depending on sampling location.
3.2 Laboratory Analyses
All samples collected at the 28 locations visited were analyzed for mass distribution by sieving and weighing. Samples from three locations, Cltwd 5, Cltwd 17, and Cltwd 18, respectively located at 46 km, 56 km, and 66 km from the proposed vent and roughly on the main dispersal axis of the Cleetwood eruption, were further analyzed for high-resolution grain-size distributions. Componentry was realized on all samples collected at Cltwd 5. We encourage the reader to use Figure 2 to follow our analytical protocol described thereafter.
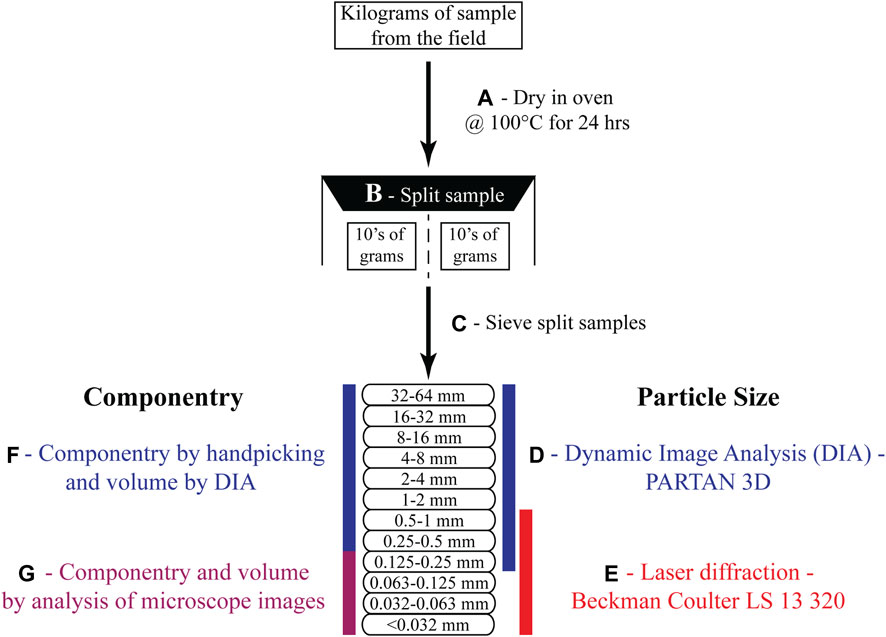
FIGURE 2. Summary of the workflow steps of our study. (A) All samples collected from the field were dried in an oven at 100 °C for 24 h to remove adsorbed water. (B) Samples were then split into workable aliquots of tens of grams each. (C) Split samples were manually sieved into twelve discrete size fractions. (D) Dynamic image analysis was performed on size fractions 0.125–0.25 mm and larger. (E) Laser diffraction analysis was performed on size fractions 0.5–1 mm and smaller. (F) Componentry for particles in size fractions 0.25–0.5 mm and larger was determined via handpicking under a stereo microscope and analyzing particle volumes using DIA. (G) Componentry and volume of particles in size fractions 0.125–0.25 mm and smaller were determined via microscope images.
3.3 High-Resolution Grain-Size Distribution
3.3.1 Individual Analysis
Tephra samples from each subunit were first dried in a convection oven at 100°C for 24 h to remove adsorbed water (Figure 2A). Bulk samples (kilograms) were split into workable aliquots (10s of grams) using a Humboldt testing equipment sample splitter (Figure 2B). Each aliquot was then manually sieved into twelve discrete sieve size fractions: 0–0.032 mm, 0.032–0.063 mm, 0.063–0.125 mm, 0.125–0.25 mm, 0.25–0.5 mm, 0.five to one mm, 1–2 mm, 2–4 mm, 4–8 mm, 8–16 mm, 16–32 mm and 32–64 mm (i.e., every phi size from -5 to 5; Figure 1C). Each size fraction was then weighed using a high-precision balance before high-resolution particle size analysis. Sieving was carried out before size analysis to 1) prevent larger particles from obscuring smaller ones during the analysis, which improves accuracy and precision of data collected via both Dynamic Image Analysis (DIA) and laser diffraction techniques, and 2) to allow for the measurement of the average density of the bulk tephra fall deposit at each size fraction, which is needed to convert masses to volumes and vice versa.
The size of each particle from each size fraction >0.125 mm was measured via DIA using a Microtrac PARTAN 3D particle size and shape analyzer at the University of Oregon (Figure 1D; Trafton and Giachetti, 2021). In this apparatus, particles travel along a vibrating tray and fall and rotate in front of a LED backlit screen. Once in freefall, a high-speed, high-resolution camera (100 fps, 15 µm px−1) tracks and records images of all individual particles, taking up to twelve images of each particle. Unlike other DIA instruments, the Microtrac PARTAN 3D uses multiple images of individual particles to measure their size and shape. Using multiple images of individual particles to determine these parameters is critical given the multitude and often extreme shapes of volcanic particles (Riley et al., 2003; Liu et al., 2015). The PARTAN 3D theoretically allows for the measurement of particles from 0.035 to 35 mm, but we found the analysis of volcanic ash <0.125 mm cumbersome and poorly reproducible due to static attraction between particles forming aggregates and thus did not analyze particles <0.125 mm with this instrument. For each particle analyzed, the PARTAN 3D provides, amongst other parameters, the particle size (volume, equivalent diameter) and shape parameters (e.g., form factor, axial ratio, solidity, convexity), thus creating a list of hundreds to hundreds of thousands of lines for each size fraction. Altogether, 104–106 particles >0.125 mm were individually analyzed per sample using this technique. This method is non-destructive and multiple analyses of individual batches of particles show very good reproducibility for particles >0.125 mm. Only size measurements, not shape, were used in this study.
Size measurements on aliquots of particles 0–1 mm were carried out using laser diffraction on a Beckman Coulter LS 13 320 at the USGS Cascades Volcano Observatory (Figure 2E; Blott and Pye, 2006). Although this method does not output an exact number of particles analyzed, we estimate that ∼105–107 particles from each subunit were measured using this technique based on the volume of aliquots used and size distributions obtained. This instrument provides information on particle size in the form of volume fraction as a function of an equivalent diameter, in 93 logarithmic bins regularly spaced from 0.00038 to 2 mm. It does not provide information on particle shape, but rather assumes that particles are spherical to calculate their equivalent diameter.
3.3.2 Combining Datasets
Size data for size fractions 0.125–0.25 mm, 0.25–0.5 mm, and 0.5–1 mm were obtained using both DIA and laser diffraction (Figures 2D,E, Figure 3), allowing for a comparison and combination of the two datasets. Because the PARTAN 3D gives the size of individual particles whereas laser diffraction provides volume fractions, some conversions and re-binning of the data need to be performed before comparing and combining the datasets. In this study, results are sorted and presented in 50 logarithmic bins from 0.00035 to 35 mm, and both the distributions of mass and number density of particles as a function of their size are used.
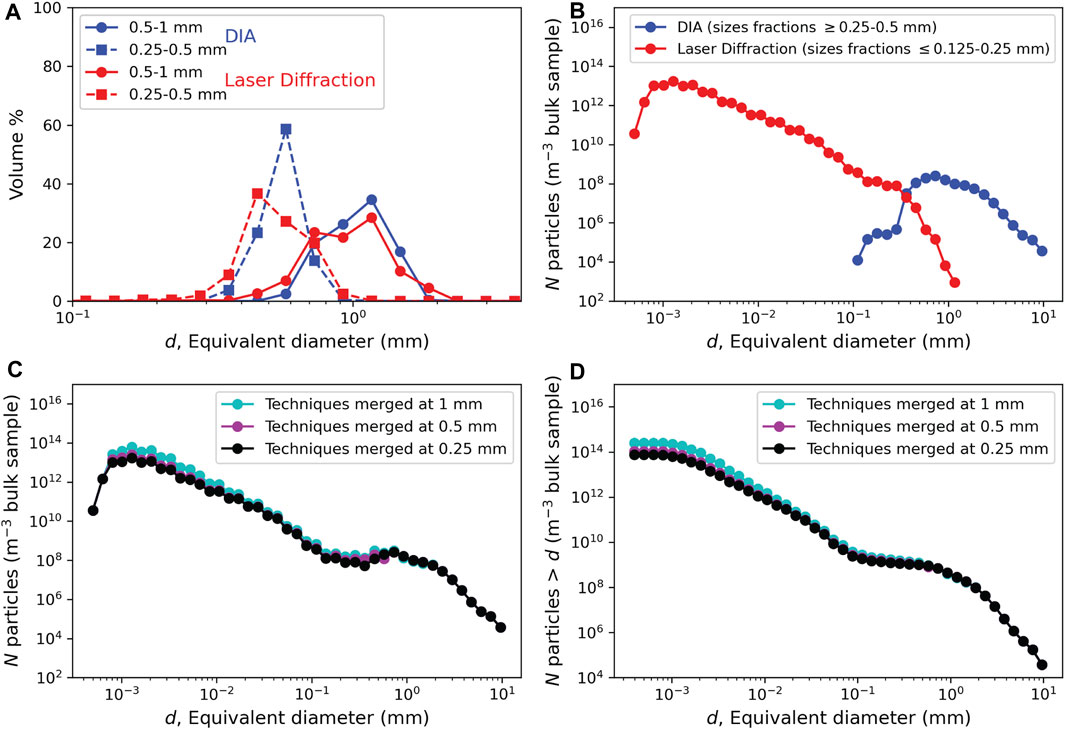
FIGURE 3. (A) Volume % as a function of equivalent diameter, d, for DIA and laser diffraction analyses of two identical size fractions (0.25–0.5 and 0.5–1 mm). Note that for the size fraction 0.25–0.5 mm, the volume % peak for DIA occurs at larger sizes compared to the laser diffraction technique, due to the way the volume of particles is measured (spherical assumption in laser diffraction, whereas shape is measured and thus taken into account using DIA). (B) Number density of particles per cubic meter of bulk sample, N, as a function of their equivalent diameter, d, showing the overlap between laser diffraction and dynamic image analysis (DIA) data. Each curve is an amalgamation of data obtained for several size fractions using a single technique. Sample used here is Cltwd 5A. (C,D) Number density, N, and cumulative number density (N > (D) of particles per cubic meter of tephra plotted as a function of equivalent diameter, (D). These graphs illustrate the impact of choosing different cutoffs (0.25, 0.5, or 1 mm) when merging data from DIA and laser diffraction. Note that the break in slope occurs at the same position regardless of the cutoff and thus is not an artifact of data combination.
Data collected by laser diffraction for each size fraction were first converted from volume percent to an actual volume using the mass and density of the size fraction. For each size fraction of each sample, the bulk density of the tephra sample was calculated by dividing the mass of all particles, obtained using a high-precision balance, by the volume they represent. For each of the size fractions 0.125–0.25 mm, 0.25–0.5 mm, and 0.5–1 mm, that volume is the sum of the volumes of all particles analyzed by DIA within that size fraction. For size fractions 0–0.032 mm, 0.032–0.063 mm, and 0.063–0.125 mm, density of the bulk tephra was determined directly using helium pycnometry (Micromeritics AccuPyc II 1340), assuming all particles at these sizes are vesicle-free, which was confirmed by observation under the microscope. Next, the number of particles for each bin was calculated by assuming spherical particles (as assumed when using laser diffraction technique) and dividing the total volume of each bin by the volume of a single particle with a diameter equal to the middle of the bin (Figure 3B). For DIA, individual particles are analyzed, and the number of particles per bin was thus obtained directly. Number of particles per cubic meter of tephra was then calculated by dividing the number of particles per bin by the total volume of the sample analyzed. Finally, to produce a single distribution, we use laser diffraction data obtained on all size fractions 0–0.25 mm and DIA data for all size fractions >0.25 mm (Figure 3C). Note that we present the data as cumulative number density in most plots (Figure 3D). We refer to these individual Grain Size Distributions as GSDs in the paper.
3.4 Componentry
Previously split samples (10s of grams) for each discrete size fraction were further split into aliquots of a few grams using a SOILTEST sample splitter to be analyzed for componentry. For size fractions ≥0.25 mm, all particles of the aliquot were handpicked and sorted into one of the following components using a stereomicroscope: pumice, banded pumice, obsidian pyroclast, lithic, and loose crystal (Supplementary Figure S1). Once separated, all particles of each component were analyzed using the Microtrac PARTAN 3D to measure the relative volume of all components in each size fraction. For size fractions 0.063–0.125 mm and 0.125–0.25 mm, images of the bulk sample were taken with a Leica M80 stereo microscope and individual particles were outlined based on type. The area of particle outlines from each component category was then calculated using the Fiji (ImageJ) image processing package (Schindelin et al., 2012), and particle volumes were calculated assuming a spherical shape. Upon visual inspection under the stereo microscope, all particles below 0.063 mm were classified as pumice. Altogether, 1,315–2,856 particles from each subunit were sorted.
3.5 Eruption Source Parameters
3.5.1 Erupted Volume
Isopach maps were constructed using field data from this study and work done by Young (1990). Isolines were manually drawn on Adobe Illustrator, and the area enclosed by each isoline was then calculated using the Fiji (ImageJ) image processing package. Airfall volume was calculated using TephraFits (Biass et al., 2019), which allows the user to best fit thickness (T, in cm) as a function of the square root of area (
3.5.2 Plume Height and Mass Eruption Rate
The maximum lithic (ML) size at each location was determined by averaging the diameter of the three largest clasts measured using digital calipers. Maximum lithic isopleth maps were then constructed using data from this study and the data from Young (1990), when possible. The same method for drawing isopach maps was used to construct the ML isolines (see above). Downwind and crosswind distances were then calculated using Fiji. Plume height, Ht (km), was calculated using the models of Carey and Sparks (1986) and Rossi et al. (2019) hereafter referred to as CS86 and R2019, respectively. The mass eruption rate (MER, in kg/s) was then calculated using the model of Mastin (2014), where MER = 140×Ht4.15 and Ht is the plume height expressed in km.
3.5.3 Total Grain-Size Distribution (TGSD)
The TGSD was determined by applying the Voronoi tessellation method of Bonadonna and Houghton (2005) to the 24 sieved-mass GSDs for all sample locations containing the lower Cleetwood unit. This method divides a tephra deposit into Voronoi polygons in which all interior points are closer to, and best represented by, a central sample point (centroid). The TGSD is then calculated by multiplying the GSD of the centroid by the mass fraction of its Voronoi polygon and summing all weighted GSDs. TGSD is presented herein as a cumulative number density. To determine the number density for a given grain-size, the mass (wt%) of each phi size (-5 to 5) was first converted to a volume using a density model (Supplementary Table S1). Following Bonadonna and Phillips (2003), this model assumes a constant density of 2,380 kg/m3 (i.e., the density of the glass as determined via helium pycnometry of crushed pumices) for particles smaller than 0.063 mm, a constant density of 455 kg/m3 for particles larger than 2 mm, calculated by dividing the mass of all particles >2 mm by their volume determined via DIA, and a linear increase in density between these bounds. Next, the number of particles was calculated by assuming spherical particles and dividing the total volume of each phi size by the volume of a single particle with a diameter equal to the mid interval between phi sizes. Finally, number density (m−3) was calculated by dividing the number of particles per bin by the total volume of all phi sizes (-5 to 5).
4 Results
4.1 Field Observations and Measurements
Twenty-eight pits were dug by hand to the ESE of Crater Lake (Figures 1, 4), covering the proximal and medial parts of the Cleetwood fall deposit. The Cleetwood and overlying Climactic deposits at these locations range from 2.5 to 113 cm and 12–232 cm in thickness, respectively.
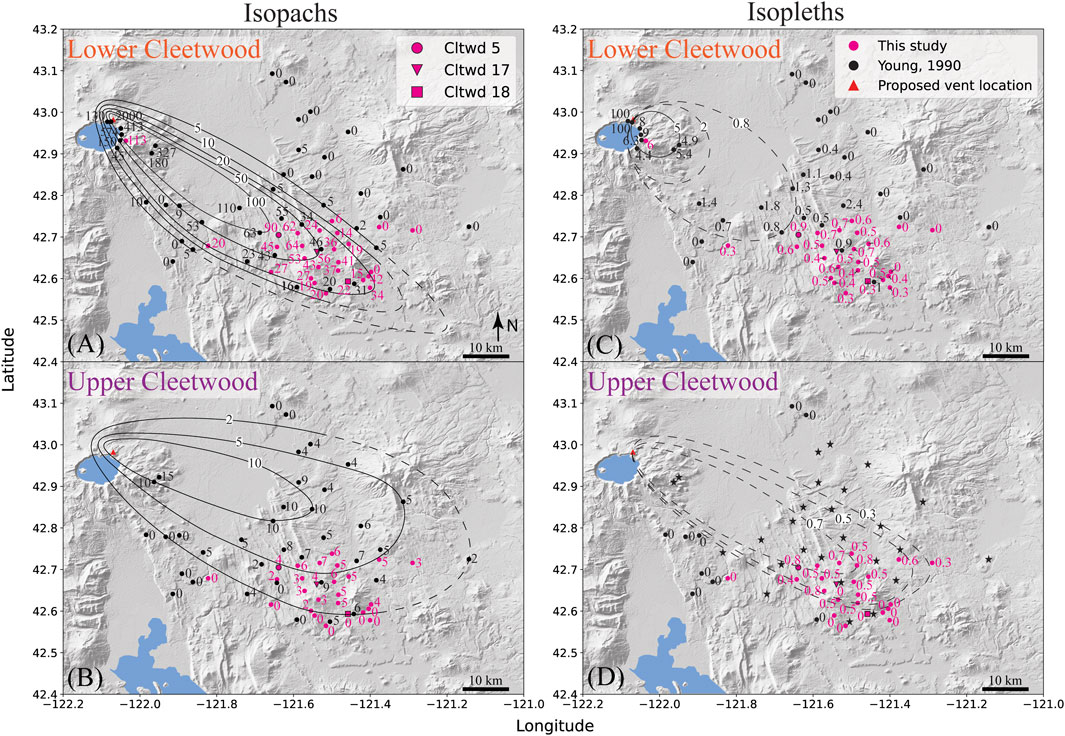
FIGURE 4. (A,B) Isopach maps for the lower and upper units of the Cleetwood eruption, respectively. (C,D) Maximum lithic (ML) isopleth maps for the lower and upper Cleetwood units, respectively. Stars on the upper Cleetwood isopleth map represent locations where the upper Cleetwood is present, but no ML data is available. All isolines are notated in centimeters. Background is global Earth relief (Tozer et al., 2019).
The lower Cleetwood unit makes up most of the Cleetwood fall deposit and is 90 cm thick at Cltwd 5 (Figure 4A; Figure 5). The dispersal axis of the lower Cleetwood unit trends to the SE. This phase is characterized by a single, normally graded unit at all locations. Pumices, which make up most of the deposit of the lower Cleetwood, are white-grey and reach up to 5 cm in diameter at the base of the deposit in medial locations. The base of the lower Cleetwood contains ∼15% lithics.
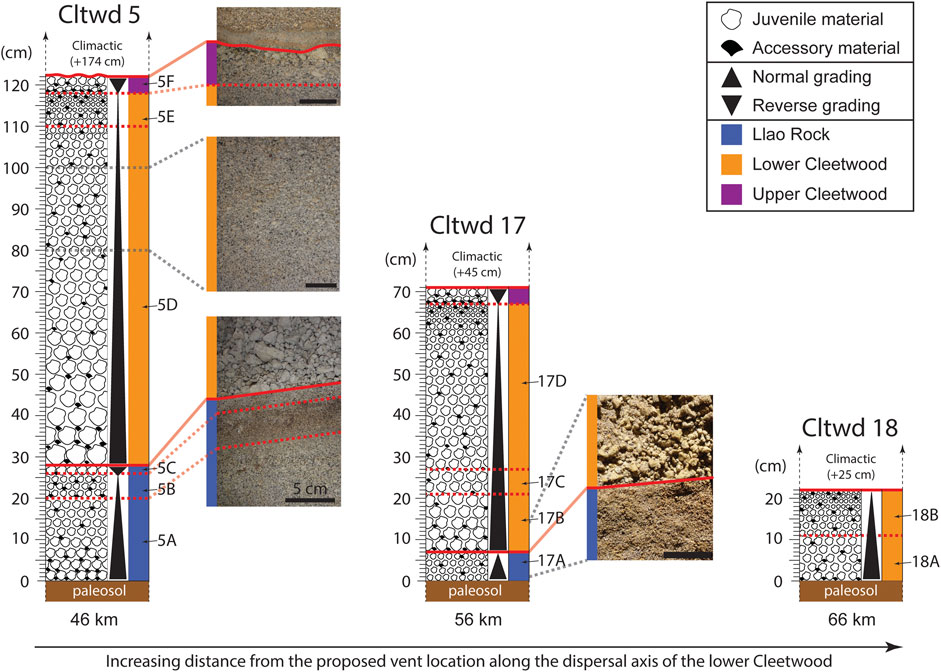
FIGURE 5. Stratigraphic columns for locations Cltwd 5, 17, and 18, all located on the main dispersion axis of the lower Cleetwood unit and at distances of 46 km, 56 km, and 66 km from the proposed vent, respectively (see Figure 3). Solid red lines indicate sharp contacts between phases, whereas the dashed red lines divide areas within phases that were subsampled. Scale bar is 5 cm in all photographs. Cltwd five exhibits Llao Rock and the two phases of the Cleetwood eruption. Llao Rock makes sharp contact with the paleosol, and three distinct subunits (A–C) are observed; subunit (A) (20 cm) normally grades into subunit (B) (6 cm) which then reversely grades into the uppermost subunit (C) (3 cm). Llao Rock and the lower Cleetwood make sharp contact. The lower Cleetwood unit (90 cm) is present as a normally graded unit. The upper Cleetwood unit (4 cm) is reversely graded, a characteristic seen at all locations where it is found. At Cltwd 17, Llao Rock and both Cleetwood phases are also observed. Llao Rock (7 cm) makes sharp contact with the paleosol but does not exhibit the three distinct subunits seen at Cltwd 5, it is normally graded. Llao Rock and the lower Cleetwood make sharp contact with each other. The lower Cleetwood normally grades until the upper Cleetwood unit. At Cltwd 18, only the lower Cleetwood (22 cm) is present and found as one normally graded unit that makes sharp contact with the paleosol at its base. At these three locations, the Cleetwood fall deposit is overlayed by 25–174 cm of climactic fall deposit.
The upper Cleetwood unit is present up to ∼80 km ESE of the proposed vent location (Figure 4C). Its dispersal axis trends to the ESE and is the widest of the two phases. At medial locations directly East of the vent, the upper Cleetwood is the only phase present. The deposit of the upper Cleetwood is characterized by a strong reverse grading (Figure 4) and a thin grey ash layer marks the boundary between the lower and upper units at medial locations SE of the vent. The contact between the lower and upper units is sharp with no visible signs of erosion. Obsidian pyroclasts are visibly more abundant within the upper Cleetwood compared to the other phase.
Overall, the dispersal axes of the lower and upper units seem to indicate a slight shift in the dominant wind direction from SE to ESE during the Cleetwood eruptive sequence (Figures 4A,B).
4.2 Individual Grain-Size Distribution
For locations where phases are divided into subunits (e.g., lower Cleetwood at Cltwd 5: 5D, and 5E), the thickness fraction of each subunit was used as a weight to calculate the GSD of the whole phase at that location using the individual GSDs of all subunits. Cumulative GSDs of all units at Cltwd 5, Cltwd 17, and Cltwd 18 (∼46, 56, and 66 km away from the vent) are similar in shape; they show two systematic breaks in slope from a power-law relationship at ∼0.125 mm and ∼0.510 mm (Figure 6A), creating three individual segments hereafter named S1, S2, and S3 (Figure 6B). Each segment can be fit by a power-law relationship, N>d = λd−D, where D is the fractal dimension of the segment of the distribution considered. For all units, D1 values, which correspond to particles <0.125 mm (Table 1), range from 2.1–2.7. For a given phase, D1 does not vary with distance from the vent. Values of D2, which correspond to particles ∼0.125–0.510 mm in size, are the lowest of all Ds for all units and range from 0.3–0.7. D2 values slightly increase with distance from the vent for a given phase. Values of D3, for particles >0.510 mm, vary the most (2.7–4.7) and increase with distance from the vent for a given unit. Note that the breaks in slope observed on all GSDs are also visible on the DIA and laser diffraction data when considered individually (Figure 3B), and thus were not artificially created following the combination of the two datasets.
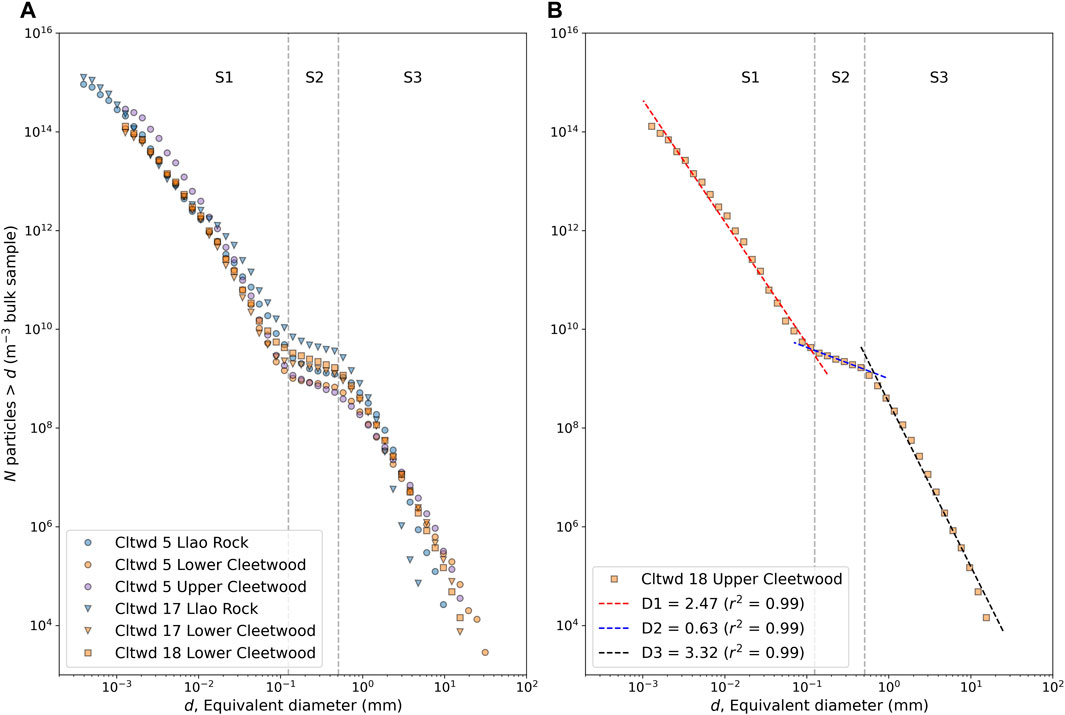
FIGURE 6. (A) Cumulative number density, N, versus equivalent diameter, d, for Llao Rock, lower, and upper Cleetwood units at Cltwd 5, Llao Rock and the lower Cleetwood at Cltwd 17, and the lower Cleetwood unit at Cltwd 18. (B) Cumulative number density, N, versus equivalent diameter, d, for the lower Cleetwood unit at Cltwd 18. Breaks in slope at ∼0.125 mm and ∼0.510 mm create three individual segments S1, S2, and S3, which are observed in all distributions (see A). Fractal dimensions (D1, D2, and D3) are obtained by fitting each corresponding segment with a power law, N>d = λd−D, where N is the number density of particles greater than size d, D is the fractal dimension, and λ is a scaling factor.
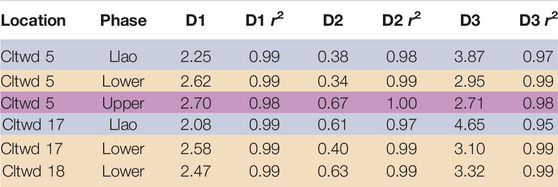
TABLE 1. Fractal dimension values of cumulative grain-size distributions, D, for deposits present at locations Cltwd 5, 17 and 18 (Figure 2; Figure 4), together with the r2 value of the fit. D1, D2, and D3 respectively correspond to the best fits of segments S1 (<0.125 mm), S2 (0.125–0.510 mm), and S3 (>0.510 mm) of the cumulative size distribution (see Figure 6B).
4.3 Componentry
Detailed componentry was realized on samples collected at Cltwd 5, a location ∼46 km SE of the proposed vent, on the main dispersal axis of the lower Cleetwood (Figures 4, 7). In all layers, pumice accounts for at least 92% of the sample’s volume. In Llao Rock, pumice is the dominant component at all size fractions, although the proportion of lithics and crystals combined in subunits 5A and 5B reach 30–60 vol% at sizes 0.063–0.5 mm. The proportion of non-pumice components decreases slightly from 5A to 5B and more significantly from 5B to 5C, with loose crystals being the dominant non-juvenile component in size fractions 0.063–0.5 mm, followed by lithics. The lower Cleetwood unit is divided into two subunits, 5D (bottom) and 5E (top). Subunit 5D is characterized by an increase in loose crystals compared to the end of Llao Rock (subunit 5C) and by the presence of lithics in size fractions 1–2 mm and 2–4 mm. Subunit 5E marks the end of the lower Cleetwood and exhibits an increase in banded pumice (2.9 vol%) >0.25 mm and a slight increase in both loose crystals (1.7 vol%) and lithics (2.9 vol%) at sizes 0.063–1 mm. The upper Cleetwood unit (subunit 5F) shows an overall increase in both banded pumice and obsidian pyroclasts compared to the lower Cleetwood. The proportion of lithics in this phase increases in size fractions 0.5–2 mm, whereas the overall abundance of loose crystals decreases.
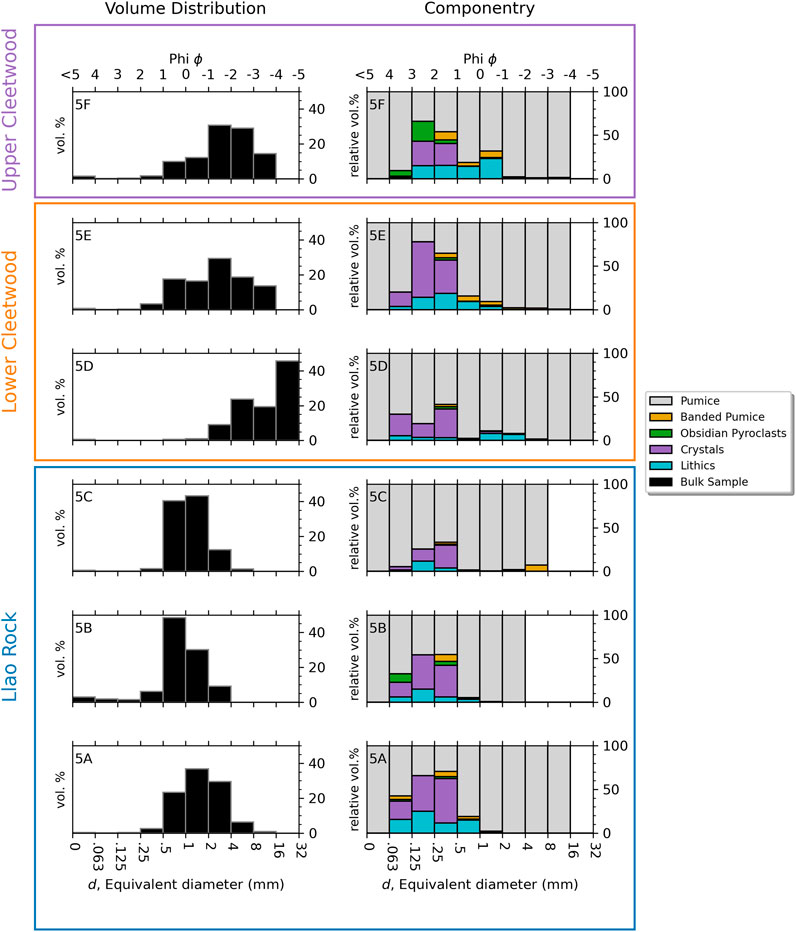
FIGURE 7. Volume percent of bulk samples (left) and relative volume percent of individual components within each size fraction (right), plotted as a function of equivalent diameter, d, for all subunits at location Cltwd 5. Subunits 5A, 5B, and 5C compose Llao Rock, 5D and 5E make up the lower Cleetwood, and the upper Cleetwood unit is defined solely by subunit 5F.
4.4 Eruption Source Parameters
Bacon (1983) first proposed the vent for the Cleetwood eruption to be located in the low hills northeast of the Rim Road. Applying the source vent locator model of Yang et al. (2019) that uses deposit thickness to find the vent confirms this general location (Supplementary Figure S2). The original location of Bacon (1983) lies between the power-law and exponential points generated by the model Yang et al. (2019) and is used as the source vent for all Phases herein.
The erupted volumes (non-DRE) of the lower and upper units of the Cleetwood eruption, calculated both using best fit models (Figure 8) and the probabilistic Monte Carlo approach of Biasse et al. (2014), are reported in Table 2. For each phase, the three methods give volumes that are within 40% of each other using the best fit approach, with the exponential and Weibull methods always giving the best fits (r2>0.99). Calculated volumes are 0.98 ± 0.01 km3 for the lower Cleetwood unit and 0.20 ± 0.03 km3 for the upper Cleetwood, making each of these phases a VEI four eruption. Volumes obtained using the probabilistic approach are 3%–5% larger than using the best fit approach, being 1.01 ± 0.19 km3 for the lower Cleetwood, and 0.21 ± 0.03 km3 for the upper Cleetwood. These results confirm that the lower Cleetwood unit is the most voluminous out of all the phases of the Cleetwood eruption. It is, on its own, close to a VEI five eruption.
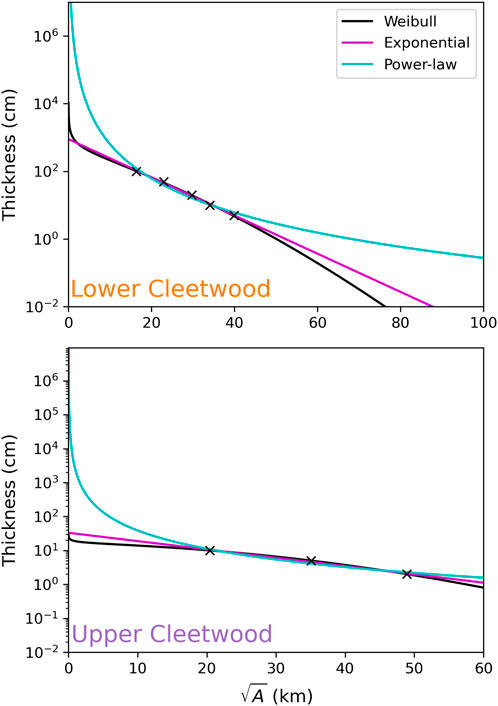
FIGURE 8. (A,B) Semi-log plots of the thickness of a deposit as a function of the square root of the isopach area and exponential, power-law, and Weibull best fit deposit thinning trends for the lower and upper Cleetwood units, respectively. See Table 1 for fitting parameters, Pearson correlation coefficients (r2), and erupted volumes (non-DRE).
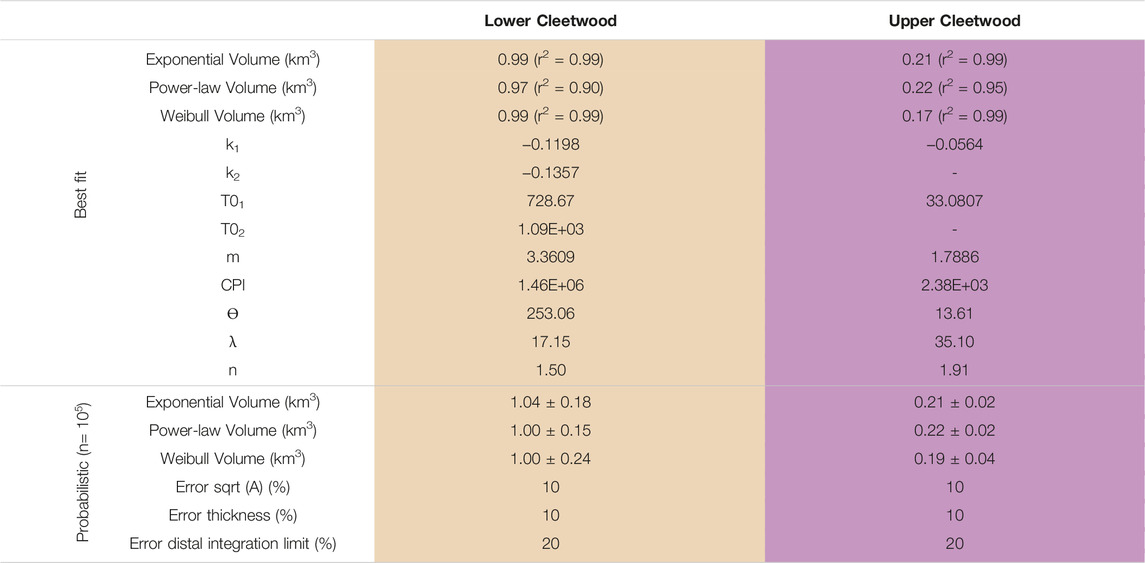
TABLE 2. Best fit and probabilistic fitting parameters and erupted volumes obtained using TephraFits (Biass et al., 2019) for the two different phases of the Cleetwood eruption.
The upper Cleetwood units lacks sufficient field constraints to confidently draw isopleth lines for Maximum Lithic (ML) sizes >0.8 cm (Figures 4C,D), making it unreliable to use the CS86 or R2019 models to calculate a plume height. Consequently, plume height and MER results are presented only for the lower Cleetwood unit in Supplementary Table S2. Using CS86 and averaging the plume heights calculated for the 5, 2, and 0.8 cm ML isolines gives Ht = 25 ± 2 km with an average wind velocity of 27 ± 3 m/s. Comparing this wind velocity with NCEP-DOE Reanalysis 2 (Kanamitsu et al., 2002) data for the entire year of 2020 at Crater Lake shows that this value is reasonable for this location (Supplementary Figure S3). Using this Ht and the model of Mastin (2014), the calculated MER for the lower Cleetwood is (8.6 ± 3.3)×107 kg s−1. Using R2019, the more robust model of Rossi et al. (2019), and averaging the plume heights calculated for the 5 cm and 2 cm ML isolines for eruptive scenarios 2 (intermediate intensity) and 3 (high intensity; see Rossi et al., 2019), gives a plume height of 19 ± 2 km. Given the inadequacies of these models to capture features such as partial column collapse or gravitational fountaining, a large degree of uncertainty is associated with their use. The uncertainty in the above calculated plume height of 2 km falls in line with the ∼10% error for strong plumes as determined via the results of a model intercomparison study conducted by Costa et al. (2016). Using this plume height and the model of Mastin (2014), the calculated MER for the lower Cleetwood unit is (3.1 ± 1.0)×107 kg s−1.
As the upper Cleetwood was not present at enough investigated locations within its respective dispersal area, the TGSD could not be confidently calculated. The TGSD of the lower Cleetwood, calculated using the Voronoi tessellation method of Bonadonna and Houghton (2005) (Figure 9), exhibits a power-law relationship, N>d = λd−D, where N is the number density of particles, d is the equivalent diameter, λ is a scaling factor, and D is the power-law exponent, or fractal dimension. Best-fitting the TGSD using the least-squares method gives fractal dimension (D) values of 3.0 (r2 = 0.997), 3.1 (r2 = 0.997), and 3.2 (r2= 0.998) when fitting grain-sizes ≥0.5 mm, ≥1 mm, and ≥2 mm, respectively. The rationale for only fitting values above 0.5–2 mm is discussed in detail below.
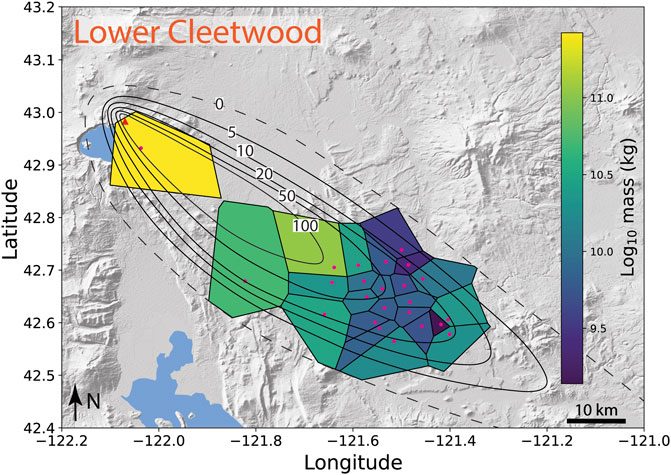
FIGURE 9. Voronoi tessellation of the lower unit of the Cleetwood eruptive sequence used to calculate the total grain-size distribution (TGSD). Pink dots indicate samples analyzed for their GSD via sieving and weighing. Isolines are in centimeters. Background is global Earth relief (Tozer et al., 2019).
5 Discussion
5.1 The Cleetwood Eruptive Sequence
Consistent with Young (1990), our results show that the ∼7.7 ka Cleetwood eruptive sequence of Mount Mazama consisted of two distinct and consecutive VEI four eruptions. Bonadonna and Costa (2012) plotted the relationship between the best fit Weibull parameters
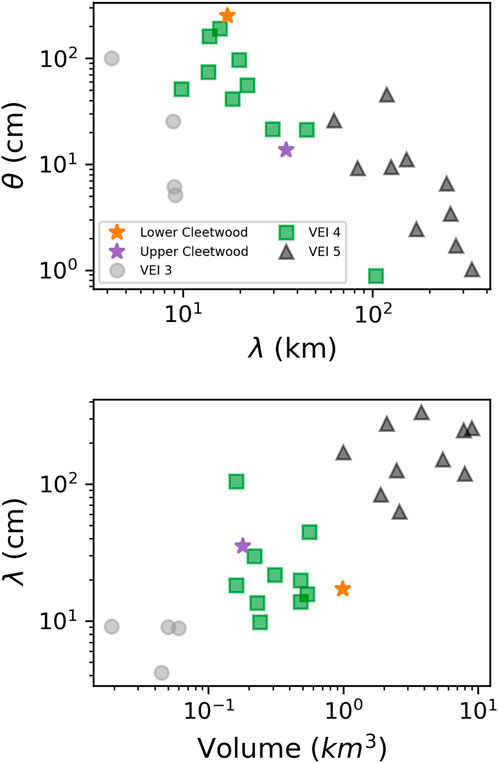
FIGURE 10. Best fit Weibull parameters for the two phases of the Cleetwood eruptive sequence plotted together with VEI 3, VEI4, and VEI five eruptions compiled by Bonadonna and Costa (2012). (A) θ versus λ. (B) λ versus total erupted volume (non-DRE). In both graphs, note that all phases of the Cleetwood eruptive sequence plot with other VEI four eruptions.
With an erupted volume of 0.98 ± 0.01 km3, the lower Cleetwood straddles the line between a VEI four and VEI five eruption and is sub-Plinian following the classification of Bonadonna and Costa (2013, see Supplementary Figure S4). Its deposit is characterized by a strong normal grading, which indicates that both plume height (∼19 km) and MER (∼3.1×10⁷ kg s−1) reached a maximum at the beginning of this phase and continuously waned after that. The base of the lower Cleetwood unit appears relatively abundant in lithics in the field (5–10 vol% of 1–4 mm, see Figure 6). We agree with Young’s interpretation that this relative abundance of lithics at the onset of the Cleetwood eruption is the result of conduit/vent clearance. Young’s (1990) volume estimate for the lower Cleetwood is 1.15 km3 compared to our value of 0.98 ± 0.01 km3. Our results thus slightly revise downwards the volume of this phase of the Cleetwood eruption.
Comparing ML measurements of both the lower and upper Cleetwood units (Figures 4C,D) shows that MLs for the upper are only slightly smaller than those of the lower at the same location. This suggests that both plume height and MER are only slightly less than the lower Cleetwood unit, although the erupted volume is about five times smaller. The deposit of the upper Cleetwood is characterized by a strong reverse grading that suggests an increase in column height and MER with time, likely due to erosional vent widening (Wilson et al., 1980; Carey and Sigurdsson, 1989; Rosi et al., 1999). This vent widening is supported by a slight increase in the proportion of lithics from 3 vol% to 5 vol% from the lower to the upper unit. Another defining characteristic of the upper Cleetwood unit is the drastic increase in obsidian pyroclasts, which makes up to 23 vol% of size fraction 0.125–0.25 mm. Young (1990), Bourgeois (1998), and Wearn (2002) all attributed this increase in obsidian pyroclasts towards the end of the Cleetwood eruption to the progressive annealing of juvenile glass to the conduit walls, which is then mostly eroded during this final explosive phase. Gardner et al. (2017) and Watkins et al. (2017) showed that obsidian pyroclasts from the North Mono Craters (CA, United States) formed by the syn-eruptive agglomeration and sintering of ash fragments on the conduit walls above the level of fragmentation, which were then remobilized over a wide range of depths and ejected together with juvenile porous pyroclasts. Wadsworth et al. (2019) showed that in the absence of a confining pressure, the timescale for sintering decreases with decreasing particle radius. We propose that ash fragments begin to sinter and weld to the conduit walls during the emplacement of the lower Cleetwood unit. As the MER wanes during the lower unit, as evidenced by the strong normal grading of that phase, sintering and welding dominate over erosion and ejection. This continues until the end of the lower Cleetwood unit and perhaps even partially seals the conduit (Wadsworth et al., 2019), which in turn repressurizes the system and may trigger the beginning of the upper Cleetwood. As the MER increases over the course of the upper Cleetwood, erosion begins to dominate over agglomeration and sintering, leading to an increase in both obsidian pyroclasts and lithics in the deposit of the upper Cleetwood unit. It should be noted that layer 5F (Figures 5, 7), from which we determined componentry of the upper Cleetwood, does not lie directly on the dispersal axis of the upper unit and therefore probably represents minimum abundances of dense component (lithic, pyroclastic obsidian), when compared with those from the lower Cleetwood.
Judging solely from the contact between the lower and upper Cleetwood, it is difficult to say whether these two phases correspond to two distinct plumes or if the upper Cleetwood simply marks an increase in plume height and MER from the end of the lower Cleetwood, due to vent widening. The thin grey ash layer making contact between the lower and upper Cleetwood units shows no visible signs of erosion. Thus, if a separate plume is responsible for the deposition of the upper unit, it occurred shortly after the end of the emplacement of the lower Cleetwood. Furthermore, this grey ash layer is only present at SE medial locations, which indicates that the dominant wind shifts from the SE to ESE by the end of the lower Cleetwood, when plume height and MER were at a maximum.
5.2 Comparison With Modern Equivalents
Although there are many historic examples of highly silicic eruptions that transitioned from explosive to effusive activity within the same eruptive sequence (e.g., the 1060 CE Glass Mountain eruption of Medicine Lake volcano, California, United States, Heiken, 1978; the 700 CE Big Obsidian Flow eruption at Newberry Volcano, Oregon, United States, Kuehn, 2002), the rhyolitic eruptions of Chaitén (2008, Chile; Alfano et al., 2011) and Cordón Caulle (2011–2012, Chile; Pistolesi et al., 2015) provided the first real-time observations of an eruption of this type in modern history. The 2008 eruption of Chaiten consisted of a series of VEI four eruptions that began on May 1 with a ∼0.5 km3 explosive phase (Watt et al., 2009; Alfano et al., 2011; Durant et al., 2012) and climaxed on May 6th with a sub-Plinian eruption that ejected ∼0.3 km3 of tephra from a 19 ± 1 km high plume (Carn et al., 2009; Alfano et al., 2016), which corresponds to a MER of ∼2.8×10⁷ kg s−1 (Mastin, 2014). On May 11, the explosive activity began transitioning to effusive activity that eventually emplaced a ∼0.8 km3 rhyolitic flow (Pallister et al., 2013). The 2011–2012 eruption of Cordón Caulle can be divided into four explosive phases, two of which being classified as VEI four eruptions. The first and most intense sub-Plinian phase began on June 4 and deposited ∼0.75 km3 of tephra from a ∼11–14 km plume and MER on the order of 107 kg s−1. The second phase (5–6 June) fluctuated with MERs of 106–107 kg s−1 and deposited ∼0.21 km3 of material ending with the deposition of an obsidian-rich tephra layer. The third and fourth phases (June 7 and later) consisted of VEI three eruptions depositing a total of ∼0.05 km3 of tephra (Bonadonna et al., 2015; Pistolesi et al., 2015). Effusive activity began on June 15 from the same vent and produced a ∼0.6 km3 rhyolitic flow (Castro et al., 2013; Jay et al., 2014; Bertin et al., 2015). Calculated volumes, plume height, and MER for the Cleetwood eruptive sequence are like these two modern analogs, and we thus infer that the Cleetwood eruption unfolded in a manner and timing similar to that of these Chilean eruptions; explosive lower and upper Cleetwood units, all occurred within a period of days, followed, days/weeks later, by the emplacement of the rhyodacitic Cleetwood Flow from the same vent, perhaps interspersed by hybrid explosive-effusive activity (Schipper et al., 2013).
5.3 Grain-Size Distribution
5.3.1 TGSD of the Cleetwood Eruption
Exhaustive sample collection and grain-size data for the Cleetwood deposit are difficult to obtain due to the extreme thickness of the overlying Climactic deposit at proximal locations, and difficulties in distinguishing the Cleetwood from the Climactic deposits at distal locations. The TGSD of the lower unit of the eruption, the only phase for which we believe we have enough data to calculate an accurate TGSD, was thus constructed using samples collected at 24 locations 6–72 km from the vent. All the points used to build the TGSD are within the 5 cm isoline (Figure 9) and, given the density of data obtained within this area, we believe the TGSD built using the Voronoi tessellation is representative of the material deposited within that 5 cm isoline. Using the Weibull model of Bonadonna and Costa (2012), the volume of deposit enclosed within the 5 cm isoline can be calculated using
where x (km) is the square root of isopach area for isoline 5 cm, λ (km) is the characteristic decay length scale of deposit thinning, θ (cm) is a thickness scale, and n is a dimensionless shape parameter (λ, θ, and n are provided in Table 2). Using Eq. 1, the volume enclosed by the 5 cm isoline is ∼0.97 km3, corresponding to about 97% of the whole volume of tephra ejected during the lower Cleetwood, consistent with other VEI four eruptions (Figure 11A). Furthermore, the proportions of pyroclasts ≥2 mm and ≥1 mm in samples of the lower Cleetwood unit collected along the main dispersion axis decrease downwind and reach 0% and <10%, respectively, when extrapolated to where the isoline 5 cm crosses the main axis of dispersion (at ∼94 km, Figure 4B, Figure 11B). We thus infer that the TGSD calculated for the lower Cleetwood using medial data is representative of the whole TGSD for particles larger than ∼1 mm. Over that range of sizes, the TGSD can be nicely fit using a power law distribution and a fractal dimension D = 3.1 (Figure 11C; D = 3.2 is obtained when fitting only particles ≥2 mm, and D = 3.0 for particles ≥0.5 mm).
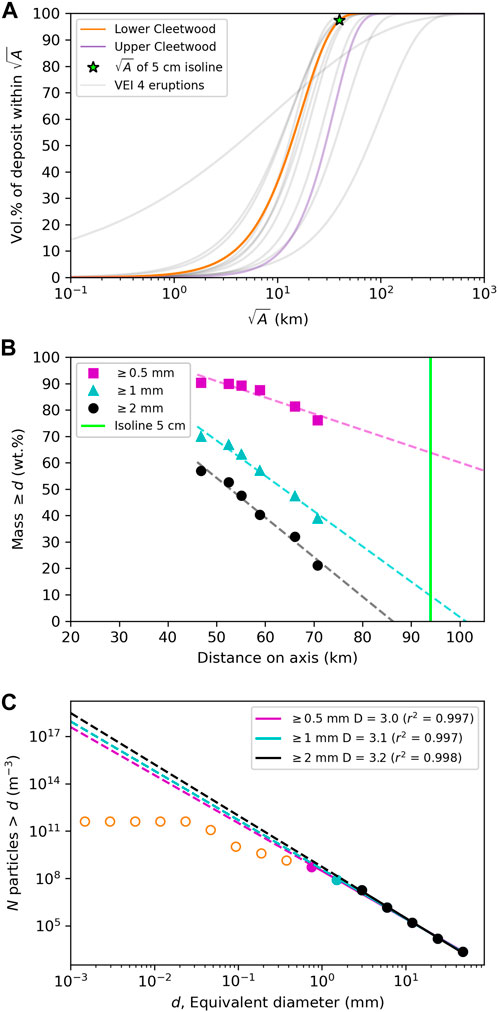
FIGURE 11. (A) Cumulative volume of tephra of the lower unit of the Cleetwood eruptive sequence as a function of the square root of the isopach area,
In the absence of distal data in this study, it is impossible to accurately construct the TGSD for the lower unit of the Cleetwood eruption for particles
5.3.2 High-Resolution GSDs
The high-resolution GSDs produced for individual locations do not equate to the whole TGSD of the deposit as they partly reflect transport processes (Pioli et al., 2019). Despite this, important information can still be gleaned from these individual GSDs. As seen in the results section above, all high-resolution GSDs in this study, regardless of the eruptive phase or sample location, show two systematic breaks in slope from a power-law relationship at ∼0.125 mm and ∼0.510 mm. These breaks in slope create three individual segments S1 (particles<0.125 mm), S2 (particles 0.125–0.510 mm), and S3 (particles >0.510 mm) that can all be fit by a power-law relationship with fractal dimensions D1, D2, and D3 respectively. We discuss below the signification of each of these segments.
5.3.2.1 Particles <0.125 mm—Inheritance from Primary Fragmentation
Values of D1 (Table 2; Supplementary Table S3) are 2.5 ± 0.2 regardless of eruptive phase, distance from the vent, and location with respect to the dispersal axis. These values are within the range of those obtained by rapid decompression experiments (Kueppers et al., 2006). Particles are predominantly juvenile ash over the range of sizes covered by S1 (Figures 6, 7), and thus the fractal dimension at these sizes is largely controlled by the size distribution of this component. Jones and Russell. (2017) conducted pumice attrition experiments at varying time lengths and showed that a time ≥30 min was necessary to change the slope of the GSD for particles <0.156 mm, approximately equal to our S1 range. This timescale is far too long to represent transit time within the conduit after fragmentation (estimated to be of the order of 101–102 s for Plinian eruptions; Gardner et al., 1996), and Jones and Russell. (2017) suggested that their longer experimental runs could represent residence times in the plume. However, the bulk ash concentration used in their experiments is ∼4,000 g m−3, whereas measured concentrations in real plumes are three orders of magnitude lower (e.g., 3.6–4.9 g m−3 for the 1980 eruption of Mt. St. Helens; Harris and Rose, 1983). This suggests that the size distribution of particles within this size range only evolves slightly after initial magma fragmentation.
Giachetti et al. (2021) showed that some pumice lapilli from sub-Plinian and Plinian eruptions, including the Cleetwood eruption, are pumice agglomerates comprised of protopyroclasts, the products of primary magma fragmentation. These pumice aggregates are created by the agglomeration and partial sintering of protopyroclasts of all sizes as they collide during ascent in the conduit seconds after initial magma fragmentation. Giachetti et al. (2021) showed that the size distributions of 0.001–10-mm protopyroclasts from two sub-Plinian rhyolitic eruptions, the 1060 CE Glass Mountain eruption of Medicine Lake volcano (California, United States; Heiken, 1978) and the 700 CE Big Obsidian Flow eruption at Newberry Volcano (Oregon, United States; Kuehn, 2002), are power-law with D values of 2.5 ± 0.1. These power-law exponents are consistent with those of the products of experimental magma fragmentation by rapid decompression (Kueppers et al., 2006). The D1 values found in our study are also in the same range. Using the methodology developed by Giachetti et al. (2021), we analyzed the size distribution of protopyroclasts 1.5–30 μm in a pumice from the onset of the lower Cleetwood, collected at location Cltwd 5 (layer 5D, see Figure 5). Protopyroclasts were only analyzed for this narrow size range because outlining individual clasts at larger sizes in these Cleetwood pumices becomes too subjective. Indeed, Giachetti et al. (2021) suggested that the fluidization of packed beds of protopyroclasts immediately after fragmentation could be more efficient for eruptions with MERs >107 kg s−1 (e.g., the lower unit of the Cleetwood eruption), leaving less time for the mixing and amalgamation of protopyroclasts with highly contrasting textures, and thus making the boundaries between protopyroclasts less visually apparent. The size distribution of 3,011 protopyroclasts 1.5–30 μm in size analyzed in the pumice lapillus of the lower Cleetwood unit is best fit by a power-law with a D value of 2.7. Interestingly, the GSD of the lower Cleetwood is best fit by a power-law with D1 = 2.6 for particles <0.125 mm (Table 1).
Although further investigation is necessary, our results suggest that the fractal dimension of the GSD of particles <0.125 mm collected at medial locations on the dispersal axis of explosive deposits reflects the size distribution of the primary products of magma fragmentation in the conduit (i.e., like the distribution of protopyroclasts within pumice aggregates; Giachetti et al., 2021), and thus could be used to infer the potential energy at fragmentation. This hypothesis is supported by the fact that, at a given location, there is a positive correlation between the value of D1 and the median grain-size (Figure 12).
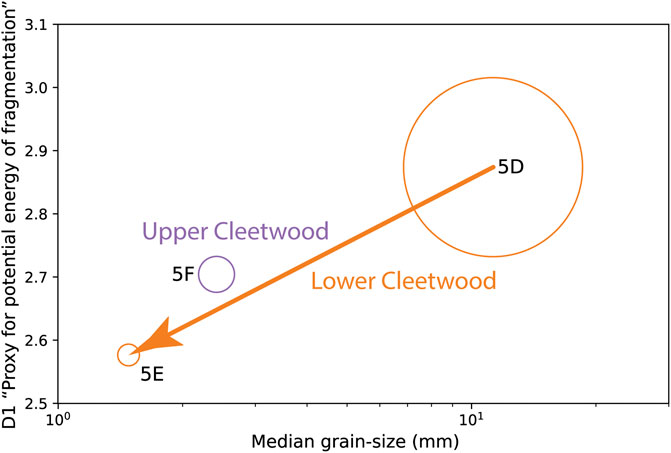
FIGURE 12. D1 values (i.e., fractal dimension of the cumulative size distribution of particles <0.125 mm) found for all Cleetwood units of Cltwd 5, plotted as a function of the median grain-size of that subunit. Circle size is representative of the inferred plume height and thus mass eruption rate (MER), being the highest but continuously decreasing (from 5D to 5E) for the lower Cleetwood, and intermediate for the upper Cleetwood.
5.3.2.2 Particles 0.125–0.510 mm—Clues for Rafting During Transport
The second portion of the individual GSDs, S2 (particles 0.125–0.510 mm), can also be fit with a power-law giving D2 values of 0.6 ± 0.1. This fractal dimension does not vary systematically with explosive phase, distance from the vent, nor location with respect to the dispersal axis (Table 1). This size fraction shows a noticeably higher proportion of non-juvenile components (i.e., loose crystals and lithics) compared to S1 and S3 (Figure 7). These components are not the primary products of fragmentation and thus this enrichment could be a contributing factor to where and why this break in slope with S1 occurs. A recent theoretical study suggests that particle rafting can modify the way in which some particles locally sediment (Rossi et al., 2021). Rafting occurs when fine particles aggregate around a relatively dense core particle during transport. The resulting aggregate has a density significantly lower than its core due to the air entrapped in between aggregating particles. This leads to relatively dense particles ‘rafting’ and landing further than where they would have if smaller particles had not aggregated around them. Upon impact and over time these aggregates break apart and are rarely found intact when sampling historic eruptions. In their theoretical framework, Rossi et al. (2021) defined the size range of core particles that could undergo rafting as 0.138–0.710 mm, which mostly overlaps with the range of sizes over which we see major changes in the shape of our GSDs. Note that this transport process changes the individual GSDs at some locations, but not the overall TGSD of the eruption.
To investigate whether particle rafting may have occurred during the Cleetwood eruption and if this process can explain part of the shape of our GSDs, we analyzed the size distribution of the porous (pumice and banded pumice) and dense (obsidian pyroclasts, lithics, and loose crystals) components of a single layer at increasing distance from the vent, along the main axis of dispersion. Layers 5E, 17D, 18B (Figure 5) all correspond to the end of the lower Cleetwood and are located on the main dispersal axis at 46 km, 56 km, and 66 km from the proposed vent location, respectively. All three locations show an unexpected increase in particle number density over the size range ∼0.125–0.650 mm (Figure 13A), which is not related to data combination as the same observation is made using laser diffraction data alone (see inset in Figure 13A). As expected, the overall median grain-size decreases with distance from the vent as the GSDs of 5E, 17D, and 18B skew towards finer particle sizes due to density sorting during transport in the plume (Figures 13B–D). However, the componentry (realized on sieved fractions independently of laser diffraction and DIA analyses), shows that the proportion of dense particles that compose the size fraction in which we see an increase in particle number density simultaneously increases from 4% at 46 km from the vent, to 18% at 56 km, and finally to 34% at 66 km (i.e., from Cltwd 5, Cltwd 17 to Cltwd 18, respectively). Furthermore, this increase in the volume percent of dense components is accompanied by an increase in the median grain-size of the dense particles as a function of distance, from ∼0.27 mm at Cltwd 5 to ∼0.31–0.33 mm at Cltwd 17 and 18, which is not expected (Figure 13E). We infer that this increase in both the proportion and the median grain-size of dense particles with distance from the vent are clues that particle rafting delayed their sedimentation (Rossi et al., 2021).
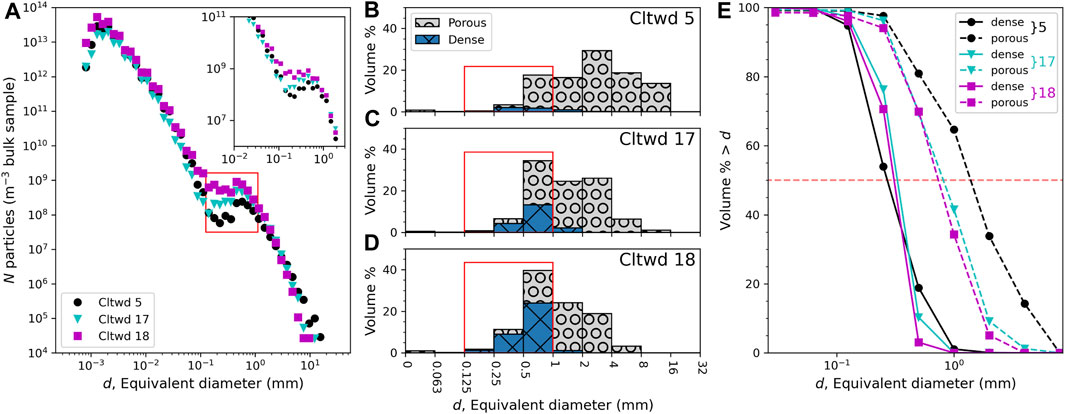
FIGURE 13. (A) Number density, N, versus equivalent diameter, d, for the end of the lower Cleetwood unit at locations Cltwd 5, 17, and 18, which are all located on the main dispersal axis at 46 km, 56 km, and 66 km from the proposed vent location, respectively. Note the sudden increase in number density of particle for ∼0.1 mm<d<∼1 mm (red rectangle). Inset shows N versus d using laser diffraction data only and further illustrate that this increase is not an artifact of merging datasets (see also Figure 3B). (B–D) Volume percent of porous and dense material versus d for locations Cltwd 5, 17, and 18, respectively. Note the increase of the proportion of dense particles in size range 0.125–1 mm with increasing distance from the vent (red rectangles). (E) Cumulative volume distribution for porous (dashed lines) and dense (solid lines) material at Cltwd 5, 17, and 18. Median grain-sizes are at the intersections of these distributions with a volume percent of 50% (i.e., horizontal red dashed line). Note the slight increase in the median diameter of dense particles from Cltwd five to Cltwd 17 and 18, which we attribute to particle rafting, whereas the median diameter of the porous particles logically decreases with increasing distance from the vent.
5.3.2.3 Particles >0.510 mm—Influence of Sedimentation
This portion of the GSD, which corresponds to particles >0.510 mm, is predominantly composed of juvenile pumice (Figure 7). For all layers of all units, it can be nicely fit with a power-law equation with a fractal dimension D3 between 2.7 and 4.7. For a given unit, the value of D3 increases with distance from the vent along the main dispersion axis, testifying to a progressive loss of larger particles. For example, for the lower Cleetwood unit, D3 is equal to 2.95 at ∼46 km from the vent (Cltwd 5), increasing to 3.10 at ∼56 km (Cltwd 17), and to 3.32 at ∼66 km (Cltwd 18). At these three locations, particles ≥0.5 mm (approximately the lower bound of D3) represent >80% of the mass of the sample, and it is thus not surprising that these D3 values (∼3.1 ± 0.2) are close to the fractal dimension of the calculated TGSD for particles >0.5 mm (3.0, see Figure 11C).
6 Conclusion
The successful modeling and forecasting of the dispersion and sedimentation of tephra from explosive volcanic eruptions rely heavily on the initial eruption source parameters inputs such as plume height, erupted volume, MER and Total Grain-Size Distribution. During an eruption these parameters are challenging to determine and depend on those derived from detailed field studies of similar historic events. Here we calculated eruption source parameters for the ∼7.7 ka Cleetwood eruption of Mount Mazama (Crater Lake/giiwas, Oregon, United States). We applied a novel approach to produce high-resolution grain-size distributions over the range 0.00035–35 mm by combining laser diffraction and dynamic image analysis techniques.
The ∼7.7 ka Cleetwood eruptive sequence of Mount Mazama consisted of two consecutive VEI four eruptions: the lower and upper Cleetwood units, from oldest to youngest. The lower Cleetwood was the most intense (Ht = ∼19 km; MER = ∼3.1×10⁷ kg s−1) and voluminous (∼0.98 km3) of the sequence with a TGSD that can be fit with a fractal dimension of ∼3.1. Altogether, the Cleetwood eruption deposited 1.10 km3 (non-DRE) of tephra from at least one, but no more than two, separate plumes. Explosive activity then transitioned to an effusive stage, with no apparent break, extruding a rhyodacitic lava flow with a minimum volume of ∼0.6 km3. The continuity and deposit of the Cleetwood eruption of Mount Mazama is similar to the only two witnessed volcanic eruptions of rhyolitic magma that transition to an effusive phase: Chaitén (Chile, 2008; fall = ∼1 km3, flow= ∼0.8 km3, plume height = ∼19 km) and Cordón Caulle (Chile, 2011–2012; fall = ∼0.8 km3, flow = ∼0.8 km3, plume height = ∼14 km). Further detailed fieldwork in proximal deposits of the upper unit of the Cleetwood eruption would be necessary to resolve whether there was coeval (hybrid) effusive and explosive activity as suggested by observations at Cordón Caulle during the 2011–2012 eruption.
Regardless of the eruptive phase or sample location, all high-resolution cumulative GSDs show two systematic breaks in slope from a power-law relationship at ∼0.125 mm and ∼0.510 mm, creating three individual segments that can all be fit by power-law relationships. We show that in conjunction with eruption source parameters and detailed componentry, our high-resolution GSDs provide insight into magma fragmentation and tephra transport. We show that the fractal dimension for particles <0.125 mm from medial locations on the dispersal axis of the tephra deposit reflects the size distribution of the primary products of magma fragmentation, and thus could be used to infer the potential energy at fragmentation. This observation is further supported by the positive correlation between the D1 value and the median grain-size at a given location. The overall low slope of the GSD for particles 0.125–0.510 mm is due to an increase in the amount of dense components (obsidian pyroclasts, lithics, and loose crystals) that is accompanied by an increase in their median grain-size with distance. We infer that this is due to particle rafting and thus delayed sedimentation. Lastly, the increasing slope of the GSDs for particles >0.510 mm with increasing distance from the vent, reflects the progressive and rather rapid loss of coarse ash and lapilli in the medial portion of the deposit. Our comparison of high-resolution GSDs across a fallout deposit has potential for identifying processes that modify tephra dispersal and sedimentation, such as particle rafting. Newly gleaned information using a higher resolution of GSDs would greatly further our understanding of both primary and secondary eruptive processes and help constrain eruption modeling and hazard assessment in the future.
Data availability statement
The datasets presented in this study can be found in online repositories. The names of the repository/repositories and accession number(s) can be found below: https://doi.org/10.5281/zenodo.5874666.
Author contributions
JW performed grain-size analysis, componentry, and wrote the first draft of the manuscript. JW and TG collaborated in conceiving this study, collecting samples, developing conceptual models, analyzing protopyroclasts, and drafting the final version of this manuscript. All authors contributed to the article and approved the submitted version.
Funding
JW and TG were partly funded by National Science Foundation grant EAR-1725207.
Conflict of Interest
The authors declare that the research was conducted in the absence of any commercial or financial relationships that could be construed as a potential conflict of interest.
Publisher’s Note
All claims expressed in this article are solely those of the authors and do not necessarily represent those of their affiliated organizations, or those of the publisher, the editors and the reviewers. Any product that may be evaluated in this article, or claim that may be made by its manufacturer, is not guaranteed or endorsed by the publisher.
Acknowledgments
We thank Sebastien Biass and Fabio Dioguardi for their detailed reviews of the manuscript and the Editor Antonio Costa for the swift handling of our paper. We also thank C. McDermott for her time as our archeological monitor and keeping us updated with wildfire movement while working in the Fremont-Winema National Forest. We are grateful to JE. Gardner, KR. Trafton, and JM. Watkins for their help in the field. Thanks to AR. Van Eaton, LG. Mastin, and HMN. Wright for their time and help during laser diffraction analysis at the Cascades Volcano Observatory. We also thank CR. Bacon for the insightful discussions about Mount Mazama.
Supplementary material
The Supplementary Material for this article can be found online at: https://www.frontiersin.org/articles/10.3389/feart.2022.853021/full#supplementary-material
References
Alfano, F., Bonadonna, C., Volentik, A., Connor, C. B., Watt, S. F. L., Pyle, D. M., et al. (2011). Tephra stratigraphy and eruptive volume of the May, 2008, Chaitén eruption, Chile. Bull. Volcanol. 73 (5), 613–630. doi:10.1007/s00445-010-0428-x
Alfano, F., Bonadonna, C., Watt, S., Connor, C., Volentik, A., and Pyle, D. M. (2016). Reconstruction of total grain size distribution of the climactic phase of a long-lasting eruption: The example of the 2008–2013 Chaitén eruption. Bull. Volcanol. 78 (7), 46–21. doi:10.1007/s00445-016-1040-5
Bacon, C. R. (1983). Eruptive history of Mount Mazama and Crater Lake Caldera, Cascade Range, U.S.A. J. Volcanol. Geotherm. Res. 18 (1–4), 57–115. doi:10.1016/0377-0273(83)90004-5
Bacon, C. R., Gardner, J. V., Mayer, L. A., Buktenica, M. W., Dartnell, P., Ramsey, D. W., et al. (2002). Morphology, volcanism, and mass wasting in Crater Lake, Oregon. Bull. Geol. Soc. Am. 114 (6), 675–692. doi:10.1130/0016-7606(2002)114<0675:MVAMWI>2.0.CO;2
Bacon, C. R., and Lanphere, M. A. (2006). Eruptive history and geochronology of Mount Mazama and the Crater Lake region, Oregon. Bull. Geol. Soc. Am. 118 (11–12), 1331–1359. doi:10.1130/B25906.1
Bertin, D., Lara, L. E., Basualto, D., Amigo, Á., Cardona, C., Franco, L., et al. (2015). High effusion rates of the Cordón Caulle 2011–2012 eruption (Southern Andes) and their relation with the quasi-harmonic tremor. Geophys. Res. Lett. 42 (17), 7054–7063. doi:10.1002/2015gl064624
Biass, S., Bonadonna, C., and Houghton, B. F. (2019). A step-by-step evaluation of empirical methods to quantify eruption source parameters from tephra-fall deposits. J. Appl. Volcanol. 8 (1), 1. doi:10.1186/s13617-018-0081-1
Biasse, S., Bagheri, G., Aeberhard, W., and Bonadonna, C. (2014). TError: towards a better quantification of the uncertainty propagated during the characterization of tephra deposits. Statistics Volcanol. 1 (2), 1–27. doi:10.5038/2163-338x.1.2
Blott, S. J., and Pye, K. (2006). Particle size distribution analysis of sand-sized particles by laser diffraction: An experimental investigation of instrument sensitivity and the effects of particle shape. Sedimentology 53 (3), 671–685. doi:10.1111/j.1365-3091.2006.00786.x
Bonadonna, C., Cioni, R., Pistolesi, M., Elissondo, M., and Baumann, V. (2015). Sedimentation of long-lasting wind-affected volcanic plumes: the example of the 2011 rhyolitic Cordón Caulle eruption, Chile. Bull. Volcanol. 77 (2), 13–19. doi:10.1007/s00445-015-0900-8
Bonadonna, C., Connor, C. B., Houghton, B. F., Connor, L., Byrne, M., Laing, A., et al. (2005). Probabilistic modeling of tephra dispersal: Hazard assessment of a multiphase rhyolitic eruption at Tarawera, New Zealand. J. Geophys. Res. Solid Earth 110 (B3), B03203. doi:10.1029/2003JB002896
Bonadonna, C., and Costa, A. (2012). Estimating the volume of tephra deposits: A new simple strategy. Geology 40 (5), 415–418. doi:10.1130/G32769.1
Bonadonna, C., and Costa, A. (2013). Plume height, volume, and classification of explosive volcanic eruptions based on the Weibull function. Bull. Volcanol. 75 (8), 742–819. doi:10.1007/s00445-013-0742-1
Bonadonna, C., and Houghton, B. F. (2005). Total grain-size distribution and volume of tephra-fall deposits. Bull. Volcanol. 67 (5), 441–456. doi:10.1007/s00445-004-0386-2
Bonadonna, C., and Phillips, J. C. (2003). Sedimentation from strong volcanic plumes. J. Geophys. Res. Solid Earth 108 (B7). doi:10.1029/2002jb002034
Bourgeois, R. L. (1998). Physical characteristics of proximal Cleetwood airfall Deposits, Crater Lake, OR: The transition from explosive to effusive eruption. United States: University of Oregon.
Buckland, H. M., Cashman, K. V., Engwell, S. L., and Rust, A. C. (2020). Sources of uncertainty in the Mazama isopachs and the implications for interpreting distal tephra deposits from large magnitude eruptions. Bull. Volcanol. 82 (3), 23. doi:10.1007/s00445-020-1362-1
Buckland, H. M., Saxby, J., Roche, M., Meredith, P., Rust, A. C., Cashman, K. V., et al. (2021). Measuring the size of non-spherical particles and the implications for grain size analysis in volcanology. J. Volcanol. Geotherm. Res. 415, 107257. doi:10.1016/j.jvolgeores.2021.107257
Carazzo, G., Tait, S., Michaud-Dubuy, A., Fries, A., and Kaminski, E. (2020). Transition from stable column to partial collapse during the 79 cal CE P3 Plinian eruption of Mt. Pelée volcano (Lesser Antilles). J. Volcanol. Geotherm. Res. 392, 106764. doi:10.1016/j.jvolgeores.2019.106764
Carey, S. N., and Sigurdsson, H. (1982). Influence of particle aggregation on deposition of distal tephra from the MAy 18, 1980, eruption of Mount St. Helens volcano. J. Geophys. Res. Solid Earth 87 (B8), 7061–7072. doi:10.1029/JB087iB08p07061
Carey, S., and Sigurdsson, H. (1989). The intensity of plinian eruptions. Bull. Volcanol. 51 (1), 28–40. doi:10.1007/BF01086759
Carey, S., and Sparks, R. S. J. (1986). Quantitative models of the fallout and dispersal of tephra from volcanic eruption columns. Bull. Volcanol. 48 (2), 109–125. doi:10.1007/bf01046546
Carn, S. A., Pallister, J. S., Lara, L., Ewert, J. W., Watt, S., Prata, A. J., et al. (2009). The unexpected awakening of Chaitén volcano, Chile. Eos, Trans. Am. Geophys. Union 90 (24), 205–206. doi:10.1029/2009eo240001
Castro, J. M., Schipper, C. I., Mueller, S. P., Militzer, A. S., Amigo, A., Parejas, C. S., et al. (2013). Storage and eruption of near-liquidus rhyolite magma at Cordón Caulle, Chile. Bull. Volcanol. 75 (4), 702–717. doi:10.1007/s00445-013-0702-9
Choumert-Nkolo, J., Lamour, A., and Phélinas, P. (2021). The Economics of Volcanoes. Econ. Disasters Clim. Change 5 (2), 277–299. doi:10.1007/s41885-021-00087-2
Costa, A., Pioli, L., and Bonadonna, C. (2016). Assessing tephra total grain-size distribution: Insights from field data analysis. Earth Planet. Sci. Lett. 443, 90–107. doi:10.1016/j.epsl.2016.02.040
Dufek, J., and Manga, M. (2008). In situ production of ash in pyroclastic flows. J. Geophys. Res. Solid Earth 113, B09207. doi:10.1029/2007JB005555
Dufek, J., Manga, M., and Patel, A. (2012). Granular disruption during explosive volcanic eruptions. Nat. Geosci. 5 (8), 561–564. doi:10.1038/ngeo1524
Durant, A. J., Villarosa, G., Rose, W. I., Delmelle, P., Prata, A. J., and Viramonte, J. G. (2012). Long-range volcanic ash transport and fallout during the 2008 eruption of Chaitén volcano, Chile. Phys. Chem. Earth, Parts A/B/C 45, 50–64. doi:10.1016/j.pce.2011.09.004
Egan, J., Staff, R., and Blackford, J. (2015). A high-precision age estimate of the Holocene Plinian eruption of Mount Mazama, Oregon, USA. Holocene 25 (7), 1054–1067. doi:10.1177/0959683615576230
Engwell, S. L., Sparks, R. S. J., and Aspinall, W. P. (2013). Quantifying uncertainties in the measurement of tephra fall thickness. J. Appl. Volcanol. 2 (1), 5–12. doi:10.1186/2191-5040-2-5
Fierstein, J., and Nathenson, M. (1992). Another look at the calculation of fallout tephra volumes. Bull. Volcanol. 54 (2), 156–167. doi:10.1007/bf00278005
Folch, A., Mingari, L., Gutierrez, N., Hanzich, M., Macedonio, G., and Costa, A. (2020). FALL3D-8.0: a computational model for atmospheric transport and deposition of particles, aerosols and radionuclides–Part 1: Model physics and numerics. Geosci. Model Dev. 13 (3), 1431–1458. doi:10.5194/gmd-13-1431-2020
Gardner, J. E., Llewellin, E. W., Watkins, J. M., and Befus, K. S. (2017). Formation of obsidian pyroclasts by sintering of ash particles in the volcanic conduit. Earth Planet. Sci. Lett. 459, 252–263. doi:10.1016/j.epsl.2016.11.037
Gardner, J. E., Thomas, R. M. E., Jaupart, C., and Tait, S. (1996). Fragmentation of magma during Plinian volcanic eruptions. Bull. Volcanol. 58 (2), 144–162. doi:10.1007/s004450050132
Giachetti, T., Trafton, K. R., Wiejaczka, J., Gardner, J. E., Watkins, J. M., Shea, T., et al. (2021). The products of primary magma fragmentation finally revealed by pumice agglomerates. Geology 49 (11), 1307–1311. doi:10.1130/G48902.1
Harris, D. M., and Rose, W. I. (1983). Estimating particle sizes, concentrations, and total mass of ash in volcanic clouds using weather radar. J. Geophys. Res. Oceans 88, 10969–10983. doi:10.1029/JC088iC15p10969
Heiken, G. (1978). Plinian-type eruptions in the medicine lake highland, California, and the nature of the underlying magma. J. Volcanol. Geotherm. Res. 4 (3), 375–402. doi:10.1016/0377-0273(78)90023-9
Jay, J., Costa, F., Pritchard, M., Lara, L., Singer, B., and Herrin, J. (2014). Locating magma reservoirs using InSAR and petrology before and during the 2011–2012 Cordón Caulle silicic eruption. Earth Planet. Sci. Lett. 395, 254–266. doi:10.1016/j.epsl.2014.03.046
Jones, A., Thomson, D., Hort, M., and Devenish, B. (2007). “The U.K,” in Met office’s next-generation atmospheric dispersion model, NAME III BT - air pollution modeling and its application XVII. Editors C. Borrego, and A.-L. Norman (Boston, MA: Springer US).
Jones, T. J., and Russell, J. K. (2017). Ash production by attrition in volcanic conduits and plumes. Sci. Rep. 7 (1), 5538. doi:10.1038/s41598-017-05450-6
Kamata, H., Suzuki-Kamata, K., and Bacon, C. R. (1993). Deformation of the Wineglass Welded Tuff and the timing of caldera collapse at Crater Lake, Oregon. J. Volcanol. Geotherm. Res. 56 (3), 253–265. doi:10.1016/0377-0273(93)90019-N
Kaminski, E., and Jaupart, C. (1998). The size distribution of pyroclasts and the fragmentation sequence in explosive volcanic eruptions. J. Geophys. Res. Solid Earth 103, 29759–29779. doi:10.1029/98JB02795
Kanamitsu, M., Ebisuzaki, W., Woollen, J., Yang, S.-K., Hnilo, J. J., Fiorino, M., et al. (2002). NCEP–DOE AMIP-II Reanalysis (R-2). Bull. Am. Meteorological Soc. 83 (11), 1631–1644. doi:10.1175/BAMS-83-11-1631
Klawonn, M., Houghton, B. F., Swanson, D. A., Fagents, S. A., Wessel, P., and Wolfe, C. J. (2014a). Constraining explosive volcanism: subjective choices during estimates of eruption magnitude. Bull. Volcanol. 76 (2), 793–796. doi:10.1007/s00445-013-0793-3
Klawonn, M., Houghton, B. F., Swanson, D. A., Fagents, S. A., Wessel, P., and Wolfe, C. J. (2014b). From field data to volumes: constraining uncertainties in pyroclastic eruption parameters. Bull. Volcanol. 76 (7), 839–916. doi:10.1007/s00445-014-0839-1
Kueppers, U., Perugini, D., and Dingwell, D. B. (2006). Explosive energy during volcanic eruptions from fractal analysis of pyroclasts. Earth Planet. Sci. Lett. 248 (3–4), 800–807. doi:10.1016/j.epsl.2006.06.033
Kueppers, U., Putz, C., Spieler, O., and Dingwell, D. B. (2012). Abrasion in pyroclastic density currents: Insights from tumbling experiments. Phys. Chem. Earth, Parts A/B/C, 45– 46, 33–39. doi:10.1016/j.pce.2011.09.002
Le Pennec, J.-L., Ruiz, G. A., Ramón, P., Palacios, E., Mothes, P., and Yepes, H. (2012). Impact of tephra falls on Andean communities: The influences of eruption size and weather conditions during the 1999–2001 activity of Tungurahua volcano, Ecuador. J. Volcanol. Geotherm. Res. 217, 91–103. doi:10.1016/j.jvolgeores.2011.06.011
Liu, E. J., Cashman, K. V., and Rust, A. C. (2015). Optimising shape analysis to quantify volcanic ash morphology. GeoResJ 8, 14–30. doi:10.1016/j.grj.2015.09.001
Mastin, L. G. (2014). Testing the accuracy of a 1-D volcanic plume model in estimating mass eruption rate. J. Geophys. Res. Atmos. 119 (5), 2474–2495. doi:10.1002/2013JD020604
McCormick, M. P., Thomason, L. W., and Trepte, C. R. (1995). Atmospheric effects of the Mt Pinatubo eruption. Nature 373 (6513), 399–404. doi:10.1038/373399a0
Mele, D., Costa, A., Dellino, P., Sulpizio, R., Dioguardi, F., Isaia, R., et al. (2020). Total grain size distribution of components of fallout deposits and implications for magma fragmentation mechanisms: examples from Campi Flegrei caldera (Italy). Bull. Volcanol. 82 (4), 31. doi:10.1007/s00445-020-1368-8
Murrow, P. J., Rose, W. I., and Self, S. (1980). Determination of the total grain size distribution in a Vulcanian eruption column, and its implications to stratospheric aerosol perturbation. Geophys. Res. Lett. 7 (11), 893–896. doi:10.1029/GL007i011p00893
Pallister, J. S., Diefenbach, A. K., Burton, W. C., Muñoz, J., Griswold, J. P., Lara, L. E., et al. (2013). The Chaitén rhyolite lava dome: Eruption sequence, lava dome volumes, rapid effusion rates and source of the rhyolite magma. Andean Geol. 40 (2), 277–294. doi:10.5027/andgeov40n2-a06
Perugini, D., and Kueppers, U. (2012). Fractal analysis of experimentally generated pyroclasts: A tool for volcanic hazard assessment. Acta Geophys. 60 (3), 682–698. doi:10.2478/s11600-012-0019-7
Pioli, L., Bonadonna, C., and Pistolesi, M. (2019). Reliability of Total Grain-Size Distribution of Tephra Deposits. Sci. Rep. 9 (1), 10006–10015. doi:10.1038/s41598-019-46125-8
Pistolesi, M., Cioni, R., Bonadonna, C., Elissondo, M., Baumann, V., Bertagnini, A., et al. (2015). Complex dynamics of small-moderate volcanic events: the example of the 2011 rhyolitic Cordón Caulle eruption, Chile. Bull. Volcanol. 77 (1), 3–24. doi:10.1007/s00445-014-0898-3
Pyle, D. M. (1989). The thickness, volume and grainsize of tephra fall deposits. Bull. Volcanol. 51 (1), 1–15. doi:10.1007/BF01086757
Riley, C. M., Rose, W. I., and Bluth, G. J. S. (2003). Quantitative shape measurements of distal volcanic ash. J. Geophys. Res. Solid Earth 108. doi:10.1029/2001JB000818
Robock, A. (2000). Volcanic eruptions and climate. Rev. Geophys. 38 (2), 191–219. doi:10.1029/1998RG000054
Rose, W. I., and Durant, A. J. (2011). Fate of volcanic ash: Aggregation and fallout. Geology 39 (9), 895–896. doi:10.1130/focus092011.1
Rosi, M., Vezzoli, L., Castelmenzano, A., and Grieco, G. (1999). Plinian pumice fall deposit of the Campanian Ignimbrite eruption (Phlegraean Fields, Italy). J. Volcanol. Geotherm. Res. 91 (2), 179–198. doi:10.1016/S0377-0273(99)00035-9
Rossi, E., Bagheri, G., Beckett, F., and Bonadonna, C. (2021). The fate of volcanic ash: premature or delayed sedimentation? Nat. Commun. 12 (1), 1303. doi:10.1038/s41467-021-21568-8
Rossi, E., Bonadonna, C., and Degruyter, W. (2019). A new strategy for the estimation of plume height from clast dispersal in various atmospheric and eruptive conditions. Earth Planet. Sci. Lett. 505, 1–12. doi:10.1016/j.epsl.2018.10.007
Rust, A. C., and Cashman, K. V. (2011). Permeability controls on expansion and size distributions of pyroclasts. J. Geophys. Res. Solid Earth 116 (B11). doi:10.1029/2011JB008494
Saxby, J., Beckett, F., Cashman, K., Rust, A., and Tennant, E. (2018). The impact of particle shape on fall velocity: Implications for volcanic ash dispersion modelling. J. Volcanol. Geotherm. Res. 362, 32–48. doi:10.1016/j.jvolgeores.2018.08.006
Saxby, J., Rust, A., Beckett, F., Cashman, K., and Rodger, H. (2020). Estimating the 3D shape of volcanic ash to better understand sedimentation processes and improve atmospheric dispersion modelling. Earth Planet. Sci. Lett. 534, 116075. doi:10.1016/j.epsl.2020.116075
Schindelin, J., Arganda-Carreras, I., Frise, E., Kaynig, V., Longair, M., Pietzsch, T., et al. (2012). Fiji: an open-source platform for biological-image analysis. Nat. Methods 9 (7), 676–682. doi:10.1038/nmeth.2019
Schipper, C. I., Castro, J. M., Tuffen, H., James, M. R., and How, P. (2013). Shallow vent architecture during hybrid explosive–effusive activity at Cordón Caulle (Chile, 2011–12): evidence from direct observations and pyroclast textures. J. Volcanol. Geotherm. Res. 262, 25–37. doi:10.1016/j.jvolgeores.2013.06.005
Schwaiger, H. F., Denlinger, R. P., and Mastin, L. G. (2012). Ash3d: A finite-volume, conservative numerical model for ash transport and tephra deposition. J. Geophys. Res. Solid Earth 117 (B4). doi:10.1029/2011JB008968
Sigl, M., Winstrup, M., McConnell, J. R., Welten, K. C., Plunkett, G., Ludlow, F., et al. (2015). Timing and climate forcing of volcanic eruptions for the past 2,500 years. Nature 523 (7562), 543–549. doi:10.1038/nature14565
Sparks, R. S. J., Wilson, L., Sigurdsson, H., and Walker, G. P. L. (1981). The pyroclastic deposits of the 1875 eruption of Askja, Iceland. Philosophical Trans. R. Soc. Lond. Ser. A, Math. Phys. Sci. 299 (1447), 241–273. doi:10.1098/rsta.1981.0023
Tozer, B., Sandwell, D. T., Smith, W. H. F., Olson, C., Beale, J. R., and Wessel, P. (2019). Global Bathymetry and Topography at 15 Arc Sec: SRTM15+. Earth Space Sci. 6 (10), 1847–1864. doi:10.1029/2019EA000658
Trafton, K. R., and Giachetti, T. (2021). The morphology and texture of Plinian pyroclasts reflect their lateral sourcing in the conduit. Earth Planet. Sci. Lett. 562, 116844. doi:10.1016/j.epsl.2021.116844
Turcotte, D. L. (1997). Fractals and chaos in geology and Geophysics. Cambridge: Cambridge University Press & Assessment. doi:10.1017/CBO9781139174695
Turcotte, D. L. (1992). Fractals, chaos, self-organized criticality and tectonics. Terra nova. 4 (1), 4–12. doi:10.1111/j.1365-3121.1992.tb00444.x
Wadsworth, F. B., Vasseur, J., Schauroth, J., Llewellin, E. W., Dobson, K. J., Havard, T., et al. (2019). A general model for welding of ash particles in volcanic systems validated using in situ X-ray tomography. Earth Planet. Sci. Lett. 525, 115726. doi:10.1016/j.epsl.2019.115726
Walker, G. P. L. (1981b). Characteristics of two phreatoplinian ashes, and their water-flushed origin. J. Volcanol. Geotherm. Res. 9 (4), 395–407. doi:10.1016/0377-0273(81)90046-9
Walker, G. P. L. (1980). The Taupo pumice: Product of the most powerful known (ultraplinian) eruption? J. Volcanol. Geotherm. Res. 8 (1), 69–94. doi:10.1016/0377-0273(80)90008-6
Walker, G. P. L. (1981a). The Waimihia and Hatepe plinian deposits from the rhyolitic Taupo Volcanic Centre. N. Z. J. Geol. Geophys. 24 (3), 305–324. doi:10.1080/00288306.1981.10422722
Watkins, J. M., Gardner, J. E., and Befus, K. S. (2017). Nonequilibrium degassing, regassing, and vapor fluxing in magmatic feeder systems. Geology 45 (2), 183–186. doi:10.1130/G38501.1
Watt, S. F. L., Pyle, D. M., Mather, T. A., Martin, R. S., and Matthews, N. E. (2009). Fallout and distribution of volcanic ash over Argentina following the May 2008 explosive eruption of Chaitén, Chile. J. Geophys. Res. Solid Earth 114 (B4), B04207. doi:10.1029/2008jb006219
Wearn, K. M. (2002). Pyroclastic obsidian from the Cleetwood and Rock mesa eruptions, central Oregon. United States: University of Oregon.
Wilson, L., Sparks, R. S. J., and Walker, G. P. L. (1980). Explosive volcanic eruptions — IV. The control of magma properties and conduit geometry on eruption column behaviour. Geophys. J. R. Astronomical Soc. 63 (1), 117–148. doi:10.1111/j.1365-246X.1980.tb02613.x
Keywords: magma fragmentation, tephra dispersal, grain-size distribution, eruption source parameters, fractal dimension, explosive volcanism
Citation: Wiejaczka J and Giachetti T (2022) Using Eruption Source Parameters and High-Resolution Grain-Size Distributions of the 7.7 ka Cleetwood Eruption of Mount Mazama (Oregon, United States) to Reveal Primary and Secondary Eruptive Processes. Front. Earth Sci. 10:853021. doi: 10.3389/feart.2022.853021
Received: 12 January 2022; Accepted: 07 March 2022;
Published: 22 March 2022.
Edited by:
Antonio Costa, National Institute of Geophysics and Volcanology, ItalyReviewed by:
Sebastien Biass, University of Geneva, SwitzerlandFabio Dioguardi, The Lyell Centre, United Kingdom
Copyright © 2022 Wiejaczka and Giachetti. This is an open-access article distributed under the terms of the Creative Commons Attribution License (CC BY). The use, distribution or reproduction in other forums is permitted, provided the original author(s) and the copyright owner(s) are credited and that the original publication in this journal is cited, in accordance with accepted academic practice. No use, distribution or reproduction is permitted which does not comply with these terms.
*Correspondence: Joshua Wiejaczka, jwiejacz@uoregon.edu