Hydrate Attenuation Characteristics Based on the Patchy-Saturation Model
 Pengqi Liu
 Handong Huang1*
 - 1State Key Laboratory of Petroleum Resources and Prospecting, China University of Petroleum-Beijing, Beijing, China
- 2PetroChina Liaohe Oilfield Company, Panjin, China
- 3Yangtze University, Wuhan, China
- 4Shanxi Province Coal Geophysical Prospecting and Surveying and Mapping Institute, Jinzhong, China
At present, attenuation characteristics of hydrate applicable to the seismic frequency band are still controversial. In this study, the dispersion and attenuation characteristics of hydrate in different occurrence modes were defined from the mesoscale perspective, and the saturation of hydrate in the study area is estimated. Based on effective medium theory and cementation theory, the skeleton elastic modulus of the sedimentary layer was obtained in the present study. The variation of P-wave attenuation with hydrate saturation was obtained by the patchy-saturation theory. P-wave attenuation increased with saturation when hydrate occurred in the suspension mode. P-wave attenuation decreased with saturation when hydrate occurred in the particle-contact or cementation mode. The particle-contact mode and cementation mode hydrate made the P-wave attenuation peak shift to the right. The influence of the cementation mode on attenuation was greater than that of the particle-contact mode. The conclusions of this study are applicable to the frequency range of seismic exploration, thus solving the problems of hydrate saturation prediction and resource quantity calculation assessment in the study area.
Introduction
Gas hydrate, also known as “combustible ice,” is a kind of ice-like crystalline substance formed by natural gas and water under high pressure and low temperature, distributed in deep-sea sediments or permafrost soil. Gas hydrate has attracted much attention because of its great importance regarding energy, climate, environment, and disasters. The effect of gas hydrate on the velocity of seismic waves has been well understood. Various theoretical or experimental models have been proposed to estimate hydrate saturation by linking hydrate saturation with velocity (Wyllie et al., 1956; Wood et al., 1994; Lee et al., 1996; Helgerud et al., 1999). The common conclusion is that P-wave and S-wave velocities increase with hydrate saturation. Available theoretical formulae have different conditions of applicability. In areas without well data, it is not possible to calibrate theoretical formulae to guarantee the accuracy of hydrate saturation estimates. Therefore, alternative methods for hydrate saturation estimation are required.
Studies have shown that hydrate saturation is related to seismic wave attenuation. This study, therefore, aims to estimate hydrate saturation using attenuation. The dispersion and attenuation of the hydrate sediment layer have been studied with observational data, simulation experiments, and theoretical derivations. The conclusions obtained by these studies differ significantly. Some studies have concluded that attenuation decreases with hydrate saturation (Wood et al., 2000; Rossi et al., 2007; Jaiswal et al., 2012; Dewangan et al., 2014). Other studies have shown that attenuation increases with hydrate saturation (Sakai 1999; Guerin and Goldberg 2002; Dvorkin and Uden, 2004; Pratt et al., 2005; Gerner et al., 2007; Zhang et al., 2016). However, it has also been argued that the relationship between attenuation and hydrate saturation is more complex than single positive or negative correlations (Priest et al., 2006; Lee and Waite 2007; Sun et al., 2014; Li 2015; Sahoo et al., 2018; Sahoo et al., 2019; Guo et al., 2021; Wang et al., 2021).
This study used existing attenuation theories to obtain the relationship between hydrate saturation and seismic wave attenuation. Dispersion and attenuation theories are mainly based on the mesoscale, microscopic, and macroscale perspective. Among them, only the mesoscale is applicable to the frequency domain range of seismic surveys (Pride and Berryman, 2003; Carcione José and Picotti, 2006; Rubino and Holliger, 2012). To date, the relationship between dispersion and attenuation and hydrate saturation on the mesoscale has rarely been studied. In this study, three hydrate models were developed for the first time based on the patchy saturation theory applicable to the mesoscale. The relationships between hydrate saturation and dispersion and attenuation were obtained for the suspension mode, particle-contact mode, and cementation mode. In addition, the dispersion and attenuation patterns of each mode were clarified (White, 1975).
The study area was conducted in a deep-water area on the continental slope of a sea, representing a new field of hydrate research. The geological characteristics, temperature and pressure conditions, gas source conditions, tectonic conditions, and sedimentation conditions met the requirements for gas hydrate formation and preservation. Accordingly, the area had good prospects for gas hydrate resources. However, the study area only had seismic data, and well data were absent, making the calculation of hydrate saturation and resources an urgent problem. In this study, hydrate saturation and resource calculations in the study area were realized, providing a theoretical basis for hydrate resource assessment.
Patchy-Saturation Theory and Hydrate Model
White first used the patchy-saturation model to simulate velocity dispersion and attenuation caused by mesoscale heterogeneity (White, 1975). The patchy-saturation model assumes that a partially saturated water rock consists of several units, each consisting of a pair of concentric spheres. The concentric sphere is filled with a gas sphere of radius
The patchy-saturation model assumes that the inner sphere (denoted by subscript 1) has the same properties as the outer sphere shell (denoted by subscript 2). The complex moduli
where
If the interaction force between the air pockets is not considered using the White model, it must be ensured that the air saturation
The patchy-saturation model discusses the attenuation caused by uneven fluid distribution in the pores. The suspension mode natural gas hydrate in the sediment also has uneven distribution. The gas can replace the gas hydrate in the patchy-saturation theory for attenuation calculation (see Figure 1). For the three models A, B, and C, the suspension mode hydrates exist in the inner sphere. Model B represents the coexistence of the suspension and particle-support modes. The particle-support mode hydrate and skeleton grains form a new skeleton particle. Model C represents the coexistence of the suspension and cementation modes, and the cementation mode hydrate and skeleton grains form the new skeleton grains.
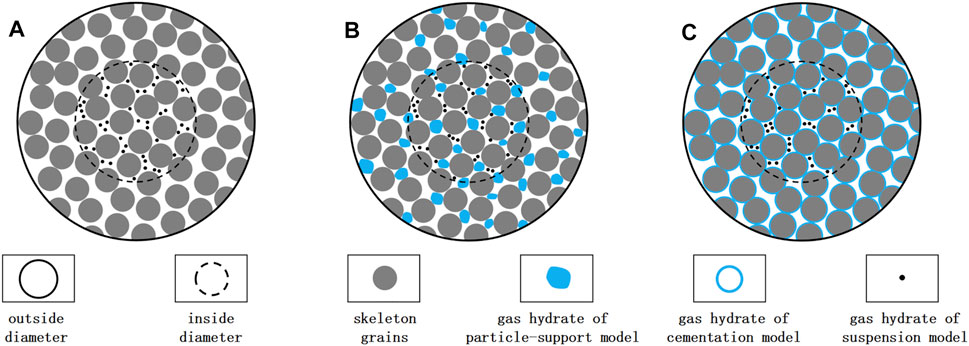
FIGURE 1. Schematic diagram of hydrate occurrence modes. In (A-C), suspension mode hydrate is part of fluid and distributed in the inner diameter. In (B), particle-contact mode hydrate becomes part of solid frame. In (C), cemented mode hydrate cements the grains evenly.
Model A
Based on Hertz–Mindlin theory Mindlin (1949), Dvorkin Helgerud et al. (1999) proposed a velocity model for non-cemented, high-porosity, hydrate-bearing deposits, and the equations are as follows:
where
where
The bulk modulus of the fluid in the inner sphere is as follows:
The fluid viscosity in the internal region was calculated using Balakin’s experimental data fitting (Balakin et al., 2010):
where
Model B
Compared with the suspension mode, the hydrate was considered part of the rock skeleton in the particle-contact mode, which had two effects: one was to change the bulk modulus and shear modulus of the skeleton, and the other was to reduce the formation’s porosity. The skeleton’s bulk modulus and shear modulus were calculated using the method mentioned in the study by Liu et al. (2019). The particle-contact mode hydrate saturation is
The remaining porosity is as follows:
The hydrate saturation in the suspension mode in the remaining pores is
The bulk modulus of the fluid in the inner sphere is expressed by Eq. 20. The fluid’s viscosity in the inner sphere is expressed by Eq. 21.
Model C
When the coexistence of suspension and cementation modes of the hydrate occurs, the skeleton’s bulk modulus and shear modulus were calculated using the method mentioned in the study by Liu et al. (2019). The hydrate saturation of the cementation mode is
Results
The Relationship Between Hydrate Saturation and Attenuation
At high hydrate concentrations (hydrate saturation exceeding 0.4), the hydrate greatly strengthens the skeleton of the sediments, bonds to adjacent porous medium particles, and causes sediments to solidify. Thus, the suspension mode hydrate changes into particle-contact mode or cemented mode hydrate (Yun et al., 2005; Yun et al., 2007; Xue 2016). Therefore, the upper limit of hydrate saturation for the suspension mode used in this study was 0.4. Attenuation is not only related to fluid distribution heterogeneity but also fabric heterogeneity (Ba et al., 2017; Zhang et al., 2021). In this study, uniform spherical particles were used as skeleton particles for simplicity. The parameters in Table 1 are used to calculate the relationship between hydrate saturation and attenuation for the three models.
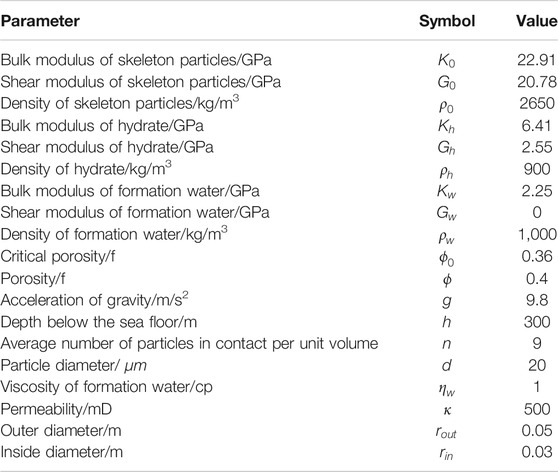
TABLE 1. Parameters.
Figure 2 shows the variation in P-wave velocity and attenuation with frequency in model A. For different hydrate saturation, the P-wave velocity increased nonlinearly with frequency, and the P-wave velocity shifted upward overall with hydrate saturation. The P-wave velocity increased rapidly to a certain value near the characteristic frequency, and the increase was positively correlated with hydrate saturation (Figure 2A). Figure 2B shows the variation of the P-wave attenuation coefficient with frequency. The attenuation tended to increase and then decrease with hydrate saturation, reaching a peak at the characteristic frequency. The peak value of the attenuation versus the frequency curve gradually increased with saturation.
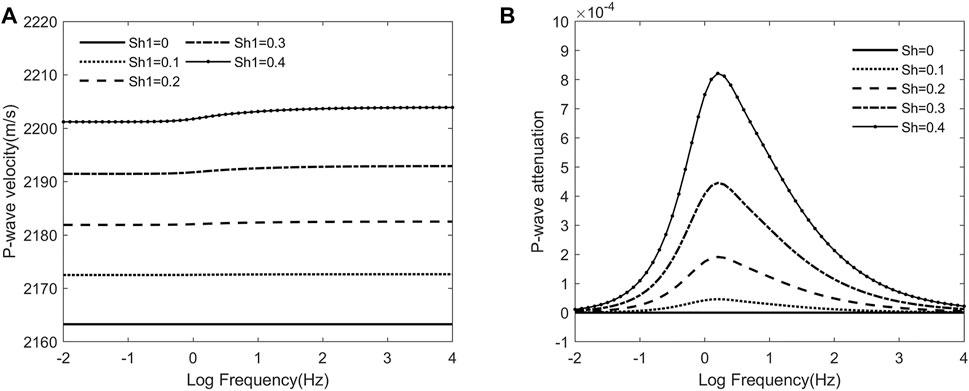
FIGURE 2. P-wave velocity (A) and P-wave attenuation (B) vs. frequency curves at different hydrate contents in model A.
Figure 3 shows the variation of P-wave velocity and attenuation with frequency in model B. The P-wave velocity increased with saturation in both the suspension and particle-contact modes, assuming hydrate saturations of 0.1, 0.2, and 0.3 in the particle-contact mode and 0, 0.1, 0.2, 0.3, and 0.4 in the suspension mode. When the hydrate saturation in the suspension mode was 0, the P-wave velocity was constant, that is, it did not vary with frequency (Figures 3A-C). As shown in Figure 3D, attenuation increased with hydrate saturation in the suspension mode and decreased with hydrate saturation in the particle-contact mode. The peak of P-wave attenuation shifted to the right as hydrate saturation increased in the particle-contact mode.

FIGURE 3. P-wave velocity (A-C) and P-wave attenuation (D) vs. frequency curves at different hydrate contents in mode B.
Figure 4 shows the variation of P-wave velocity and attenuation with frequency in model C. The effects on velocity and dispersion were roughly the same for cemented and particle-contact hydrates. However, the effect of the cementation mode hydrate on P-wave velocity and P-wave attenuation was greater. When hydrate saturation was the same, the increase in velocity was greater for the cemented mode hydrates than for particle-contact mode hydrates. The decrease in attenuation was greater for cemented mode hydrates than for particle-contact mode hydrates.
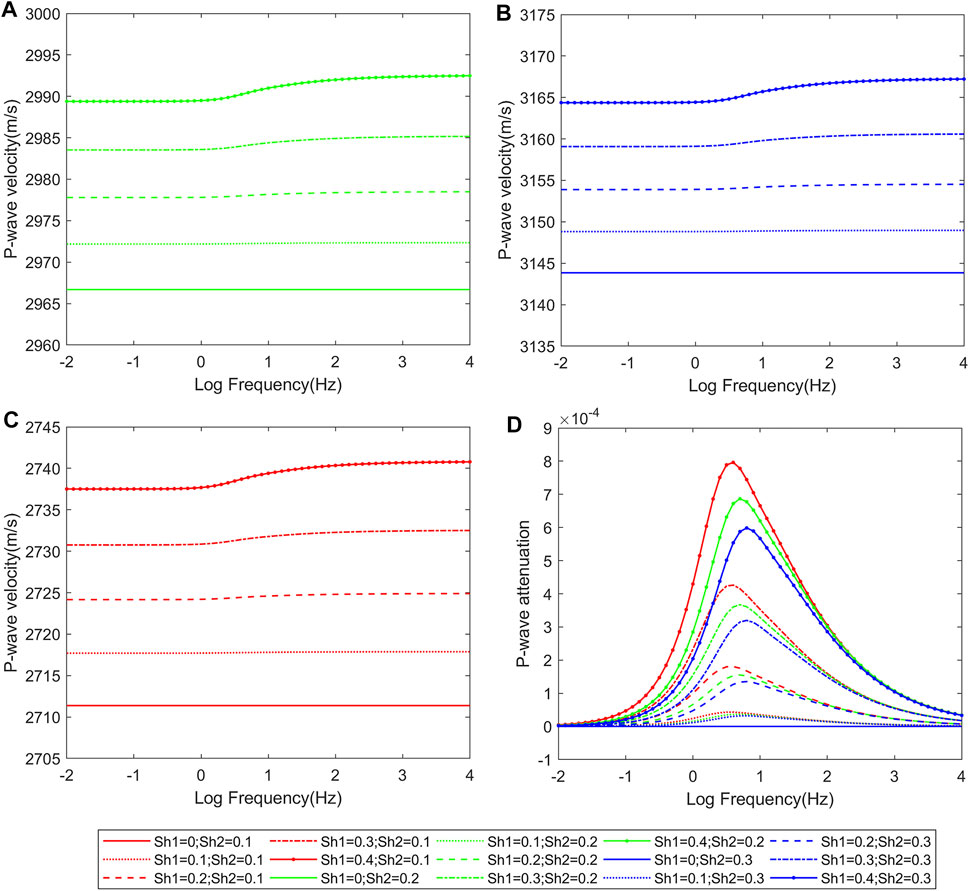
FIGURE 4. P-wave velocity (A-C) and P-wave attenuation (D) vs. frequency curves at different hydrate contents in mode C.
Estimation of Hydrate Resources
The simulation experiment of the hydrate aggregation and dispersion process showed that the hydrate formed by free methane mainly occurred in sediment particles in the cemented mode. The hydrate particles formed by dissolved methane were relatively small and mainly occurred among the sediment particles in the suspension mode. The study area was located in the deep-water area of the continental slope. The analysis of seismic data and metallogenic conditions in the study area showed that the hydrate ore bodies in the study area were derived from dissolved methane.
The suspension mode hydrate model was also used to study saturation. Mode A was suitable for the study area. Figure 5A shows the seismic profile of the research area. The wave impedance between the peak (black axis) and trough (red axis) with strong energy in the black dotted line box should be high, which was the target layer of the research area. The attenuation data were calculated by the inversion technique (Figure 5B). The attenuation of the target layer showed a high value, which further showed that the target layer developed hydrate. The dominant frequency of the target layer in the study area was 35 Hz. The hydrate saturation data volume was calculated using the relationship between hydrate attenuation and saturation in Mode A (Figure 5C). The maximum value of the hydrate was 38%, and the average value was 28%. The area and the effective thickness of the hydrate in the target layer were determined. The formula for calculating hydrate resources is as follows:
where
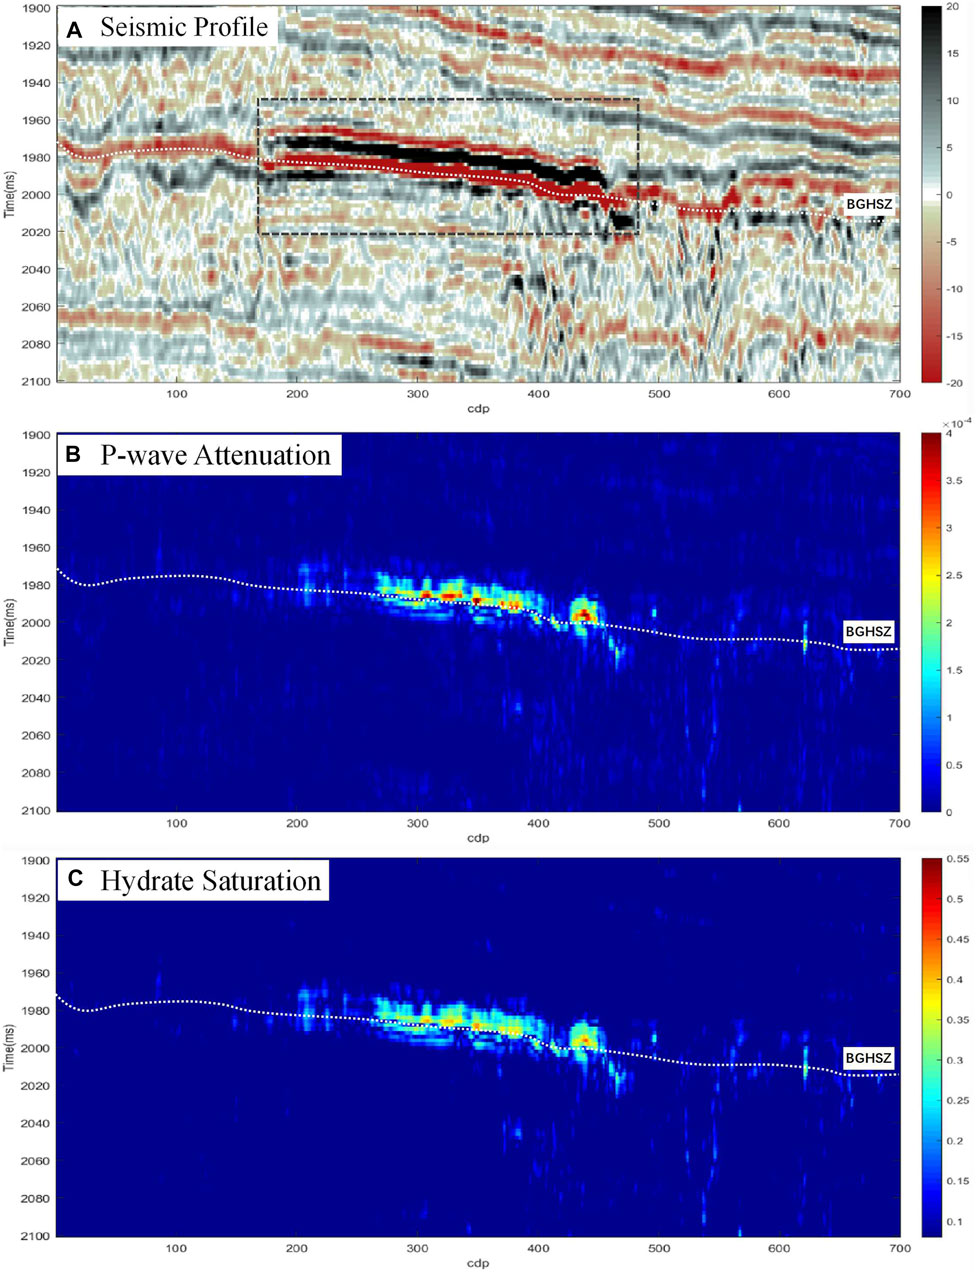
FIGURE 5. Seismic (A), attenuation (B), and hydrate saturation (C) profiles of the study area. The white dotted line is the base of the gas hydrate stability zone (BGHSZ), above which hydrates usually develop. The black dotted line box is the boundary of the target layer. The target layer is between the peak (black axis) and trough (red axis) with strong energy in the black dotted line box.
According to the adjacent area data, the porosity of the target layer was 0.4. The target layer area was 1.96*107 m2 square meters. The average thickness of the target layer was 14 m. The volume factor was 164; that is, one volume of hydrate released 164 volumes of methane gas. Based on this estimation, the hydrate resources in the study area were 5.05*109 m3.
Discussion
In this study, three hydrate models were developed based on the patchy-saturation theory applicable at the mesoscale (White, 1975), and the relationships between hydrate saturation and dispersion and attenuation were obtained for different models. Furthermore, hydrate saturation and resource calculation in the study area were completed using attenuation inversion data. Three hydrate models were developed to assess the hydrate dispersion and attenuation characteristics under the patchy-saturation theory. Finally, hydrate saturation and resource estimates for the study area were presented.
The patchy-saturation model discusses attenuation due to the inhomogenous distribution of fluids within the pore space. Suspension mode hydrates in the sediment layer are in a flowing state and have a nonuniform distribution. For this reason, suspension mode hydrates are used instead of fluids in the patchy-saturation model. The three hydrate models developed for the first time in this study represent 1) the suspension mode, 2) coexistence of the suspension mode and particle-contact mode, and 3) coexistence of the suspension mode and cementation mode. The suspension-mode hydrate was distributed in the inner sphere, while the particle-contact and cementation-mode hydrates were uniformly distributed as part of the skeleton in both the inner sphere and the outer spherical shell. The skeleton properties were similar in both regions. The purpose of the three models was to clarify the effects on dispersion and attenuation caused by the suspension mode hydrate as a fluid and the particle-contact and cemented mode hydrates as a skeleton, respectively.
The results of our study support the view that the relationship between attenuation and hydrate saturation is more complex than single positive or negative correlations. Hydrate attenuation characteristics in the sediment layer depended on the hydrate reservoir state. P-wave attenuation increased with saturation when the hydrate reservoir was in the suspension mode because as hydrate saturation increased in the suspension mode, the nonequilibrium pore pressure between different fluid zones increased, causing an increase in pore fluid flow velocity, which in turn led to an increase in seismic attenuation. Conversely, P-wave attenuation decreased with saturation when the hydrate reservoir state in the sediment layer was in both particle-contact and cemented modes because the particle-contact and cemented-mode hydrates increased the cementation of the sediment layer, leading to an increase in its strength, which in turn led to a decrease in seismic attenuation. The cementation mode had a greater effect on attenuation than the particle-contact mode because increases in skeleton bulk modulus, shear modulus, and strength were greater for the cemented mode than for the particle-contact mode hydrates when hydrate saturation is the same.
Hydrates formed from dissolved methane are small and mainly suspended between the sediment particles. The analysis of seismic data and metallogenic conditions in the study area indicated that the hydrate in the study area originated from dissolved methane. Therefore, the suspension mode hydrate model (Model A) was used for the saturation study. An inversion of the study area was carried out to obtain attenuation data, and the model A relationship was used to calculate the hydrate saturation data body in the study area, which in turn led to the calculation of study area resources. The attenuation theory was chosen to predict hydrate saturation because it had the following advantages. First, attenuation data equivalent to seismic attributes were derived from seismic data, and the process of obtaining them was uninterrupted and reliable. Second, the method was less dependent on well data than the velocity method and did not require well data to be calibrated to obtain hydrate saturation. Third, the patchy-saturation theory used in this study was applicable to the exploration frequency domain and could solve practical problems in the study area. Finally, the method utilized was an effective solution for the currently available data in the study area and may provide insights into hydrate quantification in other similar areas.
This study used only seismic data and metallogenic conditions, combined with data from neighboring areas, to determine the hydrate reservoir model as a suspension model. There was no logging data in the study area to determine the specific hydrate storage state. It is also unlikely that there is a single model for the hydrate reservoir in the sediment layer. Therefore, there is insufficient evidence for the suspension model, and further drilling is required to confirm it. When the hydrate reservoir state in a sedimentary formation follows Model B or Model C, or when all three reservoir modes coexist, it is not possible to accurately calculate the hydrate saturation profile from the attenuation profile using the relational equation. This is because the suspension model hydrate increases the attenuation, and particle-contact and cementation mode hydrate saturation decreases the attenuation, making it impossible to calculate hydrate directly from the attenuation profile when the respective content is unknown.
The next step in this line of research is calculating hydrate saturation when the hydrate state follows either model B or model C. The core of this is to determine the respective contents of hydrate in the sediment layer for the suspension, particle-contact, and cementation models.
Conclusion
In this study, the theoretical relationships between the dispersion and attenuation of the three models and the hydrate saturation were derived from a mesoscale perspective for the first time. Moreover, the influence of hydrates with different occurrence modes on dispersion and attenuation was clarified. When the hydrate occurrence in the sedimentary layer was in the suspension mode, the P-wave attenuation increased with saturation. When the hydrate occurrence in the sedimentary layer was particle-contact and cementation mode, the P-wave attenuation decreased with saturation. The particle-contact mode and the cementation mode hydrate moved the attenuation peak of the P-wave to the right. The degree of influence of the cementation mode on attenuation was greater than that of the particle-contact mode. The conclusions obtained in this study are applicable to the frequency range of seismic exploration, thus solving the problems of hydrate saturation prediction and resource estimation in the study area. When the hydrate occurrence in the formation follows model B or C, or the three occurrence modes coexist, it is still impossible to accurately calculate hydrate saturation based on attenuation, and further research is needed.
Data Availability Statement
The original contributions presented in the study are included in the article/Supplementary Material; further inquiries can be directed to the corresponding author.
Author Contributions
PL: modeling and writing. HH: communication and guidance. SM: translation and suggestion. LH: guidance. ZT: suggestion and verification. YS: suggestion and verification. All authors contributed to the article and approved the submitted version.
Funding
The authors were grateful to the support of the Natural Science Foundation of China (No. 41974124).
Conflict of Interest
Author PL was employed by the company PetroChina.
The remaining authors declare that the research was conducted in the absence of any commercial or financial relationships that could be construed as a potential conflict of interest.
Publisher’s Note
All claims expressed in this article are solely those of the authors and do not necessarily represent those of their affiliated organizations, or those of the publisher, the editors, and the reviewers. Any product that may be evaluated in this article, or claim that may be made by its manufacturer, is not guaranteed or endorsed by the publisher.
Acknowledgments
The authors would like to express their gratitude to EditSprings (https://www.editsprings.cn/) for the expert linguistic services provided.
References
Ba, J., Xu, W., Fu, L., Carcione, J. M., and Zhang, L. (2017). Rock Anelasticity Due to Patchy-Saturation and Fabric Heterogeneity: A Double Double-Porosity Model of Wave Propagation. J. Geophys. Research-solid earth. 122 (3), 1949–1976. doi:10.1002/2016jb013882
Balakin, B. V., Hoffmann, A. C., Kosinski, P., and Høiland, S. (2010). Turbulent Flow of Hydrates in a Pipeline of Complex Configuration. Chem. Eng. Sci. 65 (17), 5007–5017. doi:10.1016/j.ces.2010.06.005
Carcione José, M., and Picotti, S. (2006). P-wave Seismic Attenuation by Slow-Wave Diffusion: Effects of Inhomogeneous Rock Properties. Geophysics. 71 (3), 11–21. doi:10.1190/1.2194512
Dewangan, P., Mandal, R., Jaiswal, P., Ramprasad, T., and Sriram, G. (2014). Estimation of Seismic Attenuation of Gas Hydrate Bearing Sediments from Multi-Channel Seismic Data: A Case Study from Krishna-Godavari Offshore basin. Mar. Pet. Geology. 58, 356–367. doi:10.1016/j.marpetgeo.2014.05.015
Dutta, N. C., and Seriff, A. J. (1979). On White's Model of Attenuation in Rocks With Partial Gas Saturation. Geophysics. 44 (11), 1806–1812. doi:10.1190/1.1440940
Dvorkin, J., and Nur, A. (1996). Elasticity of High‐Porosity Sandstones: Theory for Two North Sea Data Sets. Geophysics. 61 (5), 1363–1370. doi:10.1190/1.1444059
Dvorkin, J., and Uden, R. (2004). Seismic Wave Attenuation in a Methane Hydrate Reservoir. The Leading Edge. 23 (8), 730–732. doi:10.1190/1.1786892
Gassmann, F. (1951). Über die Elastizität poröser Medien. Gesellschaft in ZÜrich. 90 (9), 1–23. doi:10.6038/cjg20160924
Gerner, A., Saenger, E. H., and Shapiro, S. A. (2007). Attenuation of P-Waves Due to Interlayer Fluid Flow in Hydrate-Bearing Sediments. J. Geophys. Eng. 4 (4), 394–403.
Guerin, G., and Goldberg, D. (2002). Sonic Waveform Attenuation in Gas Hydrate-Bearing Sediments from the Mallik 2L-38 Research Well, Mackenzie Delta, Canada. J. Geophys. Res. 107 (B5), 1–12. doi:10.1029/2001jb000556
Guo, Z., Wang, X., and Jiao, J. (2021). Rock Physics Model and Seismic Dispersion and Attenuation in Gas Hydrate-Bearing Sediments. Front. Earth Sci. 64 (9), 1–14. doi:10.3389/feart.2021.641606
Helgerud, M. B., Dvorkin, J., Nur, A., Sakai, A., and Collett, T. (1999). Elastic-Wave Velocity in Marine Sediments With Gas Hydrates: Effective Medium Modeling. Geophys. Res. Lett. 26 (13), 2021–2024. doi:10.1029/1999gl900421
Jaiswal, P., Dewangan, p., and Ramprasad, T. (2012). Seismic Characterization of Hydrates in Faulted, fine-grained Sediments of Krishna-Godavari Basin: Full Waveform Inversion. Geophys. Res. Solid Earth. 117 (B10), B10305. doi:10.1029/2012jb009201
Lee, M. W., Hutchinson, D. R., Collett, T. S., and Dillon, W. P. (1996). Seismic Velocities for Hydrate-Bearing Sediments Using Weighted Equation. J. Geophys. Res. 101 (B9), 20347–20358. doi:10.1029/96jb01886
Lee, M. W., and Waite, W. F. (2007). Amplitude Loss of Sonic Waveform Due to Source Coupling to the Medium. Geophys. Res. Lett. 34 (5), L05303. doi:10.1029/2006gl029015
Li, C. (2015). Seismic Wave Attenuation in Hydrate-Bearing Sediments and the Estimates of Attenuation Coefficient. Beijing: China University of Geosciences.
Liu, P., Sun, S. Z., and Hu, L. (2019). Estimation of Gas Hydrate Saturation at the Slope in the Northwest of South China Sea. Pet. Sci. Technology. 37 (15), 1777–1787. doi:10.1080/10916466.2019.1594289
Mindlin, R. D. (1949). Compliance of Elastic Bodies in Contact. Appl. Mech. 16, 259–268. doi:10.1115/1.4009973
Pratt, R. G., Hou, F., and Bauer, K. (2005). Waveform Tomography Images of Velocity and Inelastic Attenuation from the Mallik 2002 Crosshole Seismic Surveys. Vancouver: Geological Survey of Canada.
Pride, S. R., and Berryman, J. G. (2003). Linear Dynamics of Double-Porosity Dual-Permeability Materials. I. Governing Equations and Acoustic Attenuation. Phys. Rev. E Stat. Nonlin Soft Matter Phys. 68 (3), 036603. doi:10.1103/PhysRevE.68.036603
Priest, J. A., Best, A. I., and Clayton, C. R. I. (2006). Attenuation of Seismic Waves in Methane Gas Hydrate-Bearing Sand. Geophys. J. Int. 164 (1), 149–159. doi:10.1111/j.1365-246x.2005.02831.x
Rossi, G., Gei, D., Böhm, G., Madrussani, G., and Carcione, J. M. (2007). Attenuation Tomography: An Application to Gas-Hydrate and Free-Gas Detection. Geophys. Prospect. 55 (5), 655–669. doi:10.1111/j.1365-2478.2007.00646.x
Rubino, J. G., and Holliger, K. (2012). Seismic Attenuation and Velocity Dispersion in Heterogeneous Partially Saturated Porous Rocks. Geophys. J. Int. 188 (3), 1088–1102. doi:10.1111/j.1365-246x.2011.05291.x
Sahoo, S. K., Marín‐Moreno, H., North, L. J., Falcon‐Suarez, I., Madhusudhan, B. N., Best, A. I., et al. (2018). Presence and Consequences of Coexisting Methane Gas With Hydrate Under Two Phase Water‐Hydrate Stability Conditions. J. Geophys. Res. Solid Earth. 123 (5), 3377–3390. doi:10.1029/2018jb015598
Sahoo, S. K., North, L. J., Marín-Moreno, H., Minshull, T. A., and Best, A. I. (2019). Laboratory Observations of Frequency-Dependent Ultrasonic P-Wave Velocity and Attenuation During Methane Hydrate Formation in Berea sandstone. Geophys. J. Int. 219 (1), 713–723. doi:10.1093/gji/ggz311
Sakai, A. (1999). Velocity Analysis of Vertical Seismic Profile (VSP) Survey at JAPEX/JNOC/GSC Mallik 2L-38 Gas Hydrate Research Well, and Related Problems for Estimating Gas Hydrate Concentration. GSC Bull. 544, 323–340. doi:10.4095/210775
Sun, W., Ba, J., Müller, T. M., Carcione, J. M., and Cao, H. (2014). Comparison of P-Wave Attenuation Models of Wave-Induced Flow. Geophys. Prospecting. 63, 378–390. doi:10.1111/1365-2478.12196
Wang, W., Ba, J., Carcione, J. M., Liu, X., and Zhang, L. (2021). Wave Properties of Gas-Hydrate Bearing Sediments Based on Poroelasticity. Front. Earth Sci. 9, 283. doi:10.3389/feart.2021.640424
White, J. E. (1975). Computed Seismic Speeds and Attenuation in Rocks with Partial Gas Saturation. Geophysics. 40 (2), 224–232. doi:10.1190/1.1440520
Wood, W. T., Holbrook, S. W., and Hoskins, H. (2000). In Situ measurements of P-Wave Attenuation in the Methane Hydrate- and Gas-Bearing Sediments of the Blake Ridge. Proc. Ocean Drilling Program Scientific Results. 164, 265–272. doi:10.2973/odp.proc.sr.164.246.2000
Wood, W. T., Stoffa, P. L., and Shipley, T. H. (1994). Quantitative Detection of Methane Hydrate through High-Resolution Seismic Velocity Analysis. J. Geophys. Res. 99 (B5), 9681–9695. doi:10.1029/94jb00238
Wyllie, M. R. J., Gregory, A. R., and Gardner, L. W. (1956). Elastic Wave Velocities in Heterogeneous and Porous Media. Geophysics 21, 41–70. doi:10.1190/1.1438217
Xue, K. (2016). Study on Formation and Dissociation Characteristics of the Natural Gas Hydrate. Dalian: Dalian University Of Technology.
Yun, T. S., Francisca, F. M., Santamarina, J. C., and Ruppel, C. (2005). Compressional and Shear Wave Velocities in Uncemented Sediment Containing Gas Hydrate. Geophys. Res. Lett. 32, L10609. doi:10.1029/2005gl022607
Yun, T. S., Santamarina, J. C., and Ruppel, C. (2007). Mechanical Properties of Sand, silt, and clay Containing Tetrahydrofuran Hydrate. J. Geophys. Res. Solid Earth. 112, B04106. doi:10.1029/2006jb004484
Zhang, L., Ba, J., and Carcione, J. M. (2021). Wave Propagation in Infinituple-Porosity Media. J. Geophys. Res. - Solid earth. 126 (4), e2020JB021266. doi:10.1029/2020jb021266
Keywords: patchy-saturation model, hydrate saturation, dispersion, attenuation, mesoscale
Citation: Liu P, Huang H, Hu L, Mao S, Tian Z and Shen Y (2022) Hydrate Attenuation Characteristics Based on the Patchy-Saturation Model. Front. Earth Sci. 10:831405. doi: 10.3389/feart.2022.831405
Received: 08 December 2021; Accepted: 13 January 2022;
Published: 24 February 2022.
Edited by:
Pibo Su, Guangzhou Marine Geological Survey, ChinaReviewed by:
Hua Ning Xu, Qingdao Institute of Marine Geology (QIMG), ChinaJing Ba, Hohai University, China
Copyright © 2022 Liu, Huang, Hu, Mao, Tian and Shen. This is an open-access article distributed under the terms of the Creative Commons Attribution License (CC BY). The use, distribution or reproduction in other forums is permitted, provided the original author(s) and the copyright owner(s) are credited and that the original publication in this journal is cited, in accordance with accepted academic practice. No use, distribution or reproduction is permitted which does not comply with these terms.
*Correspondence: Handong Huang, 757542363@qq.com