A comprehensive insight into the effects of acidification on varied-sized pores in different rank coals
 Peiwen Jiang
 Chengtao Yang
 Feng Chen
 Bing Li1
  Jiangang Ren
- 1School of Environmental and Bioengineering, Henan University of Engineering, Zhengzhou, China
- 2Institute of Henan Energy and Chemical Industry Group Co, Ltd, Zhengzhou, China
- 3School of Geosciences and Engineering, North China University of Water Resources and Electric Power, Zhengzhou, China
Elucidating the evolution law of coal pore structure under acidification is crucial for guiding the practical application of acidizing technology and improving the production of coalbed methane. To comprehensively investigate the influence of acidification on varied-sized pores in different rank coals, in this study, fat coal, meagre coal and anthracite coal were collected and acidified with a mixed solution composed of hydrochloric acid (9 wt%) and hydrofluoric acid (3 wt%). An approach integrating low-pressure CO2 adsorption (LPGA-CO2), low-temperature N2 adsorption (LTGA-N2) and Mercury intrusion porosimetry (MIP) was adopted to fully characterize the varied-sized pore structure before and after acidification to eliminate the limitations of single method. The results demonstrated that acid treatment improved the pore opening degree and connectivity in coal, but had essentially no effect on the pore shape. After acidification, all the coal samples showed significant increases in the porosity and total pore volume, which was mainly contributed by the numerous newly formed large mesopores and macropores, especially the macropores (with an average contribution rate of 74.59%). Taken as a whole, acid treatment had the largest impact on macropores, followed by mesopores, and the smallest impact on micropores. In addition, the variation trend of total specific surface area (SSA) under acidification was primarily determined by micropores. For the three different rank coals selected in this study, the total SSA of fat coal (PM) was more easily affected by acidification and had the largest percentage increase after acid treatment, followed by anthracite coal (YM), while that of meagre coal (LA) decreased slightly. This difference was driven primarily by the different variation trend of micropore SSA in different rank coals. After acidification, the SSA of ultra-micropores and super-micropores all increased in fat coal (PM) and anthracite coal (YM), whereas for meagre coal (LA), although ultra-micropores SSA increased, super-micropores SSA decreased, which ultimately led to the slight decrease of its micropore SSA. Moreover, the total pore volume increment of coal was closely related to the macropore volume increment under acidification, but not significantly related to the coal maturity,which might indicate that, compared with coal rank, the mineral content in coal might be a more important consideration when measuring the applicability of acidification technology.
1 Introduction
Coal-bed methane (CBM) drainage is an effective technical means by which to prevent coal and gas outbursts, and it is also the practical demand for China to establish a new energy system under the goal of “double carbon” (Wang et al., 2014; Jiang et al., 2022). The exploitation of CBM is a continuous dynamic process, including desorption of CBM from the pore surface, diffusion from pores to fractures, and then seepage from fractures to the rockshaft (Tan et al., 2018; Li L. et al., 2020). Therefore, well-developed pore and fracture network is essential for the fast and efficient gas extraction (Liu et al., 2023). However, for coal seams with high mineral content, the pores and fractures are often blocked by minerals (such as calcite, kaolinite and pyrite), which seriously hampers the desorption and migration of CBM (Chen S. et al., 2021). Aiming at this problem, many studies have demonstrated that acidizing treatment can effectively remove the minerals and link the blocked channels (Turner and Steel, 2016; Wang et al., 2020; Chen Q. et al., 2021; Guo et al., 2021). Therefore, it is crucial to elucidate the pore structure evolution characteristics of coal under acidification for guiding the practical application of acidification technology and improving the production of CBM.
In recent years, many scholars have performed studies on the variation of coal pore structure under acidification. In these studies, the pore structure was commonly characterized by nuclear magnetic resonance (NMR), scanning electron microscopy (SEM), gas adsorption method (GA), and high-pressure Mercury intrusion (MIP) (Zhang et al., 2016; Zhao et al., 2018; Li S. et al., 2020; Ni et al., 2020; Wang et al., 2020; Liu et al., 2021; Xie et al., 2021; Yi et al., 2021). For example, Ni et al. explored the changes in pore structure under nitric acid treatment by SEM and LTGA-N2. They found that nitric acid treatment could enlarge the pores in coal and increase the pore openness (Ni et al., 2020). Zhang et al. launched the acidification experiment of coal with acetic acid and hydrochloric acid, and characterized the pore structure by LTGA-N2. The results showed that acid treatment made pores more complicated, and less aliphatic structure and more aromatic structure predicted more micropores (Zhang et al., 2016). In the work reported by Xie et al., SEM was used to qualitatively evaluate the changes in surface morphological characteristics caused by acetic acid acidification, and the combination of MIP and LTGA-N2 methods was used to quantitatively analyze the overall evolution characteristics of pore structure. They found that acidification helped to form cylinders pores and parallel plates pores, thus improving the pore connectivity (Xie et al., 2021). Taking acid solution with different components as treatment agents, Li et al. carried out NMR and SEM tests on the raw and acidified coal samples and explored the pore evolution characteristics, showing that different acid solutions affected macropores (1‒100 µm), mesopores (0.1‒1 µm) and micropores (<0.1 µm) differently (Li S. et al., 2020). Zhao et al. analyzed the change of pore structure under the treatment of hydrofluoric acid and hydrochloric acid using LTGA-N2, finding that acidification had a more pronounced effect on pores below 10 nm (Zhao et al., 2018). Yi et al. treated coal samples with hydrochloric acid, and used LTGA-N2 and LPGA-CO2 to characterize the pore structure. The results showed that, with increasing acid concentration, the volume of small mesopores and macropores showed a consistently increasing trend. However, the volume of large mesopores showed first a decrease and then an increase, and the variation trend of micropore volume was uncertain (Yi et al., 2021).
From previous relevant researches, we can see that various advanced techniques have been employed to analyze the changes of coal pore structure under acidification. Nevertheless, due to the limitation of the testing principle, these studies can only detect pore structure characteristics within a specific range of pore size (Zhang et al., 2017; Liu X. et al., 2019; Wei et al., 2019; Qin et al., 2020; Lu et al., 2021; Mou et al., 2021). For example, neither LTGA-N2 nor MIP can accurately characterize pores with diameters below 2 nm, which is attributed to the extremely slow nitrogen diffusion rate under low pressure and the limitation of the maximum mercury intrusion pressure (Mou et al., 2021). The approach combining LTGA-N2 and LPGA-CO2 enables the accurate characterization of micropores and mesopores, but not micron-sized macropores (Jagiello et al., 2019; Yi et al., 2021). However, pores with different sizes all play an important role in methane migration, among which micropores exert a great influence on methane adsorption capacity, and mesopores and macropores provide channels for methane diffusion and seepage (Tan et al., 2018). Thus, a characterization of full-sized coal pore structure before and after acid treatment is necessary to accurately reveal the mechanism of enhanced CBM production and improve the CBM extraction efficiency. Moreover, few studies have involved the differences in pore structure evolution between different coal ranks under acidification.
Based on the above analysis, in this study, different rank coals were acidified with hydrochloric acid and hydrofluoric acid. In order to eliminate the limitations of single method, an approach integrating LPGA-CO2, LTGA-N2 and MIP was performed to analyze the pore structure of raw and acidified coal samples. First, the pore structure of raw and acidified coals was respectively characterized using the three methods mentioned above. Then, the accurate full-sized pore structure parameters were obtained by intercepting the data of the three test methods in their optimal performance intervals, and the full-sized pore distribution curves were plotted. On this basis, the varied-sized pore evolution characteristics of different rank coals under acidification was investigated by comparing and analyzing the variation of micro-, meso-, and macropore structure characteristics, such as specific surface area (SSA), pore size distribution, as well as pore volume. At the same time, changes in pore morphological characteristics such as pore shape and pore connectivity caused by acidification were also discussed. This work aimed to provide a useful theoretical reference for the application of acidizing technology, which is of great practical significance for guiding the efficient exploitation of CBM and preventing gas outburst disasters.
2 Materials and methods
2.1 Samples and acidification
The three experimental coal samples with different ranks were respectively fat coal from Mine No.11 of Pingdingshan coal mine (PM), meagre coal from Lu’an coal mine (LA), and anthracite coal from Mine Chensilou of Yongcheng coal mine (YM). The first two kinds of coal belonged to middle-rank coal, and the last one belonged to high-rank coal. The samples came from the same coal seam and area to minimize the extrinsic effects of coal heterogeneity. The three types of coal samples were pulverized and sieved into two particle sizes: 0.18‒0.25 mm for the LPGA-CO2 and LTGA-N2 tests, and 3‒6 mm for the MIP test. Half of the grinded samples were soaked in acid solution for 24 h at room temperature, and then filtered. Next, the acidified coal samples were repeatedly washed until the pH was close to neutral, and then dried at 105°C for 12 h. The untreated coal samples were marked as PM-0, LA-0 and YM-0, and the corresponding acidified samples were marked as PM-1, LA-1 and YM-1, respectively.
In this research, an acid solution consisting of hydrochloric acid (9 wt%), hydrofluoric acid (3 wt%) and potassium chloride (2 wt%) was used for acid treatment. In this solution, the hydrochloric acid was used to dissolve carbonate minerals, hydrofluoric acid to remove silicate minerals, and potassium chloride to prevent pore plugging caused by swelling of clay minerals in water.
2.2 Test apparatus and methods
The low-pressure CO2 adsorption test (LPGA-CO2) was conducted on a Micromeritics ASAP 2020 instrument. The theoretical basis of this method was that CO2 can be physically adsorbed on the solid surface at saturation temperature. The coal’s micropore structure parameters, including pore size distribution, SSA, and pore volume were deduced and analyzed from the CO2 adsorption isotherms obtained at 273.15 K, using density functional theory (DFT). The low-temperature N2 adsorption test (LTGA-N2) was carried out on a surface area analyzer (Micromeritics ASAP 2460) to characterize the mesopore structure. The LTGA-N2 measurement took nitrogen as the probe molecule, and its testing principle was similar to that of LPGA-CO2. The N2 adsorption isotherms were recorded at 77 K. Then, the adsorption branch data of isotherms were processed using Barrett–Joyner–Halenda (BJH) theory, and the structural parameters of mesopore were calculated and analyzed. The Mercury intrusion porosimetry (MIP) test was conducted on an automatic mercury injection apparatus (Microactive Auto Pore V9600, United States). The range of mercury intrusion pressure was 0.1–60000 psia, and the test range of aperture was 3.5 nm to 1,000 μm. During the testing process, mercury injection volumes at different pressures were recorded to acquire the intrusion curves and extrusion curves. The pore size distribution, pore volumes, SSA, and porosities were calculated according to the correspondence between the pore diameter and the injection pressure. In this study, the pores in coal were classified following the relevant scheme recommended by International Union of Pure and Applied Chemistry (IUPAC), which divided pores into macropores (above 50 nm), mesopores (2‒50 nm), and micropores (below 2 nm), with the micropores further divided into ultra-micropores (below 0.7 nm) and super-micropores (0.7‒2.0 nm) (Thommes and Cychosz, 2014; Thommes et al., 2015).
3 Results and discussion
3.1 Micropore evolution characteristics (<2 nm)
The LPGA-CO2 isotherms of the raw and acidified coal samples are presented in Figure 1. We can see that the shapes of the CO2 adsorption curves were similar to the low-pressure region of Langmuir isotherm, indicating the existence of abundant open micropores. With increasing adsorption pressure, the CO2 adsorption quantity increased rapidly at P/P0 of 0–0.01, then slowed down when the relative pressure was greater than 0.01. The respective maximum CO2 adsorption quantities of PM-0, LA-0, and YM-0 were 15.81, 21.63, and 20.81 cm3/g, which showed an overall upward trend with increasing metamorphism. After acidification, the maximum CO2 adsorption quantities of PM and YM increased significantly, while that of LA showed little change. To explore the possible reasons for this difference, the changes of ultra-micropores (below 0.7 nm) and super-micropores (0.7-2.0 nm) were discussed in more detail below.
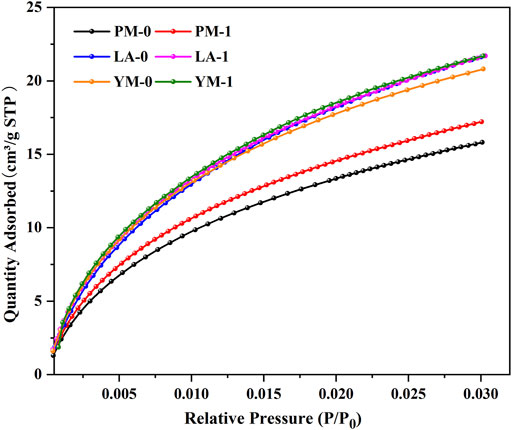
FIGURE 1. LPGA-CO2 adsorption isotherms of the raw and acidified coal samples.
Table 1 shows the corresponding micropore structural parameters. We can see that for PM and YM, the volumes and areas of ultra-micropore and super-micropore all showed an increasing trend after acidification. However, for LA, the volume and area of ultra-micropore increased while that of super-micropore decreased. These two opposite changes caused the total micropore volume and total micropore SSA of LA to slightly decreased. It can be seen from the analysis of Figure 1 and Table 1 that for coal samples of different ranks, the volume and SSA of ultra-micropores after acidification all increased, while that of super-micropores might increase or decrease. In other words, acid treatment can facilitate the development of ultra-micropores, but it had a two-sided effect on the change of super-micropores. Based on this analysis, it can be inferred that the simultaneous effect of acidification on ultra-micropore and super-micropore changes might lead to an increase in the total micropore volume and total micropore SSA in different coals, or no obvious change, or even decrease.
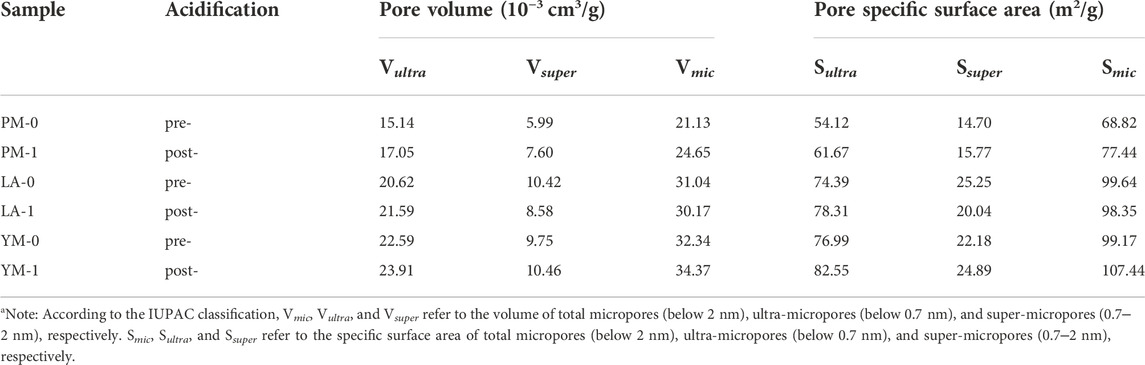
TABLE 1. Micropore structural parameters of the raw and acidified coal samples from the LPGA-CO2 measurementa.
Figure 2 illustrates the micropore volume distribution and micropore area distribution of the raw and acidified coal samples. In this study, the actual pore size range tested by LPGA-CO2 was 0.33‒1.1 nm, which was determined by the kinetic diameter of CO2 and the maximum relative pressure limit of CO2 in this method (Thommes and Cychosz, 2014). We can see that these two types of distribution curves were highly similar in morphology, which was attributed to the micropore filling mechanism in the carbon dioxide adsorption process. All the curves appeared to be bimodal distribution and can be divided into ultra-micropore region and super-micropore region with 0.7 nm as the demarcation point. The pores with a diameter of 0.55 and 0.85 nm were the most probable ones, which meant that pores with these two diameters had the largest contribution to the micropore SSA and volume. After acidification, for the medium rank coals (PM and LA), the multiple peaks in the ultra-micropore range of raw coal samples tended to merge into a broad peak, suggesting a more uniform distribution of ultra-micropores in acidified coal samples. Contrarily, for high rank coal (YM), the two peaks in the ultra-micropore range were clearly separated after acidification, accompanied by an increase in peak value and a decrease in peak width, and the peak at 0.55 nm obviously moved to the left. These phenomena indicated that acid treatment reduced the ultra-micropore diversity of high rank coal and produced numerous smaller ultra-micropores. In other words, after acid treatment, the ultra-micropore structure of high rank coal was more regular. For pores in the super-micropore range, the main peak of all the raw and acidified samples was located at 0.85 nm, suggesting that acid treatment only changed the number of super-micropores without altering the super-micropore diameter.
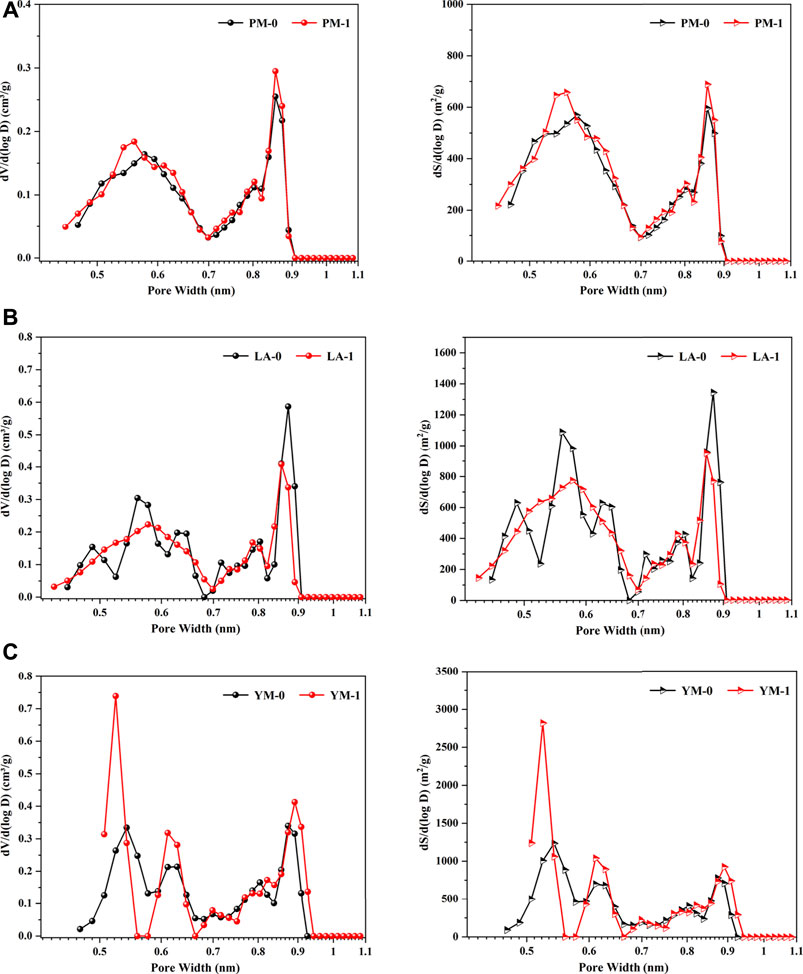
FIGURE 2. Micropore volume distribution curves and micropore area distribution curves from the LPGA-CO2 measurement: (A) PM; (B) LA; (C) YM.
3.2 Mesopore evolution characteristics (2‒50 nm)
Figure 3 gives the N2 adsorption isotherms obtained from the LTGA-N2 measurement. According to the latest classification method of adsorption isotherm recommended by IUPAC, all the curves presented features as follows: type IV (a) in the low relative pressure interval and type II in the high relative pressure interval, which indicated that the studied coal samples were multi-scale porous aggregates with micropores, mesopores and macropores (Jin et al., 2016). After the acid treatment, the adsorption curves of LA-1 and YM-1 showed a sharp rise when the relative pressure was greater than 0.8, which corresponded to the multilayer adsorption process of macropores, indicating that acidification significantly contributed to the generation of larger pores (Guo et al., 2019). Moreover, it was considered that the type and size of hysteresis loops could provide information about the shape and openness of pores in coal (Ni et al., 2020). Based on the classification criteria of hysteresis loop type of the IUPAC, all the raw coal samples presented the hysteresis loop of type H3, suggesting the presence of quantities of narrow slit-shaped mesopores. In addition, the size of hysteresis loops in raw coal samples were relatively small, which meant the existence of numerous semi-closed or closed pores with poor connectivity. After acidification, the size of the hysteresis loop obviously increased while the shape remained basically the same, which suggested that acid treatment could improve the pore opening degree significantly, but not affect the pore type.
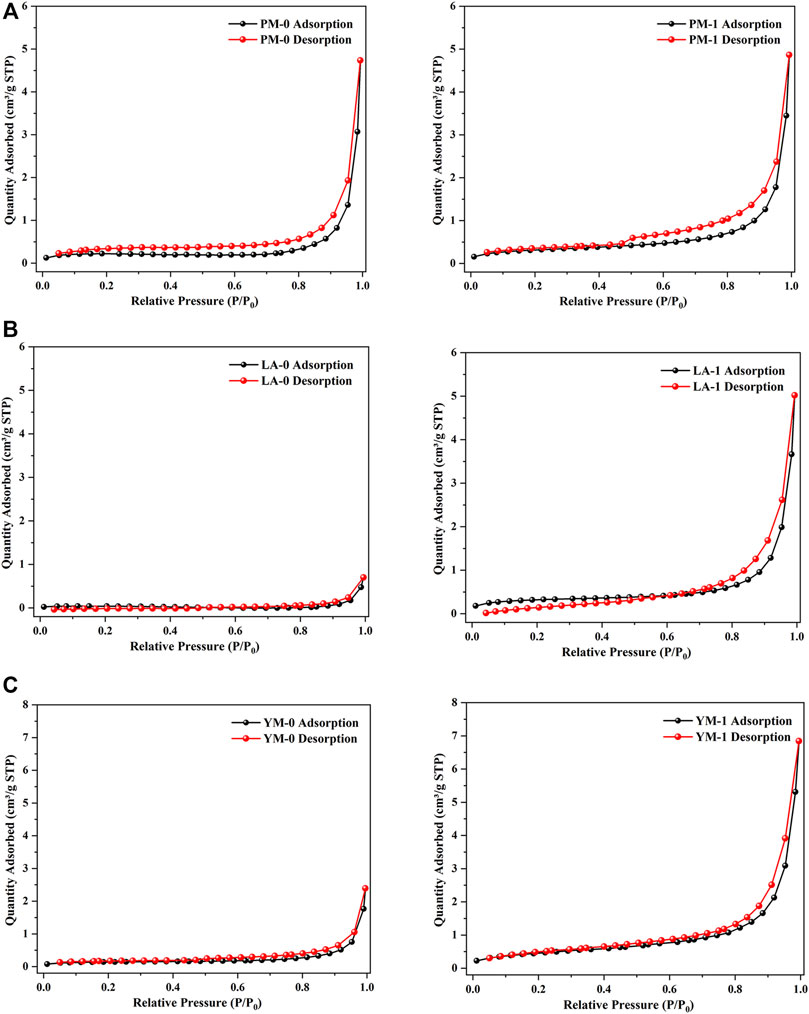
FIGURE 3. LTGA-N2 adsorption isotherms of the raw and acidified coal samples: (A) PM; (B) LA; (C) YM.
The maximum N2 adsorption quantities of LA-1 and YM-1 were 5.02 and 6.85 cm3/g, respectively, which showed a notable increase compared with that of the corresponding raw coal. In contrast, the N2 adsorption quantity of PM-1 was only a little higher than that of the raw coal. These findings suggested that acidification can significantly improve the nitrogen adsorption capacity of meagre coal and anthracite coal, but had little effect on that of fat coal. The mesopore structural parameters obtained by the LTGA-N2 measurement are listed in Table 2. After being treated with acid, the mesopore volume of all the experimental samples increased, especially for LA and YM. Specifically, the mesopore volumes of PM, LA, and YM increased from 0.00724, 0.00108, and 0.00265 cm3/g to 0.00803, 0.00763, and 0.01054 cm3/g, respectively. The SSA of mesopores also showed an increasing trend after acidification. From the above analysis, we can see that acid treatment helped to enrich the pores in coal and improve the pore openness, which played a reinforcing role for the diffusion and migration of CBM.
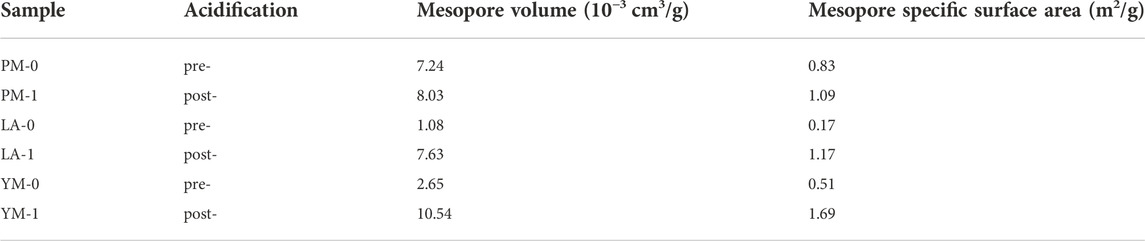
TABLE 2. Mesopore structural parameters of the raw and acidified coal samples from the LTGA-N2 measurement.
Figure 4 gives the mesopore volume distribution curves and mesopore area distribution curves of the raw and acidified samples. It was clear that for raw meagre coal (LA-0) and raw anthracite coal (YM-0), the mesopore volume distribution curves were largely coincided with the baseline in the range of less than 10 nm, and then showed a slowly rising trend with the increase of pore diameter. This phenomenon indicated that the mesopores of these two raw coal samples were poorly developed, with only a few large mesopores with diameters greater than 10 nm. After being treated with acid, the pore volume distribution density (dV/d (log D)) increased rapidly with increasing pore diameter in the range of greater than 10 nm, and several small peaks presented within diameters less than 10 nm. From an overall perspective, the increase of the pore volume distribution density of large mesopores was more significant under acid treatment, which suggested that the expansion of mesopores in meagre coal and anthracite coal by acidification was primarily reflected in the increase of large mesopores. Additionally, although the pore volume distribution of PM was largely unchanged during the acid treatment, the peak value increased. The above phenomena indicated that substantial mesopores, especially large mesopores, were generated or exposed during the acid treatment. From the pore area distribution curves, we can see that the large mesopores contributed most of the SSA of mesopores, which further confirmed the significant promotion of acid treatment on the development of the large mesopores.
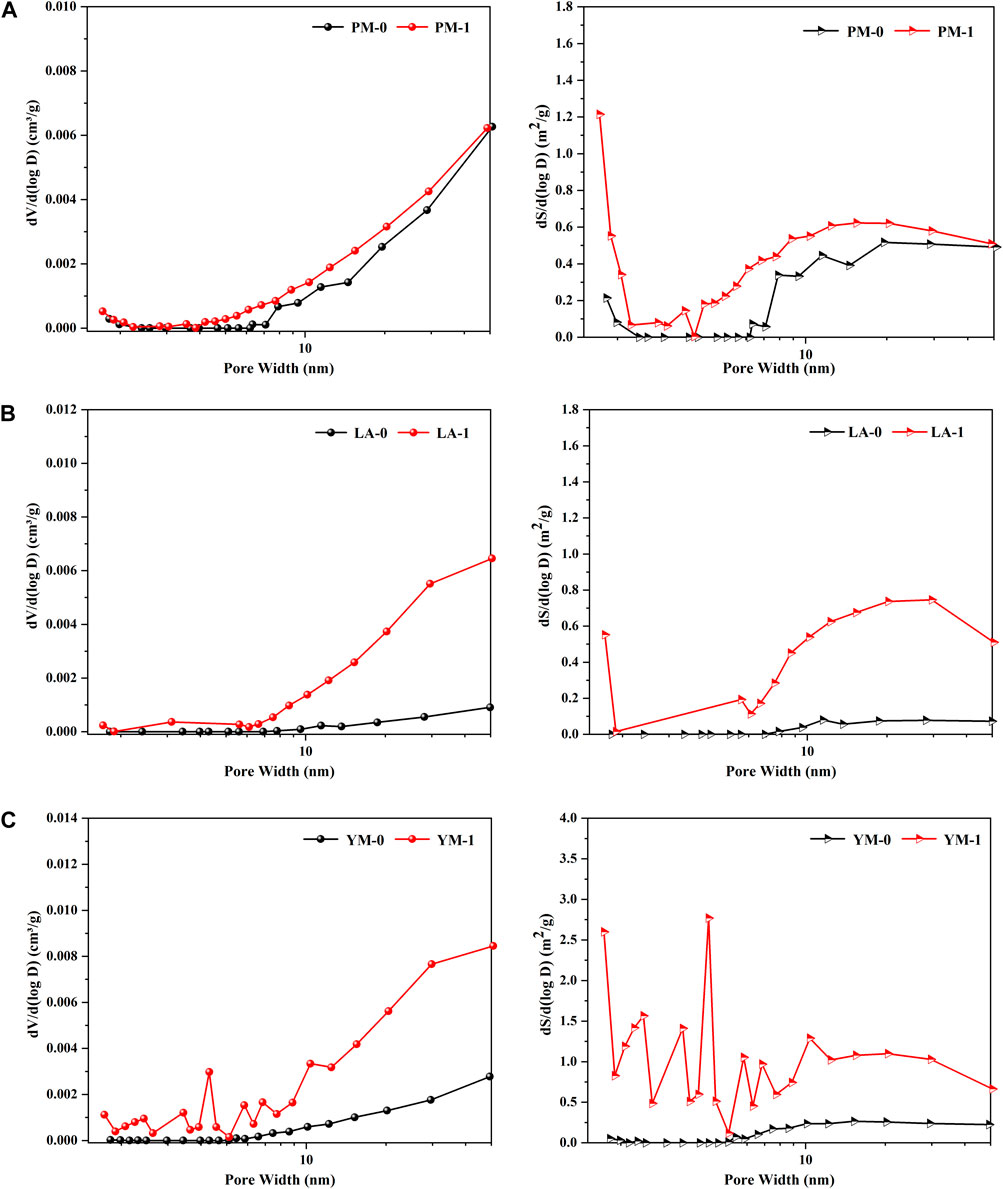
FIGURE 4. Mesopore volume distribution curves and mesopore area distribution curves from the LTGA-N2 measurement: (A) PM; (B) LA; (C) YM.
3.3 Macropore evolution characteristics (>50 nm)
The MIP intrusive and extrusive curves of the untreated and acid-treated coal samples are shown in Figure 5. As a comprehensive reflection of the pore structure, the shape of the curve contains features of the pore type and pore connectivity. The cumulative intrusion volume represents the volume of effective pores, including the semi-closed pores and open pores (Wang et al., 2015). The volume of semi-closed pores is considered equal to the cumulative extrusion volume. That is, the volume difference obtained by subtracting the cumulative extrusion volume from the cumulative intrusion volume can be considered as the volume of open pores (Wang et al., 2020). Additionally, pore type and connectivity can be determined according to the hysteresis loop characteristics. Coal with abundant open pores would have an obvious hysteresis loop, while that with few open pores would not (Guo et al., 2019). Generally, large hysteresis loops and great differences between the volume of Mercury intrusion and Mercury extrusion suggest a high fraction of open pores and excellent pore connectivity (Chen et al., 2012). From Figure 5, we can see that all the coal samples had hysteresis loops, suggesting that there were both open pores and semi-closed pores in coal. After acidification, the cumulative intrusion volume of all the coal samples increased significantly while the cumulative extrusion volume changed little. This indicated that a large number of effective pores, mainly open pores, were produced during the acidification process. The more pronounced hysteresis loops of the three acid-treated coal samples further proved a higher proportion of open pores and a better pore connectivity after acidification. This conclusion was consistent with that obtained by LTGA-N2 measurement. These findings all suggested that many invalid pores were transferred into open pores or semi-closed pores under the action of acid etching, which favored the diffusion and migration of CBM.

FIGURE 5. The MIP intrusive and extrusive curves of the raw and acidified coal samples: (A) PM; (B) LA; (C) YM.
Table 3 lists the pore structural parameters obtained from the MIP measurement. We can see that the mesopore data from MIP measurement was significantly larger compared to that from LTGA-N2 measurement, which might be due to the coal compression effect under high pressure (Li et al., 2021). This finding further proved the limitation of MIP method in the characterization of mesopores. Besides, the interparticle pores effect under low pressure may lead to overestimation of the macropore size and volume in MIP measurement. For the sake of accuracy, we focused analysis on the pore characteristics with aperture between 50 nm and 60 μm, and the data below 50 nm were for reference only (Li et al., 2021). It can be seen from Table 3 that, for the raw coal samples, the macropore volumes ranged from 0.02087 to 0.02386 cm3/g, accounting for 51.64%–53.68% of the total volumes. After being treated with acid, the volumes of mesopore and macropore all showed an increasing trend, but the increased amplitudes of macropore volume was obviously larger than that of mesopore volume. Specifically, the mesopore volumes of PM, LA, and YM increased by 21.15%, 2.01%, and 0.27%, respectively, while the macropore volumes increased by 63.11%, 197.74%, and 54.82%, respectively. This indicated that the effect of acidification on macropores was far more significant than that on mesopores. Additionally, due to the negligible role of macropores in contributing total SSA, although macropores were obviously developed under acidification, the total SSA changed little.
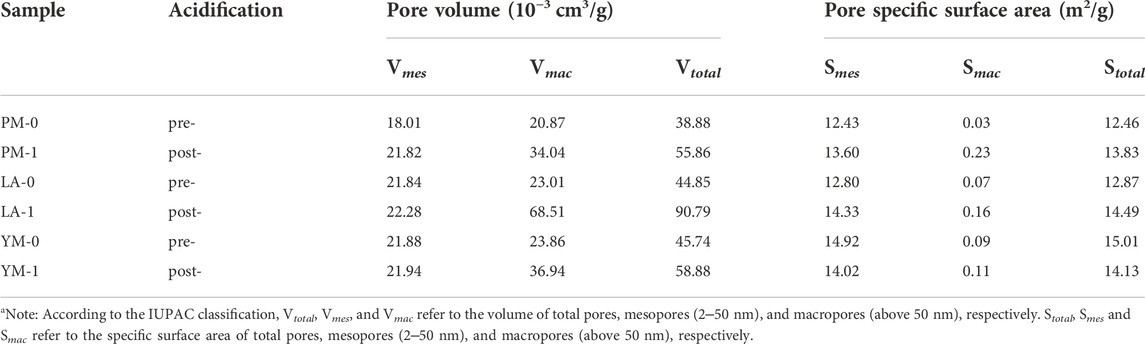
TABLE 3. Pore structural parameters of the raw and acidified coal samples from the MIP measurementa.
Figure 6 exhibits the pore volume distribution curves and the pore area distribution curves obtained from Mercury injection test. For the three raw coals, peaks in the macropore interval were mainly concentrated in diameters over 10 μm, illustrating that macropores in the raw coal samples were primarily ultra-macropores with a diameter greater than 10 μm. After being treated with acid solution, multiple broad peaks appeared between 50 nm and 10 μm, with the peak area of the original ultra-macropores showed a substantial increase, indicating that the primary macropores further expanded during the acidification process, and a variety of varied-sized macropores were formed at the same time. Moreover, it was also observed that compared with mesopores, the contribution of macropores to the total SSA were negligible. After acidification, the contribution of mesopores with diameters of about 10 nm increased, suggesting the formation of larger mesopores during acid treatment.
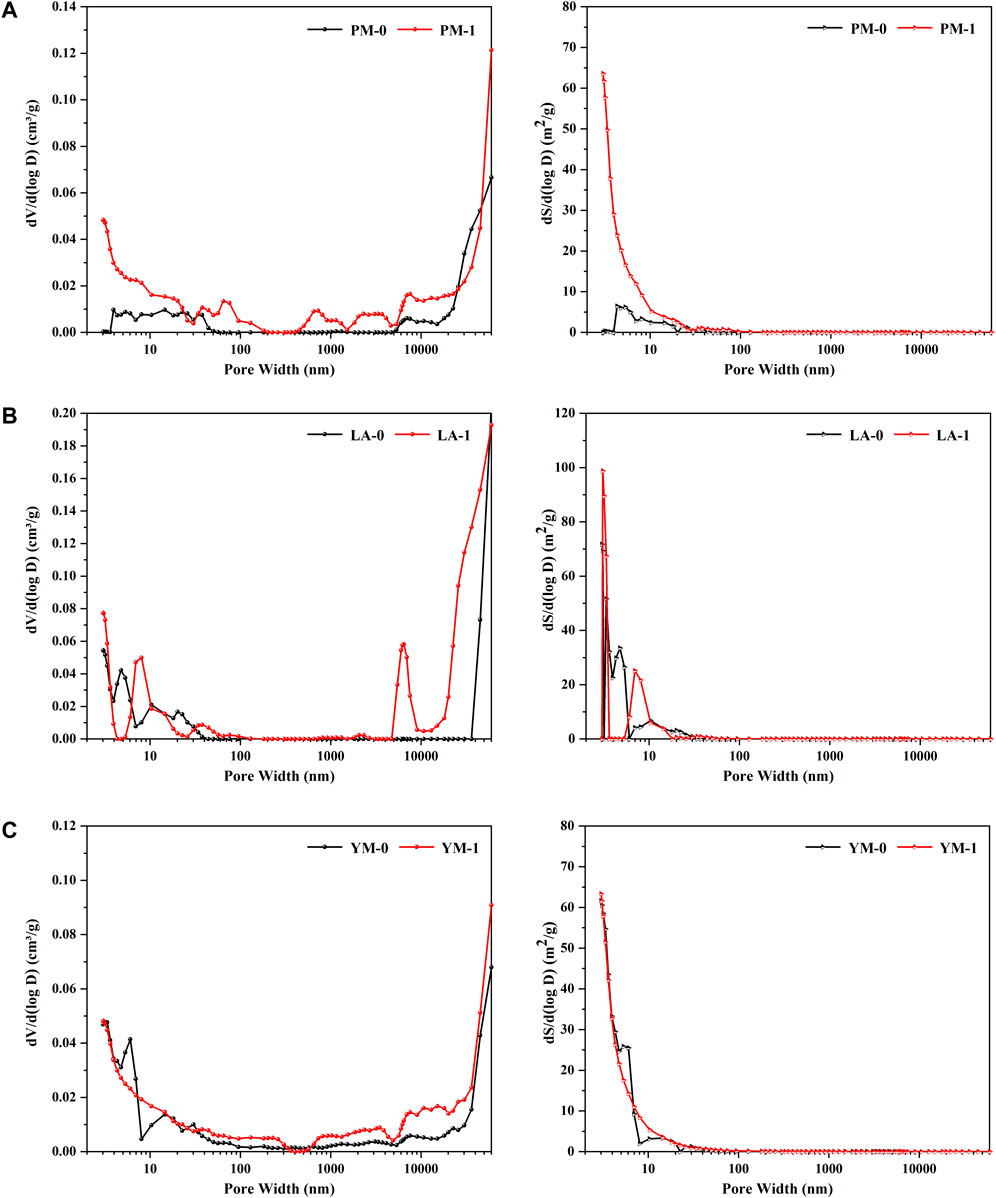
FIGURE 6. Pore volume distribution curves and pore area distribution curves from the MIP measurement: (A) PM; (B) LA; (C) YM.
3.4 Comprehensive analysis of varied-sized pore evolution characteristics under acidification
According to the discussion above, the acid treatment exerted a significant influence on coal’s micropores, mesopores and macropores. However, neither LPGA-CO2, LTGA-N2 or MIP can independently elucidate the complicate pore structure characteristics, which was limited by the test principle. Previous studies have demonstrated that the above three test methods have different optimal performance intervals: LPGA-CO2 can accurately characterize micropores, LTGA-N2 is suitable for characterizing mesopores, and MIP is more accurate for characterizing macropores (Wang et al., 2019; Wei et al., 2019; Lu et al., 2021; Wei et al., 2021). Referring to previous studies, the pore size distribution data of micropores (below 2 nm) from LPGA-CO2, mesopores (2‒50 nm) from LTGA-N2, and macropores (above 50 nm) from MIP were directly combined and respectively connected at 2 nm and 50 nm to obtain the full-sized pore size distribution dataset. On this basis, the full-sized pore volume distribution curves and full-sized pore area distribution curves were plotted (Figures 7, 8). Although there was aperture interval that could not be detected by both LPGA-CO2 and LTGA-N2, this integrated method can reflect the relative changes of pores in coal to the greatest extent. Table 4 summarizes and lists the pore volumes and SSA measured by the three test methods in their best performance intervals, as well as the porosities obtained from Mercury intrusion measurement. It is important to note that it is not very rigorous to directly combine the pore structure data obtained from test methods based on completely different theories. There may be still differences between the pore structure parameters obtained in this study and the real pore structure characteristics of coal, but compared with single methods, they can more accurately reflect the relative changes in the varied-sized pore evolution characteristics under acidification.
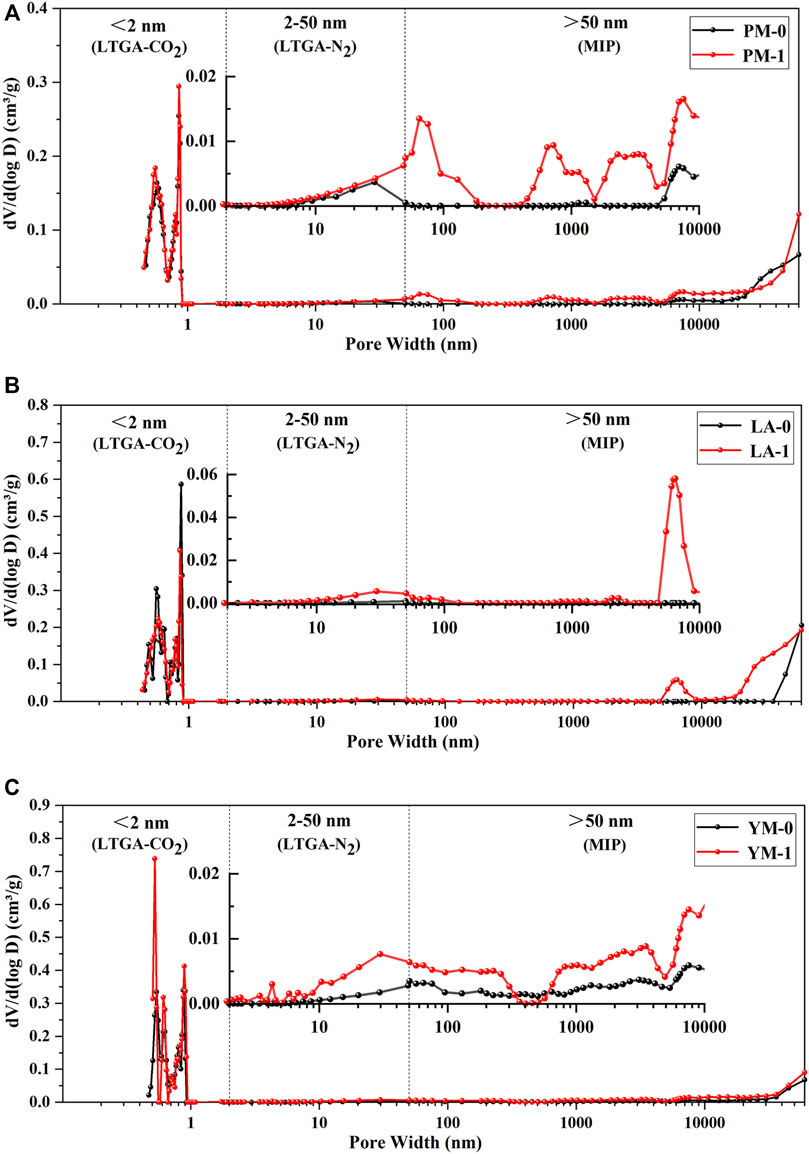
FIGURE 7. Full-sized pore volume distribution curves of the raw and acidified coal samples, and the inserts were the partial enlargement curves: (A) PM; (B) LA; (C) YM.
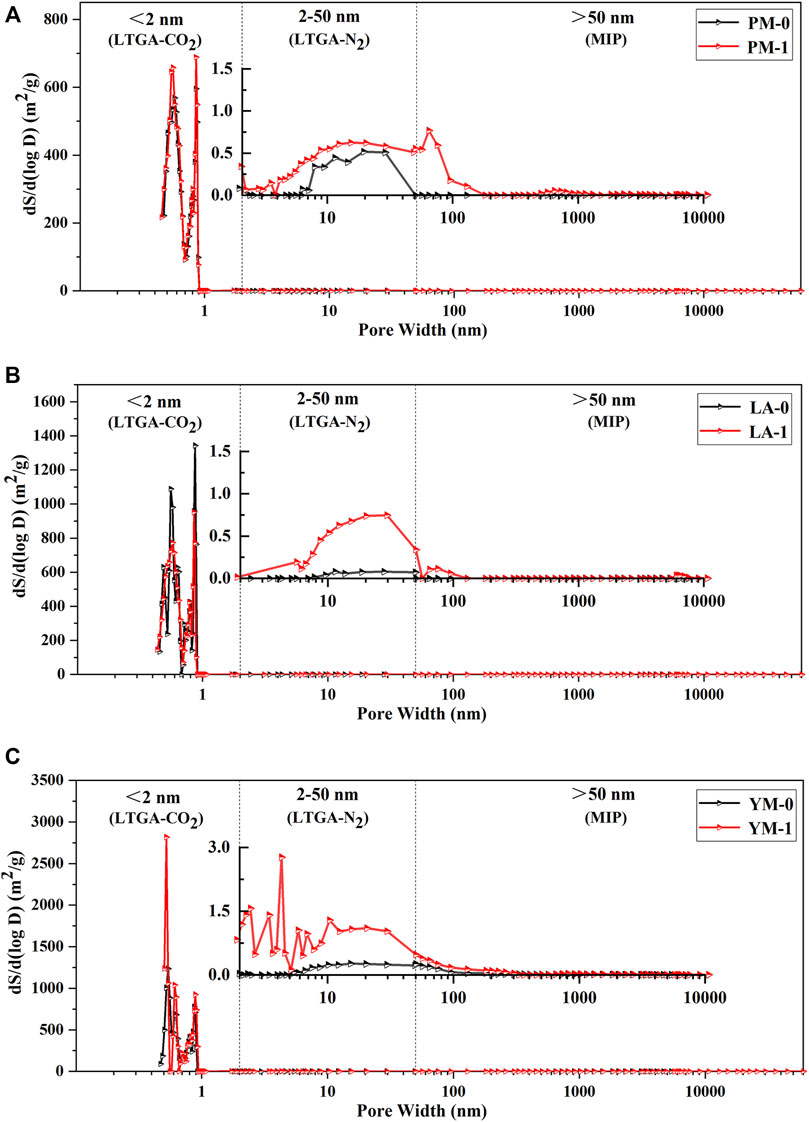
FIGURE 8. Full-sized pore area distribution curves of the raw and acidified coal samples, and the inserts were the partial enlargement curves: (A) PM; (B) LA; (C) YM.
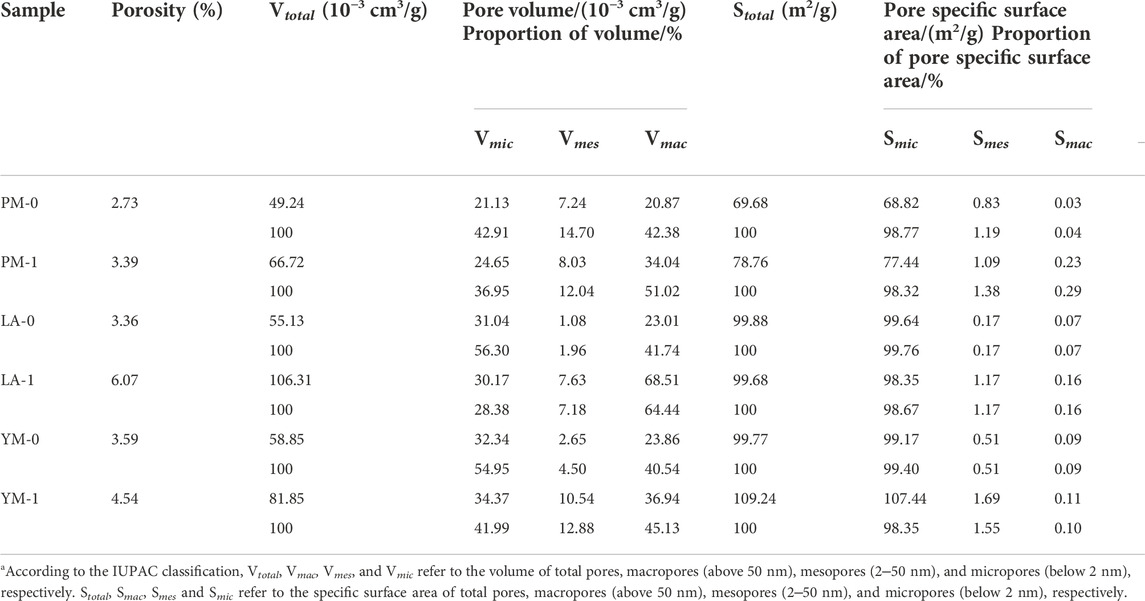
TABLE 4. Full-sized pore structural parameters of the raw and acidified coal samples.
From Table 4, the micropores of PM-0, LA-0 and YM-0 respectively contributed to 42.91%, 56.30% and 54.95% of the total pore volume, and the macropores respectively contributed to 42.38%, 41.74% and 40.54% of the total pore volume, while the contribution of mesopores was less than 15%, which indicated that the studied raw coals were mainly composed of micropores and macropores. With increasing coal rank, the total pore specific areas and total pore volumes showed an overall increase, which was mainly contributed by the obviously development of micropores. In addition, micropores contributed more than 98% to the raw coals’ total SSA, which illustrated the dominant role of micropore in determining the adsorption capacity. After the treatment with acid, the total pore volumes of all the samples showed a significant increase. Specifically, the total pore volumes of PM, LA, and YM increased from 0.04924, 0.05513, and 0.05885 cm3/g to 0.06672, 0.10631, and 0.08185 cm3/g, respectively. At the same time, the porosity increased from 2.73%, 3.36%, and 3.59%–3.39%, 6.07%, and 4.54%, respectively. Comparing the variation of pore volume in different aperture intervals after acidification, we can see that the increase of total volume mainly came from macropores (with an average contribution rate of 74.59%), while the changes of mesopore volume and micropore volume were relatively small, especially that of micropores. This phenomenon indicated that acidification exhibited the greatest impact on macropores, followed by mesopores, and the smallest effect on micropores.
Based on above analysis, we can see that the improvement of the permeability of coal under acid treatment was mainly achieved by promoting the formation of mesopores and macropores, especially macropores. The newly formed mesopores and macropores linked the flow channel of CBM, thus promoting the migration and extraction of CBM. Comparing the increment of total pore volume of the three different rank coals under acidification, it was found that there was no obvious correlation between total pore volume increment and coal maturity. This might be due to that the increase of total pore volume under acidification was mainly derived from macropores, the development of which was strongly related to the removal of minerals in coal, yet the mineral content was affected by the coal sedimentary environment rather than coalification (Liu S. et al., 2018; Wang et al., 2019; Mou et al., 2021; Yi et al., 2021). Previous studies have indicated that the effect of acidification on improving permeability was closely related to the mineral content in coal. The higher the mineral content, the better the permeability enhancement effect (Li et al., 2017). Based on previous studies and our preliminary results, we inferred that compared with coal rank, the mineral content in coal may be a more important consideration when measuring the applicability of acidification technology.
Additionally, according to the specific surface area data shown in Table 4, the variation of meso- and macropores SSA after acidification could be ignored, and the increase or decrease of total SSA was mainly determined by micropores. Moreover, it also can be seen from Table 4 that, the total SSA of fat coal (PM) was more easily affected by acidification and had the largest percentage increase after acid treatment, followed by anthracite coal (YM), while that of meagre coal (LA) decreased slightly. This difference was driven primarily by the different variation trend of micropore SSA in different rank coals discussed in section 3.1.
From Figure 7, we can see that the peaks of the three raw coal samples were concentrated in the range of diameters below 0.9 nm and above 10 μm, and the main peaks were located at about 0.55, 0.85 nm, and tens of microns, suggesting that the pore systems were primarily composed of ultra-micropores with diameters of about 0.55 nm, super-micropores with diameters of about 0.85 nm, and ultra-macropores with diameters of tens of microns. After the acid treatment, the pores were still dominated by micropores and macropores, but the pore size distribution changed significantly.
For the ultra-micropore in coal, as analyzed in section 3.1, acid treatment made the ultra-micropore structure in medium rank coal more uniform, while that in high rank coal more regular. This might be due to that acidification caused the alkyl structure to fall off, thereby further increasing the proportion of aromatic structure in high rank coal, making the coal macromolecules more orderly arranged, thus producing smaller and more regular ultra-micropores (Liu et al., 2017; Liu Y. et al., 2018; Liu Y. et al., 2019; Li Y. et al., 2020). As for the super-micropores in coal, the main peak position of acidified coal samples stayed the same, yet the peak value of PM and YM here increased after acid treatment, while that of LA decreased. It is considered that super-micropores are the intermolecular spaces in coal, and the removal of volatiles (such as the functional groups or weak side chains of coal macromolecules) can increase the number of super-micropores (Liu Y. et al., 2019). Therefore, the development of super-micropores in PM and YM may have been due to the intermolecular spaces formed by the removal of functional groups or unstable side chains under acidification, and the decrease of super-micropores in LA may have been due to the further transformation of newly formed super-micropores into small mesopores.
From the partial enlarged curves shown in Figure 7, it was obvious that several broad new peaks occurred between diameters of 10 nm and 10 μm, and the main peaks located at 50 nm, 100 nm, 1 μm, 3 μm, and 8 μm. This might be attributed to the dissolution and removal of minerals (such as pyrite, calcite, and kaolinite) in coal after acidification, the size of which ranged from tens of nanometers to hundreds of microns (Brown et al., 2011; Liu S. et al., 2018; Wu et al., 2018). Pores that were partially blocked or occupied by minerals exposed and connected after acidification, thus significantly increasing the volume of large mesopores and macropores. This was consistent with the phenomenon observed during the acid treatment that numerous bubbles emerged from the acid solution, which might be carbon dioxide, hydrogen sulfide or other gases produced by the reaction of minerals with acid. Moreover, Figure 8 shows that 0.55 and 0.85 nm sized micropores played a dominant role in pore area distribution of raw coal samples, which suggested that these two types of pores provided most adsorption sites for CBM. After acidification, the SSA of mesopores and macropores all showed a tendency of increasing. However, compared with micropores, mesopores and macropores contributed a negligibly small portion to the increase of total SSA. Therefore, micropores were still the main contributor to the total SSA of acidified coal samples.
4 Conclusion
In this study, fat coal (PM), meagre coal (LA) and anthracite coal (YM) were collected and acidified with a mixed solution composed of hydrofluoric acid and hydrochloric acid. The structure of micropores, mesopores, and macropores were respectively characterized by LPGA-CO2, LTGA-N2, and MIP methods. Combined with the data corresponding to the best performance interval of the three test methods, the evolution characteristics of varied-sized pore structure under acidification were comprehensively investigated. The following conclusions are drawn:
1) Acid treatment had little effect on the pore shape of the three selected coal samples, but could obviously enhance the pore opening degree, thus improving the pore connectivity. Acid treatment helped to improve the pore diameter diversity, which was mainly attributed to the formation of numerous large mesopores and micron sized macropores.
2) After acidification, the total pore volume and porosity of the three different rank coals all increased significantly, which were mainly contributed by the newly formed large mesopores and macropores, especially the macropores (with an average contribution rate of 74.59%). Acid treatment exhibited the greatest impact on macropores, followed by mesopores, and the smallest on micropores.
3) The change trend of total SSA under acidification was mainly determined by micropores. After acidification, for the coal samples selected in this study, the total SSA of fat coal (PM) was more easily affected by acidification and had the largest percentage increase after acid treatment, followed by anthracite coal (YM), while that of meagre coal (LA) decreased slightly.
4) The total pore volume increment of different rank coals was closely related to the macropore volume increment under acidification, but not obviously related to the coal maturity. Therefore, compared with coal rank, the mineral content in coal might be a more important consideration when measuring the applicability of acidification technology.
Data availability statement
The original contributions presented in the study are included in the article/supplementary material, further inquiries can be directed to the corresponding authors.
Author contributions
Conceptualization, ZS, CY, and PJ; methodology, PJ and FC; validation, JL and JR; data curation, JL and FC; writing—original draft preparation, PJ; writing—review and editing, CY and ZS; supervision, BL; funding acquisition, JL and JR. All authors have read and agreed to the published version of the manuscript.
Funding
This research was financially supported by the National Natural Science Foundation of China (Grant Nos. 41972177 and 42172189); the Doctoral Cultivation Fund Project of Henan University of Engineering (Grant No. Dkj2018013); the Key Scientific Research Projects of Henan Colleges and Universities (Grant No. 22A170007); and the Natural Science Foundation of Henan province (Grant No. 222300420134).
Conflict of interest
Author CY was employed by Institute of Henan Energy and Chemical Industry Group Co., Ltd.
The remaining authors declare that the research was conducted in the absence of any commercial or financial relationships that could be construed as a potential conflict of interest.
Publisher’s note
All claims expressed in this article are solely those of the authors and do not necessarily represent those of their affiliated organizations, or those of the publisher, the editors and the reviewers. Any product that may be evaluated in this article, or claim that may be made by its manufacturer, is not guaranteed or endorsed by the publisher.
References
Brown, P., Jones, T., and BeruBe, K. (2011). The internal microstructure and fibrous mineralogy of fly ash from coal-burning power stations. Environ. Pollut. 159 (12), 3324–3333. doi:10.1016/j.envpol.2011.08.041
Chen, Q., Wang, Q., and Liang, Y. (2021a). Permeability enhancement via acetic acid (CH3COOH) acidizing in coals containing fracture-filling calcite. Energy fuels. 35 (21), 17396–17409. doi:10.1021/acs.energyfuels.1c02199
Chen, S., Xie, K., Shi, Y., Li, Z., Yang, X., and Cai, J. (2021b). Chelating agent-introduced unconventional compound acid for enhancing coal permeability. J. Pet. Sci. Eng. 199, 108270. doi:10.1016/j.petrol.2020.108270
Chen, S., Zhu, Y., Li, W., and Wang, H. (2012). Influence of magma intrusion on gas outburst in a low rank coal mine. Int. J. Min. Sci. Technol. 22 (2), 259–266. doi:10.1016/j.ijmst.2012.03.004
Guo, H., Yuan, L., Cheng, Y., Wang, K., and Xu, C. (2019). Experimental investigation on coal pore and fracture characteristics based on fractal theory. Powder Technol. 346, 341–349. doi:10.1016/j.powtec.2019.02.026
Guo, Z., Cao, Y., Dong, S., and Zhang, Z. (2021). Experimental studies on the enhancement of permeability of anthracite by acidizing: A case study in the daning block, southern qinshui basin. ACS Omega 6 (46), 31112–31121. doi:10.1021/acsomega.1c04539
Jagiello, J., Kenvin, J., Celzard, A., and Fierro, V. (2019). Enhanced resolution of ultra micropore size determination of biochars and activated carbons by dual gas analysis using N2 and CO2 with 2D-NLDFT adsorption models. Carbon 144, 206–215. doi:10.1016/j.carbon.2018.12.028
Jiang, T., Yu, Y., Jahanger, A., and Balsalobre-Lorente, D. (2022). Structural emissions reduction of China's power and heating industry under the goal of “double carbon”: A perspective from input-output analysis. Sustain. Prod. Consum. 31, 346–356. doi:10.1016/j.spc.2022.03.003
Jin, K., Cheng, Y., Liu, Q., Zhao, W., Wang, L., Wang, F., et al. (2016). Experimental investigation of pore structure damage in pulverized coal: Implications for methane adsorption and diffusion characteristics. Energy fuels. 30 (12), 10383–10395. doi:10.1021/acs.energyfuels.6b02530
Li, L., Liu, D., Cai, Y., Wang, Y., and Jia, Q. (2020a). Coal structure and its implications for coalbed methane exploitation: A review. Energy fuels. 35 (1), 86–110. doi:10.1021/acs.energyfuels.0c03309
Li, S., Luo, M., Fan, C., Bi, H., and Ren, Y. (2017). Quantitative characterization of the effect of acidification in coals by NM and low-temperature nitrogen adsorption. J. China Coal Soc. 42 (7), 1748–1756. doi:10.13225/j.cnki.jccs.2016.0929
Li, S., Ni, G., Wang, H., Xun, M., and Xu, Y. (2020b). Effects of acid solution of different components on the pore structure and mechanical properties of coal. Adv. Powder Technol. 31 (4), 1736–1747. doi:10.1016/j.apt.2020.02.009
Li, Y., Song, D., Liu, S., Ji, X., and Hao, H. (2021). Evaluation of pore properties in coal through compressibility correction based on mercury intrusion porosimetry: A practical approach. Fuel 291, 120130. doi:10.1016/j.fuel.2021.120130
Li, Y., Song, D., Liu, S., and Pan, J. (2020c). Characterization of ultramicropores and analysis of their evolution in tectonically deformed coals by low-pressure CO2 adsorption, XRD, and HRTEM techniques. Energy fuels. 34 (8), 9436–9449. doi:10.1021/acs.energyfuels.0c01403
Liu, P., Nie, B., Zhao, Z., Zhao, Y., and Li, Q. (2023). Characterization of ultrasonic induced damage on multi-scale pore/fracture in coal using gas sorption and μ-CT 3D reconstruction. Fuel 332, 126178. doi:10.1016/j.fuel.2022.126178
Liu, S., Ma, J., Sang, S., Wang, T., Du, Y., and Fang, H. (2018a). The effects of supercritical CO2 on mesopore and macropore structure in bituminous and anthracite coal. Fuel 223, 32–43. doi:10.1016/j.fuel.2018.03.036
Liu, X., Song, D., He, X., Wang, Z., Zeng, M., and Deng, K. (2019a). Nanopore structure of deep-burial coals explored by AFM. Fuel 246, 9–17. doi:10.1016/j.fuel.2019.02.090
Liu, Y., Zhu, Y., and Chen, S. (2019b). Effects of chemical composition, disorder degree and crystallite structure of coal macromolecule on nanopores (0.4–150 nm) in different rank naturally-matured coals. Fuel 242, 553–561. doi:10.1016/j.fuel.2019.01.095
Liu, Y., Zhu, Y., Li, W., Zhang, C., and Wang, Y. (2017). Ultra micropores in macromolecular structure of subbituminous coal vitrinite. Fuel 210, 298–306. doi:10.1016/j.fuel.2017.08.069
Liu, Y., Zhu, Y., Liu, S., Chen, S., Li, W., and Wang, Y. (2018b). Molecular structure controls on micropore evolution in coal vitrinite during coalification. Int. J. Coal Geol. 199, 19–30. doi:10.1016/j.coal.2018.09.012
Liu, Z., Liu, D., Cai, Y., and Qiu, Y. (2021). Permeability, mineral and pore characteristics of coals response to acid treatment by NMR and QEMSCAN: Insights into acid sensitivity mechanism. J. Pet. Sci. Eng. 198, 108205. doi:10.1016/j.petrol.2020.108205
Lu, J., Fu, X., Kang, J., Cheng, M., and Wang, Z. (2021). Characterization of full pore and stress compression response of reservoirs with different coal ranks. Front. Earth Sci. (Lausanne). 9. doi:10.3389/feart.2021.764853
Mou, P., Pan, J., Niu, Q., Wang, Z., Li, Y., and Song, D. (2021). Coal pores: Methods, types, and characteristics. Energy fuels. 35 (9), 7467–7484. doi:10.1021/acs.energyfuels.1c00344
Ni, G., Li, S., Rahman, S., Xun, M., Wang, H., Xu, Y., et al. (2020). Effect of nitric acid on the pore structure and fractal characteristics of coal based on the low-temperature nitrogen adsorption method. Powder Technol. 367, 506–516. doi:10.1016/j.powtec.2020.04.011
Qin, L., Li, S., Zhai, C., Lin, H., Zhao, P., Yan, M., et al. (2020). Joint analysis of pores in low, intermediate, and high rank coals using mercury intrusion, nitrogen adsorption, and nuclear magnetic resonance. Powder Technol. 362, 615–627. doi:10.1016/j.powtec.2019.12.019
Tan, Y., Pan, Z., Liu, J., Kang, J., Zhou, F., Connell, L. D., et al. (2018). Experimental study of impact of anisotropy and heterogeneity on gas flow in coal. Part I: Diffusion and adsorption. Fuel 232, 444–453. doi:10.1016/j.fuel.2018.05.173
Thommes, M., and Cychosz, K. A. (2014). Physical adsorption characterization of nanoporous materials: Progress and challenges. Adsorption 20 (2-3), 233–250. doi:10.1007/s10450-014-9606-z
Thommes, M., Kaneko, K., Neimark, A. V., Olivier, J. P., Rodriguez-Reinoso, F., Rouquerol, J., et al. (2015). Physisorption of gases, with special reference to the evaluation of surface area and pore size distribution (IUPAC Technical Report). Pure Appl. Chem. 87 (9-10), 1051–1069. doi:10.1515/pac-2014-1117
Turner, L. G., and Steel, K. M. (2016). A study into the effect of cleat demineralisation by hydrochloric acid on the permeability of coal. J. Nat. Gas. Sci. Eng. 36, 931–942. doi:10.1016/j.jngse.2016.11.003
Wang, H., Cheng, X., Tian, J., Li, T., Wang, W., Pan, J., et al. (2020). Permeability enhancement of low rank coal through acidization using H2S solution: An experimental study in the Kuqa-Bay Coalfield, Xinjiang, China. J. Pet. Sci. Eng. 185, 106476. doi:10.1016/j.petrol.2019.106476
Wang, H., Cheng, Y., Wang, W., and Xu, R. (2014). Research on comprehensive CBM extraction technology and its applications in China's coal mines. J. Nat. Gas. Sci. Eng. 20, 200–207. doi:10.1016/j.jngse.2014.05.025
Wang, H., Fu, X., Jian, K., Li, T., and Luo, P. (2015). Changes in coal pore structure and permeability during N 2 injection. J. Nat. Gas. Sci. Eng. 27, 1234–1241. doi:10.1016/j.jngse.2015.09.068
Wang, Y., Liu, L., Zheng, S., Luo, Z., Sheng, Y., and Wang, X. (2019). Full-scale pore structure and its controlling factors of the Wufeng-Longmaxi shale, southern Sichuan Basin, China: Implications for pore evolution of highly overmature marine shale. J. Nat. Gas. Sci. Eng. 67, 134–146. doi:10.1016/j.jngse.2019.04.020
Wei, Q., Li, X., Zhang, J., Hu, B., Zhu, W., Liang, W., et al. (2019). Full-size pore structure characterization of deep-buried coals and its impact on methane adsorption capacity: A case study of the shihezi formation coals from the panji deep area in huainan coalfield, southern north China. J. Pet. Sci. Eng. 173, 975–989. doi:10.1016/j.petrol.2018.10.100
Wei, Q., Zheng, K., Hu, B., Li, X., Feng, S., Jiang, W., et al. (2021). Methane adsorption capacity of deep-buried coals based on pore structure in the panji deep area of huainan coalfield, China. Energy fuels. 35 (6), 4775–4790. doi:10.1021/acs.energyfuels.0c03800
Wu, H., Gao, X., Wee, H., Ngu, L.-N., Ninomiya, Y., and Wang, Q. (2018). Occurrence and characteristics of abundant fine included mineral particles in Collie coal of Western Australia. Fuel 216, 53–60. doi:10.1016/j.fuel.2017.11.118
Xie, J., Du, H., Chen, S., Sun, X., and Xin, L. (2021). Chemical modification effect of compound solutions of surfactants with acetic acid on coal pores. ACS Omega 6 (51), 35342–35354. doi:10.1021/acsomega.1c04430
Yi, M., Cheng, Y., Wang, C., Wang, Z., Hu, B., and He, X. (2021). Effects of composition changes of coal treated with hydrochloric acid on pore structure and fractal characteristics. Fuel 294, 120506. doi:10.1016/j.fuel.2021.120506
Zhang, J., Li, X., Wei, Q., Sun, K., Zhang, G., and Wang, F. (2017). Characterization of full-sized pore structure and fractal characteristics of marine–continental transitional longtan formation shale of sichuan basin, south China. Energy fuels. 31 (10), 10490–10504. doi:10.1021/acs.energyfuels.7b01456
Zhang, L., Li, Z., Yang, Y., Zhou, Y., Kong, B., Li, J., et al. (2016). Effect of acid treatment on the characteristics and structures of high-sulfur bituminous coal. Fuel 184, 418–429. doi:10.1016/j.fuel.2016.07.002
Keywords: acidification, different rank coals, varied-sized pores, pore structure evolution, gas adsorption, mercury intrusion porosimetry
Citation: Jiang P, Yang C, Chen F, Li B, Ren J, Liu J and Song Z (2023) A comprehensive insight into the effects of acidification on varied-sized pores in different rank coals. Front. Earth Sci. 10:1089957. doi: 10.3389/feart.2022.1089957
Received: 04 November 2022; Accepted: 24 November 2022;
Published: 17 January 2023.
Edited by:
Hongtu Zhang, Henan Polytechnic University, ChinaReviewed by:
Gang Xu, Xi’an University of Science and Technology, ChinaQuangui Li, Chongqing University, China
Copyright © 2023 Jiang, Yang, Chen, Li, Ren, Liu and Song. This is an open-access article distributed under the terms of the Creative Commons Attribution License (CC BY). The use, distribution or reproduction in other forums is permitted, provided the original author(s) and the copyright owner(s) are credited and that the original publication in this journal is cited, in accordance with accepted academic practice. No use, distribution or reproduction is permitted which does not comply with these terms.
*Correspondence: Chengtao Yang, byctat@163.com; Zhimin Song, songzhimin1961@hotmail.com