The Mode of Trench-Parallel Subduction of the Middle Ocean Ridge
 Xiaobing Shen1
  Wei Leng1,2*
- 1Laboratory of Seismology and Physics of Earth’s Interior, School of Earth and Space Sciences, University of Science and Technology of China, Hefei, China
- 2CAS Center for Excellence in Comparative Planetology, Hefei, China
Trench-parallel subduction of mid-ocean ridges occurs frequently in plate motion history, such as along the western boundary of the Pacific plate in the early Cenozoic and along the eastern boundary of the Pacific plate at present. Such subduction may strongly alter the surface topography, volcanic activity and slab morphology in the mantle, whereas few studies have been conducted to investigate its evolutionary process. Here, we construct a 2-D viscoelastoplastic numerical model to study the modes and key parameters controlling trench-parallel subduction of mid-ocean ridges. Our model results show that the subduction modes of mid-ocean ridges can be primarily categorized into three types: the fast spreading mode, the slow spreading mode, and the extinction mode. The key factor controlling these subduction modes is the relative motion between the foregoing and the following oceanic plates, which are separated by the mid-ocean ridge. Different subduction modes exert different surface geological expressions, which may explain specific evolutionary processes related to mid-ocean ridge subduction, such as topographic deformation and the eruption gap of volcanic rocks in East Asia within 55–45 Ma and in the western North American plate during the late Cenozoic.
Introduction
A mid-ocean ridge (MOR) is a divergent boundary of plate tectonics where new plates are continuously generated (Turcotte and Schubert, 2002). Although MORs are generally located at the centers of ocean basins, such as the present mid-Atlantic ridge, they may subduct into the deep mantle when tectonic environments cause MORs to move to ocean trenches (Georgieva et al., 2019). Typical examples include the subducted MOR between the Izanagi plate and the Pacific plate, which subducted at 55–45 Ma (Müller et al., 2016) and the subducted MOR between the Farallon plate and the Pacific plate, which subducted at 30–0 Ma (Ferrari et al., 2018). According to the contact angle between the MOR and the trench, MOR subduction can be divided into high-angle (trench-vertical) subduction and low-angle (trench-parallel) subduction (Wu and Wu, 2019).
Different methods of MOR subduction may cause different evolutionary pathways and surface expression. On the one hand, for trench-vertical MOR subduction, large-scale MORB-like igneous rocks erupt at the intersections between MORs and trenches, which have a small influence range but a long duration. Symmetrical igneous rock sequences, such as adakite-granitoid-adakite sequences, along the MOR are formed on the overriding plate (Ling et al., 2009; Isozaki et al., 2010). Analog model experiments further show that ridge subduction has a strong impact on the accumulation and migration of the accretionary wedge and the shape of the subduction zone edge (Wang et al., 2019). On the other hand, for trench-parallel MOR subduction, large-scale MORB-like igneous rocks erupt at the trench, which has a large influence range but a relatively short duration (Gutiérrez et al., 2005; Müller et al., 2016; Liu et al., 2020). For instance, early Cenozoic MORB bedrocks have also been found in Hokkado, Japan (Maeda and Kagami, 1996; Nanayama et al., 2019). The seafloor age can also affect the local morphology of the slab (Hu et al., 2016).
Many numerical studies have focused on the subduction evolution of a continuous oceanic plate (e.g., Gurnis and Hager, 1988; Christensen, 1996; Torii and Yoshioka, 2007; Čížková and Bina, 2013; Garel et al., 2014; King et al., 2015; Yang et al., 2018), whereas only a few studies have been conducted on MOR subduction at plate boundaries. Trench-vertical aseismic ridge subduction can affect the slab geometry and the deformation of the overriding continental plate based on analog model results (Martinod et al., 2013). Specifically, aseismic ridge subduction can provide extra buoyancy to reduce the dip angle of the slab, such as flat slab subduction beneath the South American plate (van Hunen et al., 2002; Gutiérrez et al., 2005; Rosenbaum et al., 2005; Espurt et al., 2008; Hu et al., 2016). Furthermore, when an active ridge subducts into the mantle, a slab window forming strong magmatism can be generated (Li et al., 2020). Groome and Thorkelson, (2009) showed that the slab window migrates with the subduction of an active ridge. Moreover, the spreading velocity and cooling age of ridges have a strong influence on ridge-inversed subduction (Qing et al., 2021). Burkett and Billen (2009) suggested that the change in buoyancy of the weakened zone of lithosphere close to the MOR causes the slab detachment from the subducting plates. The morphology of the MOR is affected by the MOR spreading speed (Püthe and Gerya, 2014). Overall, since much attention has been given to MOR subduction, the specific mode of trench-parallel subduction of the MOR needs to be thoroughly analyzed.
MOR subduction along the western boundary of the Pacific plate in the early Cenozoic and along the eastern boundary of the Pacific plate at present is primarily viewed as trench-parallel (Seton et al., 2015; Müller et al., 2016; Tang et al., 2018; Liu et al., 2020). In this study, we focus on the different modes of trench-parallel MOR subduction and the related key controlling parameters. Specifically, the pulling force from the slab connecting to the foregoing oceanic plate and the motion of the following oceanic plate may play important roles in MOR subduction. The initial dip angle of the slab and the viscosity structure of the mantle also affect the plate movement. Therefore, we investigate the effects of foregoing slab length, the following plate speed, the initial dip angle of the slab and the viscosity structure of the mantle on the modes of MOR subduction and analyze the surface expression, including the topography and volcanic activity, on the overriding plate.
Methods
We construct a 2-D Cartesian viscoelastoplastic model to study the evolution of plate movement during MOR subduction based on the finite element method. We use the Ellipsis approach (Moresi et al., 2003) to solve the governing equations of mass, momentum and energy. The movement and deformation of the lithosphere and mantle are tracked by Lagrangian particles (Moresi et al., 2003; Leng and Gurnis, 2015; Chen et al., 2020).
An incompressible Maxwell material body is used to describe the viscoelasticity of the model composition. The deformation rate of the material composition is described by the viscous part and elastic part:
where
The viscosity equation we use is non-Newtonian and is temperature- and depth-dependent (Karato and Wu, 1993):
where
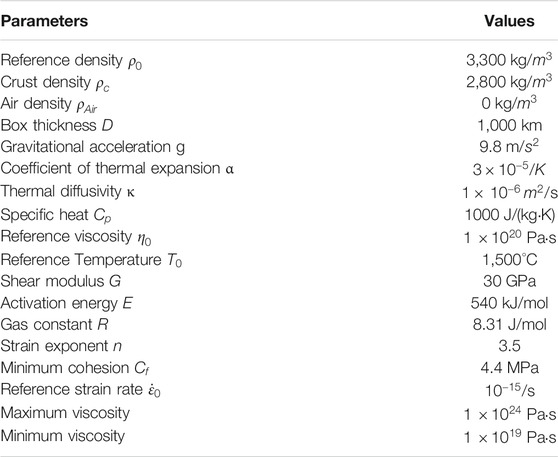
TABLE 1. Physical parameters in the model.
The plasticity of the material is applied with the Drucker-Prager criterion through the yield stress:
where
where
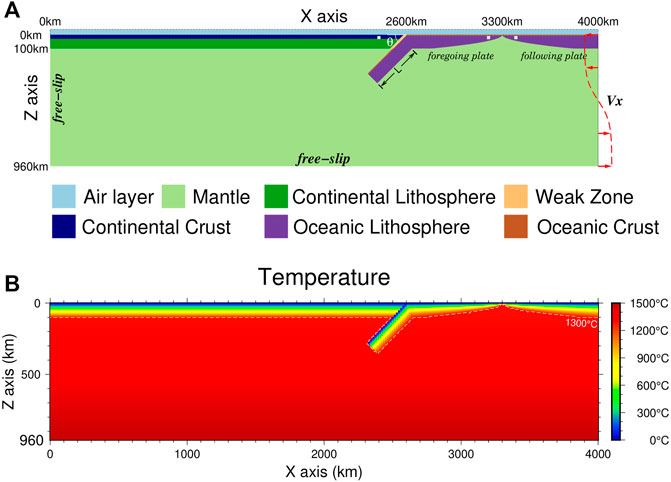
FIGURE 1. Model initial setting and boundary conditions. (A) The 2-D model is 4,000
Our 2-D Cartesian model has a length of 4,000 km and a depth of 1,000 km (Figure 1). To simulate the top free-surface boundary, we set a sticky air layer 40 km thick at the top with zero density and minimum viscosity (Leng and Gurnis, 2011, 2015; Chen et al., 2020). The grid of our model is 513
The upper, lower and left boundaries of the model are all set as free-slip boundary conditions, while at the right boundary, we impose a velocity boundary condition. A
We divide the lithosphere into three parts in the model, i.e., the continental plate (x = 0–2,600 km), the foregoing oceanic plate (x = 2,600–3,300 km) and the following oceanic plate (x = 3,300–4,000 km) (Figure 1A). For the continental plate, the thickness of the lithosphere is 100 km with a 30-km thick crust. The initial temperature field of the continental lithosphere increases linearly from the surface to the bottom (Figure 1B). For the foregoing and following oceanic plates, the oceanic crust thickness is 7 km. The density of the continental and oceanic crust is 2,800
where
We use a simple model to estimate the mantle melting extent (Katz et al., 2003). The degree of mantle melting
where T is the temperature,
For the water content part, we consider that the mantle area within 60 km above the slab surface is wet, and the water content of this layer is assumed to be 0.3% (Rüpke et al., 2004; Leng et al., 2012).
Results
The slab morphology is mainly affected by ridge push, slab pull, friction resistance, cohesion, among which the ridge push and slab pull force are the two main driving forces (Turcotte and Schubert, 2002). The slab pull force increases with the slab length. The imposed velocity is the main driving force of the following plate motion. So we run a total of 46 cases (Table 2) to study the effects of the initial slab length, imposed velocity, initial subduction angle and mantle viscosity structure on the evolution of trench-parallel MOR subduction. The initial length of the slab varies in the range of 200–800 km; the imposed velocity varies in the range of 1–10 cm/yr; the subduction angles are 30°, 45°, and 60°, respectively; and the depth-dependent viscosity structure includes the ViscT viscosity structure and ViscT&D viscosity structure, as indicated in the Methods section. We placed sampling points in the lithosphere of the foregoing and following oceanic plates to detect the relative motion of the two oceanic plates. To quantify the relative motion between the foregoing and following oceanic plates, we define the velocity difference
where
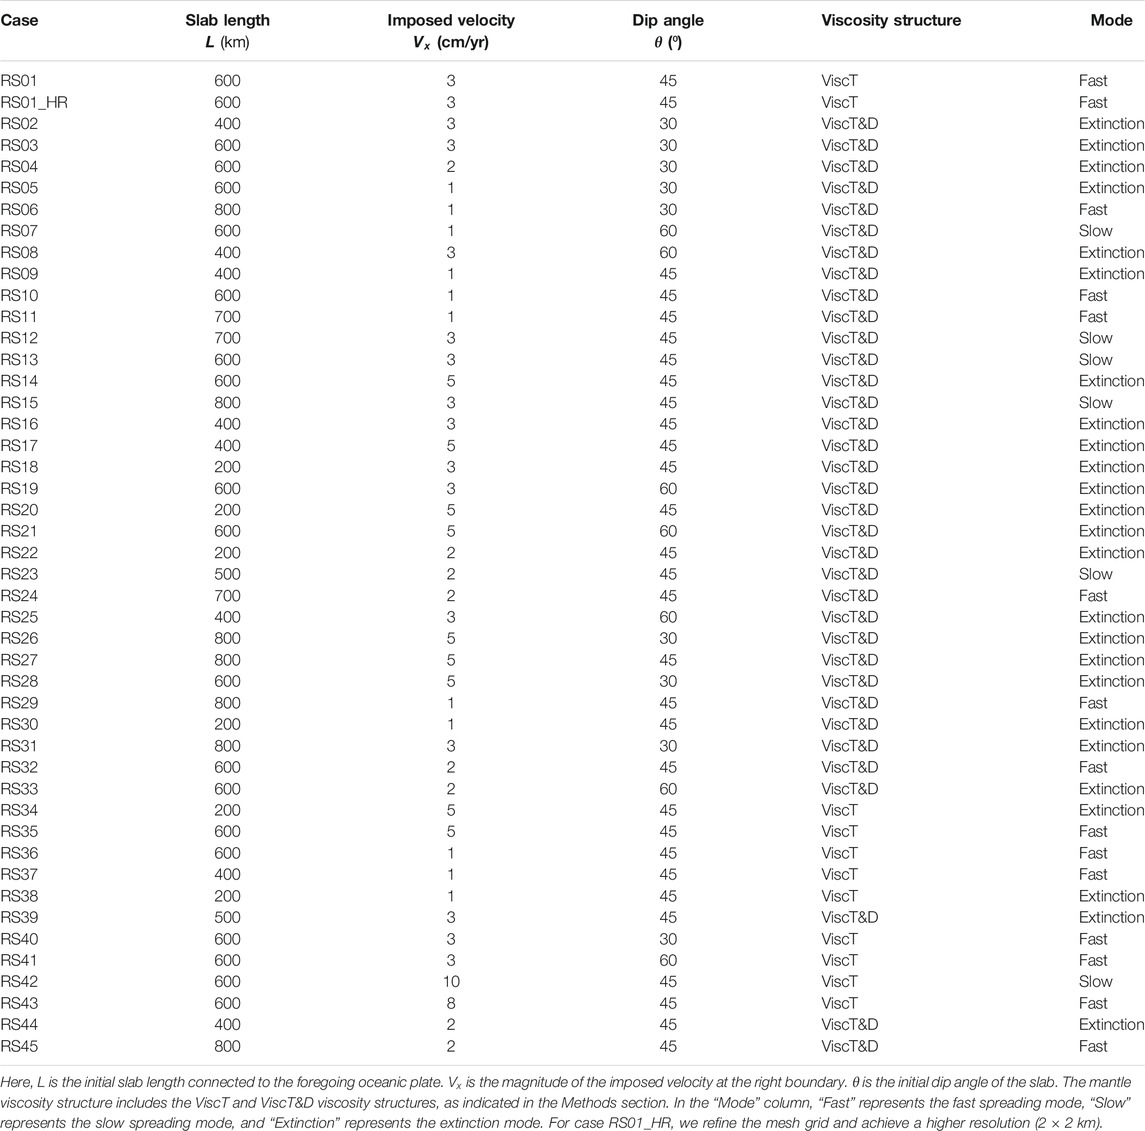
TABLE 2. Case parameters and resulting modes of MOR subduction.
By analyzing and comparing all the model results, we divide the trench-parallel subduction of the MOR into three modes: 1) In the fast spreading mode, where the
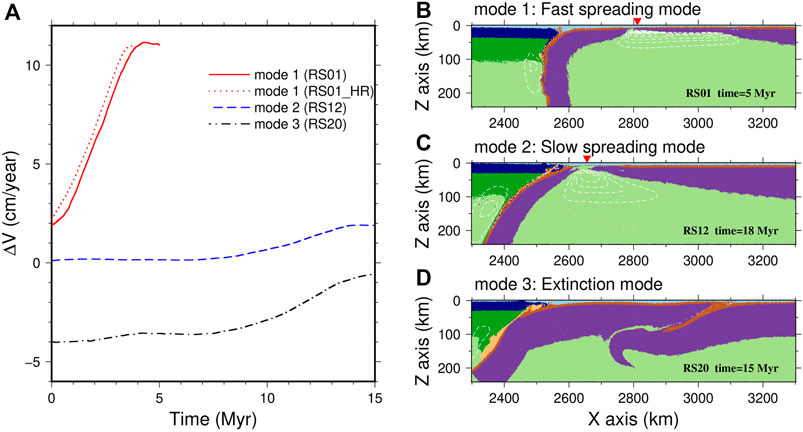
FIGURE 2. (A) Time evolution of
According to the results of the model, the main factor controlling the subduction of the following plate is the imposed velocity
The Fast Spreading Mode
Case RS01 represents a typical example of the fast spreading mode of MOR trench-parallel subduction. In this case, the length of slab L, the imposed velocity
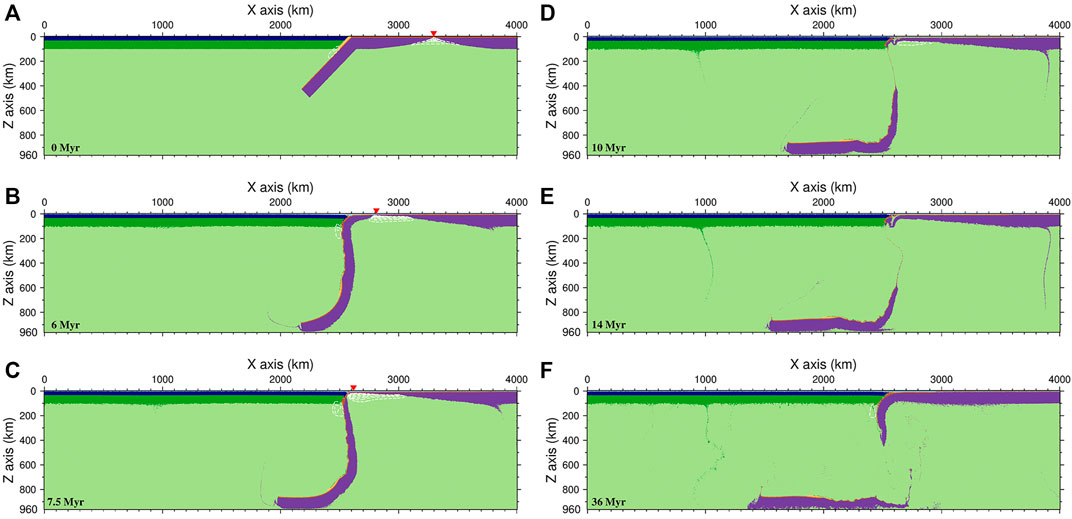
FIGURE 3. Model evolution of case RS01 (L = 600 km,
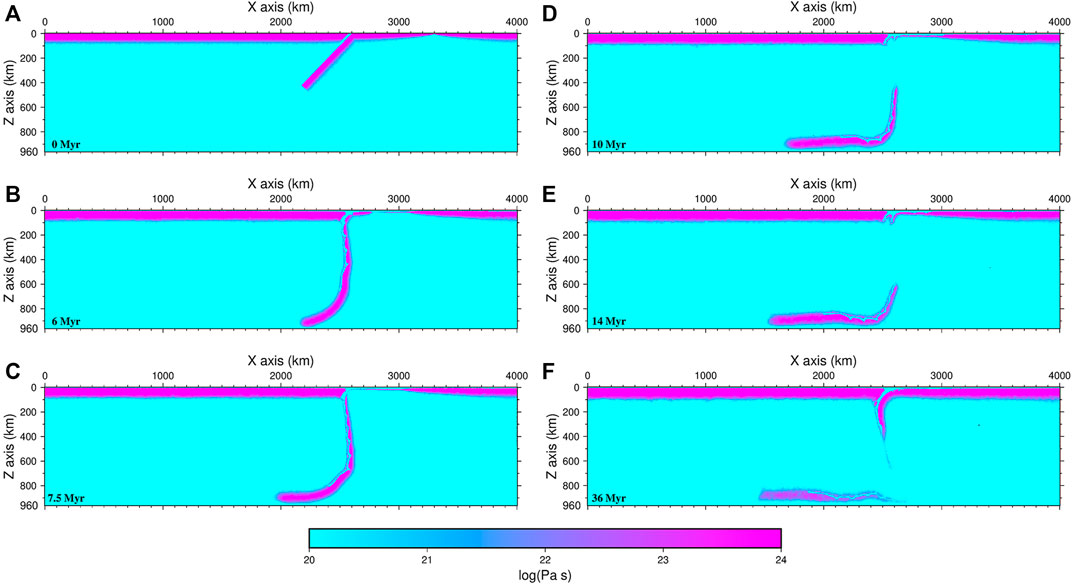
FIGURE 4. The viscosity structure for case RS01 (L = 600 km,
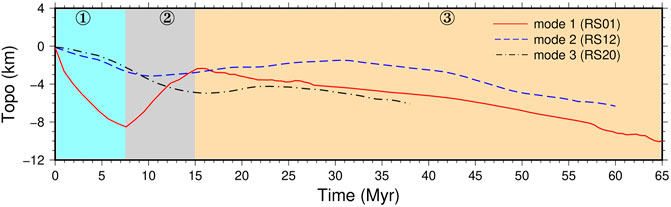
FIGURE 5. Time evolution of the topography on the overriding continental plate for case RS01 (the fast spreading mode), case RS12 (the slow spreading mode) and case RS20 (the extinction mode). Three different background colors show the three stages for case RS01 of the fast spreading mode. Stage 1 is 0–7.5 Myrs, when the foregoing oceanic plate subducts into the mantle; stage 2 is 7.5–14 Myrs, when the MOR subducts; stage 3 is 14–65 Myrs, when the following oceanic plate subducts into the mantle.
In this case, the speed of the foregoing oceanic plate is much faster than that of the following oceanic plate; therefore, the MOR (the red inverted triangle in Figures 3B,C) has always been at the right boundary of the foregoing oceanic plate and moved forward with the foregoing oceanic plate. The rapidly expanding area between the MOR and the following oceanic plate is filled by the newly formed oceanic plate (Figures 3B, 4B, X = 2,800–3,100 km). The thickness of the newly formed oceanic plate is relatively thin because of the rapid extension of this area.
At 7.5 Myrs (Figures 3C, 4C), the foregoing oceanic plate has completely subducted into the mantle. The front segment of the following oceanic plate starts to contact the continental plate, marking the beginning of the subduction of the MOR. The buoyant MOR was strongly compressed with the overriding continental plate during the subduction process, resulting in a significant uplift of the continental plate near the trench (the red line in Figure 5, 7.5–14 Myrs). With the subduction of the MOR and the continuous forward movement of the following oceanic plate, the melting area of the mantle below the MOR gradually cools down, and the degree of melting decreases until melting disappears (Figures 3C–E).
From 10 to 14 Myrs (Figures 3D,E, 4D,E), the following oceanic plate starts to subduct, generating a new subduction zone. The thickness of the newly formed oceanic plate by the rapid expansion of the MOR is small, and the strength of the plate is weak; therefore, under the dual effect of the continuous compression of the following ocean plate and the obstruction of the front continental plate, the newly formed thin oceanic plate near the trench ruptures and gradually forms a new subduction (Figures 3E, 4E).
After 36 Myrs, a new subduction zone eventually forms. Mantle wedge melting resumes due to water transport from the following oceanic plate (Figures 3F, 4F). The continuous subduction of the following oceanic plate since 14 Myrs also results in the continuous reduction in the topography of the continental plate near the trench (the red line in Figure 5, 14–60 Myrs). During active MOR subduction, a gap of melting events and rapid topographic uplift occurs on the overriding continental plate. This melting gap divides the igneous events on the overriding plate into two separate periods.
The Slow Spreading Mode
Case RS12 is a typical case of the slow spreading mode, which has the same parameters as case RS01 except that the viscosity structure becomes a ViscT&D viscosity profile and the slab length increases to 700 km. Similar to case RS01, the foregoing oceanic plate in case RS12 continuously subducts due to slab pull. However, because of the change in the viscosity structure, the mantle resistance to the subducted plate increases, resulting in the decreased velocity of the foregoing oceanic plate. Therefore, the expansion of the MOR between the foregoing and following oceanic plates becomes slow, and the melting region of mantle beneath the MOR maintains a triangular shape (Figures 6A,B). Similar to case RS01, the topography on the continental plate near the trench also continuously decreases due to the subduction of the foregoing oceanic plate, except that the magnitude of the topography change is much smaller than that in case RS01 (the blue dashed line in Figure 5). At 18 Myrs (Figure 6B), the foregoing oceanic plate completely subducts into the mantle, and the MOR begins to contact the continental plate. Correspondingly, the topography of the overriding continental plate begins to rise due to the subduction of the buoyant MOR. Nevertheless, unlike case RS01, the newly formed oceanic plate is relatively thick and strong, and no fractures or distortions are observed during the formation of the new subduction zone (Figures 6C,D). With the continuous subduction of the following oceanic plate, the topography of the overriding continental plate changes from uplift to subsidence (the blue dashed line in Figure 5). The melting in case RS12 also experiences a gap during MOR subduction (Figures 6C,D), which divides the surface volcanism into two time periods.
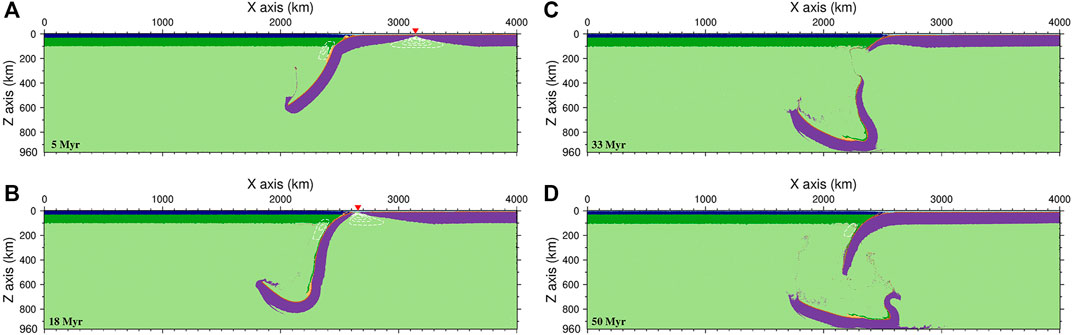
FIGURE 6. Model evolution of case RS12 (L = 700 km,
The Extinction Mode
Case RS20 represents a typical example of the extinction mode (Figure 7). In this case, the length of slab L, the imposed velocity
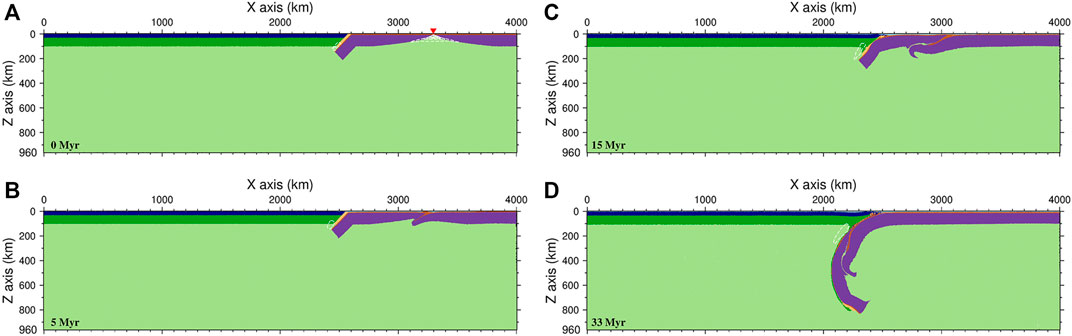
FIGURE 7. Model evolution of case RS20 (L = 200 km,
The subduction of the extinct MOR does not show a melting gap, as in case RS01 and case RS12 (Figure 7). The topography of the overriding plate has experienced continuous subsidence, and only a slight uplift occurs during the collision between the coupled region and the overriding plate (the black dotted-dashed line in Figure 5).
The Role of Slab Length (L) and the Imposed Velocity (
The negative buoyancy of the slab connecting to the foregoing oceanic plate and the imposed velocity at the right boundary are the key driving factors for MOR subduction. We investigate the effects of different L and
We run three cases (RS22, RS23 and RS24) with the same
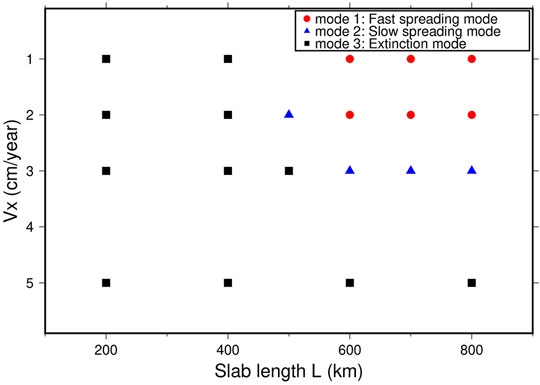
FIGURE 8. Influences of the slab length L and the imposed velocity
On the other hand, we fix the slab length L to 600 km and vary the imposed velocity
The Role of Other Parameters
Using case RS01 as a reference case, we refine the grid of our model to achieve a resolution of 2.0 km in both the horizontal and vertical directions. The results show that there is only a small difference from the previous model (Figure 2A). Then, we test the influence of the initial dip angle of the slab and the initial viscosity structure profile of the model on MOR subduction (cases RS02, RS03, RS04, RS05, RS06, RS07, RS08, RS19, RS21, RS25, RS26, RS28, RS31, RS33, RS34, RS35, RS36, RS37, RS38, RS40, RS41, RS42 and RS43). Cases RS40 and RS41 have the same parameters as case RS01 except that the initial dip angle
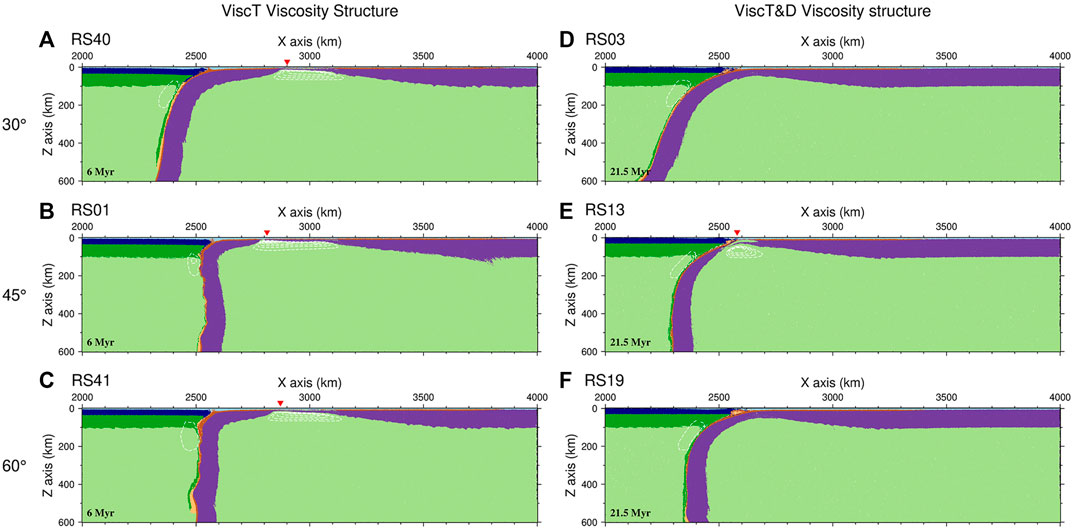
FIGURE 9. The effects of different initial slab dip angles
We then vary the mantle viscosity structure between ViscT and ViscT&D and run case RS58. Cases RS01 and RS58 have the same parameters except for the initial viscosity structure. Since the change in the viscosity structure significantly affects the sinking velocity of the slab, the subduction mode of the MOR changes from the fast spreading mode (case RS01, Figure 9B) to the slow spreading mode (case RS58, Figure 9E). For the initial dip angle
Discussion
Implications for the Subduction of the Eastern and Western Ridges of the Pacific Plate
From our model results, for the fast-spreading subduction and slow-spreading modes, igneous rock event gaps and rapid topographic uplift on the overriding continental plate occur during active MOR subduction. Two typical subduction events of MORs are the subduction of the Western Pacific ridge (Izanagi-Pacific MOR) in the Late Cretaceous (Müller et al., 2016) and the subduction of the Eastern Pacific ridge (Pacific-Farallon MOR) from 30 Ma to the present (Ferrari et al., 2018).
The Izanagi-Pacific MOR that subducted toward the eastern Eurasian lithosphere underwent trench-parallel subduction at 55–43 Ma, as shown in Figure 10A (Müller et al., 2016). During the Late Cretaceous, the velocity of the Izanagi plate was 20 cm/yr, which was much larger than that of the Pacific plate moving at a speed of 7 cm/yr on the other side of the MOR (Wu and Wu, 2019). Similar to the model of the fast spreading mode, the velocity difference
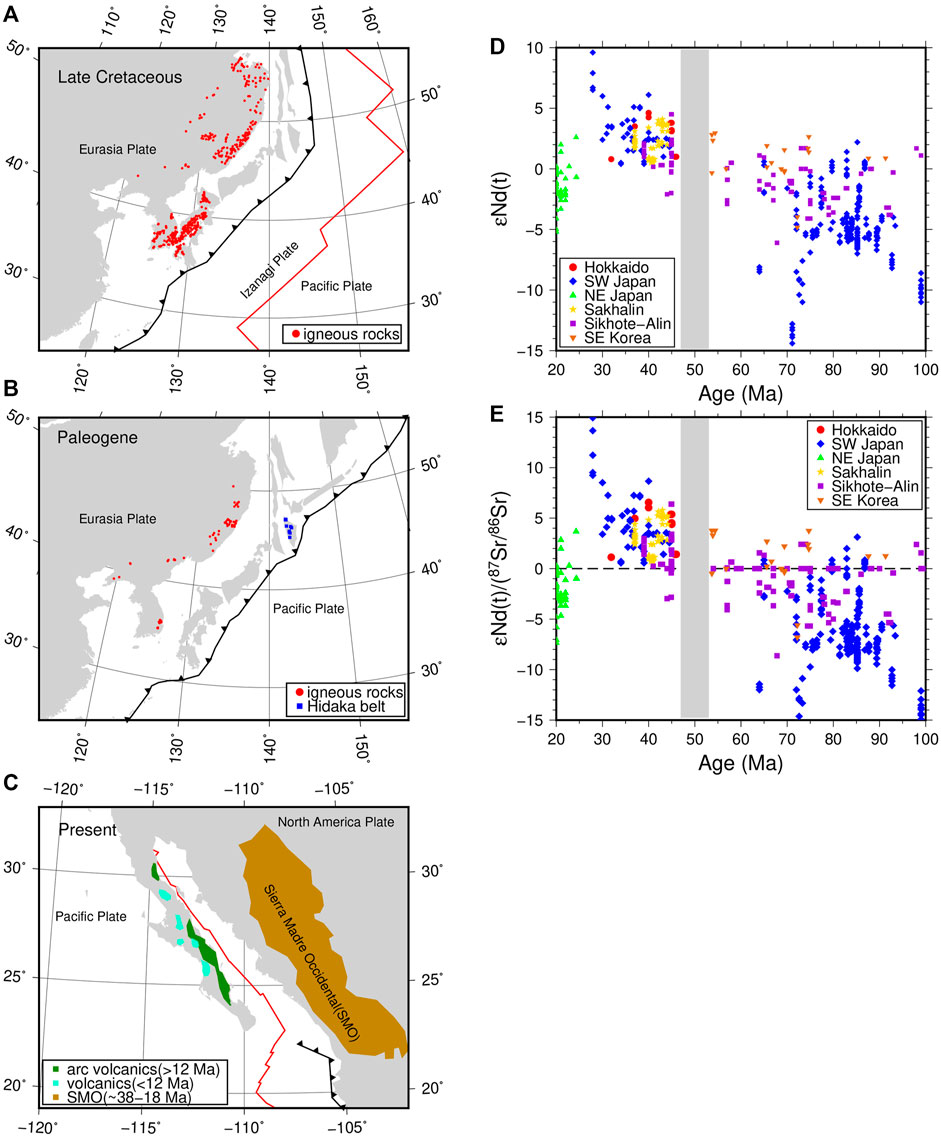
FIGURE 10. Reconstructed model of the NE Eurasian plate and the West American plate and the
On the other side of the Pacific plate, East Pacific ridge subduction began at 30 Ma and has continued to the present. The MOR has not yet fully subducted into the North American plate. We can observe that the East Pacific ridge is approximately parallel to the subduction zone (Figure 10C). In this period, the Sierra Madre Occidental silicic large igneous province with crustal melting and the Comondú Group of Baja California were formed, and resulting mafic magmas are widely distributed in western North America (Ferrari et al., 2018). However, the age of the subduction-related igneous rocks since 24 Ma can be divided into two stages (24–12 Ma and 12 Ma–present) (Figure 10C). There is also a short gap in the subduction-related igneous rocks at approximately 12 Ma (Martı́n et al., 2000; Pallares et al., 2007).
The magmatic activity gap in East Asia is longer than that in western North America (Figures 10A–C). We think it probably has two factors: the dip angle of the slab and the MOR subduction pattern, whether it is monolithic or segmented. The Western Pacific plate subducted under the East Asian plate at a high dip angle, caused strong backarc expansion, and formed a series of extensional basins on the edge of East Asia (e.g., Japan sea basin and Philippine basin). It maked the East Asian continent far away from the trench. The igneous rocks produced by oceanic plate subduction need a long time to migrate to the East Asian continent. As for the Farallon plate, it subducted under the North American plate with a low dip angle, and did not form extensional basins. In addition, the Izanagi-Pacific MOR is roughly parallel to the edge of the East Asian plate. The Izanagi-Pacific MOR subduction as a monolithic in a short period of time (within a few million years), while there was a small angle between the Farallon-Pacific MOR and the North American plate boundary. So the Farallon-Pacific MOR gradually subducted in segments. And the MOR subduction lasted for a long time (more than ten million years). This situation caused the lateral magmatic flow and resulted in a short igneous events gap.
Plate Coupling and Thickening in the Extinction Mode
From the results of the extinction mode, when the speed of the foregoing oceanic plate is much smaller than that of the following oceanic plate, the latter may be coupled with the foregoing oceanic plate. The extinction of the original MOR forms a new plate with a thickened coupling region, and the thickness of the coupling region can reach 150 km (Figures 7C,D). Therefore, the coupling region can be clearly distinguished from the normal thickness of the oceanic plate by seismic methods. Since the geological sequence of the coupling region is crust-lithosphere-crust-lithosphere (Figure 7C), the seismic waveform of this region can be relatively complicated. Moreover, the high temperature and high pressure applied to the coupled crustal region may generate metamorphic rocks and ophiolites, e.g., the Palawan ophiolite (Keenan et al., 2016). Due to the extinction of the active MOR, the following oceanic plate follows the foregoing oceanic plate to form continuous subduction. Therefore, a melting gap will not appear in the mantle wedge (Figures 7B–D). Continuous oceanic plate subduction causes continuous subsidence of the overriding continental plate topography (Figure 5).
The Shape and Mode of the MOR Subduction
Based on our results, the velocity difference
Nevertheless, previous studies have shown that many of the MORs are not completely parallel to the trench (Van Hunen et al., 2002; Gutiérrez et al., 2005; Rosenbaum et al., 2005; Espurt et al., 2008; Seton et al., 2015; Hu et al., 2016; Müller et al., 2016; Tang et al., 2018; Liu et al., 2020). The nonparallel subduction of MORs or asymmetric ridges may show different temporal and spatial distributions of igneous events and topographic evolution on the overriding plate. For these situations, our 2-D model has limitations, and 3-D models are required in future studies.
Conclusion
We construct a 2-D viscoelastoplastic model to study the modes and key parameters controlling the trench-parallel subduction of the mid-ocean ridge. Our model results show that the subduction modes of mid-ocean ridges can be primarily categorized into three types: the fast spreading mode, the slow spreading mode, and the extinction mode. The key factor controlling these subduction modes is the relative motion between the foregoing and following oceanic plates, which are separated by the mid-ocean ridge. The viscosity structure of the mantle significantly affects the sinking velocity of the preceding slab; therefore, the mantle viscosity structure may greatly affect the mode of trench-parallel subduction of the MOR. The volcanic gap and the topographic evolution observed in our model may successfully explain the geological observations for the subduction of the Izanagi-Pacific ridge at 55–45 Ma and the Pacific-Farallon ridge from 30 Ma to the present.
Data Availability Statement
The raw data supporting the conclusion of this article will be made available by the authors, without undue reservation.
Author Contributions
XS and WL contributed to conception and design of the study. XS and WL designed the model. XS ran the model and analyzed the results. XS wrote the first draft of the manuscript. All authors contributed to manuscript revision, read, and approved the submitted version.
Funding
This work is supported by the National Natural Science Foundation of China (41820104004, 41774105, 41688103) and the Fundamental Research Funds for the Central Universities (WK2080000144).
Conflict of Interest
The authors declare that the research was conducted in the absence of any commercial or financial relationships that could be construed as a potential conflict of interest.
Publisher’s Note
All claims expressed in this article are solely those of the authors and do not necessarily represent those of their affiliated organizations, or those of the publisher, the editors and the reviewers. Any product that may be evaluated in this article, or claim that may be made by its manufacturer, is not guaranteed or endorsed by the publisher.
Acknowledgments
We thank Jie Tang for providing igneous rock data in northeast Eurasia.
References
Buck, W. R., and Poliakov, A. N. B. (1998). Abyssal hills Formed by Stretching Oceanic Lithosphere. Nature 392 (6673), 272–275. doi:10.1038/32636
Burkett, E. R., and Billen, M. I. (2009). Dynamics and Implications of Slab Detachment Due to ridge‐trench Collision. J. Geophys. Res. Solid Earth 114, B12402. doi:10.1029/2009jb006402
Chen, M., Shen, X., Leng, W., and Chen, L. (2020). Destruction of Cratonic Lithosphere Induced by Oceanic Subduction Initiation. Geophys. Res. Lett. 47 (15), e2020GL089140. doi:10.1029/2020GL089140
Christensen, U. R. (1996). The Influence of Trench Migration on Slab Penetration into the Lower Mantle. Earth Planet. Sci. Lett. 140 (1-4), 27–39. doi:10.1016/0012-821x(96)00023-4
Čížková, H., and Bina, C. R. (2013). Effects of Mantle and Subduction-Interface Rheologies on Slab Stagnation and Trench Rollback. Earth Planet. Sci. Lett. 379, 95–103. doi:10.1016/j.epsl.2013.08.011
Čížková, H., van den Berg, A. P., Spakman, W., and Matyska, C. (2012). The Viscosity of Earth’s Lower Mantle Inferred from Sinking Speed of Subducted Lithosphere. Phys. earth Planet. Interiors 200, 56–62. doi:10.1016/j.pepi.2012.02.010
Espurt, N., Funiciello, F., Martinod, J., Guillaume, B., Regard, V., Faccenna, C., et al. (2008). Flat Subduction Dynamics and Deformation of the South American Plate: Insights from Analog Modeling. Tectonics 27 (3), TC3011. doi:10.1029/2007tc002175
Ferrari, L., Orozco-Esquivel, T., Bryan, S. E., López-Martínez, M., and Silva-Fragoso, A. (2018). Cenozoic Magmatism and Extension in Western Mexico: Linking the Sierra Madre Occidental Silicic Large Igneous Province and the Comondú Group with the Gulf of California Rift. Earth-Science Rev. 183, 115–152. doi:10.1016/j.earscirev.2017.04.006
Garel, F., Goes, S., Davies, D. R., Davies, J. H., Kramer, S. C., and Wilson, C. R. (2014). Interaction of Subducted Slabs with the Mantle Transition‐zone: A Regime Diagram from 2‐D Thermo‐mechanical Models with a mobile Trench and an Overriding Plate. Geochem. Geophys. Geosyst. 15 (5), 1739–1765. doi:10.1002/2014gc005257
Georgieva, V., Gallagher, K., Sobczyk, A., Sobel, E. R., Schildgen, T. F., Ehlers, T. A., et al. (2019). Effects of Slab-Window, Alkaline Volcanism, and Glaciation on Thermochronometer Cooling Histories, Patagonian Andes. Earth Planet. Sci. Lett. 511, 164–176. doi:10.1016/j.epsl.2019.01.030
Groome, W. G., and Thorkelson, D. J. (2009). The Three-Dimensional Thermo-Mechanical Signature of ridge Subduction and Slab Window Migration. Tectonophysics 464 (1-4), 70–83. doi:10.1016/j.tecto.2008.07.003
Gurnis, M., and Hager, B. H. (1988). Controls of the Structure of Subducted Slabs. Nature 335 (6188), 317–321. doi:10.1038/335317a0
Gutiérrez, F., Gioncada, A., Ferran, O. G., Lahsen, A., and Mazzuoli, R. (2005). The Hudson Volcano and Surrounding Monogenetic Centres (Chilean Patagonia): an Example of Volcanism Associated with ridge–trench Collision Environment. J. Volcanology Geothermal Res. 145 (3-4), 207–233. doi:10.1016/j.jvolgeores.2005.01.014
Hu, J., Liu, L., Hermosillo, A., and Zhou, Q. (2016). Simulation of Late Cenozoic South American Flat-Slab Subduction Using Geodynamic Models with Data Assimilation. Earth Planet. Sci. Lett. 438, 1–13. doi:10.1016/j.epsl.2016.01.011
Isozaki, Y., Aoki, K., Nakama, T., and Yanai, S. (2010). New Insight into a Subduction-Related Orogen: A Reappraisal of the Geotectonic Framework and Evolution of the Japanese Islands. Gondwana Res. 18 (1), 82–105. doi:10.1016/j.gr.2010.02.015
Karato, S.-i., and Wu, P. (1993). Rheology of the Upper Mantle: A Synthesis. Science 260 (5109), 771–778. doi:10.1126/science.260.5109.771
Katz, R. F., Spiegelman, M., and Langmuir, C. H. (2003). A New Parameterization of Hydrous Mantle Melting. Geochem. Geophys. Geosystems 4 (9), 1–9. doi:10.1029/2002gc000433
Keenan, T. E., Encarnación, J., Buchwaldt, R., Fernandez, D., Mattinson, J., Rasoazanamparany, C., et al. (2016). Rapid Conversion of an Oceanic Spreading center to a Subduction Zone Inferred from High-Precision Geochronology. Proc. Natl. Acad. Sci. USA 113 (47), E7359–E7366. doi:10.1073/pnas.1609999113
King, S. D., Frost, D. J., and Rubie, D. C. (2015). Why Cold Slabs Stagnate in the Transition Zone. Geology 43 (3), 231–234. doi:10.1130/g36320.1
Leng, W., Gurnis, M., and Asimow, P. (2012). From Basalts to Boninites: The Geodynamics of Volcanic Expression during Induced Subduction Initiation. Lithosphere 4 (6), 511–523. doi:10.1130/l215.1
Leng, W., and Gurnis, M. (2011). Dynamics of Subduction Initiation with Different Evolutionary Pathways. Geochem. Geophys. Geosystems 12 (12), Q12018. doi:10.1029/2011gc003877
Leng, W., and Gurnis, M. (2015). Subduction Initiation at Relic Arcs. Geophys. Res. Lett. 42 (17), 7014–7021. doi:10.1002/2015gl064985
Li, S. M., Wang, Q., Zhu, D. C., Cawood, P. A., Stern, R. J., Weinberg, R., et al. (2020). Reconciling Orogenic Drivers for the Evolution of the Bangong‐Nujiang Tethys during Middle‐Late Jurassic. Tectonics 39 (2), e2019TC005951. doi:10.1029/2019TC005951
Ling, M.-X., Wang, F.-Y., Ding, X., Hu, Y.-H., Zhou, J.-B., Zartman, R. E., et al. (2009). Cretaceous ridge Subduction along the Lower Yangtze River belt, Eastern China. Econ. Geology. 104 (2), 303–321. doi:10.2113/gsecongeo.104.2.303
Liu, K., Zhang, J., Xiao, W., Wilde, S. A., and Alexandrov, I. (2020). A Review of Magmatism and Deformation History along the NE Asian Margin from Ca. 95 to 30 Ma: Transition from the Izanagi to Pacific Plate Subduction in the Early Cenozoic. Earth-Science Rev. 209, 103317. doi:10.1016/j.earscirev.2020.103317
Maeda, J. I., and Kagami, H. (1996). Interaction of a Spreading ridge and an Accretionary Prism: Implications from MORB Magmatism in the Hidaka Magmatic Zone, Hokkaido, Japan. Geol 24 (1), 31–34. doi:10.1130/0091-7613(1996)024<0031:ioasra>2.3.co;2
Martinod, J., Guillaume, B., Espurt, N., Faccenna, C., Funiciello, F., and Regard, V. (2013). Effect of Aseismic ridge Subduction on Slab Geometry and Overriding Plate Deformation: Insights from Analogue Modeling. Tectonophysics 588, 39–55. doi:10.1016/j.tecto.2012.12.010
Martı́n, A., Fletcher, J. M., López-Martı́nez, M., and Mendoza-Borunda, R. (2000). Waning Miocene Subduction and Arc Volcanism in Baja California: the San Luis Gonzaga Volcanic Field. Tectonophysics 318 (1-4), 27–51.
Moresi, L., Dufour, F., and Mühlhaus, H.-B. (2003). A Lagrangian Integration point Finite Element Method for Large Deformation Modeling of Viscoelastic Geomaterials. J. Comput. Phys. 184 (2), 476–497. doi:10.1016/s0021-9991(02)00031-1
Muhuri, S. K., Dewers, T. A., Scott, T. E., and Reches, Z. E. (2003). Interseismic Fault Strengthening and Earthquake-Slip Instability: Friction or Cohesion? Geol 31 (10), 881–884. doi:10.1130/g19601.1
Müller, R. D., Seton, M., Zahirovic, S., Williams, S. E., Matthews, K. J., Wright, N. M., et al. (2016). Ocean basin Evolution and Global-Scale Plate Reorganization Events since Pangea Breakup. Annu. Rev. Earth Planet. Sci. 44, 107–138. doi:10.1146/annurev-earth-060115-012211
Nanayama, F., Yamasaki, T., Iwano, H., Danhara, T., and Hirata, T. (2019). Zircon U-Pb Ages of Sedimentary Complexes in the Hidaka Belt. Jour. Geol. Soc. Jpn. 125 (6), 421–438. doi:10.5575/geosoc.2019.0011
Pallares, C., Maury, R. C., Bellon, H., Royer, J. Y., Calmus, T., Aguillón-Robles, A., et al. (2007). Slab-tearing Following ridge-trench Collision: Evidence from Miocene Volcanism in Baja California, México. J. Volcanology Geothermal Res. 161 (1-2), 95–117. doi:10.1016/j.jvolgeores.2006.11.002
Poliakov, A. N., and Buck, W. R. (1998). Mechanics of Stretching Elastic-Plastic-Viscous Layers: Applications to Slow-Spreading Mid-ocean Ridges. Geophys. Monogr. Ser. 106, 305–324. doi:10.1029/GM106p0305
Püthe, C., and Gerya, T. (2014). Dependence of Mid-ocean ridge Morphology on Spreading Rate in Numerical 3-D Models. Gondwana Res. 25 (1), 270–283. doi:10.1016/j.gr.2013.04.005
Qing, J., Liao, J., Li, L., and Gao, R. (2021). Dynamic Evolution of Induced Subduction through the Inversion of Spreading Ridges. J. Geophys. Res. Solid Earth 126 (3), e2020JB020965. doi:10.1029/2020JB020965
Rosenbaum, G., Giles, D., Saxon, M., Betts, P. G., Weinberg, R. F., and Duboz, C. (2005). Subduction of the Nazca Ridge and the Inca Plateau: Insights into the Formation of Ore Deposits in Peru. Earth Planet. Sci. Lett. 239 (1-2), 18–32. doi:10.1016/j.epsl.2005.08.003
Rüpke, L. H., Morgan, J. P., Hort, M., and Connolly, J. A. (2004). Serpentine and the Subduction Zone Water Cycle. Earth Planet. Sci. Lett. 223 (1-2), 17–34. doi:10.1016/j.epsl.2004.04.018
Seton, M., Flament, N., Whittaker, J., Müller, R. D., Gurnis, M., and Bower, D. J. (2015). Ridge Subduction Sparked Reorganization of the Pacific Plate‐mantle System 60-50 Million Years Ago. Geophys. Res. Lett. 42 (6), 1732–1740. doi:10.1002/2015gl063057
Song, Y., Ren, J., Stepashko, A. A., and Li, J. (2014). Post-rift Geodynamics of the Songliao Basin, NE China: Origin and Significance of T11 (Coniacian) Unconformity. Tectonophysics 634, 1–18. doi:10.1016/j.tecto.2014.07.023
Steinberger, B., and Calderwood, A. R. (2006). Models of Large-Scale Viscous Flow in the Earth's Mantle with Constraints from mineral Physics and Surface Observations. Geophys. J. Int. 167 (3), 1461–1481. doi:10.1111/j.1365-246x.2006.03131.x
Tang, J., Xu, W., Wang, F., and Ge, W. (2018). Subduction History of the Paleo-Pacific Slab beneath Eurasian Continent: Mesozoic-Paleogene Magmatic Records in Northeast Asia. Sci. China Earth Sci. 61 (5), 527–559. doi:10.1007/s11430-017-9174-1
Torii, Y., and Yoshioka, S. (2007). Physical Conditions Producing Slab Stagnation: Constraints of the Clapeyron Slope, Mantle Viscosity, Trench Retreat, and Dip Angles. Tectonophysics 445 (3-4), 200–209. doi:10.1016/j.tecto.2007.08.003
Vaes, B., Hinsbergen, D. J. J., and Boschman, L. M. (2019). Reconstruction of Subduction and Back‐Arc Spreading in the NW Pacific and Aleutian Basin: Clues to Causes of Cretaceous and Eocene Plate Reorganizations. Tectonics 38 (4), 1367–1413. doi:10.1029/2018tc005164
van Hunen, J., van den Berg, A. P., and Vlaar, N. J. (2002). The Impact of the South-American Plate Motion and the Nazca Ridge Subduction on the Flat Subduction below South Peru. Geophys. Res. Lett. 29 (14), 35–41. doi:10.1029/2001gl014004
Wang, C., Ding, W., Li, J., Dong, C., Fang, Y., Tang, L., et al. (2019). Effects of Trench‐perpendicular ridge Subduction on Accretionary Wedge Deformation: Clues from Analogue Modelling. Geol. J. 54 (4), 2665–2678. doi:10.1002/gj.3317
Wang, C., Feng, Z., Zhang, L., Huang, Y., Cao, K., Wang, P., et al. (2013). Cretaceous Paleogeography and Paleoclimate and the Setting of SKI Borehole Sites in Songliao Basin, Northeast China. Palaeogeogr. Palaeoclimatol. Palaeoecol. 385, 17–30. doi:10.1016/j.palaeo.2012.01.030
Wu, J. T.-J., and Wu, J. (2019). Izanagi-Pacific ridge Subduction Revealed by a 56 to 46 Ma Magmatic gap along the Northeast Asian Margin. Geology 47 (10), 953–957. doi:10.1130/g46778.1
Yang, T., Moresi, L., Zhao, D., Sandiford, D., and Whittaker, J. (2018). Cenozoic Lithospheric Deformation in Northeast Asia and the Rapidly-Aging Pacific Plate. Earth Planet. Sci. Lett. 492, 1–11. doi:10.1016/j.epsl.2018.03.057
Keywords: mid-ocean ridge, trench-parallel subduction, spreading velocity, viscosity, fast mode, slow mode, extinction mode, volcanism gap
Citation: Shen X and Leng W (2021) The Mode of Trench-Parallel Subduction of the Middle Ocean Ridge. Front. Earth Sci. 9:781117. doi: 10.3389/feart.2021.781117
Received: 22 September 2021; Accepted: 19 October 2021;
Published: 01 November 2021.
Edited by:
Zhong-Hai Li, University of Chinese Academy of Sciences, ChinaReviewed by:
Jiashun Hu, Southern University of Science and Technology, ChinaJie Liao, Sun Yat-sen University, Zhuhai Campus, China
Copyright © 2021 Shen and Leng. This is an open-access article distributed under the terms of the Creative Commons Attribution License (CC BY). The use, distribution or reproduction in other forums is permitted, provided the original author(s) and the copyright owner(s) are credited and that the original publication in this journal is cited, in accordance with accepted academic practice. No use, distribution or reproduction is permitted which does not comply with these terms.
*Correspondence: Wei Leng, wleng@ustc.edu.cn