Slowdown in the Decay of Western North Pacific Tropical Cyclones Making Landfall on the Asian Continent
 Jinjie Song
 Philip J. Klotzbach
 Haikun Zhao
 Yihong Duan
- 1Nanjing Joint Institute for Atmospheric Sciences, Chinese Academy of Meteorological Sciences, Nanjing, China
- 2State Key Laboratory of Severe Weather, Chinese Academy of Meteorological Sciences, Beijing, China
- 3Department of Atmospheric Science, Colorado State University, Fort Collins, CO, United States
- 4School of Atmospheric Sciences, Nanjing University of Information Science and Technology, Nanjing, China
This study finds an increasing trend in the decay timescale (τ) of western North Pacific (WNP) tropical cyclone (TCs) making landfall on the Asian continent from 1966–2018. Statistical analysis of individual landfalling TCs shows that τ is significantly positively linked to soil wetness, 850-hPa relative vorticity and 200-hPa divergence, whereas it is weakly correlated with 700–500-hPa relative humidity and 850–200-hPa vertical wind shear. For TCs hitting southeastern China, the observed increasing τ is likely caused by enhanced 850-hPa vorticity and 200-hPa divergence. For TCs hitting southern China, increasing τ is likely driven by increased 850-hPa vorticity. By comparison, there are no significant trends in environmental variables over the eastern Indo-China Peninsula, and τ has not significantly changed in this region. Our results imply that the increasing τ of WNP landfalling TCs on the Asian continent are more likely caused by changes in dynamic variables than changes in thermodynamic variables.
Introduction
Tropical cyclones (TCs) are among the most destructive and deadliest natural disasters around the world, causing significant economic losses and casualties to coastal and adjacent inland regions when these TCs make landfall (Chen et al., 2011). Most TCs weaken rapidly after landfall, due to various TC-unfavorable conditions including increased friction, enhanced baroclinicity, decreased moisture and most importantly, significant reductions in latent and sensible heat fluxes (Kaplan and DeMaria, 1995). Li and Chakraborty (2020) recently found that the inland decay rate of North Atlantic TCs slowed during the period from 1967–2018. By using statistical analysis and numerical simulations, they found that warmer SSTs increased the moisture supply transported by a TC, providing additional heat that helped to sustain the warm-core structure leading to a slower decay. Compared with the North Atlantic the number of TC landfalls over the western North Pacific (WNP) is much greater, accounting for more than 50% of global TC landfalls from 1970–2010 (Weinkle et al., 2012). Nonetheless, it remains unclear how the inland decay of WNP TCs has changed during the past few decades. Chen et al. (2011) reported an increasing duration of TCs over China from 1975 to 2009, possibly due to decreasing VWS over southeastern China. Given that TCs with a higher landfall intensity usually survive longer (Liu et al., 2020), this increasing duration over land does not necessarily imply a slower inland decay.
Previous publications (e.g. Wood and Ritchie, 2015; Ma et al., 2019; Fei et al., 2020; Song et al., 2020) have found several environmental conditions responsible for the rate of WNP TC weakening over water. A larger weakening rate is statistically correlated with lower sea surface temperatures (SSTs), increased SST gradients, larger vertical wind shear (VWS) and a drier mid-troposphere. By contrast, there are fewer papers investigating the relationship between the underlying surface and the inland decay rate of TCs. Some inland TCs maintain their strength or even intensify without transitioning to extratropical systems. This phenomena has been linked to anomalously wet soils over which the TCs track (Andersen and Shepherd, 2013). Wet soils can create an environment with increased moist static energy and latent heat that inhibits TC decay (Arndt et al., 2009; Kellner et al., 2012; Evans et al., 2011). In addition, wet soils can delay the weakening of TCs following landfall by providing them with additional energy due to enhanced heat and moisture transfers (Emanuel et al., 2008; Kishtawal et al., 2012). However, whether atmospheric variables modulate the inland decay of TCs remains unknown.
To resolve this issue, this study not only investigates long-term trends in the decay of inland WNP TCs, but also provides statistical linkages between various environmental factors and the inland decay timescale. The reminder of this paper is arranged as follows. Data and methods discusses the data and methods for identifying and classifying landfalling TCs over the WNP. This section also includes the computation of the decay timescale metric that serves as a single parameter characterizing TC decay (Li and Chakraborty, 2020). Results discusses the long-term tendency in the decay timescale of WNP landfalling TCs as well as the potential environmental contributors to this observed change. A summary is given in the last section.
Data and Methods
The 3-hourly WNP TC best track data from the China Meteorological Administration (CMA) used in this study are provided by the International Best Track Archive for Climate Stewardship (IBTrACS) v04r00 (Knapp et al., 2010), including TC center position and 2-min maximum sustained wind. There are three other agencies compiling best track data over the WNP, including the Joint Typhoon Warning Center (JTWC), the Japan Meteorological Agency (JMA) and the Hong Kong Observatory (HKO). Compared with other coastal countries in the WNP, more TCs hit China climatologically. The CMA data is primarily applied in this study because relatively more observational data are available over China from CMA than from these other agencies (Chen et al., 2011). The JTWC, JMA and HKO data are used to validate the results. We analyze TC best track data during the period of 1966–2018, which tend to be of higher quality and are therefore more reliable due to the use of polar-orbiting and geostationary satellites starting in 1966 (Moon et al., 2019). Owing to the uncertainty in detecting weak TCs such as tropical depressions (Klotzbach and Landsea, 2015), TCs with a lifetime maximum intensity less than 34 kt are excluded in this study.
We investigate all landfall cases that are not excluded by the criteria that are now presented. First, landfalls on large islands (e.g. Hainan, Taiwan, Philippines, Japan) are not considered, since the environmental conditions for these landfalls are more characteristic of an oceanic environment. Second, TCs that survived less than 12 h after landfall (e.g., fewer than four continuous inland TC records with non-zero estimates of maximum sustained wind) are excluded. The remaining sample is further subdivided to identify TCs surviving at least 24 h after landfall. Third, cases completing extratropical transition as recorded in the best track during landfall are not considered, in order to minimize the influence of extratropical transition. In total, there are 375, 322, 114, and 256 (190, 147, 13, 58) 12-h (24-h) landfall cases identified from the CMA, JTWC, JMA, and HKO best track data, respectively, during 1966–2018 (Figure 1). Similar TC tracks and landfall tracks occur in all four datasets.
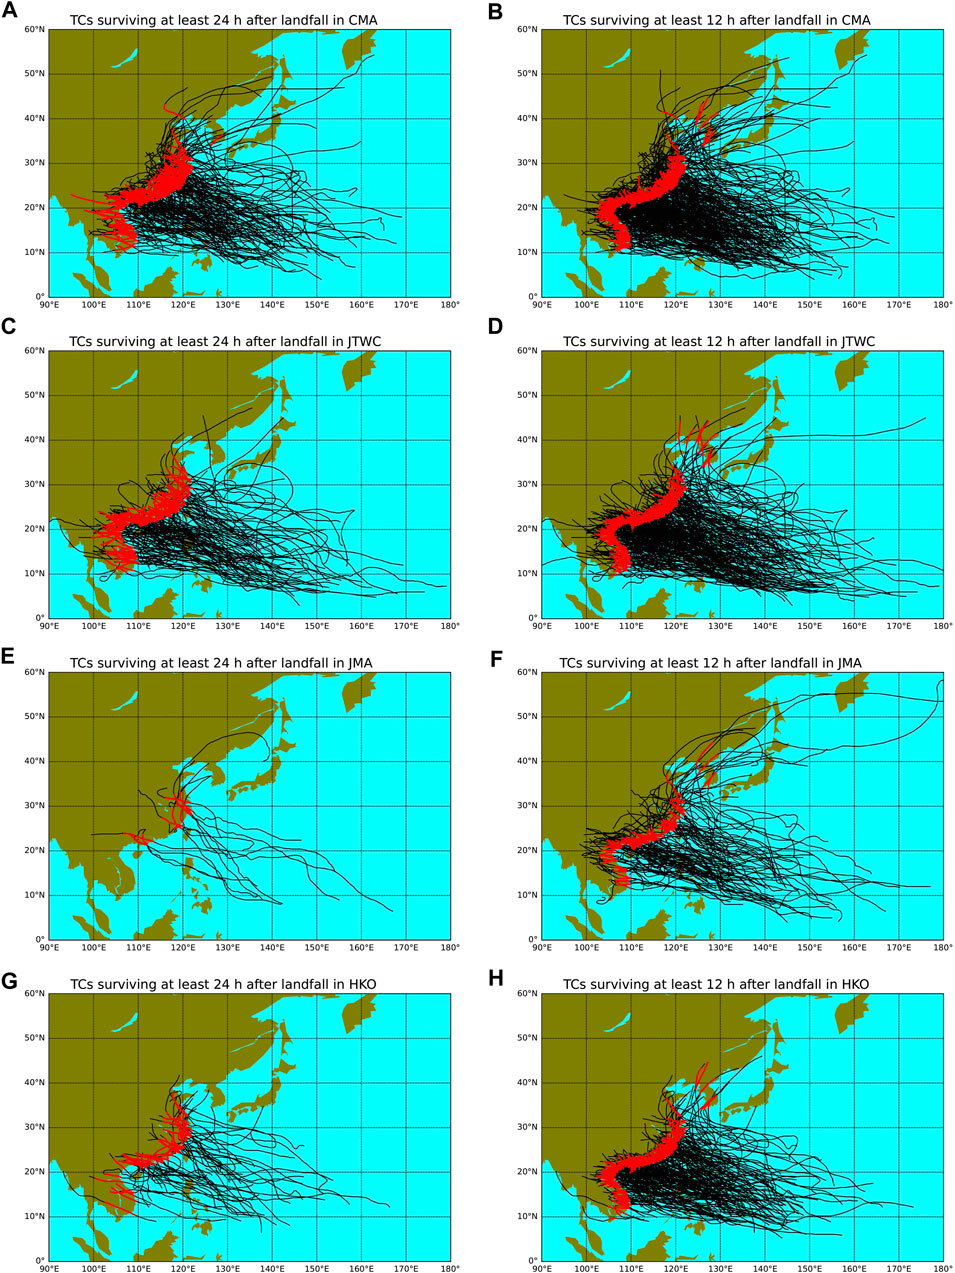
FIGURE 1. Tracks of landfalling WNP TCs identified from the (A,B) CMA (C,D) JTWC (E,F) JMA and (G,H) HKO dataset from 1966 to 2018. The trajectories during the first 24 and 12 h after landfall are represented as red thick lines in the left and right columns, respectively.
Ren et al. (2011) reported that there were many more landfalling TCs in the CMA dataset than in other WNP best track data. Also, because CMA usually tracks the overland portion of TCs making landfall on China for a longer time than other agencies, this study also identifies more landfall cases from CMA than for other agencies. Relatively few landfall cases are identified in the JMA data using our methodology, partly because JMA only started to estimate wind speeds after 1977. Given that the numbers of identified landfalls in the JMA and HKO data are much smaller than those in the CMA and JTWC data, we primarily use the CMA data in the following analysis, while the JTWC data are applied to cross check the results.
After landfall, the TC intensity (V) exhibits an exponential decay as
Monthly mean atmospheric and surface data are provided by the Japanese 55-year Reanalysis (JRA-55) on a 1.25 × 1.25 grid (Kobayashi et al., 2015). The JRA-55 land-sea mask is applied to determine whether the TC center is over water or land. Five factors are considered here for their potential impact on TC inland decay: soil wetness, 700–500-hPa relative humidity (RH), 850–200-hPa vertical wind shear (VWS), 850-hPa relative vorticity (VOR) and 200-hPa divergence (DIV). Furthermore, to investigate the relationship between inland decay and environmental variables on a case by case basis, these reanalysis fields are cubically interpolated in space to the mean location during the 24-h period after landfall and in time to the actual day, assigning the monthly mean climatology to the middle day of each month as was done by Emanuel et al. (2004) and Lee et al. (2016).
Monthly Pacific Decadal Oscillation (PDO) index values are obtained from the National Oceanic and Atmospheric Administration (NOAA) Earth System Research Laboratory’s Physical Sciences Division (PSD).
Results
Increasing Trend in Decay Timescale
During 1966–2018, in the CMA data, although there is no significant trend in the annual frequency of landfalls, there are significant increasing tendencies in τ of 0.26 h yr−1 (p < 0.01) for 24-h landfalls (Figure 1A) and 0.20 h yr−1 (p < 0.01) for 12-h landfalls (Figure 1B). These τ trends become 0.24 h yr−1 (p = 0.02) and 0.19 h yr−1 (p = 0.01), when using a weighted linear regression model (Wang et al., 2020) in which annual τ is weighted by the corresponding landfall frequency. There are also significant increasing τ trends in the JTWC data, which show similar rates to those in the CMA data. These results mean that the τ trend is not significantly changed, regardless of different landfall durations or different best track datasets. Hereafter, we focus on the 24-h landfalls recorded by CMA. Over these 53 years, τ has increased by 57% over the WNP (from 23 to 36 h), which is lower than the 94% increase in τ over the North Atlantic (Li and Chakraborty, 2020). These findings mean that over land, WNP TCs are now decaying at a slower rate and may consequently survive for a longer time, similar to what was found for North Atlantic TCs (Li and Chakraborty, 2020).
As another decaying metric, DR shows a significant inverse relation with τ (r = -0.44; p < 0.01), implying that TCs weakening at a lower rate usually undergo a slower decay (Figure 2A). Consistent with the increasing τ trend, there is a significant decreasing DR trend of −2.0 × 10⁻² kt h−1 yr−1 (p = 0.04) during 1966–2018 (figures not shown). However, DR is very sensitive to the landfall intensity and the overland duration (Figures 2D,E), meaning that TCs landfalling at a higher intensity or surviving at a shorter duration typically exhibit a greater DR. By contrast, τ is independent of both the landfall intensity (r = -0.10; p = 0.18) and the overland duration (r = 0.11; p = 0.14) (Figures 2B,C). The estimation of τ minimizes the linkage between the landfall intensity/overland duration and the TC decay rate.
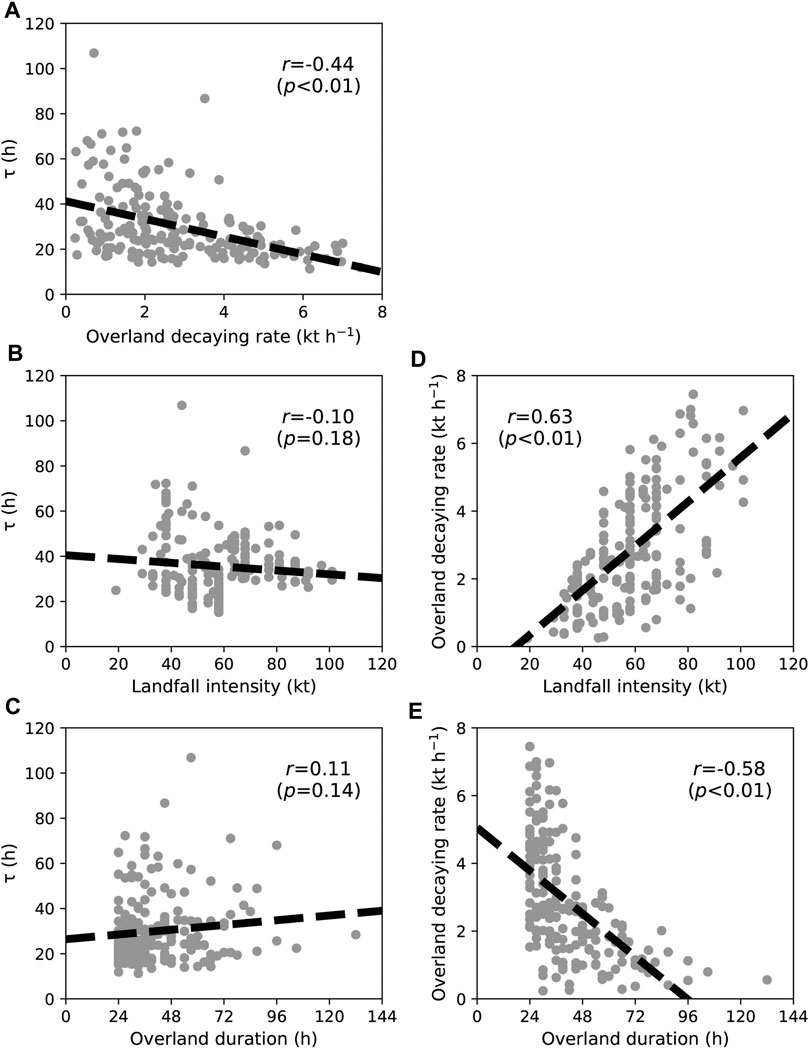
FIGURE 2. Relationship of τ versus (A) overland decaying rate, (B) landfall intensity, (C) overland duration and relationship of overland decaying rate versus (D) landfall intensity, and (E) overland duration. The dashed lines are obtained by least squares, while the correlation coefficients and their significance levels are given in the panels.
We now expand upon these results by categorizing the 24-h tracks after landfall into three clusters using the K-means method (Nakamura et al., 2009). 95, 66, and 29 TCs are classified into Clusters A, B and C, respectively. These clusters make landfall in southeastern China, southern China and in other Southeast Asian countries, respectively (Figure 3A). We classify three clusters here. These clusters identify TCs hitting different areas but also include enough TC samples in each cluster.
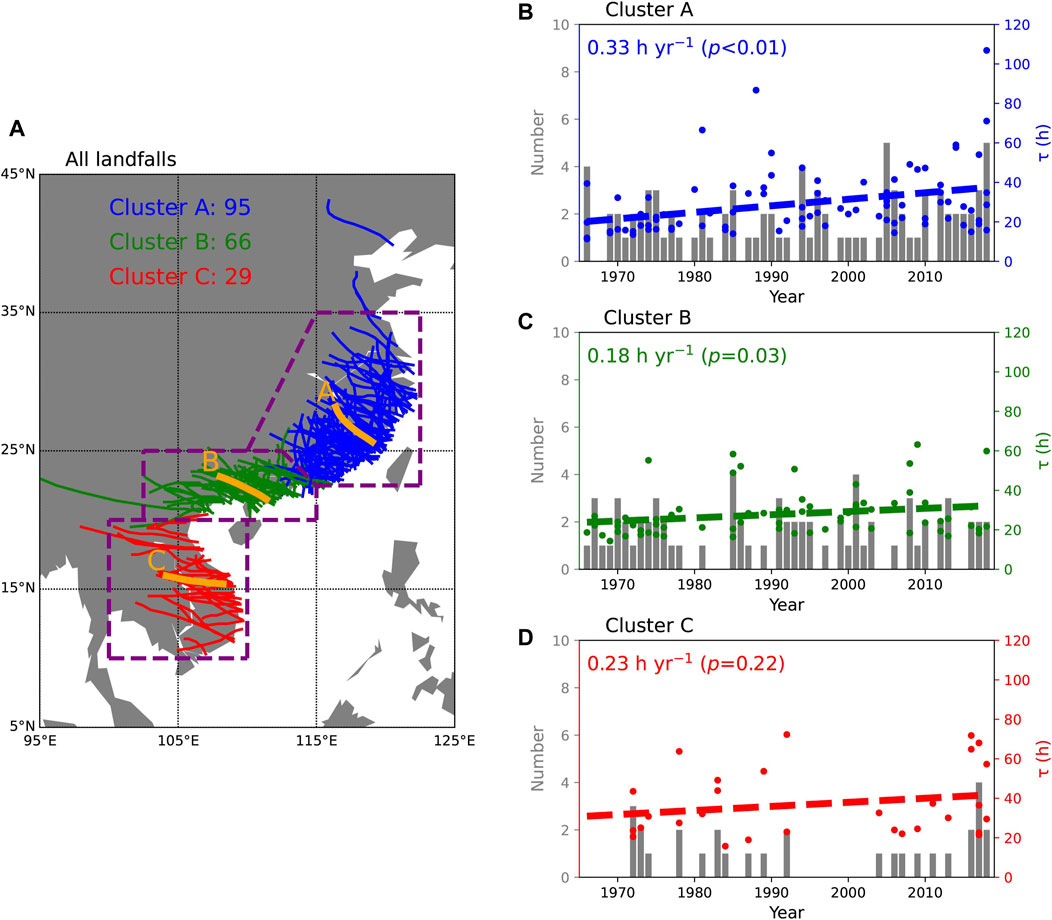
FIGURE 3. (A) Tracks of 190 WNP TC landfalls identified from the CMA dataset from 1966 to 2018. The trajectories during the first 24 h after landfall in Clusters A, B, C are represented as blue, green and red thick lines, respectively. The mean trajectories for the three clusters are shown by thick orange lines. The main occurrence region for landfalls in the three clusters are bounded by purple dashed lines (b ∼ d) Time series of the annual number (gray bars) and the decay timescale τ (points) for (B) Cluster A landfalls, (C) Cluster B landfalls and (D) Cluster C landfalls for the period from 1966–2018. The dashed lines denote the long-term trends obtained by least squares, while their corresponding slopes and significance levels are given in the panels.
The change in τ is not uniform along the Asian coast, with different long-term τ trends from 1966 to 2018 for the three landfall clusters (Figure 3 b∼d). Landfalls in Cluster A have the largest increase in τ, with a slope of 0.33 h yr−1 (p < 0.01), while landfalls in Cluster B show a smaller but significant increasing τ of 0.18 h yr−1 (p = 0.03). By comparison, there is no significant τ trend (0.23 h yr−1; p = 0.22) for landfalls in Cluster C. While the increasing trend for Cluster C is larger than Cluster B, the relatively small sample size of landfalls in Cluster C is the reason why the trend in that region is not significant. Since 85% (161 out of 190) of the observed landfalls in this study occur in Clusters A and B, the increasing τ of Clusters A and B landfalls are primarily responsible for the increasing trend in τ for all landfalls as shown in Figure 4A.
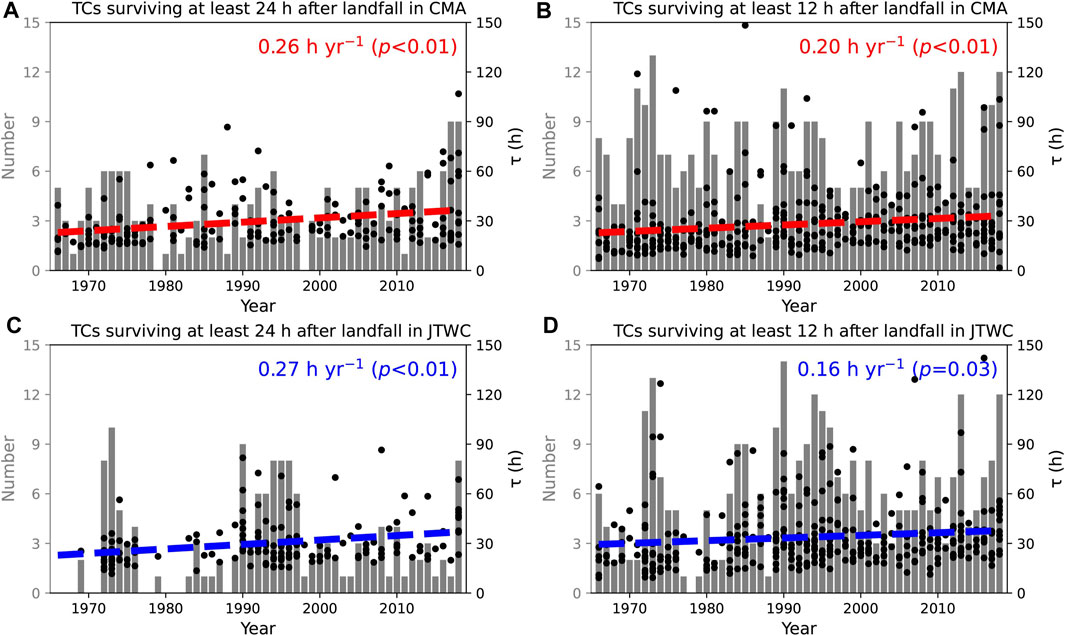
FIGURE 4. Time series of the annual number (gray bars) and the decay timescale τ (points) for (A) 24-h landfalls in CMA, (B) 12-h landfalls in CMA, (C) 24-h landfalls in JTWC and (D) 12-h landfalls in JTWC during the period from 1966–2018. The dashed lines denote the long-term trends obtained by least squares, while their corresponding slopes and significance levels are given in the panels.
Environmental Factors Influencing WNP Decay Timescale
Li and Chakraborty (2020) attributed the increasing τ over the North Atlantic to warmer SSTs, which then increased the available moisture carried by a TC after making landfall. Their findings were based on a correlation analysis of smoothed annual timeseries of landfalls and SST. By comparison, we examine the statistical relationship between several environmental variables and τ from individual cases (Figure 5). Figure 5A highlights a significant positive relationship between τ and soil wetness (r = 0.16; p = 0.03), implying that a moist underlying land surface can slow TC weakening. This result is consistent with previous studies (e.g. Emanuel et al., 2008; Arndt et al., 2009; Kellner et al., 2012; Evans et al., 2011; Kishtawal et al., 2012; Andersen and Shepherd, 2013). Wet soils supply additional energy to TCs post-landfall via vertical transport of heat and moisture (Emanuel et al., 2008; Kishtawal et al., 2012). By contrast, in Figure 5B, there is no significant linkage between τ and 700–500-hPa RH (r = 0.05; p = 0.45). Although changes in atmospheric moisture have had a considerable impact on the WNP TC weakening rate over water (Fei et al., 2020), it appears to have had less of an impact on inland wind decay over the Asian continent. These results imply that surface thermodynamic factors play a larger role in modulating the decay of inland TCs over the Asian continent than those in the atmosphere.
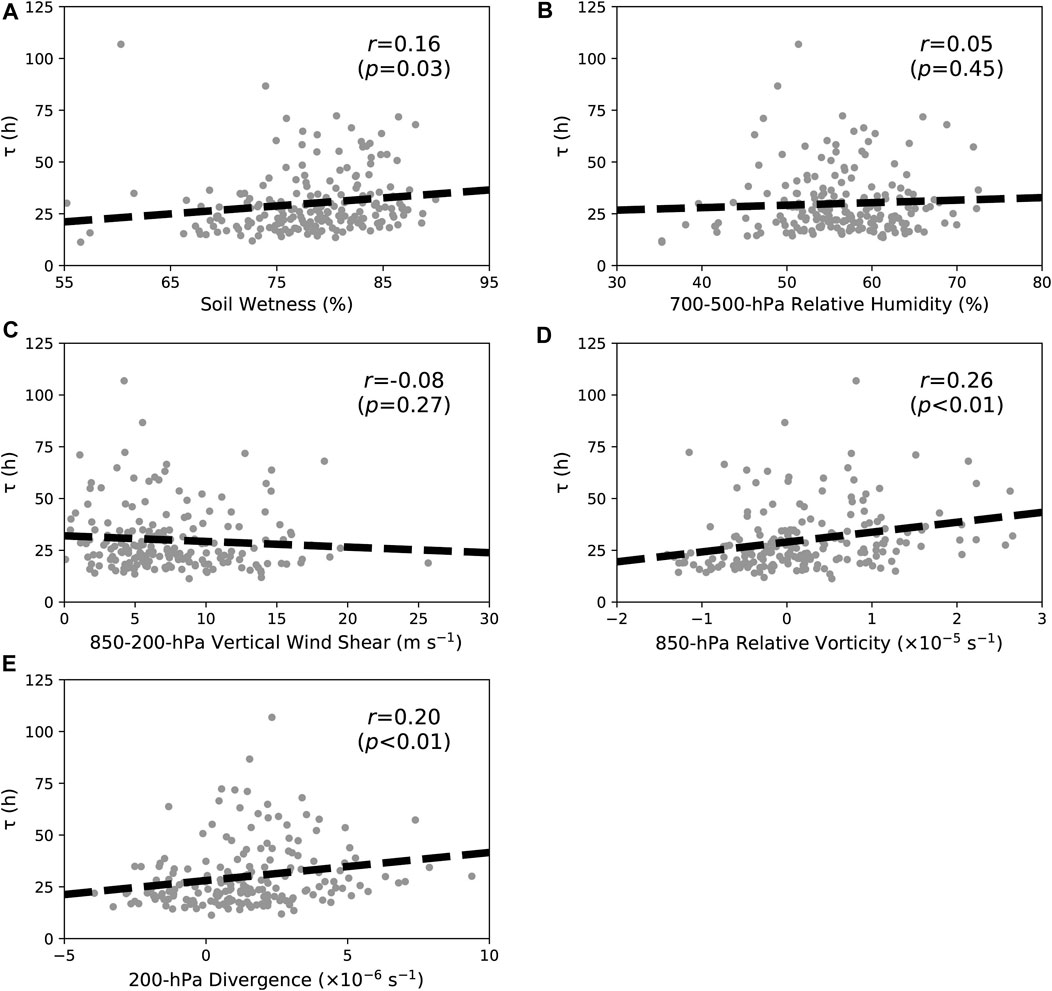
FIGURE 5. Relationship between τ and five environmental variables: (A) soil wetness, (B) 700–500-hPa RH, (C) 850–200-hPa VWS, (D) 850-hPa VOR and (E) 200-hPa DIV. The dashed lines are obtained by least squares, while the correlation coefficients and their significance levels are given in the panels.
Figure 5C displays a weak inverse relationship between τ and 850–200-hPa VWS (r = -0.08; p = 0.27), indicating that VWS only has a minor influence on TC inland decay. Note that this result is inconsistent with Chen et al. (2011) who concluded that decreasing VWS led to an increasing TC survival time over land. Because of the weak linkage between τ and the actual overland duration, an increasing TC duration over land does not necessarily mean an increasing τ. We speculate that less VWS likely results in a longer duration over land because TCs encountering less VWS shear before landfall are likely to be stronger at the time of landfall. The relationship between VWS and TC decay seems to play a lesser role after landfall. This result is also different from the observed strong relationship between the weakening rate of WNP TCs and VWS over water (Fei et al., 2020). Two other dynamic factors, 850-hPa VOR and 200-hPa DIV, both exhibit significant positive connections with τ (Figures 5D,E), with correlation coefficients of 0.26 (p < 0.01) and 0.20 (p < 0.01), respectively. These results imply that an environment characterized by an anomalous lower-level cyclonic circulation and anomalous upper-level divergent flow favors a slower weakening of TCs over land. By contrast, these two variables are not strongly correlated with the WNP TC weakening rate over water (Fei et al., 2020). The above results imply that the environmental elements significantly influencing WNP TC decay over the Asian continent differ from those influencing WNP TC decay over water.
When dividing total landfalls into different clusters (Figure 4A), the statistical relationship between environmental variables and τ remains of the same sign (figures not shown). However, the significant positive relationship between τ and soil wetness is only found in Cluster C (r = 0.37; p = 0.04). The significant positive relationship between τ and 850-hPa VOR is found in Cluster A (r = 0.33; p < 0.01) and in Cluster B (r = 0.25; p = 0.04), while the significant positive relationship between τ and 200-hPa DIV is only observed in Cluster A (r = 0.29; p < 0.01).
Long-Term Trends in Environmental Variables
To investigate whether trends in environmental variables are inducing the increasing τ, we calculate the long-term trends in the June-November averages of the five aforementioned factors during 1966–2018 (Figure 6). There are no significant trends in soil wetness over the main occurrence regions for landfalls (Figure 6A). Although soil wetness is significantly correlated with τ, long-term changes in soil wetness do not appear to be contributing to the long-term increase in τ. By comparison, significant decreasing and increasing trends in 700–500-hPa RH are observed over the Asian continent and over the ocean, respectively (Figure 6B). Although drier conditions are found over the main landfall regions, these drier conditions do not appear to significantly impact long-term changes in τ, since the linkage between τ and atmospheric moisture is weak.
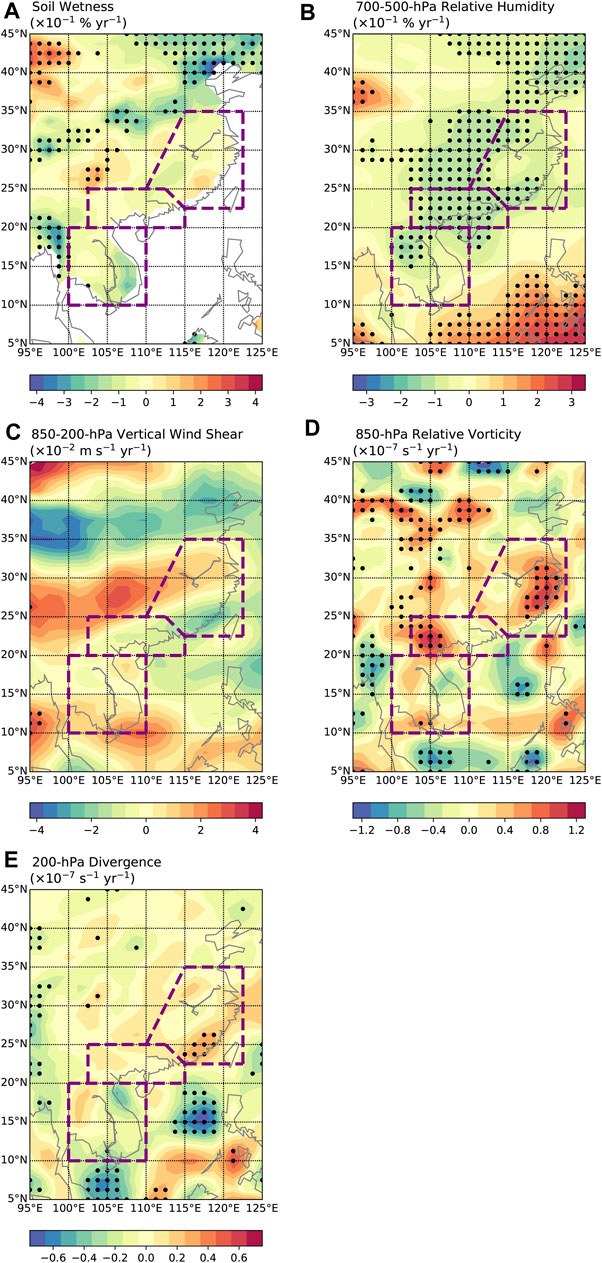
FIGURE 6. Long-terms trends (1966–2018) in June-November averages of environmental variables: (A) soil wetness, (B) 700–500-hPa RH, (C) 850–200-hPa VWS, (D) 850-hPa VOR and (E) 200-hPa DIV. Circles denote values significant at the 0.05 level based on an F-test. Areas bounded by purple dashed lines refer to the main occurrence region of landfalls for the three clusters, as was demarcated in Figure 1A.
Figure 6C shows only a very small region between 95 and 100°E with significant changes in 850–200-hPa VWS from 1966 to 2018. Although weaker VWSs are observed over southern China, the trends in VWS are not as significant as those found in Chen et al. (2011). This difference is likely caused by the different periods analyzed in Chen et al. (2011) and in our study. There are significantly enhanced 850-hPa VORs over the main landfall regions of Clusters A and B, with the two largest increasing regions centered over Zhejiang Province and Guangxi Province (Figure 6D). No significant changes in 850-hPa VOR are found over the eastern part of the Indo-China Peninsula, where landfalls in Cluster C mainly occur. In addition, there are significantly enhanced 200-hPa DIVs over southeastern China that are concentrated in Fujian Province (Figure 6F). Over southern China and the Indo-China Peninsula, 200-hPa DIVs remain nearly unchanged.
Summarizing the above analysis, we conclude that the increasing τ of WNP TC landfalls on the Asian continent are more linked to changes in dynamic factors than changes in thermodynamic factors. The increasing τ for Cluster A is likely induced by both increasing 850-hPa VOR and 200-hPa DIV over southeastern China, while the increasing τ for Cluster B appears to be primarily driven by increasing 850-hPa VOR over southern China. By contrast, there are no significant environmental changes over the eastern Indo-China Peninsula, and we found no significant changes in τ for Cluster C.
Figure 7 examines trends in the June-November 850-hPa circulation during 1966–2018. There is a large-scale anomalous cyclonic flow trend over the Chinese mainland, with significantly increased westerlies and easterlies over the southern portion and the northern portion, respectively (Figure 7A). These enhanced westerlies along the southern coastline of China provide anomalously positive 850-hPa VOR over southeastern and southern China due to the shear effect. This anomalous cyclonic flow over China is consistent with an enhanced East Asian summer monsoon circulation during recent decades, which has been linked to global warming (Zhu et al., 2011; He et al., 2019). Figure 7B highlights these same trends in the 850-hPa circulation after removing the influence of the PDO via partial regression. We find similar flow patterns in Figure 7B, highlighting that these results remain mostly unchanged, regardless of whether the influence of decadal changes is considered.
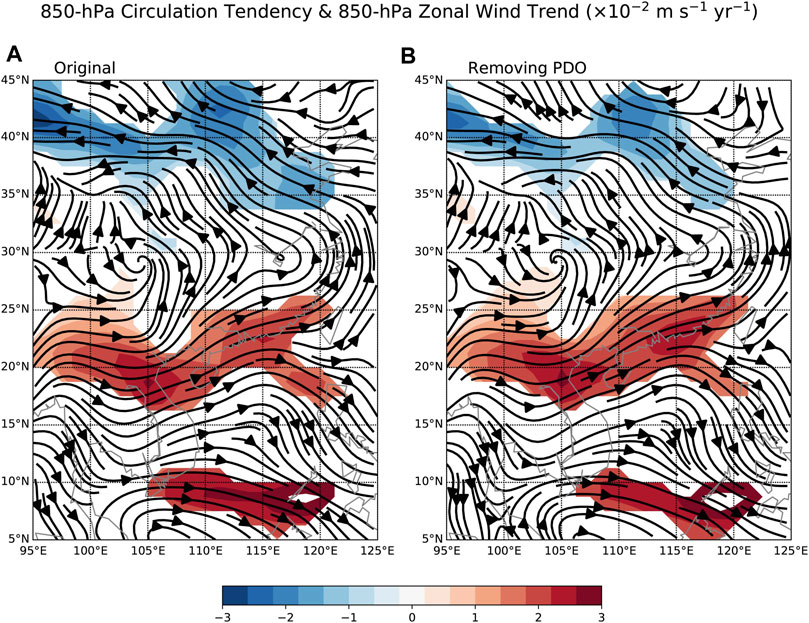
FIGURE 7. Regressed June-November 850-hPa circulation (streamlines) and 850-hPa zonal wind speed (colors) from 1966–2018. Values in (A) are estimated by a linear regression on time. Values in (B) are obtained by a partial regression on time when removing the linear effect of the PDO index. Colored values denote 850-hPa zonal wind speed trends significant at the 0.05 level based on an F-test.
Summary
This study investigates long-term trends in the decay timescale (τ) of WNP TCs making landfall on the Asian continent. We find a significant increasing τ for the period of 1966–2018, indicating a slower decay of inland TCs over the WNP. This increasing tendency is primarily caused by a significantly increasing τ of TCs hitting southeastern and southern China (Clusters A and B), while the τ of TCs striking the Indo-China Peninsula (Cluster C) has not increased significantly.
Compared with the WNP TC weakening rate over water, which is predominately determined by SST gradients and VWS (Fei et al., 2020), we find that TC inland decay over the Asian continent is modulated by different environmental variables. We find via statistical analysis that τ is significantly positively correlated with soil wetness, 850-hPa VOR and 200-hPa DIV. Wetter soils, greater lower-level cyclonic flow and upper-level divergent flow are expected to provide additional energy allowing TCs to survive for a longer time over land, further leading to a slower inland decay. By contrast, atmospheric moisture and VWS appear to play a lesser role in the modulation of the TC decay rate over land, due to their weak correlations with τ.
Changes in τ during 1966–2018 appear to be caused by different environmental factors over different regions over the WNP. For TCs hitting southeastern China (Cluster A), increasing τ is jointly induced by increased 850-hPa VOR and 200-hPa DIV. For TCs hitting southern China (Cluster B), increasing τ appears to be primarily due to increasing 850-hPa VOR. The increase in 850-hPa VOR is caused by the shear effect of an enhanced large-scale low-level cyclonic circulation over China. Due to global warming, an enhanced East Asian summer monsoon circulation is projected by climate models as global surface temperature increases, leading to anomalous low-level cyclonic flow over East Asia (Zhu et al., 2011; He et al., 2019; Li et al., 2019). These results imply that WNP inland TCs are likely to decay more slowly in the future. By comparison, we find little trend in environmental conditions over the eastern Indo-China Peninsula. This region (Cluster C) also exhibited an insignificant change in τ. Despite the linkage between τ and soil wetness, no significant trends in soil wetness are observed over the main occurrence region for landfalls along the Asian continent. These results imply that the increasing τ of WNP landfalling TCs is more likely caused by changes in dynamic variables than changes in thermodynamic variables.
Our results are based on a statistical analysis of a limited number of samples. The main findings need to be verified by numerical sensitivity experiments using different large-scale environmental forcings. These experiments will be designed and conducted in future research.
Data Availability Statement
The original contributions presented in the study are included in the article/supplementary material, further inquiries can be directed to the corresponding author.
Author Contributions
JS, PK, and YD contributed to conception and design of the study. JS organized the database and performed the statistical analysis. JS wrote the first draft of the article. PK, HZ, and YD revised the article. All authors contributed to manuscript revision, read, and approved the submitted version.
Funding
This work was jointly funded by the National Key Research and Development Program of China (2018YFC1507103), the National Natural Science Foundation of China (61827901 and 41922033), the China Postdoctoral Science Foundation (2020M680789) and the Natural Science Foundation of Jiangsu Province, China (BK20181412).
Conflict of Interest
The authors declare that the research was conducted in the absence of any commercial or financial relationships that could be construed as a potential conflict of interest.
The handling editor declared a shared affiliation with one of the authors HZ at time of review.
Publisher’s Note
All claims expressed in this article are solely those of the authors and do not necessarily represent those of their affiliated organizations, or those of the publisher, the editors and the reviewers. Any product that may be evaluated in this article, or claim that may be made by its manufacturer, is not guaranteed or endorsed by the publisher.
Acknowledgments
We would like to express our sincere thanks to two reviewers for their helpful comments on an earlier version of this manuscript. WNP TC best track data provided by CMA, JTWC, JMA and HKO and archived in IBTrACS are downloaded from https://www.ncdc.noaa.gov/ibtracs/index.php?name=ib-v4-access. The monthly timeseries of the PDO index is obtained from https://psl.noaa.gov/data/climateindices/. The Japanese 55-years Reanalysis (JRA-55) data are available at http://search.diasjp.net/en/dataset/JRA55. Klotzbach would like to acknowledge financial support from the G. Unger Vetlesen Foundation.
References
Andersen, T. K., and Shepherd, J. M. (2013). A global spatiotemporal analysis of inland tropical cyclone maintenance or intensification. Int. J. Climatol. 34, 391–402. doi:10.1002/joc.3693
Chen, X., Wu, L., and Zhang, J. (2011). Increasing duration of tropical cyclones over China. Geophys. Res. Lett. 38, L02708. doi:10.1029/2010gl046137
Emanuel, K., DesAutels, C., Holloway, C., and Korty, R. (2004). Environmental Control of Tropical Cyclone Intensity. J. Atmos. Sci. 61, 843–858. doi:10.1175/1520-0469(2004)061<0843:ecotci>2.0.co;2
Fei, R., Xu, J., Wang, Y., and Yang, C. (2020). Factors Affecting the Weakening Rate of Tropical Cyclones over the Western North Pacific. Mon. Wea. Rev. 148, 3693–3712. doi:10.1175/mwr-d-19-0356.1
He, C., Wang, Z., Zhou, T., and Li, T. (2019). Enhanced Latent Heating over the Tibetan Plateau as a Key to the Enhanced East Asian Summer Monsoon Circulation under a Warming Climate. J. Clim. 32, 3373–3388. doi:10.1175/jcli-d-18-0427.1
Kaplan, J., and DeMaria, M. (1995). A Simple Empirical Model for Predicting the Decay of Tropical Cyclone Winds after Landfall. J. Appl. Meteorol. 34, 2499–2512. doi:10.1175/1520-0450(1995)034<2499:asemfp>2.0.co;2
Klotzbach, P. J., and Landsea, C. W. (2015). Extremely intense hurricanes: Revisiting Webster et al. (2005) after 10 years. J. Clim. 28, 7621–7629. doi:10.1175/jcli-d-15-0188.1
Knapp, K. R., Kruk, M. C., Levinson, D. H., Diamond, H. J., and Neumann, C. J. (2010). The International Best Track Archive for Climate Stewardship (IBTrACS). Bull. Amer. Meteorol. Soc. 91, 363–376. doi:10.1175/2009bams2755.1
Kobayashi, S., Ota, Y., Harada, Y., Ebita, A., Moriya, M., Onoda, H., et al. (2015). The JRA-55 Reanalysis: General specifications and basic characteristics. J. Meteorol. Soc. Jpn. 93, 5–48. doi:10.2151/jmsj.2015-001
Lee, C.-Y., Tippett, M. K., Sobel, A. H., and Camargo, S. J. (2016). Autoregressive Modeling for Tropical Cyclone Intensity Climatology. J. Clim. 29, 7815–7830. doi:10.1175/jcli-d-15-0909.1
Li, L., and Chakraborty, P. (2020). Slower decay of landfalling hurricanes in a warming world. Nature 587, 230–234. doi:10.1038/s41586-020-2867-7
Li, Z., Sun, Y., Li, T., Ding, Y., and Hu, T. (2019). Future Changes in East Asian Summer Monsoon Circulation and Precipitation under 1.5 to 5 °C of Warming. Earth's Future 7, 1391–1406. doi:10.1029/2019ef001276
Liu, L., Wang, Y., Zhan, R., Xu, J., and Duan, Y. (2020). Increasing destructive potential of landfalling tropical cyclones over China. J. Clim. 33, 3731–3743. doi:10.1175/jcli-d-19-0451.1
Ma, Z., Fei, J., and Huang, X. (2019). A definition of rapid weakening for tropical cyclones over the western North Pacific. Geophys. Res. Lett. 46, 11471–11478. doi:10.1029/2019gl085090
Moon, I.-J., Kim, S.-H., and Chan, J. C. L. (2019). Climate change and tropical cyclone trend. Nature 570, E3–E5. doi:10.1038/s41586-019-1222-3
Nakamura, J., Lall, U., Kushnir, Y., and Camargo, S. J. (2009). Classifying North Atlantic Tropical Cyclone Tracks by Mass Moments*. J. Clim. 22, 5481–5494. doi:10.1175/2009jcli2828.1
Ren, F., Liang, J., Wu, G., Dong, W., and Yang, X. (2011). Reliability Analysis of Climate Change of Tropical Cyclone Activity over the Western North Pacific. J. Clim. 24, 5887–5898. doi:10.1175/2011jcli3996.1
Song, J., Klotzbach, P. J., Duan, Y., and Guo, H. (2020). Recent increase in tropical cyclone weakening rates over the western North Pacific. Geophys. Res. Lett. 47, e2020GL090337. doi:10.1029/2020gl090337
Wang, S., Rashid, T., Throp, H., and Toumi, R. (2020). A shortening of the life cycle of major tropical cyclones. Geophys. Res. Lett. 47, e2020GL088589. doi:10.1029/2020gl088589
Weinkle, J., Maue, R., and Pielke, R. (2012). Historical Global Tropical Cyclone Landfalls*. J. Clim. 25, 4729–4735. doi:10.1175/jcli-d-11-00719.1
Wood, K. M., and Ritchie, E. A. (2015). A definition for rapid weakening of North Atlantic and eastern North Pacific tropical cyclones. Geophys. Res. Lett. 42, 10091–10097. doi:10.1002/2015gl066697
Keywords: tropical cyclone, Western North Pacific, decay timescale, making landfall, environmental changes
Citation: Song J, Klotzbach PJ, Zhao H and Duan Y (2021) Slowdown in the Decay of Western North Pacific Tropical Cyclones Making Landfall on the Asian Continent. Front. Earth Sci. 9:749287. doi: 10.3389/feart.2021.749287
Received: 29 July 2021; Accepted: 01 September 2021;
Published: 15 September 2021.
Edited by:
Hui Yu, China Meteorological Administration, ChinaReviewed by:
Shuai Wang, Princeton University, United StatesYuan Sun, National University of Defense Technology, China
Copyright © 2021 Song, Klotzbach, Zhao and Duan. This is an open-access article distributed under the terms of the Creative Commons Attribution License (CC BY). The use, distribution or reproduction in other forums is permitted, provided the original author(s) and the copyright owner(s) are credited and that the original publication in this journal is cited, in accordance with accepted academic practice. No use, distribution or reproduction is permitted which does not comply with these terms.
*Correspondence: Jinjie Song, songjinjie@qq.com