Four Global Catastrophic Risks – A Personal View
 Russell Blong
- Risk Frontiers, Sydney, NSW, Australia
Global catastrophic risks (GCRs) affect a larger than hemispheric area and produce death tolls of many millions and/or economic losses greater than several trillion USD. Here I explore the biophysical, social-economic, demographic and cultural strands of four global catastrophic risks – sea level rise, a VEI 7 eruption, a pandemic, and a geomagnetic storm – one human-exacerbated at the least, one geological, one biological in large part, and one from space. Durations of these biophysical events range from a day or two to more than 100 years and the hazards associated range from none to numerous. Each of the risks has an average return period of no more than a few hundred years and lie within a range where many regulators ordinarily demand efforts in the case of less extreme events at enhancing resilience. Losses produced by GCRs and other natural hazards are usually assessed in terms of human mortality or dollars but many less tangible losses are at least as significant. Despite the varying durations, biophysical characteristics, and the wide array of potential consequences, the aftermath at global (and at more granular scales) can be summarised by one of four potential futures. While this assessment considers the present and the near future (the Anthropocene), much of this appraisal applies also to global catastrophic risks in the Early Holocene.
Introduction
Here I offer thoughts on the likelihood of occurrence, character, and consequences of four global catastrophes (hereafter, often shortened to GCR). I will come back to a definition of a GCR shortly – for now a global catastrophe has at least hemispheric consequences with major effects lasting at least several years and economic losses totalling several USD trillion or at least 1% of global GDP.
In these terms, since the beginning of the 20th century there have been at least five global GCRs: the 1914–1918 war (WW1); the 1918–1919 Influenza pandemic; the 1930s global depression; the 1939–1945 war (WW2); and, in 2019–2021, the COVID-19 Coronavirus pandemic. This suggests a 1/25 years average return period; that is, the chances of another GCR in the next decade or two are moderately high. There may even be a cascading GCR where the impact of the next GCR is influenced by the occurrence and consequences of COVID-19 (cf. WW1 and the 1918–19 influenza pandemic).
The four GCRs I focus on here are Sea Level Rise (between now and 2100), a pandemic equivalent to the 1918–1919 influenza pandemic, a Volcanic Explosivity Index (VEI) 7 eruption (similar in magnitude to the 1815 eruption of Tambora), and a geomagnetic storm roughly equal in scale to the 1859 Carrington event. These four global catastrophes/natural hazards – one human-exacerbated at the least, one biological in large part, one geological, and one from space – can be expected to produce consequences for the global economy, for multiple countries, and a large proportion of the global population. Each of these GCRs is described in more detail below.
In truth there are a number of catastrophes with global consequences that could meet the short list of criteria for a GCR above – a war, especially a nuclear war, climate change, a gamma ray burst, a meteorite impact, a cyber hack, antimicrobial resistance, a plant disease, and a few of the hazards and consequences listed by the World Economic Forum in annual reports (WEF, 2021). Infectious diseases appear on the WEF Top five to seven Global Risks for the first time in 2021 and it is possible that some of the other four global GCRs considered here are subsumed under “Natural Disasters” or “Natural Catastrophes” which have been included in the top five risks in most years since 2012 (WEF, 2021).
Inevitably, given the scope of this introduction, incomplete vignettes of likely consequences are considered, sometimes moderated by what we think COVID-19 has so far taught us and/or modified by what we thought we knew. While Donald Rumsfeld, former US Secretary of Defense, popularised the expression “Known Unknowns” in a 2012 speech, this assessment of four global catastrophes is much more about “Unknown Knowns” – things we think we understand, but we haven’t thought about their impact and consequences nearly enough or nearly clearly enough. None of these four global GCRs are Black Swans. As Taleb (2008) noted, a black swan event has three attributes: First, it is an outlier, as it lies outside the realm of regular expectations, because nothing in the past can convincingly point to its possibility [my italics]. Second, it carries an extreme impact. Third, it has retrospective (though not prospective) predictability. The four GCRs considered here fail all but the second of these attributes.
Below I define what is meant here by a global catastrophic risk and review briefly potential losses and loss estimation, emphasising the broad range of biophysical, social-economic and cultural strands that should be considered in loss estimation. A range of the physical characteristics of each of the four selected GCRs – sea level rise, a pandemic, a VEI 7 eruption and a severe geomagnetic storm – is considered together with some of the likely potential losses. Some of the similarities and differences between the four GCRs are discussed and a broad semi-quantitative view of the magnitude of potential losses is outlined within a framework that considers the myriad of potential losses. Finally, the four possible pathways that follow from the impact of a GCR are outlined and a brief comparison is drawn between GCRs in the Early Holocene and the Anthropocene.
Global Catastrophic Risks
Many studies of global catastrophic risks focus on outcomes that take the lives of a significant proportion of the human population potentially leaving survivors with reduced resilience (e.g. Avin et al., 2018). Others have focused on Global Catastrophic Biological Risks – risks of purportedly unprecedented scale that could cause severe damage to human civilisation at a global level, magnified by a rapidly-changing interconnected world, political instability, urbanisation, climate change, and rapid technological advances which allow the easier, cheaper and faster engineering of pathogens (GHS Index, 2019, p5).
My concern here broadly follows the definition of Bostrom and Ćirković (2008, p1-2): a catastrophe that caused 10,000 fatalities or 10 billion dollars of economic damage (e.g., a major earthquake) would not qualify as a global catastrophe. A major catastrophe that caused 10 million fatalities or 10 trillion dollars worth of economic loss (e.g., an influenza pandemic) would count as a global catastrophe, even if some region of the world escaped unscathed. As for disasters falling between these points, the definition is vague.
Others have focused on existential risks which threaten human survival, a subset of Bostrom and Ćirković (2008, p3) global catastrophic risks. Or, like Turchin and Denkenberger (2018), associate global catastrophic risks with a death toll of one billion. My present concern is with more than just human health, extending also to all forms of economic activity and to human and environmental wellbeing. COVID-19 exemplifies well the scope of the global catastrophes with which we are concerned – the final human death toll may be less than 10 million, but the accumulated costs to the economies of the world easily exceed several trillion dollars, and there have been marked downturns in employment, in lifespan, and in well-being in a significant number of countries.
Figure 1 illustrates the reach of global catastrophes. The concern is not just with human health or with the biophysical hazard per se, but also with the associated biophysical hazards that cascade from the initiating event – secondary associated hazards such as storm surge, pyroclastic density currents, tsunami, ground deformation, and/or atmospheric warming or cooling. Biophysical impacts extend to terrestrial and marine ecosystems, agriculture, food and feed supply, and water quality and availability. Built environment impacts occur on buildings, infrastructure and networks with cascading consequences potentially extending to biomass and energy prices, transport and financial markets and clean-up and restoration. Human impacts include not only morbidity and mortality but also disease, and the possibility of unemployment, changes in equality, marginalisation and migration. In turn, societal impacts may include social conflicts at household, community and country levels with the possibility of new government regulations and expenditures. In a longer time frame cultural impacts include the establishment of memories or commemorations of the event and its aftermath, adjustments to political, democratic, religious and legal systems, and ultimately alter the pace and nature of adaptations and innovations. As implied in Figure 1 there are interconnections, cascading consequences and feedbacks between the biophysical, human, economic, social and cultural strands.
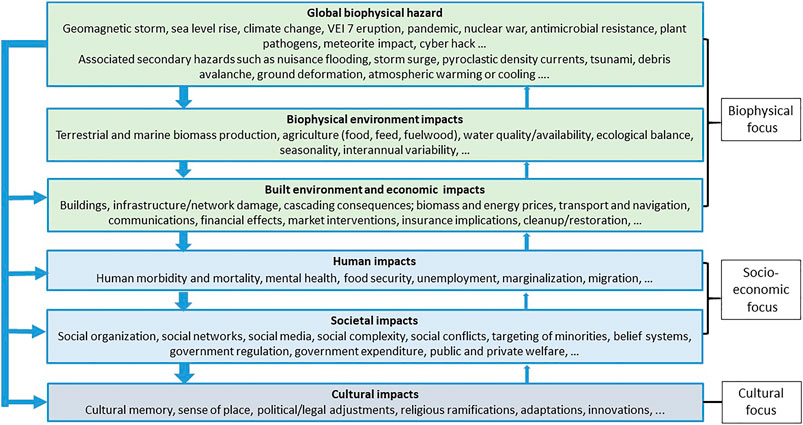
FIGURE 1. The biophysical, social-economic and cultural strands of a global catastrophic risk (based on Luterbacher and Pfister (2015), Torrence (2019)).
Equally, as the risks considered here are global catastrophes but less than existential, the range of impacts or consequences for one community, country, region, or continent may differ markedly from those in adjacent communities/continents.
Potential Loss and Loss Estimation
A review article assessing the costs of natural hazards based on the views of 60 experts reveals just how complicated assessing losses is Meyer et al. (2013). These authors settle on dividing losses into tangible and intangible (non-market) losses with each of these categories subdivided into damage costs – Direct, Business interruption, and Indirect – and Risk Mitigation costs (also divided into Direct and Indirect). This division results in 10 cost categories though the category Indirect Intangible Risk Mitigation costs contains no examples. A sizable proportion of the impact strands in Figure 1 would fall into intangible categories.
Further, using the value of property damage as a key metric for summing losses and/or devising mitigation strategies biases the view of damage towards the wealthy – measuring damage as a percentage of total value or losses as a share of household wealth can present a different view of risk (Hino and Nance, 2021).
Reinsurers also provide a view of the losses associated with extreme events, though their concern is entirely with tangible losses and, usually, only with the insured portion of dollar losses. In 2016 terms the world’s biggest insurance loss event to date had been Hurricane Katrina, with estimated losses around USD 81 billion (Swiss Re, 2018).
In the 2017 Berkshire Hathaway Annual Report (p8), Warren Buffett noted “We believe the annual probability of a U.S. mega-catastrophe causing $400 billion or more of insured losses is about 2%. [i.e., an average 50 years return period]. No one, of course, knows the correct probability.” Vijay Padmanabhan (Vice President of Marketing at Applied Insurance Research - AIR) ran AIR models and estimated that a $400 billion insured loss in the United States had an Annual Exceedance Probability between 0.1 and 0.01% (i.e., a return period between 1,000 and 10,000 years)1. AIR’s 2017 Global Modeled Catastrophe Losses (AIR, 2017) indicates a global insured loss of USD 325 billion has a 250 years return period (p.6).
Warren Buffett and AIR may well be talking about different things (insured losses versus modelled insured losses). AIR certainly exclude insured life losses while it is unclear whether Warren Buffet included these or not. Both Buffett and Padmanabhan were referring just to the United States; neither considered losses that occur from events that span more than one continent.
Swiss Re uses “insured losses” to refer to insured losses excluding liability. The term also excludes insured life loss, though this is not stated. “Economic losses” are losses due to property damage and business interruption that are directly attributable to major events. Insured losses are a subset of, and are included in, economic losses (Swiss Re, 2018), Sigma, 1/2018. For the more than 90 catastrophe events included in Sigma reports for 2015–2017, insured losses average 48 ± 25% of economic losses with a range extending from 1.5 to 82.5%, the range reflecting not only variations from region to region and from peril to peril but also, no doubt, the quality of the estimates of economic losses. In a very approximate sense we can regard economic losses, on average, as roughly twice insured losses. Hence my interest here in global catastrophes that produce economic losses of several USD trillion. As global GDP is a little under USD90 trillion2 my interest focuses on catastrophic risks that produce losses exceeding 1% of annual global GDP.
Clearly, assessing the losses stemming from global catastrophic risks is difficult; estimates in dollar or GDP terms are likely to be only very approximate. Methods and divisions commonly employed for assessing losses in extreme events either by researchers or reinsurers seem problematic and far from complete. Further, such measures capture only part of the losses – as implied in Figure 1 measures as diverse as a gauge of food security, the proportion of the population above or below the poverty line, changes in average lifespan, or even a happiness index, may be equally appropriate for evaluating the consequences of global catastrophic risks. Torrence (2019, p259) provides a list of 13 key variables invaluable for assessing impacts, vulnerability, and resilience – many of these have been incorporated into Figure 1.
Four Global Catastrophes - Physical Characteristics
In their 1978 book The Environment as Hazard, Ian Burton, Robert Kates, and Gilbert White – co-stars and icons of early natural hazards research – recognised the difficulty of comparing the magnitude, severity, intensity, or damage potential of different natural hazards. They ‘profiled’ three hazards – drought, blizzard, and earthquake – using a continuum for each of six characteristics (Burton et al., 1978):
• Frequency Frequent – Rare
• Duration Long – Short
• Areal Extent Widespread – Limited
• Speed of Onset Slow – Fast
• Spatial Dispersion Diffuse – Concentrated
• Temporal Spacing Regular – Random
Subsequent studies (e.g. Leroy, 2006; Riede, 2019) have improved little on this physical characterisation (although a range of societal characteristics/impacts have been added), thus emphasising the difficulties in comparing very different hazards in a quantitative framework. Here I also offer limited improvements in characterising the four global catastrophes. Figure 2 provides a shorthand assessment of expected physical characteristics of four “average” or moderate global GCRs (rather than extreme geophysical risks). The focus is on the first box – Global Biophysical Hazard – in Figure 1.
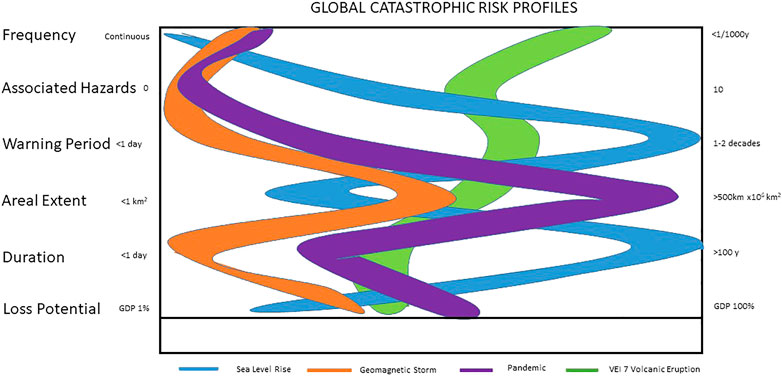
FIGURE 2. Global Catastrophic Event Profiles based on selected physical characteristics. Expected values are indicative rather than prescriptive.
Frequency is simplified on a (logarithmic) scale ranging from “Continuous” – as is more or less the case for sea level rise – to “<1 event/1,000 years.” A VEI 7 volcanic eruption has a frequency of roughly twice in 1,000 years, while both pandemics and geomagnetic storms of the magnitude discussed here occur approximately once in 100–200 years on average.
Associated hazards refers to physical events that are associated with the primary hazard or are a direct physical consequence of the initial event. The scale varies, nominally, from 0 to 10 associated hazards. For example, sea level rise has four associated hazards – an increase in the scale and frequency of nuisance flooding and an increase in the height and frequency of storm surges, coastal erosion, and groundwater rise. It is not directly relevant here that nuisance flooding and storm surge may (or may not) increase in frequency as a result of other consequences of global warming – these potential changes are not under consideration here. Neither geomagnetic storm nor a pandemic are considered to have any direct associated physical hazards3. On the other hand a VEI 7 eruption is likely to have four or more additional physical effects. The eruption itself, characterised by the occurrence of pyroclastic density currents (PDCs), airfall tephra (volcanic ash), and atmospheric shock waves (all with a duration of less than a week) may be preceded by or followed by smaller eruptions which could continue for years. The main eruption is likely to be preceded by ground deformation and earthquakes large enough to damage nearby physical property. The collapse of the eruption column or the collapse of a sector of the volcano itself in a coastal locale is likely to produce tsunami experienced on coasts possibly extending across half the globe. Redistribution of volcanic ash by lahars, wind and rain is likely to continue for several years. Most significantly, the megatons of sulphur dioxide injected into the upper atmosphere is likely to induce global cooling with potentially severe consequences for half or more of the globe for 3–5 years.
Warning Period is shown on a scale ranging from <1 day to 1–2 decades. We have known about the current rate of sea level rise for several decades while, with current technologies, we are unlikely to have more than a few days’ notice of the arrival of a major geomagnetic storm. Similarly, there are likely only a few weeks warning that an incipient epidemic could become a global pandemic. A VEI 7 volcanic eruption is likely to provide a year or two of increased earthquakes, raised fumarole temperatures, and ground deformation before the eruption begins; however, the period in which it is clear that these precursors herald a very large eruption rather than just an eruption is likely to be only weeks rather than years.
Warning Period here refers to a specific event. In a general sense, because each of these four global catastrophes has an average return period of less than a few hundred years, we have already been warned to expect the not infrequent occurrence of these global catastrophes – that seems to have escaped the attention of almost everyone with executive authority. As noted earlier, these catastrophic risks are not black swans.
Areal Extent is shown on a scale ranging from <1 km2 to >500 million km2, the latter roughly the surface area of the earth. A pandemic is likely to affect almost all land areas of the earth, though this could be discounted by areas that are barely populated (Antarctica for example). The direct physical effects of sea level rise in most areas are unlikely to extend more than a few hundred metres to a few kilometres inland from the coast – a relatively limited portion of the earth’s surface area. The area directly affected by a geomagnetic storm depends, in part, on the duration of the storm and the earth’s rotation. Further, Areal Extent is not a particularly appropriate measure of the direct impact of a geomagnetic storm as some of the direct effects will occur in space (on satellites, and possibly, aeroplanes). Similarly, areal extent is problematic for a VEI 7 eruption; the direct physical effects of a less-than-1 week-long eruption, including pyroclastic density currents, ash fall, and possible tsunami, are likely to impact less than 3–5 million km2. Redistribution of the massive volume of erupted products by erosion and lahars will occur over several years over an area of just a few tens of thousands of square kilometres. However, atmospheric cooling induced by the injection of vast amounts of sulphur dioxide into the upper atmosphere will likely last several years, with direct effects on a half or more of the earth’s surface (Figure 2).
Duration refers only to the duration of the physical event; the likely enduring economic, social and cultural consequences of the event are not considered. The duration scale extends from <1 day to more than 100 years. Thus a severe geomagnetic storm is likely to last less than a few days, while sea level rise will continue beyond 100 years – even if greenhouse gas emissions were suppressed to pre-industrial levels immediately, the slow response of the thermal mass of the oceans will ensure that sea level will take even longer to return to early 20th century levels. While the duration of a VEI 7 eruption, or at least the truly catastrophic part of the eruption, is likely to last less than a week, direct physical effects resulting from lahars (volcanic mudflows), rain and wind erosion of volcanic deposits and a period of atmospheric cooling are likely to continue for several years or more. The direct physical impact of a global pandemic, as COVID-19 has shown, is likely to last at least several years.
Loss Potential is little more than a general concept and provides only a broad view of Severity or Intensity of the consequences of each of the global catastrophes. On Figure 2 Loss Potential is shown on a scale ranging 1–100% of Global GDP, the latter roughly USD 90 trillion. Loss potential is intended here to represent the consequences of a “middle-sized” global catastrophe rather than an “extreme” GCR event. It is a general summation of all the consequences that might arise from the impact of the hazard across seven broad sectors – human health, social impacts, buildings, infrastructure, agriculture, other economic activity, and the environment – or, more generally, as shown on the lower five boxes on Figure 1.
For a pandemic loss potential might be dominated by human morbidity and mortality or the effects on economic activity. For a VEI 7 eruption the majority of the damage potential might lie with a decline in global agricultural production and the effects, including human deaths, following from that decline. The loss potential of both geomagnetic storms and sea level rise might initially result from the effects on infrastructure and economic activity. More particularly, loss potential extends across all five lower boxes in Figure 1; it is likely that the bulk of the losses are indirect and/or intangible.
Figure 3 considers, in a schematic way, variations in loss potential with time as each global catastrophe and associated hazards play out. It is important to recall that I am dealing here only with the direct physical impacts of a GCR.
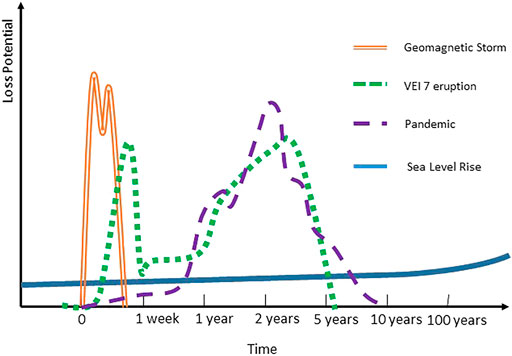
FIGURE 3. 4 Global GCRs – a schematic of the duration of the physical event initiating four global catastrophes and loss potential. Note the time intervals per unit width on the X-axis vary from 1 week to 90 years. The Y-axis Loss Potential scale has no units here; it encompasses the potential consequences in the five lower boxes on Figure 1.
Only broad patterns are represented on Figure 3; note the varying time scale on the X-axis. The severity of global sea level rise has already begun, increases inexorably, and continues beyond the 100 years’ timeframe shown here. A geomagnetic storm may have several peaks (possibly affecting different parts of the world) but is unlikely to last more than a few days. A pandemic may also exhibit several waves, affecting different parts of the world, and last 3–5 years or longer. As noted earlier, the main phase of a VEI 7 eruption producing widespread PDCs and extensive ash fall is unlikely to extend longer than a week, will possibly include a tsunami with near-hemispheric consequences, but will be followed by i) redistribution of the ash by lahars, rain and wind across tens of thousands of square kilometres during the next year or two; and ii) atmospheric effects including cooling and anomalous weather across large portions of the globe likely to continue for 3–5 years.
While the relative durations of each of these direct physical effects is likely to vary considerably from those portrayed, the relative loss potential of each of these GCRs is likely to be even less constrained both in time and space. Implicit in the scale of loss potential are questions about whether this is a measure of human deaths, hospitalisations, building and/or infrastructure damage, the growth in unemployment, restrictions on mobility, some measure of economic loss, a range of social factors including inequality and happiness, or some combination of these and other outcomes. The human, societal and cultural impacts (lower three boxes on Figure 1) are likely to continue long after the direct physical impacts have retreated into the background.
Sea Level Rise
The physical characteristics of sea level rise can be summarised as continuous rather than rare to frequent, with a very slow onset but a very long duration, and limited to a narrow but concentrated area. Temporal spacing hardly applies. This combination of physical characteristics suggest sea level rise is different to other global catastrophic risks (Figures 2, 3).
Sea level has been rising slowly over the last century. Global mean sea level (GMSL) is expected to rise between a minimum of 30 cm and a maximum of 280 cm by 2100. A rise of 50 cm has a probability varying 49–96% depending on which model is used (US Global Change Research Program, 2018). About 45% of the rate and about 90% of the acceleration in the altimeter (GRACE) record is due to ice mass loss from Greenland, Antarctica, mountain glaciers and small icecaps with the rest due mainly to thermal expansion Nerem and Fasullo (2019). Relative mean sea level rise on individual coastlines can vary considerably from GMSL depending on water temperature, nearby ice melt, strength of ocean currents, fluid extraction (water and oil), storm tracks and storm frequency, El Niño Southern Oscillation phase, Pacific Decadal Oscillation phase, and continuing isostatic-tectonic adjustments from the last glacial maximum.
1900–1990 global mean sea level rise is regarded as 1.1–1.5 mm/y, but for the last 25 years the rate has been about 3 mm/y (Bamber et al., 2019). Extrapolation of these rates to 2100 suggests a rate of ∼10 mm/y by the end of the century (Nerem and Fasullo, 2019). Since the US Global Change Research Program, 2018 report appeared, it has become clear that East Antarctica outlet glaciers are melting at a hitherto unsuspected rate, suggesting the min and max limits above may need to be raised. The largest mass contribution to sea level rise (SLR) since the 1990s has been ice sheet melting, but this is also the largest source of uncertainty; global total SLR >2 m by 2100 for a high emission scenario lies within the 90% uncertainty bounds developed using structured expert judgement (Bamber et al., 2019). More extreme scenarios may be more realistic than recently supposed.
While the direct consequences of sea level rise are limited to a narrow coastal zone, often less than a few hundred m in width, a 2019 estimate of the global population at risk from sea level rise by 2100 reached 190 million people (Hino and Nance, 2021). Hooijer and Vernimmen (2021) estimate the land below 2 m + Mean Sea Level at 1.05 × 10⁶ km2 (just over 1% of the land area of the Earth) and the population in this zone at 267 million. Populations and economic activity are often concentrated on the littoral, particularly the tropical littoral. For example, in California only 0.3% of the state’s land area but 6% of the State’s GDP will be impacted by 2100 by dynamic sea level rise including sea level rise, tides, waves, storm and coastal change (beach erosion and cliff retreat) (Barnard et al., 2019). Thus, indirect consequences are likely to have a near-global effect, with the consequences for human health, buildings, infrastructure, agriculture, other economic activity, and the environment increasing over time.
Nuisance flooding refers to low levels of inundation that pose few significant threats to human safety but disrupts daily activities and causes minor damage to property and infrastructure (Moftakhari et al., 2018). In the context of global sea level rise, nuisance flooding can be expected to increase in frequency with associated increases in riverine flooding near the coast, enhanced salting of soils and enhanced salt water damage through groundwater rise to infrastructure, equipment, property and other assets.
Based on NOAA gauges, the return period for nuisance flooding at San Francisco was about once in 3–10 years in 1950, but once in 3–6 months in 2012, increasing to 4–5 days per month in 2100 under the trend scenario, to more than 20 days per month under more extreme but realistic scenarios (US Global Change Research Program, 2018, p348). In Annapolis, Maryland (on Chesapeake Bay) current high tide flooding reduces visits to the historic downtown area by 1.0–2.6% measured by variations in parking meter revenue. A 7–30 cm sea level rise would reduce visits by 3.6–24% respectively, with increases in both flood height and flood duration reducing parking revenue (Hino et al., 2019).
Barnard et al. (2019) have shown the importance of combining the relatively minor rises in sea level and spring tide by 2040 with the same conditions exacerbated by the 100 years storm in California. The economic costs of future projected flooding is about an order of magnitude greater than the two most expensive natural disasters in California’s history – the 1989 Loma Prieta earthquake, and the 2017 wildfires, and roughly equal in cost to a repeat of the 1861–62 ARkStorm which today would cause more than $300 billion in property damage (Porter et al., 2010). Further this cost estimate doesn’t include ripple effects across economic sectors resulting from closure of ports, disruption of transport and goods, business closures and impairment of infrastructure (Barnard et al., 2019).
Sweet et al. (2013) put the widespread damage and functional disruption to critical infrastructure including mitigation from Hurricane Sandy (October, 2012) at USD60.2 billion. Hurricane Sandy provides a fine example of the impact of a storm surge, fairly extreme in terms of the damage wrought, but an illustration of the numerous storm surges that occur globally each year. The storm surge coincided with peak high tide at Battery Point on the southern end of Manhattan (Sweet et al., 2013) with the surge reaching 4.3 m above mean lower low water (Rosenzweig and Solecki, 2014). While Sandy was only a Cat 1 hurricane with a central pressure of 940 mb combined with a slow forward speed of 18 km/h (Tennis, 2013) the area hit accounts for 23% of national GDP (Tennis, 2013).
The return period for Hurricane Sandy’s flood height at Battery Point has been estimated for various time frames – once in ∼1,200 years in 1800, once in ∼400 years in 2000, and once in ∼90 years in 2100 (the latter estimate varying from ∼23 to ∼130 years depending on the climate model utilised). Alternatively, a flood with Sandy’s estimated return period of 398 years in 2000, would have reached only to 2.3 m in 1800, but 3.7 m in 2100 but varying 3.5–4.3 m when storm climatology is also accounted for Lin et al. (2016).
The major impacts of Hurricane Sandy on human health, buildings, infrastructure, other economic activity and the environment have been detailed by Rosenzweig and Solecki (2014), Smythe (2013), and Platt (2013).
Without adaptation 0.2–4.6% of the global population will be flooded annually by 2100 with a 25–123 cm GMSL rise. Expected annual losses range 0.3–9.35% global GDP (Hinkel et al., 2013), though these estimates rely on lesser sea level changes than now expected. Others have interpreted sea level changes of less than a 1 m rise could place USD21-210 trillion in global assets in the 100 years flood zone by 2100 (Goldstein et al., 2018).
More recently, Kirezci et al. (2020) have produced what they call a “first pass estimate” which assesses assets currently at risk from coastal episodic flooding at USD6.4–9.1 trillion, approximately 9–13% of global GDP. The RCP 8.5 (high emissions) scenario would increase the land area at risk of episodic coastal flooding by 48% by 2100 for the 1/100 years return period event. These estimates assume no coastal defences are in place so they indicate the scale of the investment required to offset the increase in risk. They attribute 32% of the increase to sea level rise, 63% to tide and storm surge and 5% to wave setup, noting that most of the world’s flooding associated now with the 1/100 years event could occur as frequently as 1/10 years in 2100.
A Pandemic Equivalent to the 1918–1919 Influenza Pandemic
The annual risk of a pandemic similar in scale to that of 1918 is often considered to be in the range 0.5–1.0%, an average recurrence interval of once in 100–200 years (Burns et al., 2008; Fan et al., 2018). However, Marani et al. (2021), identify 217 epidemics with known occurrence, duration and number of deaths between 1600 and 1945 and use a generalised Pareto distribution to show that that the mean recurrence time of a pandemic with the same intensity as the 1918 pandemic is about 400 years. They also show a pandemic similar in intensity to COVID-19 (with a death toll of 2.5 million at the time of writing), has a probability of occurring in one’s lifetime of about 38% - a probability that may double in coming decades (Marani et al., 2021).
Eisenberg (2020) suggests death totals for previous pandemics:
Black Death 1342–1351 200 million.
Smallpox 1520 56 million.
Great plague 17th century 3 million.
Spanish Flu 1918–1919 40–50 million.
HIV/Aids 1981-Present 25–35 Million
Additionally, the Spanish invasion of Mexico produced epidemics of smallpox, measles, typhoid, and mumps in Mexico between 1520 and 1590, killing an estimated 19–21 million people4 (Gamble et al., 2021). This suggests there have been seven or more significant pandemics (including COVID-19) that have killed at least a few million people in the last 700 years; as global population has increased from about 400 million to about 7.5 billion in that time, all the preceding pandemics have had much higher death rates than COVID-195.
The 1918–19 pandemic killed around 50 million people (Short et al., 2018) at a time when global population was less than 2 billion; some estimates suggest total deaths were much higher. Pre-COVID scenarios envisaged that a pandemic similar to the 1918–19 influenza pandemic would spread around the world in about 180 days, infect up to 35% of the global population, kill perhaps 2.5% of the infected population (that is, about 65 million people, though some authorities put the likely death toll at more than 200 million). The lower estimates assume that efforts to limit the spread of the virus are no more effective than in previous epidemics (Burns et al., 2008; Fan et al., 2018). On the plus side our understanding of viral, genetic, and immune factors has advanced enormously; however, lifestyle, lifestage, underlying diseases and infections complicate the pattern of severity and transmission (Short et al., 2018).
The complex interplay of three groups of factors influence the severity and transmissibility of a pandemic influenza virus (and, presumably, of other viruses): Viral factors include low-high pathogenicity, transmission routes from animals to humans, reassortment, human-to-human transmission, and subsequent changes in virulence. Host factors include lifestage from the naïve young to the immune-senescent old, lifestyle (e.g., pregnancy, obesity), underlying diseases and immune status. External factors influencing severity and transmissibility encompass underlying infections, lifestyle (living conditions, mass gatherings, mobility), pharmaceutical interventions (antivirals, vaccines), and non-pharmaceutical interventions including facemasks, quarantine, and handwashing (Short et al., 2018).
While it is still too early to assess how COVID-19 compares with the influenza pandemic of 1918–19 two trends seem likely – even assuming the global death toll doubles or triples before the end of 2022, this pandemic, in terms of human deaths (the most common measure of pandemic severity), is roughly an order of magnitude less severe than the 1918–19 event. For example, Fan et al. (2018) place the excess death rate from the 1918–1919 pandemic at 1.1%, though they believe it was probably considerably higher than that. This suggests that a 2020–2022 repeat of the 1919 pandemic would produce a death toll of at least 86 million, an outcome that, in the COVID-19 world of mid-2021, seems unlikely.
However, COVID-19 appears to have produced knock-on effects with global disruption to other health services. Roberts (2021) notes that WHO estimates an additional 0.5 million people have died from Tb as prevention and treatment regimes have been disrupted by closure of clinics, reassignment of health workers to fight COVID, and delays in shipping medicines and devices. Programs targeting measles and polio have also been disrupted.
Secondly, in terms of economic and social effects, COVID-19 is certainly a multi-trillion dollar event – probably an order of magnitude (or more) greater than that of the 1918–1919 pandemic.
Whether pandemic severity is measured by human deaths, by economic losses, or by some combination of consequences (Figure 1), influences estimates of the frequency of pandemics similar is severity to the 1918–19 influenza pandemic. Here I assume that both the 1918–19 and the COVID-19 pandemics are roughly one-in-100–200 years events. However, we note that changes in Viral, Host, and External factors such as increased animal-human contacts, increased and older populations, globalisation, and greater mobility may more than offset improvements in pharmaceutical interventions so that the potential for severe pandemics may be increasing (as Marani et al., 2021 suspect).
As Figures 2, 3 suggest a severe pandemic is likely to have a duration of several years, possibly five or more years, before the rate of viral infections returns toward background levels. Given the mobility of a section of the global population, sometimes less than effective leadership, incomplete compliance with lockdowns and other measures designed to reduce transmission, the speed of onset reaches the stage where large proportions of the globe will be affected within a few weeks to months. While some sections of the earth may resist infections for as much as a year or two (e.g., Antarctica), eventually the infection will be truly global – a characteristic which may differentiate pandemic from the other global catastrophes considered here (Figure 2).
As we have discovered with COVID-19, the principal impact is not mortality but morbidity, leading to a reduction in consumption of many goods but stockpiling of others, restriction of movement with major effects on tourism, travel, hospitality, entertainment, transport, journey-to-work, exports and imports. Perhaps the most striking impact is in increases in inequality. Furthermore, about 10% of people infected with COVID experience long COVID with the most common symptoms including fatigue, post-exertional malaise, and cognitive dysfunction sometimes for a year or more (Marshall, 2021).
Mortality is also likely to be but a small part of the costs of a pandemic. Burns et al. (2008) suggest only 12% of the economic impact of a pandemic will be due to mortality, 28% to illness and absenteeism, and 60% due to efforts to avoid infection. Keogh-Brown et al. (2010) modelled the macroeconomic impact of an influenza pandemic on the United Kingdom, France, Belgium and the Netherlands. Their modelling suggests limited effects on agriculture with the rest of the economy experiencing a 5–7% decline, assuming 13 weeks of school closures and 4 weeks of prophylactic absenteeism from work averaged across the four countries.
The US Congressional Budget Office estimates the macroeconomic effect of a severe influenza pandemic similar to the 1918 Spanish flu to be a loss of 4.25% of GDP. By comparison, during the Great Recession (2007–2009), the U.S. economy contracted by approximately 3%6. Recent analysis from the World Bank suggests that the annual global cost of moderately severe to severe pandemics is roughly USD 570 billion, or 0.7% of global GDP; a very severe pandemic like the 1918 Spanish flu could cost as much as 5% of global GDP, or nearly USD 4 trillion7. Cutler and Summers (2020), working on the (possibly erroneous) assumption that the COVID pandemic in the United States will be largely contained by the fall of 2021, placed the economic cost of the pandemic (to the United States) at USD16.1 trillion. This total includes USD7.6 trillion in lost GDP from unemployment and subsequent business revenue declines, USD4.4 trillion in the cost of premature death (allowing a conservative USD7 million for each death), USD2.6 trillion in long-term health impairment, and USD 1.6 trillion in mental health impairment. In total these costs, effectively summed over 2 years, reach about 90% of US annual GDP.
It is probably impossible (and pointless?) to compare any of the above estimates. However, the available literature pre-COVID-19 can be interpreted to suggest a decline in global GDP of 5–6% in the event of a severe pandemic. With global GDP at about USD90 trillion, this suggests an economic loss of USD5 trillion. While it is too early to forecast global GDP decline due to COVID-19 there are indications that it will be much larger than 5–6%. In any case, economic consequences seem poorly related to the death toll, or the severity of the outbreak, and more to governmental concerns and responses. Large economic losses are driven by human behaviour (which is very hard to model) – affected by people’s valuation of their own health status, family, relationships, work, social activities that affect decision making and exposure to disease8. Human actions are often not predictable, but they are interconnected (NAS, 2018, 35ff).
A VEI 7 Volcanic Eruption
A Volcanic Explosivity Index (VEI) 7 eruption produces at least 100 km3 of eruptive product, primarily ash fall and pyroclastic density currents (Newhall and Self, 1982). The most recent VEI 7 eruptions were from Tambora (Indonesia) in 1815 and Samalas/Rinjani (also in Indonesia) in 1,257. Proximal to the volcanic source (say, within 100 km), pyroclastic density currents and thick tephra (ash) falls obliterate all life and the built environment. Tephra, drifts downwind with deposits as thin as a few mm at a distance of up to 1,000 km damaging plants/crops and animals/livestock, and producing relatively minor building and infrastructure damage. The area proximal to the volcano is likely to be further devastated in the years following the main phase of the eruption by erosion and redeposition of the PDCs and airfall tephra (Figure 3). VEI 7 eruptions inject megatons of sulphur dioxide into the atmosphere, creating sulphate aerosols which circle the globe and backscatter incoming solar radiation. The reduced solar radiation generates surface cooling, altered atmospheric and oceanic circulation patterns linked to semi-global phenomena including the Atlantic meridional overturning circulation, ENSO, the Pacific Decadal Oscillation, tropical monsoons and associated variable direct and indirect consequences at regional scales (Brönnimann and Krämer, 2016).
The atmospheric perturbations of the 1815 Tambora eruption, for example, resulted in crop failure in parts of Europe and the northeastern United States, the latter often described as the “year without a summer” (1816). A range of other possible global consequences have been elucidated by Wood (2014). It seems likely that the Samalas/Rinjani eruption in 1,257 triggered the onset of the Little Ice Age with subsequent VEI 6 eruptions sustaining it for several centuries (Newhall et al., 2018).
VEI 7 eruptions occur on average about twice in a thousand years, possibly a little more frequently as the magnitude of some large eruptions in the last few thousand years remains unclear. Additionally, some VEI 6 eruptions have produced similar atmospheric effects; for example, the twenty largest volcanic eruptions in the last 2000 years have produced summer temperature anomalies in the northern hemisphere of >0.4°C and lasting for about 5 years (Büntgen et al., 2016). Newhall et al. (2018) have identified 125 volcanoes around the world that appear capable of producing VEI 7 eruptions.
The magnitude of deaths and economic losses around the world are hardly quantified. Deaths on Sumbawa and neighbouring Indonesian islands resulting from the Tambora eruption have been placed at 92,000, mainly from PDCs and subsequent starvation. Deaths probably also occurred in the north eastern United States and in Europe as a result of poor harvests. Some authorities maintain mass deaths occurred in India following a cholera epidemic were occasioned by the eruption (e.g., Wood, 2014). The 1,257 eruption of Rinjani has been associated with cold summers in Europe and parts of Asia (Stothers, 2000); mass deaths in Europe have been attributed to poor harvests but there is also evidence that the poor harvests and deaths began before the eruption (Campbell, 2017; Ludlow, 2017).
Whatever the consequences of past VEI 7 eruptions, we can be fairly certain that the area within about 100 km of the source (that is, an area of about 30,000 km2) of future eruptions will be completely devastated by PDCs with temperatures of several hundred degrees Celsius moving at velocities of us to several hundred km/hour, burying the built and/or natural environments under tens of metres of pyroclastic flows and tephra falls. In volcanic source areas such as Japan, the west coast of North America, the Philippines and Italy the human deaths might be in the tens of thousands or more and economic losses would likely be in the trillions. For some source volcanoes in parts of Alaska, eastern Russia, and Papua New Guinea the losses might be comparatively minor. Recovery, if possible, may take decades; the area of Katmai National Park, Alaska devastated by the Katmai-Novarupta VEI 6 eruption in 1912, and the area around the former US Clark Air Base in the Philippines destroyed by the 1991 VEI 6 of Pinatubo provide examples (Griggs, 1922; Newhall and Punongbayan, 1997).
The area affected by downwind tephra fall ranging in thickness from as much as a metre to just 1 mm may exceed 400–500,000 km2. Unpublished data suggest human death rates ranging from about 5% from a 40 cm tephra fall to about 0.02% for a fall of 1–2 mm. Similarly, building and infrastructure losses averaged across the whole area of tephra fall might average 3–5%. Crop losses are likely to be much more substantial ranging 20–100% in areas receiving more than 10 cm of tephra to 0–20% in areas receiving more than 1 mm of ash with actual losses very dependent on crop type, growth stage, the aerosol components attached to the tephra, subsequent rainfall, and the effects of the tephra on beneficial and predator insects. Moreover, as Wilson et al. (2015) indicate a fall of more than 30 cm of tephra is likely to result in the retirement of agricultural land for at least several years.
However, it is the longer term climatic consequences of a VEI 7 eruption that are of major interest, particularly those shown to produce summer temperature anomalies across the globe and over a period of 4–5 years (Büntgen et al., 2016). Much of the evidence is anecdotal with actual consequences dependent on prior conditions as well as the actual temperature anomaly. Puma et al. (2015) have modelled the potential impacts of seven historical eruption on contemporary wheat, maize, rice, and soybean harvests. They show, for example, that the potential annual production losses from the Laki fissure eruption (Iceland, 1783; a VEI 4 eruption) are equivalent to the annual food consumption of 2.9 billion people on a caloric basis, assuming the world average diet of 2,940 kcal per capita per day for 2015. Estimated annual production losses for a repeat of the Tambora eruption are equivalent to the dietary intake of about 2 billion people, Samalas 0.7 billion people, and for Huaynaputina (1601, Peru, a VEI 6 eruption) about 2.6 billion people9. These results should be regarded as preliminary; further research is required to confirm the magnitude of these potential losses, explore the potential consequences for other food crops, and to ascertain the longevity of such shortfalls in the current environment where global food production and global food demand are finely balanced.
While VEI 7 eruptions appear to have an average recurrence interval around 500 years, VEI 6 eruptions occur around twice per century. Eruptions capable of producing possibly enormous death tolls and economic losses of substantially more than USD 1 trillion may well have average recurrence intervals closer to once in 100–200 years.
Geomagnetic Storm
Space weather describes variations in the Sun, solar wind, magnetosphere, ionosphere, and thermosphere. While a range of space weather events could produce global catastrophic risks, the most important are Coronal Mass Ejections (CMEs) – massive high speed bursts of charged particles and magnetic fields ejected from the sun with strong south-pointing magnetic fields intensifying electric currents that flow within the magnetosphere causing rapid changes in the earth’s magnetic field (Lloyds, 2010; Oughton, 2018). The 1859 Carrington event was a CME with visible aurora recorded at geomagnetic latitudes as low as 20o (Oughton et al., 2017). Chapman et al. (2020) suggest a Carrington class storm has a 0.7% chance of occurrence per year. It is possible to forecast CMEs 6–8 h before they reach the Earth, though the warning period would be less for a fast CME in a superstorm. CMEs are the most important space weather events where long-term damage is the concern (Oughton et al., 2017)10. Solar radiation storms (solar energetic particle events) are bursts of charged particles at very high energies capable of damaging electronics and power systems in satellites and disrupting digital systems in aircraft. They can pose a significant health risk for airborne humans (Lloyds, 2010). Büntgen et al. (2018) believe the 774–775 AD event recorded as anomalies in 14C in tree rings and as anomalous levels of 10Be, 36Cl and other cosmogenic radionuclides in ice cores resulted from a solar energetic particle event. Frolov et al. (2018) calculate the particle fluence in the 775 AD event had to be tens – hundreds times greater than in the modern powerful solar particle events in 1956 and 1972.
Solar radiation bursts are strong bursts of natural radio emissions that occur, for example, during CMEs. They have the potential to interfere with modern wireless technologies such as satellite navigation, wireless internet, mobile telephones, and short-range device controls (such as SCADA – Supervisory Control and Data Acquisition – systems, which are everywhere today in lifelines, industry, and even homes) (Lloyds, 2010).
Solar flares are spectacular explosions on the Sun’s surface sometimes associated with CMEs. The effects on Earth are limited (perhaps 10–20 min), absorbing HF radio waves across the whole sunlit side of the earth. GPS receivers can calculate positions that may be wrong by several metres (Lloyds, 2010). Absorption of HF radio waves is probably becoming of less significance as more communication is satellite-based (Hapgood, 2017).
As Oughton (2018) notes: When these primary forms occur in combination, the time line of impacts is likely to unfold as follows. Earth may first be bombarded with initial radiation (such as X-rays) from a solar flare approximately 8 min after the event on the surface of the sun. A second barrage of very high-energy solar particles (SEPs) may then arrive some 10s of minutes later. Finally, a large CME may reach Earth somewhere between 1 and 4 days later, depending on the speed of travel through interplanetary space. The magnetic field in the CME is likely to lead to a geomagnetic storm that may also last for multiple days as it drives huge electrical currents, especially at high geomagnetic latitudes, leading to bright auroral displays. Often two CMEs may be released in quick succession, and analysis of past events suggest that this dual occurrence often leads to the most extreme impacts, as indicated by aurora occurring at low latitudes.
A severe geomagnetic storm (also known as a space weather event) on the scale of those in September 1859 or May 1921 would be likely to instantaneously disrupt modern life across a large area, with failure of the electrical grid, potentially damaging large transformers which can take months to years to replace11 (Figure 4). Loss of electric power would shut down most transport services, if not immediately, then within a few days when it became necessary to pump fuel. This failure would also affect water supply, sanitation, heating/cooling, medical services, and communications (including mobile phones, internet services, and financial services). Back-up generators will only work until they need refuelling. Food supply would dwindle as supermarkets and other retail outlets rely on electronic transactions and fuel for transport of goods. “Sustained loss of power could mean that society reverts to 19th century practices” (Lloyds, 2010, p15). As so much of western society relies on just-in-time services, it is hard to see many societies maintaining current norms for much more than a week; civil unrest, in various forms, should be expected.
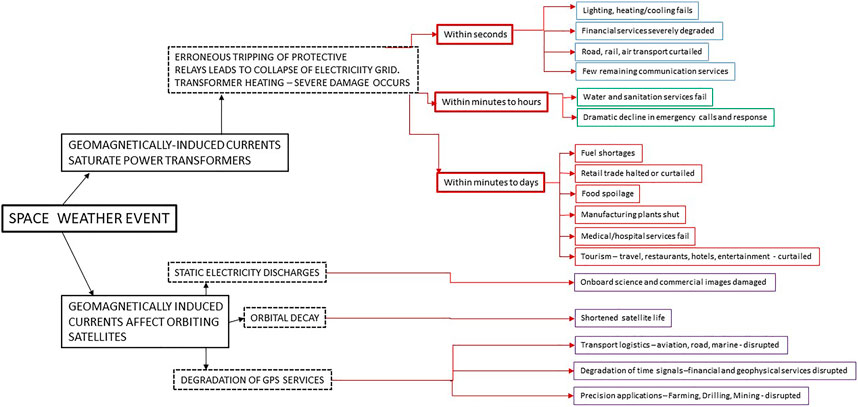
FIGURE 4. The cascading effects of a geomagnetic storm.
Apart from the potentially severe effects on electrical grids induced currents can be created in pipelines and railway networks. Satellites are vulnerable to radiation damage and electrical charging (Figure 4). Transpolar aviation routes will experience disrupted communications and navigation issues, and aircrew and passengers are subjected to increased radiation.
Several attempts have been made to estimate the costs of severe space weather. Oldenwald and Green (2007) indicate losses to satellite operators of about US30 billion in a repeat of the Carrington event. A US National Academy of Sciences report published in 2008 (NAS, 2008) estimated the economic costs of a repeat of the 1921 event for the US alone at USD1-2 trillion for the first 4 years but with full recovery taking up to 10 years. While the basis for this estimate has been questioned (Oughton, 2018), a study for Lloyds (2013) found that a Carrington-level storm affecting 20–40 million people for between 16 days and 1–2 years the total economic cost is estimated at between USD0.6–2.6 trillion; this study does not consider international trade (Oughton, 2018). Schulte in den Bäumen et al. (2014) perform three scenarios with storms equivalent to the Quebec 1989 storm centred over the United States, Europe and Asia. They take into account direct impacts, international trade, and interrupted supply chains concluding storms would reduce global consumption by 3.9–5.6% and impact every industry and every sector of society.
Oughton et al. (2017), examine the direct and indirect macroeconomic costs of four scenarios affecting the United States at different geomagnetic latitudes; they fail to assign average return periods to any events though the largest (S4) appears to have a footprint smaller than a Carrington-sized event. The S1 event produced a blackout affecting 8% of the US population with a loss equal to 15% of daily US GDP plus an additional international loss from flow-on effects of 13% of the daily US loss. The largest S4 event, affecting 66% of the US population produced a loss equal to 100% of daily US GDP with an additional international loss equivalent to 18% of daily US GDP. They note that their estimates suggest about 49% of the losses occur outside the blackout zone and that the loss estimates still exclude losses of perishable products, damage to fixed capital equipment and damage resulting from any civil unrest (Oughton et al., 2017, p71, 79). More recently it has been suggested that while many of these studies model an 80o latitudinal and a 8o longitudinal electrojet size, zones of extreme activity have significantly smaller footprints (Oughton, 2018) perhaps indicating that these estimates produce losses that are on the high side.
The most sophisticated (and presumably the most accurate) analysis of the potential costs of space weather has been undertaken for the UK considering geophysical risk, asset vulnerability and the critical network infrastructure (Oughton et al., 2019). In their detailed analysis a Carrington-sized event has a 71% probability of producing very intense substorms with a 50% likelihood of a single very intense storm disrupting the power grid and a 21% likelihood of two very intense substorms. Two storms, with no forecast available increases the probability of “significant power grid difficulties, increasing the likelihood of a national grid collapse” (Oughton et al., 2019, p1039). The economic costs of a storm of this intensity is moderate at GBP15.9 billion on Day 1 with no forecasting ability falling to GBP2.9 billion with the current forecasting ability (which appears to be on the decline)12. We do not know what multiples of these estimated losses would occur in the other parts of the world affected by the modelled storms.
While Lingam and Loeb (2017) provide no details they estimate that a superflare with energy of 1034 ergs with produce damage roughly equal to global GDP with an average return period of about 2000 years. Furthermore, a superflare with energy 1036 ergs has ∼10−4 chance of occurring in the next century, approximately equal to the chance of a 2 km diameter asteroid hitting the earth in the same time frame.
Discussion
The relentless slow but quickening rise in sea level destroys both built and natural environments and creates refugees through the rise of saline groundwater and the destruction of perched freshwater lenses on atolls and other small, low-lying islands. And these processes continue for decades.
The major consequences of a pandemic at first appears to be dominated by human mortality with potential pandemic deaths reaching a few hundred million, but the long-continued drama of mental health, the growth in inequality, and issues similar to long-COVID may change that view over a decade. One can also see that the costs and consequences for individual nations experiencing a pandemic depends in part on the national psyche, regulation, and leadership – or the lack of the latter.
Despite the near-vent total destruction resulting from a VEI 7 eruption, the threat to food security provides the most compelling vision of this future global catastrophe.
With urban populations almost totally reliant on electricity at some stage in the provision of lighting, heating/cooling, transport, communications, medical services, and food distribution it is difficult to imagine that any urban society would maintain its current level of law, order, social justice and harmony for more than a few days in the aftermath of a geomagnetic storm. On the other hand, parts of the affected area dominated by subsistence agriculture and/or a spirit of self-reliance might well remain relatively unaffected. While a geomagnetic storm provides perhaps the bleakest view of the aftermath of a global catastrophic risk, it also provides opportunities for ameliorating future consequences through warning systems and hardened electrical infrastructure – opportunities that are more difficult to envisage or implement in the case of the other three risks.
Quantifying GCR Losses
Clearly, the costs of global catastrophic risks is not solely about dollars and mortality. As Figure 1 implies there are myriad other costs, direct and indirect, tangible and intangible, and it is difficult to see how to account for these. Here I make an attempt to interpret the variety of losses; I take as examples 15 of the numerous types of losses implied in Figure 1, loosely grouping the fifteen into seven broad categories – Buildings, Infrastructure, Human Health, Agriculture, Other Economic Activity, Environment, and Social Impacts (Figure 5). Each potential loss is expressed as a proportion of the assets at risk. For example, Pandemic Mortality is expressed as a percentage of global population; in most cases this is likely to be less than 10% of global population but, based on Puma et al. (2015) exploratory work, the global death toll from food scarcity in the aftermath of a VEI 7 eruption could reach more than two billion lives.
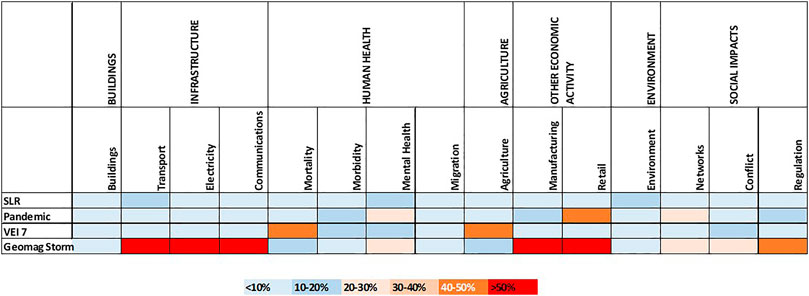
FIGURE 5. 15 GCR losses shown as broad percentage bands, selected from the many noted in Figure 1, expressed as a proportion of the assets at risk. See text for fuller explanation.
Obviously the views contained in Figure 5 are those of the author alone, conditioned both by wide reading and, no doubt, by vast ignorance of many issues. A more satisfactory account would depend on the views of many, from a range of disciplines, more rigorous definition of categories, the magnitude of the GCRs, narrower bands of percentage losses, and some form of expert elicitation (cf. Aspinall, 2010; Bamber et al., 2019).
This form of “analysis,” here applied globally, could also be applied to a specific community, nation, or continent.
Trends
The pathway and the shape of the post-GCR future likely depends on innumerable factors including the intensity of the impact, the resources available, outside assistance, resilience, the availability of cheap finance, leadership, and the trust of the populace in that leadership. Luck may well play an important part in shaping the future. Haldon et al. (2018) remind us: “… correlation is not causation and that it is a coalition of external and internal factors that generate crises.” In 2020 we might argue that COVID-19 has accelerated trends in domestic violence, work-from-home, xenophobia, inequality, migration, on-line shopping, the availability of seasonal workers, the value of larger houses and apartments – but we are (largely) in the dark as to whether these trends will endure. It would be intriguing to review changes that are still with us from the 1918–19 pandemic, the Great Depression, even the world wars? Certainly, the future will be reshaped, but for how long?
Whatever character or pathway a global catastrophic risk takes and whatever the influence of leadership possible futures can be characterised as one of four (Figure 6):
1) Post-GCR growth – where a rapid decline, the depth of which probably depends on both pre-existing conditions and resilience, is followed by a return to a trend or a future not too different to that characterising the pre-GCR period;
2) Post-GCR innovation – where the rapid decline is followed by a future characterised by innovation, new technologies, collaboration and/or a decline in adversaries;
3) Post-GCR decline – where the rapid decline is followed by only a partial recovery where the pre-GCR trajectory never recovers; this GCR produces a deviation-amplifying event;
4) Post-GCR extinction – the rapid decline leads to a worsening situation, no recovery occurs and extinction eventually follows.
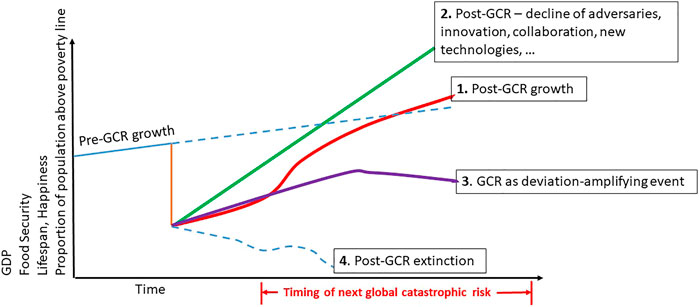
FIGURE 6. Four possible futures following the occurrence of a global catastrophic risk (based on ideas in Brunsdon et al. (2013), Ratti (2017), Baum et al. (2019)). While the timing of the next global catastrophic risk is uncertain, it is quite likely to occur before recovery from the most recent one is complete.
Several possible attributes are shown on the Y-axis on Figure 6 – Gross Domestic Product (GDP), Food security, Lifespan, Happiness13, or the Proportion of the population above the poverty line. Others attributes could be substituted or added, reflecting the breadth of the potential consequences shown in Figures 1, 5.
The four possible futures might apply to the world, to a continent, a country or just a few communities. It is possible that different, even adjacent countries or continents, have substantially different futures. And it is certainly possible, even quite likely, that the next GCR will occur before the myriad enduring consequences of the present one have played out.
Perhaps as COVID-19 has shown (at least for the near term), leadership is an important influence on the shape of the future. For COVID, science-based leadership seems to have (so far) produced the best outcomes for individual countries and populations. Intriguingly, science-based leadership seems much less popular in relation to looming global catastrophic risks including climate change and anti-microbial resistance.
A 2016 report, based on interviews with top leaders around the world, found: “A proliferation of “unthinkable” events has revealed a new fragility at the highest levels of corporate and public service leaderships. Their ability to spot, identify and handle unexpected, non-normative events is … perilously inadequate at critical moments … Remarkably, there remains a deep reluctance, or what might be called “executive myopia” (my emphasis), to see and contemplate even the possibility that “unthinkables” might happen, let alone how to handle them” (Gowing and Landon, 2018).
Ferguson (2021), p60) puts it less subtly in words evocative of the 1980s UK TV series Yes Minister: The decision makers may be captives of diffuse responsibility, “agenda inertia,” regulatory capture, intellectual inadequacy, ideological blinkers, downright “cowardice,” or bureaucratic pathologies such as “satisficing” (addressing a problem but not solving it or withholding vital information). And the “chorus” – not so much public opinion as expert opinion – can fall victim to a different set of biases: the craving for certainty (randomized control trials, peer-reviewed papers), the habit of debunking any novel theory, or the sunk cost of being invested in “settled science,” not to mention the temptation to make countless false prophecies on opinion pages and talk shows.
The Anthropocene and the Early Holocene
It is intriguing to consider these four global catastrophic risks in two time periods – the Anthropocene and the Early Holocene (say, 12–8 ka).
Whether we consider the Anthropocene to have begun with the Industrial Revolution or after 1950 (Lewis and Maslin, 2015; Subramanian, 2019), it is clear that geomagnetic storms have become a truly global catastrophic risk only in the latter part of the Anthropocene as satellites, the internet and electronic paraphernalia have come to dominate the everyday existence of a large proportion of global population. It may also be correct to assert that the speed of a pandemic’s potential onset has accelerated during the last few decades as global travel has become more and more common, and viral and host factors compete to enhance risk despite medical and epidemiological advances. While the average frequency and consequences of a VEI 7 eruption have hardly changed for thousands of years it may be that the declining proportion of the global population involved directly in agriculture and the continuing rise of just-in-time food security for the ever-growing urban masses has increased human vulnerability during the Anthropocene. As the rate of sea level rise will likely continue to accelerate over the next few decades perhaps the trend of increasing risk is characteristic of all four of the extreme perils considered here.
During the Early Holocene rates of sea level rise were higher than at present. Lambeck et al. (2014) estimate a near uniform rate of rise of ∼15 mm/y for the period 11,400 to 8,200 years cal BP, with a reduced rate from 8,200 to 6,700 years cal BP. More recently, Chua et al. (2021) have shown the average rate of rise for Singapore from ∼9,500 – 8,000 years cal BP to be 8.4 ± 2.6 mm/y. These Holocene rates are all substantially above current rates of sea level rise, though Nerem and Fasullo (2019) extrapolate current rates to about 10 mm/y by the end of the present century. The Early Holocene rates, extending over thousands of years, translate to kilometres of retreat of the land-sea margin on many continental shelves and the drowning of some islands in island chains. Furthermore, marine and terrestrial responses to the warming trend and sea level rise may have been out of phase; together changes in the proportions of muddy, sandy, and rocky coastal and marine habitats may have produced constraints on, or abundance in, food and other resources such as water, stone tools, fibres, timber, and shelter (Graham et al., 2003). Such changes may have encouraged migration, created refugees, and likely conflict with adjacent populations.
Early Holocene VEI 7 volcanic eruptions presumably occurred at roughly the same rate as in the present day14. Total destruction would have been wrought on areas of much the same size, up to about 30,000 km2, with tephra fall declining in thicknesses over additional areas of several hundred thousand square kilometres. Within the areas of total destruction extinction of local communities may have occurred and landscapes changed irrevocably by redistribution of tephra by rain and lahars. Reoccupation of these lands would almost certainly not occur for several generations, emphasising the time timeframes for recovery are an order of magnitude or more longer than the duration of the physical impacts. Vanderhoek and Nelson (2007) point out that the area buried by PDCs in the 1912 Katmai-Novarupta VEI 6 eruption in Alaska was still largely unvegetated 90 years later. In tropical New Britain where five VEI 5 or 6 eruptions occurred from Witori and Dakataua volcanoes in the period 6,000 to 1,000 years ago archaeological sites which received more than 50 cm of tephra fall remained unoccupied for 200–250 years after each eruption (Torrence and Doelman, 2007). Similarly, archaeological research suggests that reoccupation after the ∼7,300 cal BP VEI 7 eruption of Kikai-Akahoya in southern Japan was delayed until the ecology recovered up to 900 years after the eruption (Machida and Sugiyama, 2002; Grattan, 2006). While it is possible that some communities left areas close to volcanoes before the peak phase of the eruption this implies an understanding of the warning signs and strong networks with other communities stretching across a large area. While migration to adjacent areas is certainly possible, the extent of the area where tephra fall is likely to severely curtail food supply and other resources is so large that a migration of 100 km or more may mark no difference in the level of resource destruction or food availability.
Pandemics depend on global spread. COVID has shown just how rapid that can be in the Anthropocene. Even a few hundred years ago the rate of spread was considerably slower with bubonic plague taking years to spread across a significant portion of the globe in the 17th century. In the Early Holocene a pandemic seems unlikely, though local epidemics could have been more frequent and more deadly.
Sea level rise, a VEI 7 eruption, or an epidemic/pandemic in the Early Holocene may have enhanced increased mobility or migration, driven by decision-making in small groups possibly with wide kinship ties. While mobility may encourage new ideas, new world views, access to new resources and changes in material culture, dislocation may also exacerbate inequality, poverty, famine, malnutrition and/or violence. Early Holocene trends to a more sedentary agriculture and more complex societies may also have encouraged the spread of infectious diseases (Sheets, 2016; Riede et al., 2020; Gamble et al., 2021). If migration followed a pandemic or a volcanic eruption, a return to the homeland may have been possible within years to decades (except near to the source of a VEI 7 eruption), but migration resulting from sea level rise prevented return and altered any “sense of place”15.
While geomagnetic storms may well have the severest repercussions for modern society at this stage of the Anthropocene, in the Early Holocene such storms probably passed with only a lively discussion about the associated aurora.
While I have made no attempt to compile a complete list of GCRs a short list includes, in addition to the four considered here, war, especially a nuclear war, climate change, a gamma ray burst, a meteorite impact, a cyber hack, antimicrobial resistance, plant pathogens (Raistaino et al, 2021) and a few of the hazards and consequences listed by the World Economic Forum in annual reports. While it is disconcerting to observe that the Anthropocene list is substantially longer than that for the Early Holocene, this is not to suggest that life is now more risky than in the Early Holocene – in fact, the increase in average life expectancy from about 20 to 30 years to 70+ years suggests otherwise.
Conclusion
Global catastrophic risks have the potential to kill hundreds of millions, even billions, and can produce damage to infrastructure and economic activity in the many trillions though none of the four considered here are likely to do both; possibly, a VEI 7 eruption with the vent near a densely populated region has some potential to achieve both.
Loss potential measured by just human mortality or just by economic losses, or just by both, seriously underestimates the scope and duration of consequences. Our perspective might change markedly if we focussed more on consequences for mental health, human happiness, and the environment.
Most GCRs, except meteorite impact, a VEI 7 eruption, and a gamma ray burst, result largely from human ingenuity and neglect. Serious adverse consequences from GCRs are much more likely in the Anthropocene than they were in the Early Holocene.
As COVID has shown, human behaviour has a big influence on consequences and loss potential. This likely to be even more true in the aftermath of a Carrington-sized geomagnetic storm than in the repercussions of other GCRs.
For all GCRs, not just the four considered here, leadership at global, regional, country, and community levels may have more influence on both the magnitude and the scope of the losses and on the shape of the aftermath than any other variable.
Data Availability Statement
The original contributions presented in the study are included in the article, further inquiries can be directed to the corresponding author.
Author Contributions
The author confirms being the sole contributor of this work and has approved it for publication.
Conflict of Interest
The author declares that the research was conducted in the absence of any commercial or financial relationships that could be construed as a potential conflict of interest.
Publisher’s Note
All claims expressed in this article are solely those of the authors and do not necessarily represent those of their affiliated organizations, or those of the publisher, the editors and the reviewers. Any product that may be evaluated in this article, or claim that may be made by its manufacturer, is not guaranteed or endorsed by the publisher.
Acknowledgments
My especial thanks to colleagues at Aon Reinsurance Solutions in Sydney, particularly Peter Cheesman and Robert de Souza, who encouraged me and provided the resources to allow me to develop my early interests in global catastrophic risks.
Footnotes
1https://www.air-worldwide.com/Blog/Why-Warren-Buffett-Is-Almost-Certainly-Wrong-about-Cat-Risk/.
2https://data.worldbank.org/indicator/NY.GDP.MKTP.CD.
3It could be argued that the declines in health programs targeting the incidence of Tb, measles and polio and in elective surgery are associated hazards of the COVID pandemic – see below.
4Koch et al. (2019) put the population decline in the Americas in the 100 years following Columbus at ∼90%. Intriguingly, they estimate that secondary succession on the abandoned land led to a 2.3–5.1 ppm decline in global CO2.
5See the summary of population estimates by a range of authorities at https://en.wikipedia.org/wiki/Estimates_of_historical_world_population. As Eisenberg and Mordechai (2020) point out, both these death tolls and accounts of the role of pre-20th century pandemics driving social, political, and cultural transformation need to be regarded critically.
6https://www.air-worldwide.com/Publications/AIR-Currents/2018/What-the-1918-Flu-Pandemic-Can-Teach-Today-s-Insurers/.
7https://www.air-worldwide.com/Blog/A-Pandemic-Emergency-Facility-to-Protect-the-Poorest-Countries/.
8Ferguson (2021, p139) refers to the dual pandemic – the biological and the informational; something we can all relate to in 2021; however, Ferguson was writing about Daniel Defoe’s Journal of the Plague Year, about the 1665–6 bubonic plague in London, though published in 1722. Given 2020 attacks on healthcare workers, destruction of 5G towers etc., it is also interesting to note that nakedness, fish contaminated by Germans, dirt or dust, unclean pajamas, open windows, closed windows, old books, and “cosmic influence” were all popularly posed in 1918–19 as causes of influenza (NAS, 2019, p12).
9While the temperature anomalies and the food security consequences produced by a VEI 7 eruption are very likely to be both smaller and shorter than those resulting from a regional nuclear conflict, there are similarities (Jägermeyr and Robock, 2020).
10A wide range of indices are used to measure changes in the Earth’s magnetic field. The time rate of change (dB/dt per unit time) best represents the threat to Extra High Voltage (EHV) transformers and the electricity transmission network via Ground Induced Currents (GIC) (Oughton et al., 2017). The intensity of a geomagnetic storm can also be measured by counting the number of solar charged particles that enter the Earth’s magnetic field near the Equator – Disturbance storm time (Dst) (Masters, 2009).
11There appear to be two schools of thought about potential damage; some believe that the potential damage would not be large, with disruptions lasting only a few hours or days; others believe extensive damage to equipment produces blackouts that would last days, months or even longer as the globally manufacturing capacity for large-scale transformers is too small to cope with damage to dozens or hundreds of Extra High Voltage transformers (Oughton et al., 2017; Oughton, 2018). While the second view seems more likely for Carrington-size superstorms, some governments and some grid operators seem to be alert to the issues involved.
12It is difficult to make comparisons between the various studies made available but the potential losses modelled by Oughton et al. (2019) seem to be at odds with the study of Schrijver et al. (2014) who assessed the cost of non-catastrophic impact of non-extreme geomagnetic disturbances on the US through insurance claims for industrial electrical equipment for the period 2000–2010 calculating an average economic impact of USD 7–10 billion per year (Schrijver, 2015).
13Happiness might sound like a nebulous concept but Helliwell et al. (2021) provide a Happiness ranking for 149 countries based on the sum of six factors – GDP per capita, social support, healthy life expectancy, freedom to make life choices, generosity, perceptions of corruption – plus dystopia (the estimated life evaluation in a mythical country with the lowest observed values for each of the six variables (Helliwell et al., 2021, p23). This year’s report is particularly apposite as it takes into account the effects of COVID in 2020.
14However, Satow et al. (2021) have shown that the frequency of eruptions on volcanic islands can be influenced by sea-level change with Santorini showing a much higher eruption rate when sea level falls below -40 m. Conversely, deglaciation and continental lithospheric unloading leads to increased continental magmatic, volcanic, and degassing activity (Sternai et al., 2016).
15Sandweiss and Quilter (2012) draw important distinctions between collation, correlation, and causation in an archaeological context, distinctions that make it troublesome to state categorically that an eruption or a pandemic “caused” migration or a cultural change. Often, a GCR may only be a contributory “cause” with events during previous decades encouraging a decision to finally “do something.” It will be interesting in the coming decades to ponder which changes we think were caused by COVID-19.
References
Aspinall, W. (2010). A Route to More Tractable Expert Advice. Nature 463, 294–295. doi:10.1038/463294a
AIR (2017). Global Modeled Catastrophe Losses. Boston, Mass. Available at: https://www.google.com/search?q=AIR%E2%80%99s+2017+Global+Modeled+Catastrophe+Losses&rlz=1C1GCEA_enAU846AU846&oq=AIR%E2%80%99s+2017+Global+Modeled+Catastrophe+Losses&aqs=chrome.69i57.1576j0j15&sourceid=chrome&ie=UTF-8.
Avin, S., Wintle, B. C., Weitzdörfer, J., Ó hÉigeartaigh, S. S., Sutherland, W. J., and Rees, M. J. (2018). Classifying Global Catastrophic Risks. Futures 102, 20–26. doi:10.1016/j.futures.2018.02.001
Bamber, J. L., Oppenheimer, M., Kopp, R. E., Aspinall, W. P., and Cooke, R. M. (2019). Ice Sheet Contributions to Future Sea-Level Rise from Structured Expert Judgment. Proc. Natl. Acad. Sci. USA 116 (23), 11195–11200. doi:10.1073/pnas.1817205116
Barnard, P. L., Erikson, L. H., Foxgrover, A. C., Finzi Hart, J. A., Limber, P., O’Neill, A. C., et al. (2019). Dynamic Flood Modelling Essential to Assess the Coastal Impacts of Climate Change. Nat. Scientific Rep. 9 (4309). doi:10.1038/s41598-019-40742-z
Baum, S. D., Armstrong, S., Ekenstedt, T., Häggström, O., Hanson, R., Kuhlemann, K., et al. (2019). Long-term Trajectories of Human Civilization. Foresight 21 (1), 53–83. doi:10.1108/FS-04-2018-0037
Bostrom, N., and Ćirković, M. M. (2008). “Introduction,” in Global Catastrophic Risks. Editors N. Bostrom, and M. M. Ćirković Oxford OUP, 1–30. doi:10.1093/oso/9780198570509.003.0004
Brönnimann, S., and Krämer, D. (2016). Tambora and the “Year without a Summer” of 1816: A Perspective on Earth and Human System science. Oeschger Centre Climate Change Research. Geographica Bernensia: University of Bern, 49p.
Brunsdon, D., Seville, E., and Vargo, J. (2013). “Resilient New Zealand,” in Aon Benfield Australia Hazards Conference, Think outside the Risk, Gold Coast, Australia, 22–24 September, 35.
Büntgen, U., Myglan, V. S., Ljungqvist, F. C., McCormick, M., Di Cosmo, N., Sigl, M., et al. (2016). Cooling and Societal Change during the Late Antique Little Ice Age from 536 to Around 660 AD. Nat. Geosci. 9, 231–236. doi:10.1038/NGEO2652
Büntgen, U., Wacker, L., Galván, J. D., Arnold, S., Arseneault, D., Baillie, M., et al. (2018). Tree Rings Reveal Globally Coherent Signature of Cosmogenic Radiocarbon Events in 774 and 993 CE. Nat. Commun. 9, 1–7. doi:10.1038/s41467-018-06036-0
Burns, A., van der Mensbrugghe, D., and Timmer, H. (2008). Evaluating the Economic Consequences of Avian Influenza. updated version of World Bank’s 2006 Global Development Finance. Available at: https://www.researchgate.net/publication/237345628 (Accessed May 13, 2021).
Campbell, B. M. S. (2017). Global Climates, the 1257 Mega-Eruption of Samalas Volcano, Indonesia, and the English Food Crisis of 1258. Trans. R. Hist. Soc. 27, 87–121. doi:10.1017/S0080440117000056
Chapman, S. C., Horne, R. B., and Watkins, N. W. (2020). Using the Aa Index over the Last 14 Solar Cycles to Characterize Extreme Geomagnetic Activity. Geophys. Res. Lett. doi:10.1029/2019GL086524
Chua, S., Switzer, A. D., Li, T., Chen, H., Christie, M., Shaw, T. A., et al. (2021). A New Holocene Sea-Level Record for Singapore. The Holocene 31 (9), 1376–1390. doi:10.1177/09596836211019096
Cutler, D. M., and Summers, L. H. (2020). The COVID-19 Pandemic and the $16 Trillion Virus. Jama 324 (15), 1495–1496. doi:10.1001/jama.2020.19759
US Global Change Research Program (2018). Impacts, Risks, and Adaptation in the United States: Fourth National Climate Assessment, Volume II. Editors D. R. Reidmiller, C. W. Avery, D. R. Easterling, K. E. Kunkel, K. L. M. Lewis, T. K. Maycocket al. (Washington D.C: U.S. Global Change Research Program), 1515. doi:10.7930/NCA4.2018
Eisenberg, M. (2020). Historical Pandemics and Covid-19. Available at: https://www.youtube.com/watch?v=Z99M7y8MLa0.
Eisenberg, M., and Mordechai, L. (2020). The Justinianic Plague and Global Pandemics: the Making of the Plague Concept. Am. Hist. Rev. 125 (5), 1632–1667. doi:10.1093/ahr/rhaa510
Fan, V. Y., Jamison, D. T., and Summers, L. H. (2018). Pandemic Risk: How Large Are the Expected Losses? Bull. World Health Organ. 96 (2), 129–134. Available at: https://pubmed.ncbi.nlm.nih.gov/29403116/. doi:10.2471/blt.17.199588
Frolov, D. A., Ostryakov, V. M., Pavlov, A. K., Struminsky, A. B., and Vasilyev, G. I. (2018). Isotopic Terrestrial Imprints of Solar Superflares. J. Phys. Conf. Ser. 1038, 012008. doi:10.1088/1742-6596/1038/1/012008
Gamble, L. H., Claassen, C., Eerkens, J. W., Kennett, D. J., Lambert, P. M., Liebmann, M. J., et al. (2021). Finding Archaeological Relevance during a Pandemic and what Comes after. Am. Antiq. 86 (1), 2–22. doi:10.1017/aaq.2020.94
GHS Index (2019). Global Health Security Index: Building Collective Action and Security. Nuclear Threat Initiative and Johns Hopkins University. Available at: https://www.ghsindex.org/wp-content/uploads/2019/10/2019-Global-Health-Security-Index.pdf.
Goldstein, A., Turner, W. R., Gladstone, J., and Hole, D. G. (2018). The Private Sector's Climate Change Risk and Adaptation Blind Spots. Nat. Clim Change 9, 18–25. doi:10.1038/s41558-018-0340-5
Gowing, N., and Langdon, C. (2018). Thinking the Unthinkable: A New Imperative for Leadership in the Digital Age. Suffolk: John Catt educational.
Graham, M. H., Dayton, P. K., and Erlandson, J. M. (2003). Ice Ages and Ecological Transitions on Temperate Coasts. Trends Ecol. Evol. 18 (1), 33–40. Available at: http://tree.trends.com0169-5347/02/$. doi:10.1016/s0169-5347(02)00006-x
Grattan, J. (2006). Aspects of Armageddon: an Exploration of the Role of Volcanic Eruptions in Human History and Civilization. Quat. Int. 151 (1), 10–18. doi:10.1016/j.quaint.2006.01.019
Griggs, R. F. (1922). The Valley of Ten Thousand Smokes. Washington D.C.: National Geographic Society, 340p.
Haldon, J., Mordechai, L., Newfield, T. P., Chase, A. F., Izdebski, A., Guzowski, P., et al. (2018). History Meets Palaeoscience: Consilience and Collaboration in Studying Past Societal Responses to Environmental Change. Proc. Natl. Acad. Sci. USA 115 (13), 3210–3218. Available at: https://www.pnas.org/content/115/13/3210. doi:10.1073/pnas.1716912115
Helliwell, J. F., Layard, R., Sachs, J., and De Neve, J-E. (2021). World Happiness Report 2021. New York: Sustainable Development Solutions Network.
Hinkel, J., Lincke, D., Vafeidis, A. T., Perrette, M., Nicholls, R. J., Marzeion, B., et al. (2013). Coastal Flood Damage and Adaptation Costs under 21st century Sea-Level Rise. PNAS 111, 3292. doi:10.1073/pnas.1222469111
Hino, M., Belanger, S. T., Field, C. B., Davies, A. R., and Mach, K. J. (2019). High-tide Flooding Disrupts Local Economic Activity. Sci. Adv. 5, eaau2736. doi:10.1126/sciadv.aau2736
Hino, M., and Nance, E. (2021). Five Ways to Ensure Flood-Risk Research Helps the Most Vulnerable. Nature 595, 27–29. doi:10.1038/d41586-021-01750-0
Hooijer, A., and Vernimmen, R. (2021). Global LIDAR Land Elevation Data Reveal Greatest Sea-Level Rise Vulnerability in the Tropics. Nat. Commun. 12, 1–7. doi:10.1038/s41467-021-23810-9
Jägermeyr, J., Robock, A., Elliott, J., Müller, C., Xia, L., Khabarov, N., et al. (2020). A Regional Nuclear Conflict Would Compromise Global Food Security. Proc. Natl. Acad. Sci. USA 117 (13), 7071–7081. Available at: https://www.pnas.org/content/117/13/7071. doi:10.1073/pnas.1919049117
Keogh-Brown, M. R., Wren-Lewis, S., Edmunds, W. J., Beutels, P., and Smith, R. D. (2010). The Possible Macroeconomic Impact on the UK of an Influenza Pandemic. Health Econ. 19 (11), 1345–1360. doi:10.1002/hec.1554
Kirezci, E., Young, I. R., Ranasinghe, R., Muis, S., Nicholls, R. J., Lincke, D., et al. (2020). Projections of Global-Scale Extreme Sea Levels and Resulting Episodic Coastal Flooding over the 21st Century. Sci. Rep. 10, 1–12. doi:10.1038/s41598-020-67736-6
Koch, A., Brierley, C., Maslin, M. M., and Lewis, S. L. (2019). Earth System Impacts of the European Arrival and Great Dying in the Americas after 1492. Quat. Sci. Rev. 207, 13–36. doi:10.1016/j.quascirev.2018.12.004
Lambeck, K., Rouby, H., Purcell, A., Sun, Y., and Sambridge, M. (2014). Sea Level and Global Ice Volumes from the Last Glacial Maximum to the Holocene. Proc. Natl. Acad. Sci. 111 (43), 15296–15303. doi:10.1073/pnas.1411762111
Leroy, S. A. G. (2006). From Natural hazard to Environmental Catastrophe: Past and Present. Quat. Int. 158, 4–12. doi:10.1016/j.quaint.2006.05.012
Lewis, S. L., and Maslin, M. A. (2015). Defining the Anthropocene. Nature 519, 171–180. doi:10.1038/nature14258
Lin, N., Kopp, R. E., Horton, B. P., and Donnelly, J. P. (2016). Hurricane Sandy's Flood Frequency Increasing from Year 1800 to 2100. Proc. Natl. Acad. Sci. USA 113 (43), 12071–12075. doi:10.1073/pnas.1604386113
Lingam, M., and Loeb, A. (2017). Risks for Life on Habitable Planets from Superflares on Their Host Stars. Astrophysical J. 848:41, 13. doi:10.3847/1538-4357/aa8e96
Lloyds (2010). Space Weather – its Impact on Earth and Implications for Business. London: Lloyds. 360o Risk Insight, 36.
Luterbacher, J., and Pfister, C. (2015). The Year without a Summer. Nat. Geosci. 8, 246–248. doi:10.1038/ngeo2404
Machida, M., and Sugiyama, S. (2002). “The Impact of the Kikai-Akahoya Explosive Eruptions on Human Societies,” in Natural Disasters and Cultural Change. Editors R. Torrence, and J. P. Grattan (London: Routledge), 313–325.
Marani, M., Katul, G. G., Pan, W. K., and Parolari, A. J. (2021). Intensity and Frequency of Extreme Novel Epidemics. Proc. Natl. Acad. Sci. USA 118, e2105482118. doi:10.1073/pnas.2105482118
Marshall, M. (2021). The Four Most Urgent Questions about Long COVID. Nature 594, 168–170. doi:10.1038/d41586-021-01511-z
Masters, J. (2009). A Future Space Weather Catastrophe: A Disturbing Possibility. Available at: https://www.wunderground.com/blog/JeffMasters/a-future-space-weather-catastrophe--a-disturbing-possibility.html (Accessed June 8, 2021).
Meyer, V., Becker, N., Markantonis, V., Schwarze, R., van den Bergh, J. C. J. M., Bouwer, L. M., et al. (2013). Review Article: Assessing the Costs of Natural Hazards - State of the Art and Knowledge Gaps. Nat. Hazards Earth Syst. Sci. 13, 1351–1373. Available at: https://nhess.copernicus.org/articles/13/1351/2013/. doi:10.5194/nhess-13-1351-2013
Moftakhari, H. R., AghaKouchak, A., Sanders, B. F., Allaire, M., and Matthew, R. A. (2018). What Is Nuisance Flooding? Defining and Monitoring an Emerging challenge. Water Resour. Res. 54, 4218–4227. doi:10.1029/2018wr022828
NAS (2008). Severe Space Weather Events – Understanding Societal and Economic Impacts Workshop Report. National Research Council. ISBN: 0-309-12770-X.
NAS (2018). Understanding the Economics of Microbial Threats: Proceedings of a Workshop Engineering, and Medicine. Washington, DC: National Academies of Sciences The National Academies Press. doi:10.17226/25224
NAS (2019). Exploring Lessons Learned from a century of Outbreaks: Readiness for 2030 Proceedings of a Workshop Engineering, and Medicine. Washington, DC: National Academies of Sciences, The National Academies Press. doi:10.17226/25391
Nerem, R. S., and Fasullo, J. (2019). Observations of the Rate and Acceleration of Global Mean Sea Level Change. BAMS 100, S15–S18. doi:10.1175/BAMS-D-18-0247.1
Newhall, C. G., and Punongbayan, R. S. (1997). Fire and Mud. Eruptions and Lahars of Mt Pinatubo, Philippines (Seattle: University of Washington Press).
Newhall, C. G., and Self, S. (1982). The Volcanic Explosivity index (VEI) an Estimate of Explosive Magnitude for Historical Volcanism. J. Geophys. Res. 87 (C2), 1231–1238. doi:10.1029/JC087iC02p01231
Newhall, C., Self, S., and Robock, A. (2018). Anticipating Future Volcanic Explosivity Index (VEI) 7 Eruptions and Their Chilling Impacts. Geosphere 14 (2), 1–32. doi:10.1130/ges01513.1
Odenwald, S. F., and Green, J. L. (2007). Forecasting the Impact of an 1859-caliber Superstorm on Geosynchronous Earth-Orbiting Satellites: Transponder Resources. Space Weather 5, 16. doi:10.1029/2006SW000262
Oughton, E. J., Hapgood, M., Richardson, G. S., Beggan, C. D., Thomson, A. W. P., Gibbs, M., et al. (2019). A Risk Assessment Framework for the Socioeconomic Impacts of Electricity Transmission Infrastructure Failure Due to Space Weather: an Application to the United Kingdom. Risk Anal. 39 (5), 1022–1043. doi:10.1111/risa.13229
Oughton, E. J., Skelton, A., Horne, R. B., Thomson, A. W. P., and Gaunt, C. T. (2017). Quantifying the Daily Economic Impact of Extreme Space Weather Due to Failure in Electricity Transmission Infrastructure. Space Weather 15, 65–83. doi:10.1002/2016SW001491
Oughton, E. J. (2018). The Economic Impact of Critical National Infrastructure Failure Due to Space Weather. Oxford Res. Encyclopedia Nat. Hazard Sci. doi:10.1093/acrefore/9780199389407.013.315
Platt, R. H. (2013). Impacts of Superstorm Sandy on New York City’s New Waterfront parks. Boulder, Colo: Natural Hazards Research and Applications Information, Center University of Colorado Boulder. Quick Response 243.
Porter, K., Wein, A., Alpers, C., Bae, A., Barnard, P., Carter, J., et al. (2010). Overview of the ARkSTorm Scenario. United States Geological Survey, Open File. Report 2010-1312.
Puma, M., Chon, S., and Wada, Y. (2015). Exploring the Potential Impacts of Historic Volcanic Eruptions on the Contemporary Global Food System. PAGES Mag. 23 (2), 66–67. doi:10.22498/pages.23.2.66
Ratti, M. L. (2017). The Economics of Natural Disasters: an Overview of the Current Research Issues and Methods Umeå, Sweden: CERE (Centre for Environmental and Resource Economics), Umeå University, 32.
Riede, F., Barnes, G. L., Elson, M. D., Oetelaar, G. A., Holmberg, K. G., and Sheets, P. (2020). Prospects and Pitfalls in Integrating Volcanology and Archaeology: a Review. J. Volcanology Geothermal Res. 401, 106977. doi:10.1016/j.jvolgeores.2020.106977
Riede, F. (2019). Doing Palaeo-Social Volcanology: Developing a Framework for Systematically Investigating the Impacts of Past Volcanic Eruptions on Human Societies Using Archaeological Datasets. Quat. Int. 499, 266–277. doi:10.1016/j.quaint.2018.01.027
Ristaino, J. B., Anderson, P. K., Bebber, D. P., Brauman, K. A., Cunniffe, N. J., Fedoroff, N. V., et al. (2021). The Persistent Threat of Emerging Plant Disease Pandemics to Global Food Security. Proc. Natl. Acad. Sci. USA 118, e2022239118. doi:10.1073/pnas.2022239118
Roberts, L. (2021). How COVID Hurt the Fight against Other Dangerous Diseases. Nature 592, 502–504. doi:10.1038/d41586-021-01022-x
Rosenzweig, C., and Solecki, W. (2014). Hurricane Sandy and Adaptation Pathways in New York: Lessons from a First-Responder City. Glob. Environ. Change 28, 395–408. doi:10.1016/j.gloenvcha.2014.05.003
Sandweiss, D. H., and Quilter, J. (2012). “Collation, Correlation, and Causation in the Prehistory of Coastal Peru,” in Surviving Sudden Environmental Change: Answers from Archaeology. Editors J. Cooper, and P. Sheets (Boulder: University Press of Colorado), 117–139.
Satow, C., Gudmundsson, A., Gertisser, R., Ramsey, C. B., Bazargan, M., Pyle, D. M., et al. (2021). Eruptive Activity of the Santorini Volcano Controlled by Sea-Level Rise and Fall. Nat. Geosci. 14, 586–592. doi:10.1038/s41561-021-00783-4
Schrijver, C. J. (2015). Socio-Economic Hazards And Impacts Of Space Weather: The Important Range Between Mild And Extreme. Space Weather 13 (9), 524–528. doi:10.1002/2015SW001252
Schrijver, C. J., Dobbins, R., Murtagh, W., and Petrinec, S. M. (2014). Assessing the Impact of Space Weather on the Electric Power Grid Based on Insurance Claims for Industrial Electrical Equipment. Space Weather 12 (7), 487–498. doi:10.1002/2014SW001066
Schulte in den Bäumen, H., Moran, D., Lenzen, M., Cairns, I., and Steenge, A. (2014). How Severe Space Weather Can Disrupt Global Supply Chains. Nat. Hazards Earth Syst. Sci. 14, 2749–2759. doi:10.5194/nhess-14-2749-2014
Sheets, P. (2016). Thoughts and Observations on Volcanic Activity and Human Ecology. Quat. Int. 394, 152–154. doi:10.1016/j.quaint.2015.08.070
Short, K. R., Kedzierska, K., and van de Sandt, C. E. (2018). Back to the Future: Lessons Learned from the 1918 Influenza Pandemic. Front. Cell. Infect. Microbiol. 8, 343. doi:10.3389/fcimb.2018.00343
Smythe, T. C. (2013). Assessing the Impact of Hurricane Sandy on the Port of New York and New Jersey’s Maritime Responders and Response Infrastructure. Boulder, Colorado: Natural Hazards Research and Applications Information, Center University of Colorado Boulder. Quick Response 238.
Sternai, P., Caricchi, L., Castelltort, S., and Champagnac, J. D. (2016). Deglaciation and Glacial Erosion: a Joint Control on Magma Productivity by continental Unloading. Geophys. Res. Lett. 43 (4), 1632–1641. doi:10.1002/2015GL067285
Stothers, R. B. (2000). Climatic and Demographic Consequences of the Massive Volcanic Eruption of 1258. Climatic Change 45, 361–374. doi:10.1023/a:1005523330643
Subramanian, M. (2019). Humans versus Earth: the Quest to Define the Anthropocene. Nature 572, 168–170. Available at: https://media.nature.com/original/magazine-assets/d41586-019-02381-2/d41586-019-02381-2.pdf. doi:10.1038/d41586-019-02381-2
Sweet, W., Zervas, C., Gill, S., and Park, J. (2013). Hurricane Sandy Inundation Probabilities – Today and Tomorrow. BAMS 94 (9), S17–S20.
Swiss, Re. (2018). Natural Catastrophes and Man-Made Disasters in 2017: A Year of Record-Breaking Losses. Sigma: Swiss Re Institute. No1/2018.
Tennis, J. (2013). Catastrophe Models; Learning from Superstorm Sandy. Lockton Companies. Available at: https://www.lockton.com/whitepapers/Catastrophe_Models_Learning_from_Superstorm_Sandy.pdf.
Torrence, R. (2019). Social Responses to Volcanic Eruptions: A Review of Key Concepts. Quat. Int. 499, 258–265. doi:10.1016/j.quaint.2018.02.033
Torrrence, R., and Doelman, T. (2007). “Chaos and Selection in Catastrophic Environments: Willaumez Peninsula, Papua New Guinea,” in Living under the Shadow – the Cultural Impacts of Volcanic Eruptions. Editors J. Grattan, and E. R. Torrence (California: Left Coast Press), 42–66.
Turchin, A., and Denkenberger, D. (2018). Global Catastrophic and Existential Risks Communication Scale. Futures 102, 27–38. Available at: https://www.sciencedirect.com/science/article/abs/pii/S001632871730112X?via%3Dihub. doi:10.1016/j.futures.2018.01.003
Vanderhoek, R., and Nelson, R. E. (2007). “Ecological Roadblocks on a Constrained Landscape: the Cultural Effects of Catastrophic Holocene Volcanism on the Alaska Peninsula, Southwest Alaska,” in Living under the Shadow – the Cultural Impacts of Volcanic Eruptions. Editors J. Grattan, and R. Torrence (California: Left Coast Press), 133–152.
WEF (2021). The Global Risks Report 2021. Geneva: World Economic Forum. Available at: https://www.weforum.org/reports/the-global-risks-report-2021.
Wilson, T. M., Jenkins, S., and Stewart, C. (2015). “Impacts from Volcanic Ash Fall,” in Volcanic Hazards, Risks, and Disasters. Editor P. Papale (Elsevier), 47–86. doi:10.1016/B978-0-12-396453-3.00003-4
Keywords: global catastrophic risks, sea level rise, pandemic, VEI 7 eruption, geomagnetic storm, economic losses, anthropocene
Citation: Blong R (2021) Four Global Catastrophic Risks – A Personal View. Front. Earth Sci. 9:740695. doi: 10.3389/feart.2021.740695
Received: 13 July 2021; Accepted: 20 September 2021;
Published: 06 October 2021.
Edited by:
Huw Groucutt, Max Planck Institute for Chemical Ecology, GermanyReviewed by:
Torben C Rick, Smithsonian Institution, United StatesRosanna Bonasia, Instituto Politécnico Nacional, Mexico
Copyright © 2021 Blong. This is an open-access article distributed under the terms of the Creative Commons Attribution License (CC BY). The use, distribution or reproduction in other forums is permitted, provided the original author(s) and the copyright owner(s) are credited and that the original publication in this journal is cited, in accordance with accepted academic practice. No use, distribution or reproduction is permitted which does not comply with these terms.
*Correspondence: Russell Blong, rblong43@gmail.com