Exposure Elements in Disaster Databases and Availability for Local Scale Application: Case Study of Kuala Lumpur, Malaysia
 Nurfashareena Muhamad
 Siti Hasniza M. Arshad
 - Southeast Asia Disaster Prevention Research Initiative (SEADPRI-UKM), Institute for Environment and Development, Universiti Kebangsaan, Bangi, Malaysia
Exposure elements in open-access disaster databases that are relevant to critical infrastructure and basic services in the Sendai Framework on Disaster Risk Reduction (SFDRR) were transformed into spatial data, to investigate the impact of flash flood hazards in Kuala Lumpur, Malaysia. In this era of big data and hyper-connectivity, the availability of open-access data on exposure elements across scales and systems is largely unknown. Information on exposure elements and hazard susceptibility provide important insights to enhance community resilience, to move away from merely managing disasters to managing the risk of disasters, in line with the SFDRR. The case study of Kuala Lumpur enabled an assessment of information availability in existing disaster databases and within the national system, to facilitate informed decision-making. Findings reveal that there are a total of 26 databases on the internet that provide information on disasters and related elements; of which 18 are global, three are regional and four provide information at the national scale. However, only ten databases are open access where the user is able to easily retrieve information while others provide a “view only option”. The coverage of exposure elements in disaster databases is very poor where only five databases carried such information; and it is not useful for local scale application. Thus, information was sought from multiple open data sources within the national system and transformed into spatial data, to develop an exposure element data inventory for the city. There are 509 exposure elements within Kuala Lumpur, covering 33 private and government hospitals and community clinics; 189 public and private schools and institutions higher education; 261 facilities that provide basic services; and 26 features that represent of social and economic aspects. The exposure elements, which is coherent with the SFDRR, benefits decision-making when overlain with existing flood hazard zones and susceptible areas. Moving forward, emerging hazards due to climate change will be evaluated to strengthen informed decision-making and build community resilience in the city. The empowerment of local level research has great potential to advance open sharing of information on disaster and climate risks in the region.
Introduction
Over the past decades, more than hundreds of disasters were recorded causing 11,755 deaths, affecting 95 million people and resulting in US$ 103 billion in economic losses across the world (EM-DAT, 2020). Economic loss and damage is rising globally and growing exposure has been identified as a main driver of this increase. Climate change is expected to contribute to increasing disaster losses, particularly as global warming proceeds to 1.5°C (IPCC, 2018). Information on disaster events is critical to formulate effective policies and actions that reduce future risks (Huggel et al., 2015).
The Sendai Framework for Disaster Risk Reduction (SFDRR) has given additional impetus for global databases as a means to monitor disaster loss and damage. The usage of disaster databases has become a trend in disaster research where it provides a unique opportunity for integrative data analysis and geospatial visualization. Disaster databases are a primary tool for the analysis of disaster characteristics and trends at global and national scales supporting disaster risk reduction (DRR) and climate change adaptation (Huggel et al., 2015). The accessibility of disaster databases differs based on the purpose of its establishment; it ranges from open-access, limited to certain access or restricted. The databases are typically geographically dispersed and owned by multiple agencies and stakeholders including individuals around the world (Li et al., 2019). Open-access data provide opportunities to improve a country’s governance, making governments more accountable to their citizens.
There is a growing number of open data initiatives in developing countries. This is explained by five main drivers: political will to improve government effectiveness, interest of governments to increase accountability, internal pressure, external pressure and reputation gain (Davies, 2013). Developing countries are also increasingly promoting open data initiatives combined with crowd-sourced information with a strong focus on transparency, accountability and citizen participation. However, there are several challenges associated with open-access data. These include unstructured data sources, missing key data and information veracity (Harvard Humanitarian Initiative, 2011; Smith, 2013; Shah et al., 2015). These challenges have caused lack of confidence, leading to underutilization of open-access data. In line with the SFDRR, data democracy has been intensified to promote sharing and transfer of advanced technology among nations (Li et al., 2019).
A majority of the global databases on disasters collect information on loss and damage. The loss and damage data provided by global databases are historical and retrospective in nature. A common set of indicators are generally used although they vary in definition across databases. A major driver of increasing loss and damage is the growth of people and assets or infrastructure in urban areas (The World Bank, 2015). Open-access data provide a pathway for building urban resilience. Building resilience is most effective when information is available on risks, which relates to the chance that people, assets, infrastructure or the environment may experience adverse effects when exposed to hazards. Information on hazards and exposure is fundamental for risk modeling that supports investment decisions and offers alternatives to stakeholders. This situation is highly context specific and detailed information on hazards and exposure could provide better comprehension of the real scenario. There are several international and national databases available that provide information on hazards, where efforts to improve data consistency and management is an ongoing issue (Wirtz, et al., 2014). Procuring information on exposure is more challenging; data is often not accessible, aggregated, disparate, limited or altogether non-existent.
The term exposure is globally defined as the situation where people, infrastructure, housing, production capacities and other tangible human assets are located in hazard-prone areas (UNDRR Terminology, 2017). Exposure is connected to vulnerability and hazards in risk modeling. The term “exposure element” and “exposed element” is limited in the peer reviewed literature. The term “element at risk” is more common (Bell and Glade, 2004; Papathoma-Kohle et al., 2007; van Westen et al., 2012; Papathoma-Kohle, 2016; Rozaimi et al., 2018). In many cases, elements at risk refers to critical infrastructure (Forzieri et al., 2016; Di Felice, 2020; Hawchar et al., 2020; Papilloud et al., 2020). A broader classification of elements at risk covers physical, social and environmental elements such as essential facilities, transportation facilities, lifelines, population, economic activities, socio-economic aspects and environmental functions (van Westen, 2014). In this paper, all elements at risk are referred to as exposure elements or exposed elements.
A common perception in this era of big data and hyper-connectivity is that all disaster events and exposure elements in every place on earth is mapped in detail. However, the extent of data on exposure elements in global databases have not been examined in detail. The nature of the available information including its availability across scales and systems is largely unknown. In conjunction with information on hazards, data on exposure elements is critical for the development of disaster risk reduction strategies to enhance resilience over time. This is in line with the SFDRR, which gives emphasis to disaster risk reduction as an important precept; to move away from merely managing disasters to managing the risk of disasters. In light of this necessity, this paper reviews the coverage of information on exposure elements in line with the SFDRR and the Sendai Framework Monitor (SFM), its official tool for reporting progress, to provide an overview of the availability of this data for local scale application in existing disaster databases. The paper also reviews the availability of such information within the national system and illustrates its use in facilitating informed decision-making at the local level, through a case study of Kuala Lumpur, Malaysia.
Materials and Methods
Content Analysis
Content analysis is a systematic information screening technique that is increasingly common in disaster research. The technique has been used to extract information related to disasters such as awareness levels from crowd-source platforms and websites (Karami et al., 2019; Riyanto et al., 2019). Content analysis was used in this study to gather and assess disaster related databases from multiple sources such as the peer reviewed literature, internet, government reports and other unpublished documents. A variety of keywords were used in several stages of screening including disaster database, disaster system, exposure, critical elements, big data, data gaps, flood open source, disaster open source and flood database in all of the search platforms. Targeted platforms include the Web of Science and Scopus database, within a time frame of 2010–2020 as well as the internet. This period was selected to coincide with five years since commencement of the SFDRR.
The first phase of screening focused on the peer reviewed literature. The screening yielded a collection of peer reviewed journal articles, which was further assessed to scope the wide variety of description on exposure elements. The information was used to organize exposure elements into indicators that correspond to the major categories of the SFDRR and SFM. The second phase involved using results of the initial findings to conduct a targeted search for identifying disaster databases from the internet. The keywords were also used to delineate websites that were not identified in the peer reviewed literature. The databases that were delineated were then systematically scrutinized to extract information related to accessibility, scale, type of disaster, nature of information and availability of exposure element data. The final phase of screening targeted government reports, local media reports and other unpublished documents. The keywords were used in both English and the national language to identify description of exposure elements and national databases. The findings from all phases were used to generate basic information to conduct spatial analysis for the case study of Kuala Lumpur.
Spatial Analysis
Spatial analysis was conducted using Geographical Information Systems (GIS) in the case study of Kuala Lumpur. The intention was to compare information on exposure elements and flooded vicinities from a recent event in the city, to flood hazard zones and areas susceptible to flash floods. Information on exposure was obtained from open-access international and national databases that was previously evaluated using content analysis, to identify indicators that could be used to develop an exposure inventory for Kuala Lumpur. Data from the inventory was then translated into the form of a map within GIS, depicting the distribution of exposure elements in the city (Table 3). Information on flooded vicinities from the serious event that occurred on September 10, 2020 in Kuala Lumpur was obtained from multiple open source databases. The inundated area was compared to the exposure elements, flood hazard zones and areas susceptible to flash floods within the GIS to get a broader retrospective view of the risks involved and where possible, identify underlying factors that account for further investigation.
Information on flood hazards was reproduced from the official flood hazard maps of the Department of Drainage and Irrigation (DID) Malaysia. The DID has developed river flood hazard maps that cover the entire county at the national scale. The flood hazard zones were delineated through hydrodynamic modeling showing the extent area and depth of river floods. The map facilitates regional-scale planning. The flood hazard maps from DID were transformed into a layer within the GIS. An important point to note is that government information on hazards is restricted. While the report is available for research purposes, the information is not accessible to the public.
Information on flood susceptibility was obtained as a GIS layer from a study in Kuala Lumpur conducted by a research multidisciplinary consortium funded by the Newton Ungku Omar Fund (NUOF), jointly led by University of Cambridge and University Kebangsaan Malaysia with involvement of 14 other partner institutions representing academia, the private sector and non-government organizations from the United Kingdom and Malaysia. Working in conjunction with the City Hall of Kuala Lumpur, the NUOF consortium produced a flood susceptibility map for the city, where the work was led by the consortium partner, JBA Risk Management. The NUOF flood susceptibility map has detailed coverage of Kuala Lumpur. Using high quality terrain maps and local data, flood susceptible areas were demarcated using two-dimensional flow paths to capture both river and pluvial floods. The purpose of the map is to facilitate urban flood management. The GIS layer of the flood susceptibility map was obtained from the NUOF consortium, where the findings are in the process of being published.
Results
Coverage on Exposure Elements
The SFDRR comprises seven global targets and the SFM its management tool comprises 38 indicators to measure progress in achieving these targets. The SFDRR global target on critical infrastructure and basic services (Target D), relates directly to exposure elements and these can be separated into five major categories. These are health facilities, educational facilities, basic services, social aspect and economic aspect (Table 1). There are about 20 SFM indicators that can be organized into each of these five major categories.
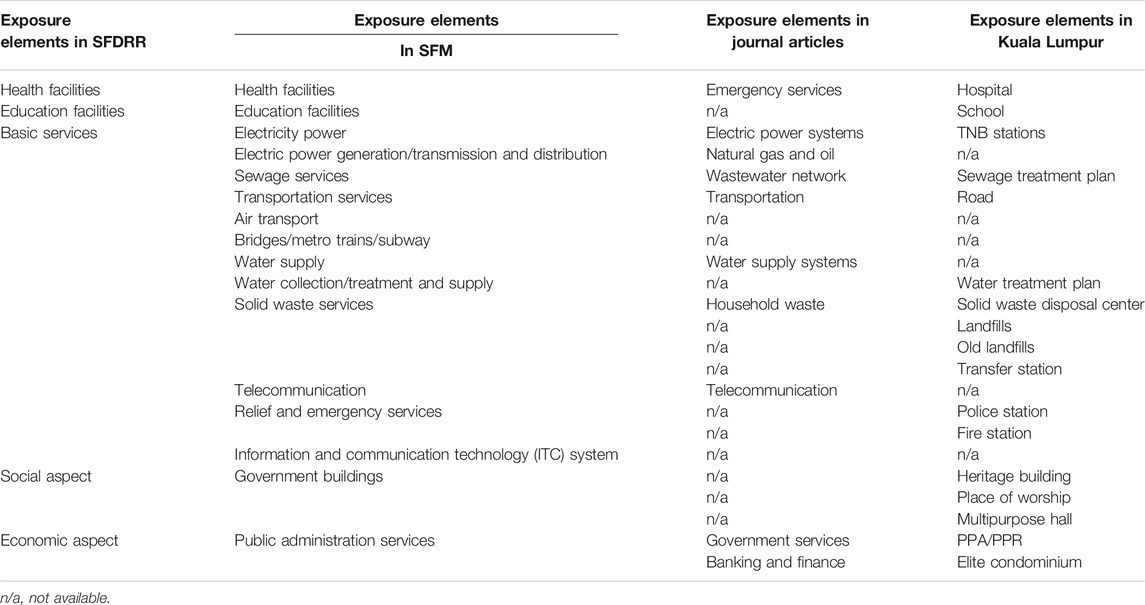
TABLE 1. Exposure elements organized into the five major categories of SFDRR (Target D).
The assessment of selected journal articles indexed by WoS and Scopus between 2015 and 2020 reveals that there are at least 50 journal papers that discuss exposure elements and natural hazards in the context of reducing the risk of disasters. The coverage of information on exposure elements in the selected journal articles provides insights on the state of science in supporting progress in disaster risk reduction efforts as aspired by the SFDRR. However, the papers only cover ten indicators that represent four of the five major categories of exposure elements mentioned in Target D of the SFDRR (Table 1). The indicators relate to elements such as emergency services, transportation, water supply systems, electric power systems, natural gas and oil, household, wastewater network, government services, banking and finance and telecommunications. The major category of educational infrastructure is not represented in the scientific literature. This situation is worrying as it appears that the exposure of educational facilities to the risk of disasters is not well researched in the scientific domain. Data related to the major category of basic infrastructure is also not well covered within disaster related scientific literature. In addition, information on exposure elements that reflect major categories of the social aspect and economic aspects, particularly regarding features that can be mapped is extremely limited.
The keywords derived from the content analysis of scientific literature indexed by WoS and Scopus were also used to assess selected government and media reports as well as other unpublished documents in Malaysia. Keywords used in English and the national language generated information that could be used to develop nearly as many indicators as the SFM covering all major categories of the SFDRR (Table 1). More importantly, all the data gathered for Kuala Lumpur were from open-access sources and could be geocoded to enable the development of a spatial database of exposure elements. The availability of such open-access data provides an opportunity for researchers to process and share disaster risk information with the public to increase transparency and build the resilience of communities.
Overview of Disaster Databases
The content analysis of scientific literature indexed by the Web of Science and Scopus and the internet revealed a total of 26 databases that provide information on disasters and related elements (Table 2). A majority of the databases were identified from the internet. Only a quarter of the database sources have been obtained from scientific peer reviewed articles. It appears that EM-DAT, NatCatSERVICE, Sigma and DesInventar are the common databases reported in scientific articles. The Emergency Events database (EM-DAT) appears to be the most used and among the most known multi-peril disaster database that is operating worldwide. The EM-DAT has been used in multiple disaster resilience work, including epidemiology of global extreme weather events as well as modeling of floods and damages (Hu et al., 2018; Cuthbertson et al., 2019; Luu and Meding, 2019; Banica et al., 2020; Keim, 2020). The database NatCatSERVICE is used to assess weather-related disaster trends and Sigma is used flood insurance studies (Kron et al., 2012; Hoeppe, 2016). DesInventar has become source of data for modeling hazard susceptibility (Garcia-Soriano et al., 2020), exposure analysis (Cabral et al., 2017) and other studies. Due to its link to the SFM, the database is widely used and cited in policy documents and scientific studies.
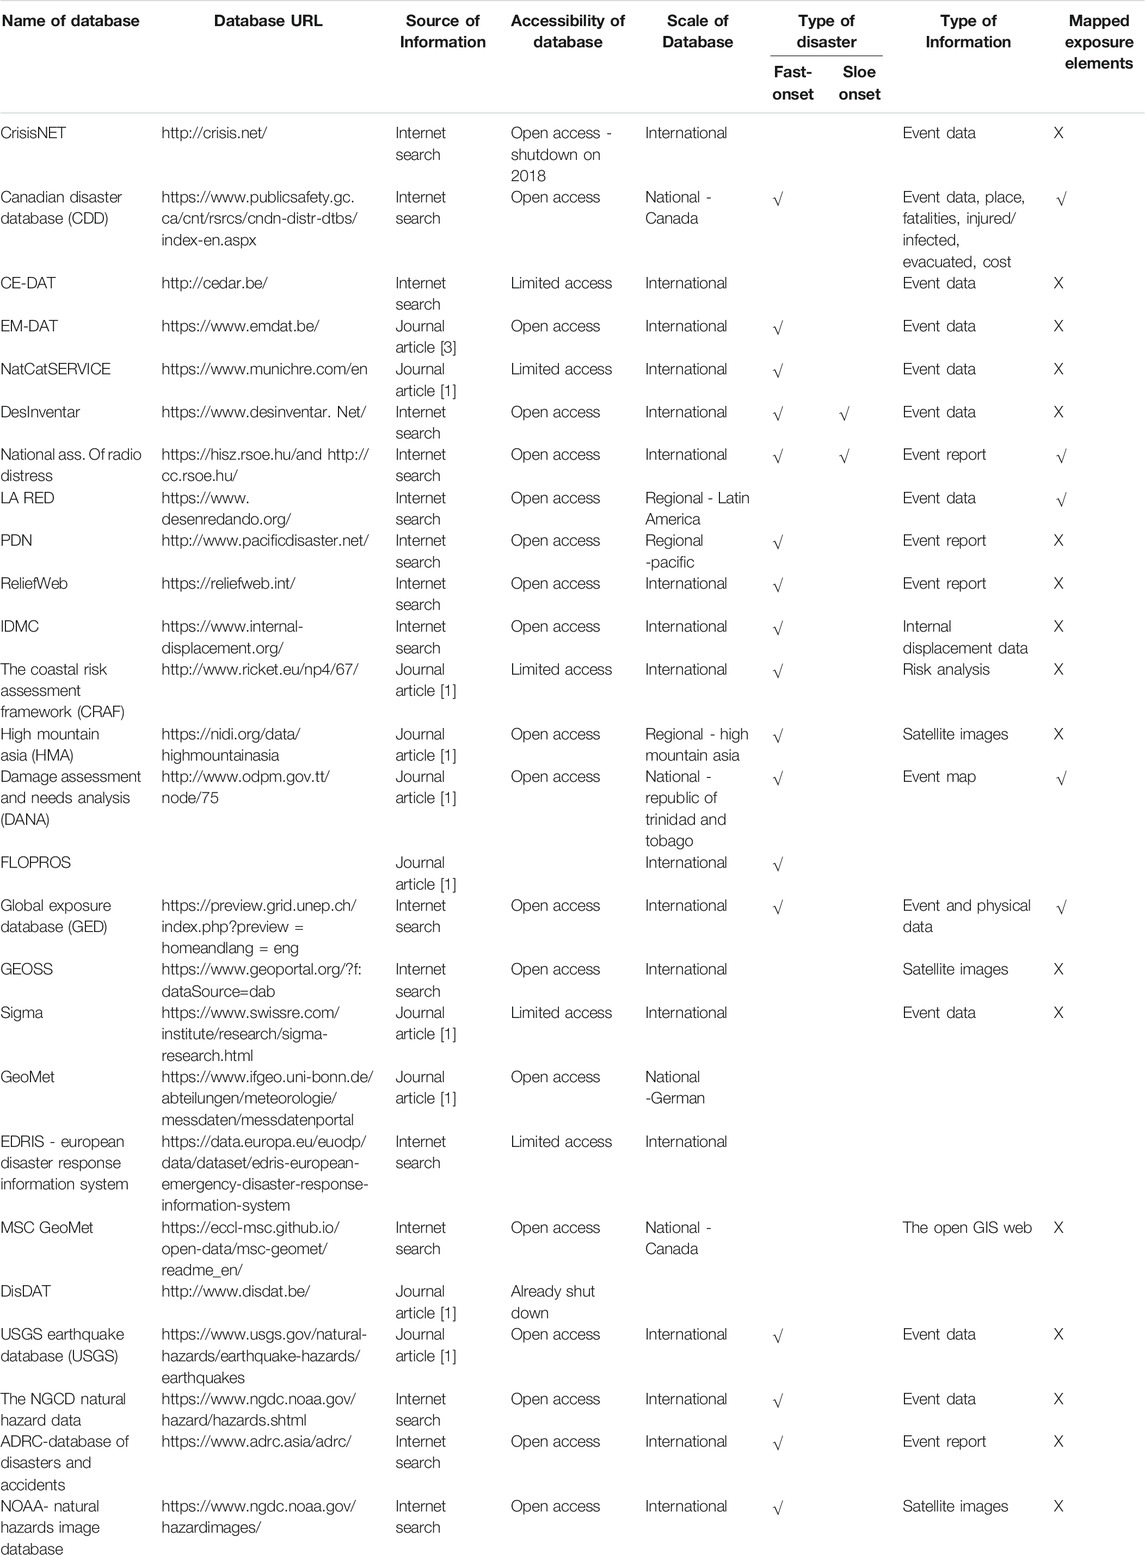
TABLE 2. An overview of disaster related databases available on the internet (as of October 2020).
The databases vary with respect to accessibility, scale, type of disasters and type of data that is available (Table 2). In terms of accessibility, only 10 databases are open access where the user is able to easily retrieve data. The remaining are of limited access with a “view only” option, while one that was obtained though the peer reviewed journal has ceased operations. With respect to scale, 18 databases are global in nature, three are regional and four provide information at the national scale.
Where information is accessible, the databases are found to provide retrospective information i.e. data collected after the occurrence of a disaster event. The majority of the information is on fast onset disasters such as floods, typhoons, earthquakes, tsunami, etc. Only two databases provided information on slow onset disasters, specifically drought and environmental pollution. One of these is DesInventar, which draws on national databases. The other is the National Association of Radio Distress-Signalling and Infocommunications (RSOE), which manages a special site dedicated to climate change and slow onset disasters. With respect to type of data, a majority of the databases provided information on events primarily regarding loss, damage, fatalities and affected numbers but these are rarely depicted spatially. A few databases provide disaster relevant thematic information. There is one database (The Coastal Risk Assessment Framework, CRAF) that provides information on hotspot areas at the global scale but access to this database is limited. Only five databases record exposure element data, and of these only one national database provides information on exposure elements with spatial attribution. None of the 26 databases provided information that could be used for the case study of Kuala Lumpur.
Case Study of Kuala Lumpur
Kuala Lumpur is situated at the confluence of the Klang and Gombak rivers in the west-coast of Peninsular Malaysia. Administered by the City Hall of Kuala Lumpur (DBKL), the city is divided into six strategic zones (Figure 1). These are Sentul-Manjalara, Wangsa Maju-Maluri, Damansara-Penchala, Pusat Bandar, Bukit Jalil-Seputeh and Bandar Tun Razak-Sungai Besi. Development here is faster relative to other cities in Malaysia. Rapid urbanization and drastic population growth have widened economic opportunity and improved infrastructure. However, uncontrolled urban expansions have negatively impacted the environment and the community. Rapid urbanization has been identified as an important driver of disaster risk (UNISDR, 2015; Nisiri et al., 2019).
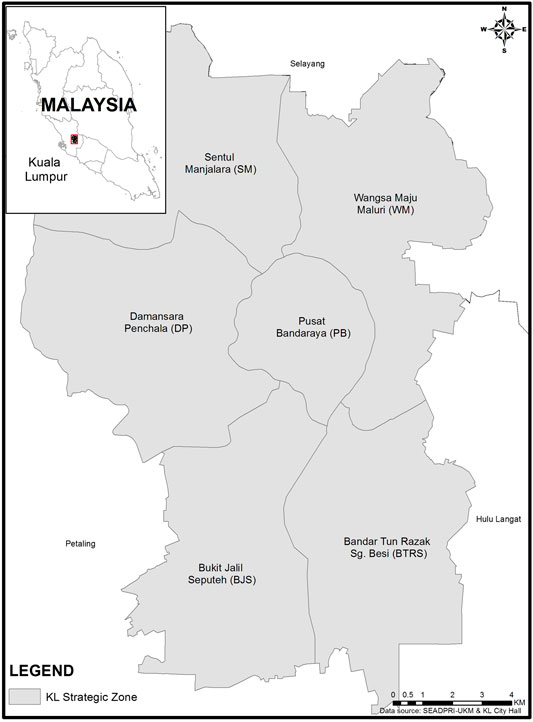
FIGURE 1. Kuala Lumpur is located within the State of Selangor in Peninsular Malaysia and comprises several strategic zones.
Kuala Lumpur is frequently hit by flash floods after prolonged heavy storms, causing substantial damage to property and infrastructure. Such events are not considered disasters by national standards but they pose an inconvenience; causing traffic jams and disrupting socioeconomic activities of affected city population. Rapid urbanization coupled with inefficient urban drainage has been the cause of flash floods in Kuala Lumpur (JPS, 2017; Kong et al., 2010; Nuhu and Ali, 2017; Arshad et al., 2020). This is in part due to the increase of impermeable areas that causes rainwater to flow faster into the drainage system, exceeding its capacity. The existing drainage capacity has not been increased to keep up with the expansion of the city. The government has taken measures to overcome flash floods in Kuala Lumpur through implementation of the Stormwater Management and Road Tunnel (SMART), which diverts flood water away from the central prime areas. However, after the development of the SMART tunnel, a new phenomenon of stagnant water referred to as water ponding has been reported in Kuala Lumpur (Arshad et al., 2020).
Information on exposure elements (i.e., potentially exposed elements) in Kuala Lumpur were obtained from multiple open data sources within the national system. Those from open-access platforms were obtained with their spatial attribution while others were geocoded where necessary, to develop an exposure element data inventory for Kuala Lumpur (Table 3). There are 509 exposure elements within Kuala Lumpur covering 33 private and government hospitals and community clinics; 189 public and private schools and institutions higher education; 261 facilities that provide basic services; and 26 features that represent of social and economic aspects (Table 1). The information was transformed into indicators across the strategic zones of Kuala Lumpur, representing health facilities, educational facilities, basic services and others (Figure 2). The exposure elements in the inventory can be easily disaggregated to be in coherence with the SFDRR. The local level inventory on exposure elements, in conjunction with information on hazards, serves as the basis for a comprehensive an open-access disaster risk platform with spatial attribution. The city center (Pusat Bandaraya, PB) is the strategic zone with the highest density of exposure elements with a total number of 135. The total density in other strategic zones are 103 (Wangsa Maju Maluri, WM), 86 (Sentul Menjalara, SM), 67 (Damansara Penchala, DP), 61 (Bandar Tun Razak Sg Besi, BTRS) and 46 (Bukit Jalil Seputeh, BJS).
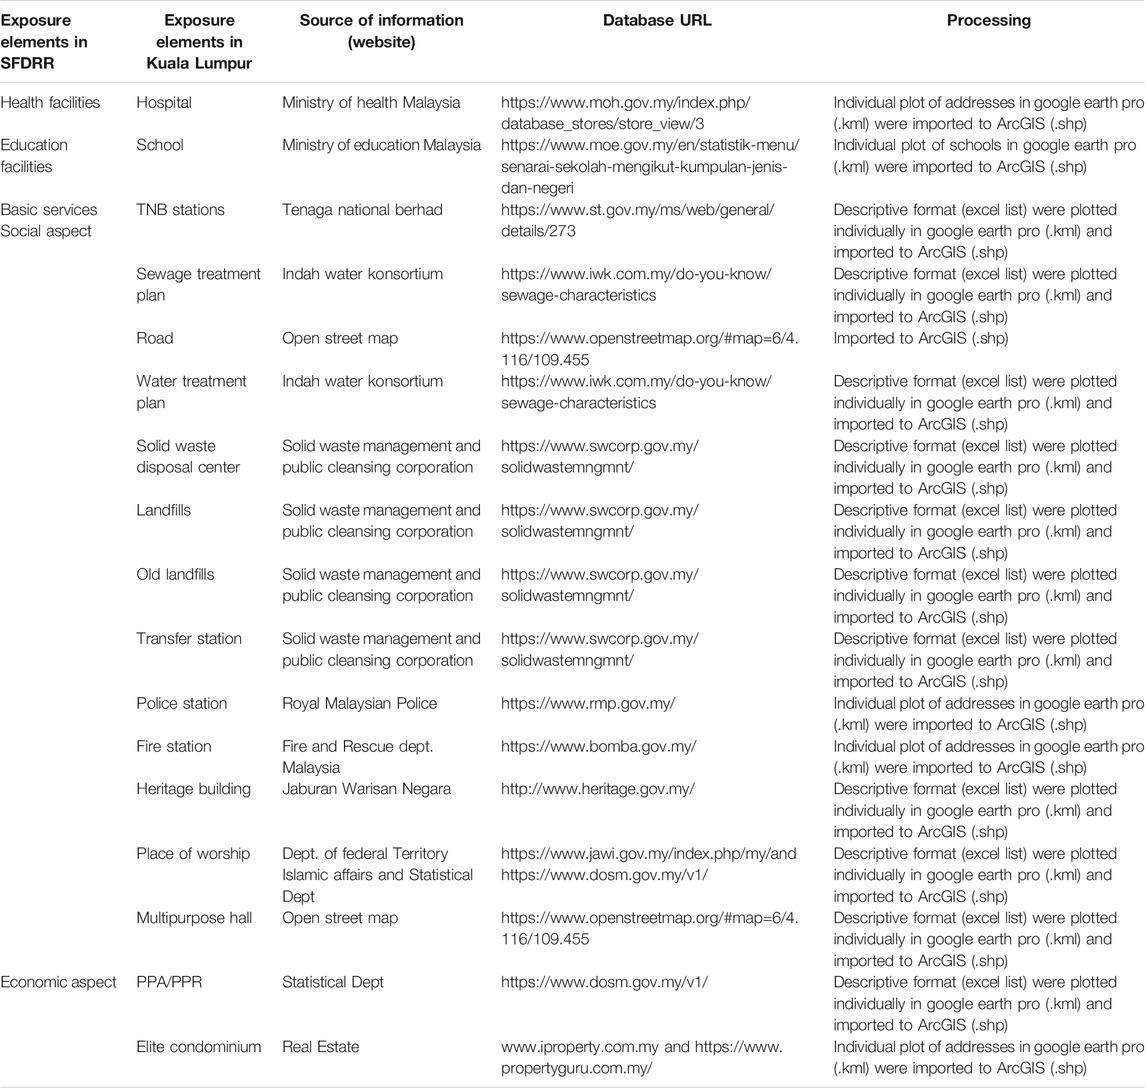
TABLE 3. Local open-sources of information on exposure elements in Kuala Lumpur.
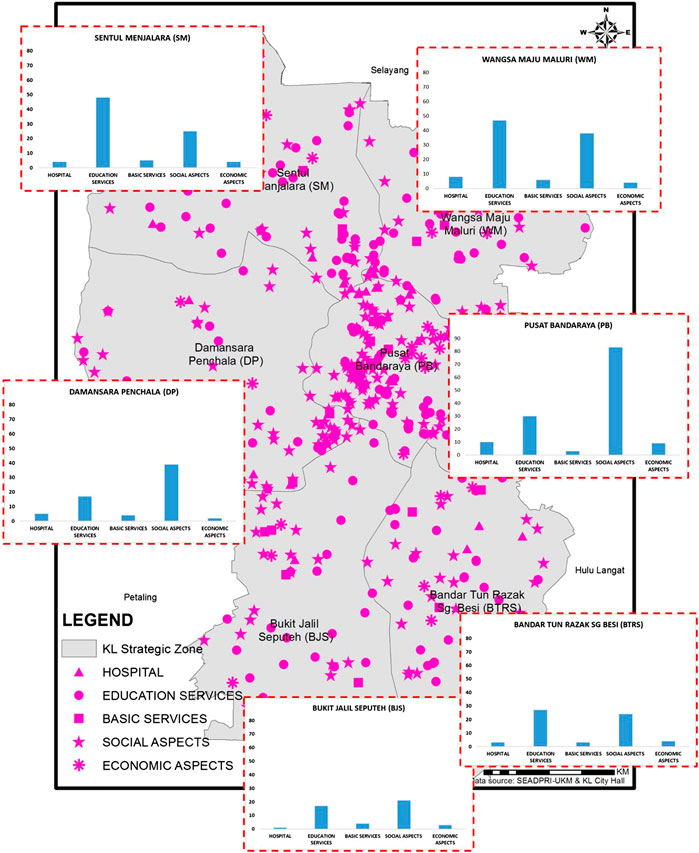
FIGURE 2. Exposure elements in Kuala Lumpur developed from open source data. The height of the bar indicates the number of facilities in the various strategic zones of Kuala Lumpur.
On September 10, 2020, about 16 vicinities in Kuala Lumpur were inundated by flash floods and water ponding as a result of heavy downpour that lasted for 5 h, from 1,300 to 1,600 (Figure 3). According to media reports, seven of the vicinities are located in the Wangsa Maju Maluri strategic zone, eight in the Pusat Bandaraya strategic zone and one vicinity is beyond the Kuala Lumpur boundary. A majority of the inundation events occurred in the northeastern part of the city. The event also caused stretches of roads to be inundated with water that overflowed from the Klang and Gombak rivers. The prolonged rain coupled with the inefficient drainage system of the city could not accommodate the surface water runoff. All of the 16 inundated vicinities were geocoded and plotted in the GIS environment, and compared to the flood hazard zones of DID and flood susceptibility area developed by the NUOF research consortium, to delineate the pattern of flash flooding and water ponding on that particular day (Figure 4). The flood hazard zones of DID is almost entirely within the flood susceptibility area of the NUOF research consortium. This is not surprising as the flood susceptibility map has wider coverage, taking into account both river and pluvial floods.
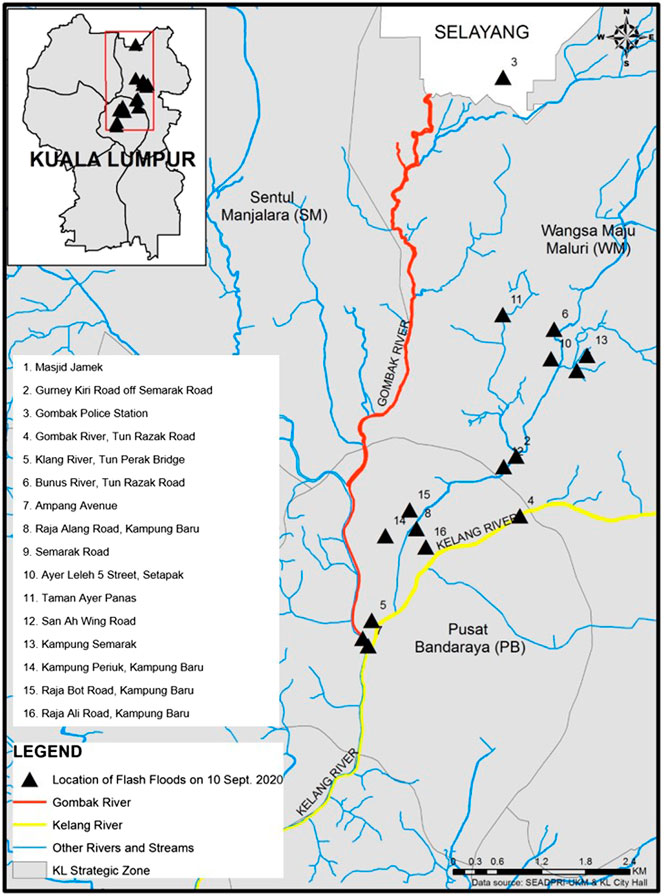
FIGURE 3. The location of inundated vicinities due to flash floods and water ponding in Kuala Lumpur on September 10, 2020.
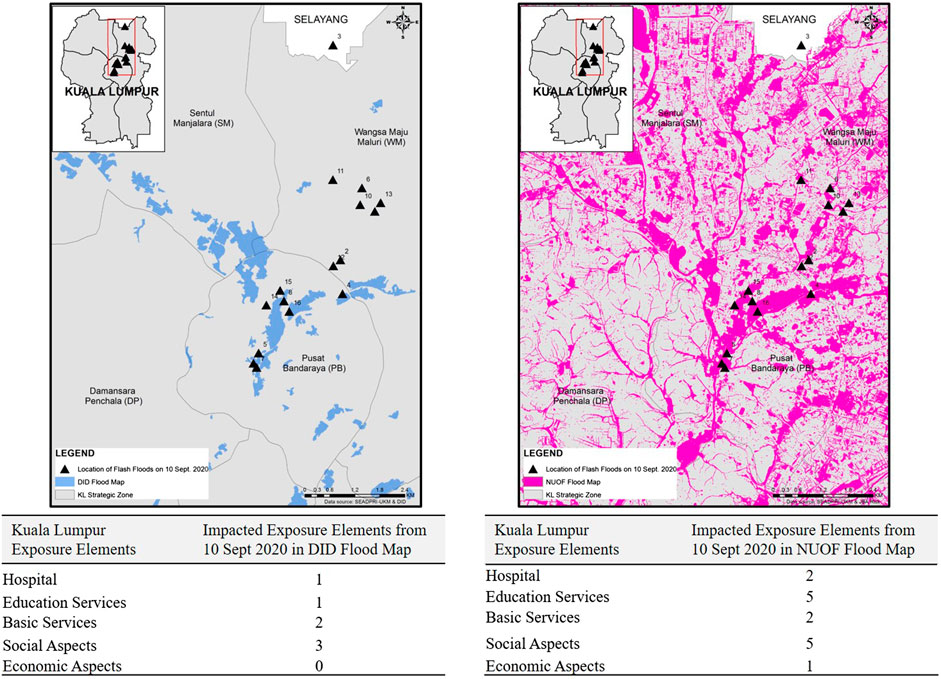
FIGURE 4. The extent of flood hazard zones of DID and flood susceptibility areas of the NUOF research consortium, with number of exposure elements therein. The numbered vicinities are available in Figure 3.
Based on media reports, the exposure elements that were inundated were identified as a police station, hospital, train station, religious building, several schools and other infrastructure (Table 3). The police station was outside of the Kuala Lumpur administrative area. Not all of the exposure elements were within the flood hazard zones identified by DID; some were located outside. However, all of the exposure elements were within the flood susceptibility map of the NUOF research consortium. This provides a reasonable degree of confidence that the open source exposure elements and susceptibility map for Kuala Lumpur can be shared with the public, with an appropriate disclaimer to account for uncertainty and a strict caveat on its limitation for use in legal proceedings. Notwithstanding, further validation is required before the inventory is shared with the public through an open-access platform for wider coverage. This is to ensure that the information is reliable for communities to self-organize and make informed decisions to build disaster resilience. The information is expected to promote greater understanding on areas that should be given priority, to advocate for better management of the risk of flash floods and water ponding. This could contribute to reduce the impact of disaster events in Kuala Lumpur.
Discussion
The coverage of information on exposure elements in the context of hazards and disaster risk reduction in indexed journal articles, provides interesting insights on the development of research over the first five years of the implementation of the SFDRR. Within the research domain, it appears that exposure elements are not well covered in four of the five major categories of global Target D in the SFDRR, i.e., educational facilities, where there is no indicator; basic infrastructure, social aspects and economic aspects where the coverage in poor. This means that scientific guidance is lacking on how to translate data and develop indicators of exposure elements that could be mapped within hazardous areas; particularly those representing social and economic aspects. Scientific research should be enhanced for developing quality assurance standards to ensure data consistency and management.
The poor coverage of exposure elements in the research domain is mirrored in the operational domain; the majority of the 26 databases assessed record loss and damage data, while a limited number compiled information on hazards. Only five databases record information on exposure elements; with spatial attribution in one national database. None was useful for developing exposure elements in the local level case study. Detailed exposure analysis is only possible if explicit geographical data is available on exposure elements complimented by well-established hazard zones (Fekete et al., 2015; Fekete et al., 2017; Papilloud et al., 2020). Various open access data platforms can be used for this purpose including open street map, google earth and GEOSS, among others. It has been reported that high resolution maps of exposure elements are available, to supplement hazard data for risk assessment at the local scale, but only for specific projects (GFDRR, 2014). The case study of Kuala Lumpur validates this finding, where information was generated from multiple national sources to develop a range of spatially attributable indicators, which are comparable to the SFM, covering all major categories of the SFDRR.
Accessibility to disaster databases is limited where only ten of the 26 databases that were identified provided easily retrievable information. The most common databases for the research community are EM-DAT, NatCatSERVICE, Sigma and DesInventar, as reflected in indexed journal articles. Exposure element data was available in five databases that were assessed but only one national database provided information with spatial attribution. The national database provides better spatial resolution compared to global databases. This study supports previous findings that existing disaster databases have limitation in capturing exposure elements such as roads, energy and water supply (Moriyama et al., 2018; Zaidi, 2018). It also supports the observation that access to national and regional databases are usually limited or restricted (Myroshnychenko et al., 2015). It appears that this situation has not changed in the first five years of the SFDRR.
There is a need of granular and disaggregated data to develop evidence-based policies that lead to more inclusive outcomes. The procurement of accurate data and information on exposure elements requires data from multiple agencies. However, if the origin of the data sources is restricted, it is impossible that the information gathered will be an open-access. Furthermore, it is faster to obtain the information from open-access data, particularly for assessing large-scale disaster risks (Shah et al., 2015). It is anticipated that open-access data that leverages effectively with crowd-sourced information, will significantly facilitate decision-making processes.
While it is understandable that the development of a disaster database with information on exposure elements is a major challenge at the global level, such data is important in ensuring social and economic resilience of a community and more so in densely populated urban areas. The case study of Kuala Lumpur has shown that data could be gathered from multiple open-access sources and be spatially attributed where necessary, to enable the development of a spatial database of exposure elements. This database has been proven to be very useful when coupled with open-source information on flood susceptibility in Kuala Lumpur. Exposure elements in such zones could be given priority for risk reduction measures. Future work could focus on developing the current system to incorporate crowd-sourced information.
The disaster databases that were evaluated provided retrospective information such as loss and damage, fatalities and affected numbers. Prospective information such as probability of occurrence or maps depicting risks, hazards or susceptibility is not available. Thus, the case study of Kuala Lumpur had to rely on national information sources from the DID and the NUOF research consortium. The case study revealed that the DID flood hazard map, which was developed for rivers at the national scale was found to be less useful than the NUOF flood susceptibility map. This is because the map of the NUOF consortium draws on more detailed information and deploys a modeling approach to capture both river and pluvial flooding, to facilitate urban flood management. Hazard susceptibility maps need to be developed at appropriate scales to supplement information on exposure elements. The case study of Kuala Lumpur also revealed that damages associated with the event on September 10, 2020 is currently not available. There is no open source database on damages associated with small-scale disasters, such as those reported in Kuala Lumpur. Additional detailed work involving primary field surveys is required to assess such damages. Research consortiums have to be encouraged to conduct further work in Kuala Lumpur and make damage information available in the public domain.
Building resilience in cities require investment that prioritize expenditure on ventures that work well under various conditions. If disaster events take place, it is important to maintain the provision of essential services such as education, health care, transportation and other basic services. The availability of prospective information on disaster risks in conjunction with exposure elements will enable decision-makers to make effective interventions even before disaster strikes. In light of climate change, a prospective approach is critical at the local level to build long-term resilience. Such approaches could draw on improvements in modeling, which is progressing fast in the research domain to cover both fast and slow onset climatic hazards. When linked to the exposure elements in the existing database already developed for Kuala Lumpur, the capacity to provide information on disaster risks over time will increase. The public could be made aware of the multi-hazards that evolve over time and affect the exposure elements in the city.
ZECKJThe case study of Kuala Lumpur has shown that data could be gathered from multiple open-access sources and be spatially attributed where necessary, to enable the development of a spatial database of exposure elements. Drawing on this experience, a quick search for similar open-source databases on exposure elements using keywords in English reveals that similar information exists in Southeast Asia (Table 4). Information on hospitals is widely available in the region while data on schools are available in all countries except Myanmar and Vietnam. The highest number of open source database on basic services, social and economic aspects is available for Singapore, presumably because English is the national language. Countries such as The Philippines, Brunei, Cambodia and Thailand have several databases on exposure elements while Indonesia, Laos, Myanmar and Vietnam have the least. With respect to national risk maps, only Indonesia has an open access disaster risk portal (http://inarisk.bnpb.go.id/about) covering multiple hazards, which is in the local language. It is likely that information on exposure elements, disaster and climate risks, hazards and susceptibility could be obtained from open access reports and publications in the local languages of the region. There is potential for a study similar to Kuala Lumpur to be replicated in major cities and settlements of the region. Open sharing of information on disaster and climate risks can be advanced in Malaysia and Southeast Asia by empowering and enabling local level research. The availability of such information would support efforts to build the resilience of communities that do not have access to such information and are not aware of the current and emerging hazards that will impact the exposure elements that they depend on. Moving forward, detailed analysis covering more features could be conducted to substantiate preliminary findings. More practical innovation can be achieved by incorporating crowd-sourced information. This is seen as critical to build the confidence of the community and promote informed decision-making.
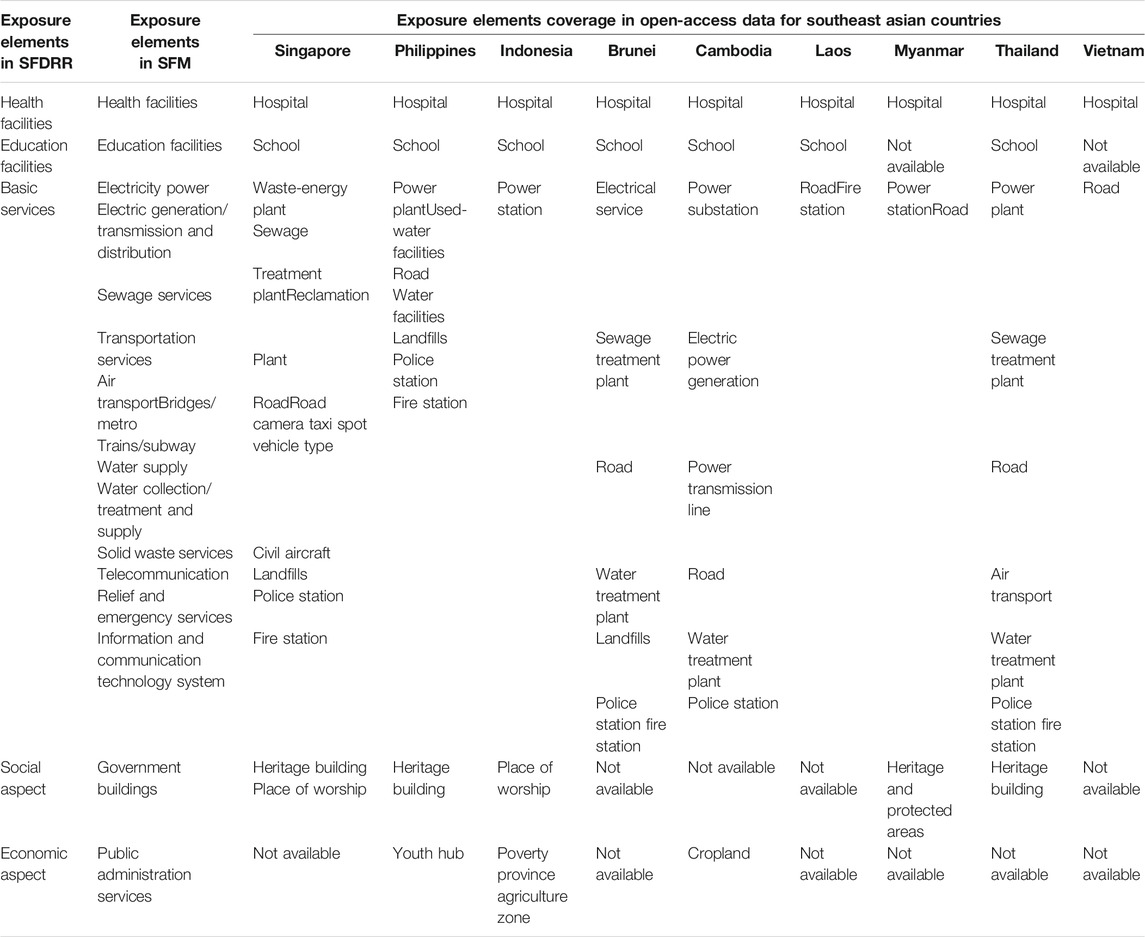
TABLE 4. Coverage of information on exposure elements in southeast asia (as of January 2021).
Conclusion
The SFDRR global target on critical infrastructure and basic services (Target D), relates directly to exposure elements, which are spread over five major categories; health facilities, educational facilities, basic services, social and economic aspects. There are about 20 SFM indicators of exposure elements that can be organized into each of these five major categories. Exposure elements are not well covered in the research domain, as reflected by scientific literature, where only ten indicators represent four of the five major categories of the SFDRR. There is no indicator for the category of educational infrastructure, while the coverage is poor for data on basic infrastructure, social and economic aspects. Scientific guidance is lacking on how to translate data and develop indicators of exposure elements that could be mapped within hazardous areas; particularly those representing social and economic aspects. Enhanced research is required to develop robust indicators and standards as well as ensure data quality, consistency and management. The coverage of exposure elements in disaster databases is very poor, where only five of the 26 databases evaluated had a record of such information; with spatial attributes available in a single national database. The records were not useful for local scale application in Kuala Lumpur.
Informed decision-making requires data on hazards and exposure elements at the appropriate scale, to better manage the risk of disaster events. The case study illustrates this point in Kuala Lumpur. There is limited public accessibility to official information on hazards, exposure and disaster risks in the country. This is the motivation to find alternate scientifically robust avenues to generate information using open-access data on exposure elements, to compliment previously established hazard zones. An exposure element database was successfully developed for Kuala Lumpur. There are 509 exposure elements within Kuala Lumpur, covering 33 private and government hospitals and community clinics; 189 public and private schools and institutions higher education; 261 facilities that provide basic services; and 26 features that represent of social and economic aspects. The exposure elements in the inventory can be easily disaggregated to be in coherence with the SFDRR. The information was compared to existing flood hazard zones and flood susceptibility from two different sources. A cursory analysis reveals that the flash flood and water ponding events in Kuala Lumpur on September 10, 2020 are located well within the zones of susceptibility that have been identified. Moving forward, detailed analysis covering more events will be conducted to substantiate the preliminary findings. This is critical to build the confidence of the community and decision-makers.
The case study of Kuala Lumpur can be easily replicated in other major cities of the country. Further work is required to delineate emerging hazards due to climate change. A similar effort can also be undertaken in Southeast Asia, to advance open sharing of information on disaster and climate risks. This can be implemented through a region-wide initiative to empower and enable local level research. The availability of open-access local information would support efforts to build the resilience of communities that do not have access to information on hazards and are not aware of the emerging impacts to the exposure elements that they depend on.
Data Availability Statement
The raw data supporting the conclusions of this article will be made available by the authors, without undue reservation.
Author Contributions
JP mobilized resources for the study. JP and NM conceptualized and designed the study. NM and SM conducted the field investigation. SM and NM analyzed the data. NM and SM wrote the manuscript. JP revised the manuscript. All authors read and approved the manuscript.
Funding
This project was funded by the Newton-Ungku Omar Fund (NUOF) Project on Disaster Resilient Cities under a research grant number XX-2017-002.
Conflict of Interest
The authors declare that the research was conducted in the absence of any commercial or financial relationships that could be construed as a potential conflict of interest.
Acknowledgments
The authors thank the editors for the opportunity to be part of this special issue. The authors would like to acknowledge the support from the NUOF Project Consortium especially JBA Risk Management, City Hall of Kuala Lumpur (DBKL), Department of Irrigation and Drainage (DID) and colleagues from the Southeast Asia Disaster Prevention Research Initiative (SEADPRI-UKM) in conducting the research.
References
Arshad, S. H. M., Asnor, M., I., Muhamad, N., and Pereira, J. J. (2020). Penilaian keberkesanan terowong SMART Kuala Lumpur dalam menghalang banjir kilat. Malaysian J. Soc. Space. 16, 3. doi:10.17576/geo-2020-1603-14
Bell, R., and Glade, T. (2004). Quantitative risk analysis for landslides - examples from bildudalur, NW-Iceland. Naturals Hazards Earth Syst. Sci. 4, 117–131. doi:10.5194/nhess-4-117-2004
Bănică, A., Kourtit, K., and Nijkamp, P. (2020). Natural disasters as a development opportunity: a spatial economic resilience interpretation. Rev. Reg. Res. 40. 223–249. doi:10.1007/s10037-020-00141-8
Cabral, P., Augusto, G., Akande, A., Costa, A., Amade, N., Niquisse, S., et al. (2017). Assessing Mozambique’s exposure to coastal climate hazards and erosion. Int. J. Disaster Risk Reduction. 23, 45–52. doi:10.1016/j.ijdrr.2017.04.002
Cuthbertson, J., Rodriquez-Liane, J. M., Roberston, A., and Archer, F. (2019). Current and emerging disaster risks perceptions in oceania: key stakeholders recommendations for disaster management and resilience building. Int. J. Environ. Res. Public Health. 16 (3), 460. doi:10.3390/ijerph16030460
Davies, T. (2013). Exploring incentives for transparency in developing countries Available at: http://www.opendataimpacts.net/2013/01/what-are-the-incentives-for-transparency-in-developing-countries/ (Accessed October 1, 2020).
Di Felice, P. (2020). Ranking of assets with respect to their exposure to the landslide hazard: a GIS proposal. Int. J. Geoinformat. 9, 326. doi:10.3390/ijgi9050326
IPCC (2018). “Summary for policymakers,” in global warming of 1.5°C. An IPCC special report on the impacts of global warming of 1.5°C above pre-industrial levels and related global greenhouse gas emission pathways,” in The context of strengthening the global response to the threat of climate change, sustainable development, and efforts to eradicate poverty. Editors V. Masson-Delmotteet al. (Geneva, Switzerland: World Meteorological Organization, IPCC), 32.
Fekete, A., Tzavella, K., Armas, I., Binner, J., Garschagen, M., Giupponi, C., et al. (2015). Critical data source; Tool or even infrastructure? Challenges of geographic information systems and remote sensing for disaster risk governance. ISPRS Int. J. Geo-Information. 4, 1848–1869. doi:10.3390/ijgi4041848
Fekete, A., Tzavella, K., and Baumhauer, R. (2017). Spatial exposure aspects contributing to vulnerability and resilience assessments of urban critical infrastructure in a flood and blackout context. Nat. Hazards. 86, 151–176. doi:10.1007/s11069-016-2720-3
Forzieri, G., Feyen, L., Russo, S., Vousdoukas, M., Alfieri, L., Outten, S., et al. (2016). Multi-hazard assessment in europe under. Clim. Change 137, 105–119. doi:10.1007/s10584-016-1661-x
Garcia-Soriano, D., Quesada-Roman, A., and Zamorano-orozco, J. J. (2020). Geomorphological hazards susceptibility in high density urban areas: a case study of Mexico city. J. South Am. Earth Sci. 102, 102667. doi:10.1016/j.jsames.2020.102667
GFDRR (2014). Building urban resilience: principles, tools, and practice. Available at: https://www.gfdrr.org/sites/gfdrr/files/publication/EAP_handbook_principles_tools_practice_web.pdf (Accesses.October 3, 2020).
Hawchar, L., Naughton, O., Nolan, P., Stewart, M. G., and Ryan, P. C. (2020). A GIS-based framework for high-level climate change risk assessment of critical infrastructure. Clim. Risk Manag. 29, 100235. doi:10.1016/j.crm.2020.100235
Hoeppe, P. (2016). Trends in weather related disaster consequences for insurers and society, Weather Clim. Extreme. 11, 70–79. doi:10.1016/j.wace.2015.10.002
Hu, H., Lei, T., Hu, J., Zhang, S., and Kavan, P. (2018). Disaster-mitigating and general innovative responses to climate disasters: evidence from modern and historical China. Int. J. Disaster Risk Reduct. 28, 664–673. doi:10.1016/j.ijdrr.2018.01.022
Huggel, C., Raissig, A., Rohrer, M., Romero, G., Diaz, A., and Salzmann, N. (2015). How useful and reliable are disaster databases in the context of climate and global change? A comparative case study analysis in Peru. Nat. Hazards Earth Syst. Sci. 15 (3), 475–485. doi:10.5194/nhessd-2-4331-2014
Humanitarian Initiative, Harvard (2011). Disaster relief 2.0: the future of information sharing in humanitarian emergencies. Washington, DC and Berkshire, UK: UN Foundation & Vodafone Foundation Technology Partnership.
JPS (2017). Laporan banjir tahunan bagi tahun 2016/2017, Available at: http://h2o.water.gov.my/man_hp1/Banjir_Tahun1617.pdf (Accessed September 19, 2020).
Karami, A., Shah, V., Vaezi, R., and Bansal, A. (2019). Twitter speaks: a case of national disaster sotuational awareness. J. Inf. Sci. 46 (3). doi:10.1177/0165551519828620
Keim, M. E. (2020). The epidemiology of extreme weather event disasters (1969–2018). Prehosp. Disaster Med. 35, 267–271. doi:10.1017/S1049023X20000461
Kong, Y. Y., Bahrun, N. A., and Kun, Y. (2010). A study on the urban flooding. Kuantan, Malaysia: Universiti Malaysia Pahang.
Kron, W., Steuer, M., Löw, P., and Wirtz, A. (2012). How to deal properly with a natural catastrophe database - analysis of flood losses. Nat. Hazards Earth Syst. Sci. 12, 535–550. doi:10.5194/nhess-12-535-2012
Li, G., Zhao, J., Murray, V., Song, C., and Zhang, L. (2019). Gap analysis on open data interconnectivity for disaster risk research. Geo-spatial Inf. Sci. 22, 1. doi:10.1080/10095020.2018.1560056
Luu, C., and Meding, J. V. (2019). “Analyzing flood fatalities in Vietnam using statistical learning approach and national disaster database,” in Resettlement challenges for displaced populations and refugees. Sustainable development goal series. Editor A. Asgary (Cham: Springer), 197–205.
Moriyama, K., Sasaki, d., and Ono, Y. (2018). Comparison of global databases for disaster losses and damage data. J. Disaster Res. 13 (6), 1007–1014. doi:10.20965/jdr.2018.p1007
Myroshnychenko, V., Nicolas, R., Anthony, L., Giuliani, G., Kideys, A., Weller, P., et al. (2015). Environmental data gaps in black sea catchment countries: INSPIRE and GEOSS state of play. Environ. Sci. Pol. 46, 13–25. doi:10.1016/j.envsci.2014.04.001
Nisiri, H., Mohd Yusof, M. J., Ali, T. A. M., and Hussein, M. K. (2019). District flood vulnerability index: urban decision-making tool. Int. J. Environ. Sci. Techno. 16, 2249–2258. doi:10.1007/s13762-018-1797-5
Nuhu, I., and Ali, M. (2017). A review of the literature on the roles and features of SMART tunnel. Kuala Lumpur, Malaysia. Int. J. Res. Rev. 2 (7), 465–475.
Papathoma-Köhle, M., Neuhäuser, B., Ratzinger, K., Wenzel, H., and Dominey-Howes, D. (2007). Elements at risk as a framework for assessing the vulnerability of communities to landslides natural hazards and earth system science. Copernicus Publications on Behalf of the European Geosciences UnionAvailable at: https://hal.archives-ouvertes.fr/hal-00299477/document (Accessed October 7, 2020).
Papathoma-Kohle, M. (2016). Vulnerability curves vs. Vulnerability indicators: application of an indicator-based methodology for debris-flow hazards. Nat. Hazards Earth Syst. Sci. 16, 1771–1790. doi:10.5194/nhess-16-1771-2016
Papilloud, T., Röthlisberger, V., Loreti, S., and Keiler, M. (2020). Flood exposure analysis of road infrastructure – comparison of different methods at national level. Int. J. Disaster Risk Reduct. 47, 101548. doi:10.1016/j.ijdrr.2020.101548
Riyanto, A., Sholihah, I. R. A., and Cahyadi, A. (2019). Comparative analysis of disaster information website based on Web usability evaluation and quality content of disaster information. E3S Web Conf. 76, 4–10. doi:10.1051/e3sconf/20197603009
Rozaimi, C. H., Qalam A’zad, R., Mohd Asraff, A., and Nur Afiqah, M. K. (2018). Extraction of element at risk for landslides using. Remote Sensing Method. 42, 4. doi:10.5194/isprs-archives-XLII-4-W9-181-2018
Shah, D. C., Anderson, C., Breimyer, P., Foster, S., Geyer, K., Griffith, J. D., et al. (2015). “Application of graph methods for leveraging open source data during disaster response,” in 2015 IEEE global humanitarian technology conference (GHTC); October 8–11, 2015; Seattle, WA; IEEE. doi:10.1109/GHTC.2015.7343982
Smith, G. (2013). Don’t count on your cell phone for help after the next huge hurricane Huffington post. Available at: https://www.huffpost.com/entry/cell-phones-hurricane-sandy_n_4118262 (Accessed October 1, 2020).
Terminology (2017). Available at: https://www.undrr.org/terminology (Accessed September 21, 2020).
The World Bank (2015). Investing in urban resilience: protecting and promoting development in a changing world. Washington DC: World Bank Group.
Van Westen, C. J. (2014). CHARIM: 5.2 characterization of assests - element at risk. Available at: http://www.charim.net/methodology/52#:∼:text=The%20definition%20of%20elements%2Dat,activities%2C%20public%20services%2C%20environment (Accessed September 27, 2020).
Van Westen, C. J., Straatsma, M., Turdukulov, U., Feringa, W. F., Sijmons, K., Bakhtadze, K., et al. (2012). Atlas of natural hazards and risks of Georgia. Tbilisi, GA: Caucasus Environmental NGO Network (CENN).
Wirtz, A., Kron, W., Low, P., and Steuer, M. (2014). The need for data: natural disasters and the challenges of database management. Nat. Hazards. 70, 135–157. doi:10.1007/s11069-012-0312-4
Keywords: exposure element, sendai framework, spatial data, flood hazard, disaster database, open-access, disaster risk reduction, Malaysia
Citation: Muhamad N, Arshad SHM and Pereira JJ (2021) Exposure Elements in Disaster Databases and Availability for Local Scale Application: Case Study of Kuala Lumpur, Malaysia. Front. Earth Sci. 9:616246. doi: 10.3389/feart.2021.616246
Received: 11 October 2020; Accepted: 26 January 2021;
Published: 25 February 2021.
Edited by:
Fang Chen, Institute of Remote Sensing and Digital Earth (CAS), ChinaCopyright © 2021 Muhamad, Arshad and Pereira. This is an open-access article distributed under the terms of the Creative Commons Attribution License (CC BY). The use, distribution or reproduction in other forums is permitted, provided the original author(s) and the copyright owner(s) are credited and that the original publication in this journal is cited, in accordance with accepted academic practice. No use, distribution or reproduction is permitted which does not comply with these terms.
*Correspondence: Joy Jacqueline Pereira, joy@ukm.edu.my, pereirajoy@gmail.com