Marine Sedimentary Carbon Stocks of the United Kingdom’s Exclusive Economic Zone
 Craig Smeaton
 Corallie A. Hunt
 William R. Turrell2
  William E. N. Austin
- 1School of Geography and Sustainable Development, University of St Andrews, St Andrews, United Kingdom
- 2Marine Scotland Science, Aberdeen, United Kingdom
- 3Scottish Association for Marine Science, Scottish Marine Institute, Oban, United Kingdom
Continental shelf sediments are recognized as long-term stores of globally significant quantities of carbon (C) and potentially provide an important, yet largely overlooked climate regulation service via the Earth’s C cycle. Current understanding of the spatial distribution of sedimentary C across continental shelves remains poor, inhibiting the targeted management and potential inclusion of these globally significant C stores into national C budgets. Further understanding of the spatial heterogeneity of continental shelf sediments and associated C provides a foundation to quantify the organic carbon (OC) stock and better understand the role that marine sediments play in regulating the global climate and the potential for CO2 to be released through anthropogenic disturbance of these C stores. Utilizing a spectrum of available marine data, we have created bespoke sediment maps that quantify the surficial (top 10 cm) OC stock and highlight significant spatial heterogeneity in the distribution of sediments and their associated C content across the United Kingdom’s Exclusive Economic Zone (EEZ). The surficial sediments within the UK EEZ are estimated to store 524 ± 68 Mt of organic carbon (OC) and 2,582 ± 168 Mt of inorganic carbon (IC). The spatial mapping of this C highlights well-defined OC accumulation hotspots in fjords, estuaries and coastal muds, while large accumulations of IC are found in the tidally swept areas around Orkney, Shetland and the South West of England. Within the well-defined OC hotspots, muddy sediments store the greatest quantity of OC; the muds offer potentially valuable opportunities for targeted future management and protection of sedimentary C stores within the UK EEZ. In the future, if areas of the seafloor were to be managed to include the protection of these valuable sedimentary C resources, we recommend an initial focus on hotspots of high sedimentary OC density.
Introduction
Marine sediments accumulating on the ocean floor are well known as traps and stores of large quantities of carbon (C) over long timescales. Globally, these environments are estimated to store 87,000 ± 43,000 Mt of organic carbon (OC) within the surficial sediments (Lee et al., 2019) with potentially up to 3,117,000 Mt OC held within the top 1 m of sediment globally (Atwood et al., 2020). Annually, the amount of OC held within these sedimentary stores increases by a further 156 Mt OC through the accumulation and burial of OC on the seabed (Berner, 1982; Hedges and Keil, 1995; Smith et al., 2015). However, the highly heterogeneous nature of the seabed means that large differences exist in the amount of OC trapped and stored across sedimentary environments. While representing only 8.9% of the global seabed area (Harris et al., 2014), continental shelf sediments are estimated to hold 16% of the global OC stock (Atwood et al., 2020) and annually account for 86% of all OC buried in marine subtidal sediments (Berner, 1982; Hedges and Keil, 1995). Even within these highly productive shelf environments, there are known OC burial “hotspots”. Fjords, for example, have been established as long-term stores of both OC and inorganic carbon (IC) (Smeaton et al., 2017) and, globally, are estimated to bury 18 Mt OC yr−1 (Smith et al., 2015), although Smeaton and Austin (2019) suggest that 18 Mt OC yr−1 may very well represent an overestimation due to the complex spatial heterogeneity of fjord sediments. These sedimentary environments are believed to play an important role in the global C cycle (Bauer et al., 2013; Bianchi et al., 2018) with an increasing number of proponents suggesting that these sedimentary systems provide a natural climate solution that mitigates climate change and requires management (Atwood et al., 2020; Avelar et al., 2017; Legge et al., 2020; Luisetti et al., 2019; Luisetti et al., 2020).
The advocates for the use of marine sedimentary C as a component to mitigate climate change propose that the natural and anthropogenic mechanisms governing the burial and storage of C are manageable. The proposed management options focus on preserving the current C stored within sediments as opposed to enhancing these natural processes through potentially ill-advised geo-engineering schemes (Zimmerman and Cornelissen, 2018). The most common threat to these sedimentary C stores is seabed disturbance, most commonly by bottom trawling (Luisetti et al., 2019; Atwood et al., 2020; Diesing et al., 2020; Legge et al., 2020). Bottom trawling is ubiquitous across continental shelf seas around the world and the disturbance of seabed sediments caused by trawling remobilizes the top layers of sediment exposing the OC to further remineralization. Unlike the other threats to sedimentary C storage, such as changing ocean temperature and oxygen concentrations, bottom trawling could potentially be managed to safeguard the most vulnerable OC stocks. Currently only 4% (118,000 Mt) of the OC stored in the top 1 m of marine sediments are (MPA) and of that only a small fraction of MPAs are monitored and managed for seabed disturbance. The remaining 96% of the OC stored in marine sediments is potentially at risk without the possibility of protection (Atwood et al., 2020). Globally, EEZ’s account for 52% (1,606,000 Mt) of the OC stored in these marine sediments (Atwood et al., 2020). The sediments held within the top 1 m of a maritime nation’s EEZ potentially store as much, if not greater, quantity of OC than their terrestrial equivalents; prompting a new interest in the inclusion of these environments and their significant C stores in national greenhouse gas (GHG) inventories and C reporting and trading schemes (Avelar et al., 2017; Luisetti et al., 2020). However, at present there are very few countries with a sufficiently detailed understanding of the magnitude and spatial distribution of C across their EEZ to test and implement options for sustainable marine sedimentary C management.
Currently, the United Kingdom has one of the most intensively mapped Seabeds in terms of C (Diesing et al., 2017, Diesing et al., 2020; Luisetti et al., 2019). This mapping has been focused on continental shelf sediments, without, until now, any attempt to bring data together from the fjords, estuaries and adjacent deep waters to develop the first holistic understanding of surficial C over the entire UK EEZ. Within the UK, the role of monitoring, managing and protecting the seabed falls to the devolved governments of Scotland, Wales, and Northern Ireland with the UK government responsible for the English seafloor (often referred to as Secretary of State Waters or SSW). Additionally, the Crown Dependencies of the Isle of Man and the Channel Islands manage their respective seabed. Here we use a multi-method approach utilizing new primary data alongside legacy data to calculate the surficial (top 10 cm) sedimentary OC and IC stock and map the spatial distribution of C across the entire UK EEZ. The C stock estimates are broken-down for the sediments managed by the UK’s four administrations and the UK Crown Dependencies, providing the foundations to support future decisions that monitor, manage and protect marine sedimentary C stores within the UK EEZ.
Study Area
The UK EEZ encompasses an area of 743,959 km2, in addition a further area of seabed totaling 10,057 km2 is associated with the two nearby UK Crown Dependencies of the Isle of Man and the Channel Islands (Figure 1). England (SSW), Northern Ireland, Scotland and Wales are responsible for the monitoring and management of the seabed in their adjacent waters (Table 1). The UK EEZ includes a variety of marine sedimentary environments across a range of water depths (Figure 1A). These environments range from the extensive continental shelf to the more unique environments of fjords and the smaller fjards, estuaries, shelf slopes and submarine basins each with their own characteristics which govern sedimentological and biogeochemical processes (Collins and Balson, 2007; Bianchi et al., 2018, Bianchi et al., 2020; Hodgson et al., 2018; Smeaton and Austin, 2019).
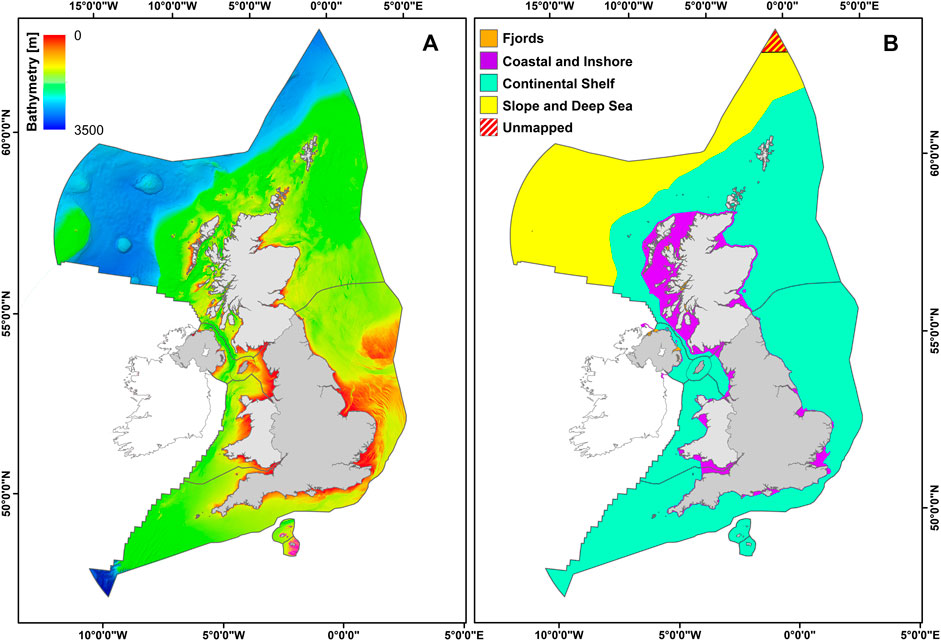
FIGURE 1. Extent of the United Kingdom’s Exclusive Economic Zone with each of the areas monitored and managed by the United Kingdom’s four administrations and Crown Dependencies differentiated by the thin black line (A) Seabed bathymetry (accessed through EMODnet-Bathymetry) (B) Colored zones differentiate marine regions used to quantify and map national OC stocks.
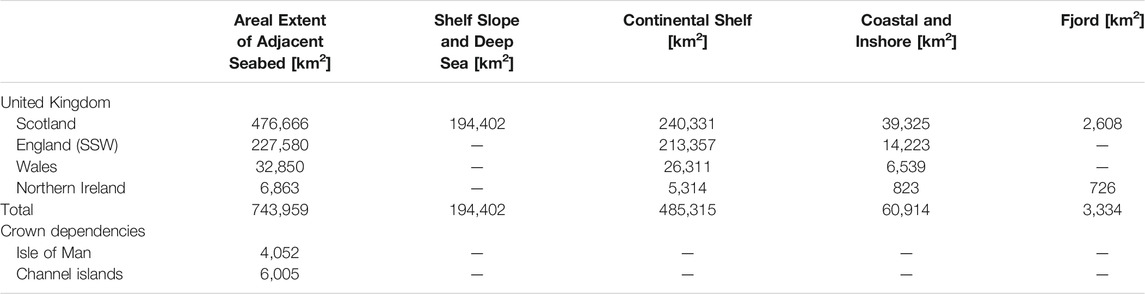
TABLE 1. Areal extent [km2] of adjacent waters managed by the four governments of the UK and the UK Crown Dependencies. Seabed extent data were accessed from the Maritime limits portal of the UKHO.
Within the UK EEZ, several surficial (top 10 cm) C stock estimates have been produced for different areas such as the Scottish and Irish Fjords (Smeaton and Austin, 2019), and the sediments held within Scottish waters (Burrows et al., 2014; Porter et al., 2020; Smeaton et al., 2020). Additionally, more expansive estimates have been made for the North West European shelf which partially encompasses the UK EEZ (Diesing et al., 2017, Diesing et al., 2020; Legge et al., 2020). The current study represents the first comprehensive assessment of the entire UK EEZ sedimentary C stock.
Many of these earlier estimates assume that the physical properties and OC content for each sediment type are uniform across the entire study area. However, it is well documented that these factors differ spatially, with coastal muds, estuaries and fjords containing significantly more OC than offshore areas (Yao et al., 2014; Bianchi et al., 2018; Smeaton and Austin, 2019). A variety of mechanism govern these spatial differences including oceanography, geomorphology and biogeochemical conditions. For example, their vicinity close to the terrestrial environment and geomorphology (Howe et al., 2010; Bianchi et al., 2020) allow fjords to capture large quantities of terrestrial OC (Cui et al., 2016; Smeaton and Austin, 2017; Faust and Knies, 2019). Low dissolved oxygen concentration (Friedrich et al., 2014; Woulds et al., 2016) enhances sedimentary OC preservation, promotes high OC burial rates (Smith et al., 2015) and generates the extensive stores of OC held within fjord sediments (e.g., Smeaton et al., 2016, Smeaton et al., 2017). By contrast, offshore sediments contain significantly less OC (Diesing et al., 2017) as these environments typically experience higher dissolved oxygen concentrations, longer sediment lateral transport times (Bao et al., 2018, Bao et al., 2019; Bröder et al., 2018) and greater levels of sediment resuspension, all of which contribute to enhanced OC degradation (Henrichs, 1992; Wakeham and Canuel, 2006; Arndt et al., 2013). Finally, while estuaries and coastal regions often have a strong connection to the adjacent terrestrial environment and receive enhanced sediment OC supply, the high dissolved oxygen concentrations, rapid transport and resuspension of sediments in these systems again act to enhance OC degradation.
In order to reflect these environmental differences across the entire UK EEZ, this study differentiates the seabed into four zones: 1) fjords, 2) coastal and inshore, 3) continental shelf and 4) shelf slope and deep sea (Figure 1B). The fjord zone covers the Scottish sea lochs (2,608 km2) and the Northern Irish sea loughs (726 km2). The coastal and inshore zone covers the sediments within a 5 km buffer of the coastline (defined as the Mean High Water Mark). Large estuaries (e.g., Bristol Channel, Firth of Forth, Solway Firth, etc.) which extend beyond the 5 km buffer are included in the coastal and inshore zone as rivers supply large quantities of OC to these sediments; this in conjunction with the geomorphology of these estuaries that potentially allows significant quantities of OC to be trapped. The region to the west of Scotland from the Firth of Clyde to the Minch has been designated as part of the coastal and inshore area, despite the fact that it extends beyond the 5 km limit. The outer range of the Scottish Coastal Current (SCC) (Simpson and Hill, 1986), the prevailing oceanographic current in the region which flows from the south west of Scotland, was used to differentiate between the coastal-inshore and the continental shelf zones. The SCC channels water through the Minch (the area between mainland Scotland and the Outer Hebrides) and likely prevents offshore transport of OC resulting in relatively “fresh” OC being deposited in the sediments of the Minch. The continental shelf is differentiated from the shelf slope and deep sea zone along the shelf slope (Figure 1B), this natural break separates the relatively shallow continental shelf from the deepest water observed in the UK EEZ.
Materials and Methods
Primary Data Collection
Sampling
Archival surficial sediment samples were acquired for this study from the British Geological Survey (BGS) sample repository (Keyworth, United Kingdom), representing two distinct phases of sampling from the UK EEZ. The most recent were grab samples collected from 2005 onwards as part of the United Kingdom Hydrographic Office (UKHO) programme of seabed surveys. A total of 379 UKHO samples were obtained from 18 surveys from across the Scottish sector of the UK EEZ, an area underrepresented in previous seabed C stock estimates (Diesing et al., 2017). These seabed samples were collected concurrently with multibeam and backscatter surveys to allow ground-truthing of the geophysics data. A further 101 samples were acquired from the BGS repository, representing samples which were collected during large scale BGS surveys which took place across the UK EEZ throughout the 1970s and early 1980s. As with the UKHO samples, these are primarily surficial sediment samples collected using a grab sampler, with a smaller number sub-sampled from the upper layers (0–2 cm) of sediment cores. These samples are also described according to the Folk classification scheme (Folk, 1954), with additional grain size and geochemical data. Of specific interest for this study is the additional reporting of calcium carbonate (CaCO3) concentration, which can be readily converted to IC content. These samples and the legacy CaCO3 measurements (Hulsemann, 1966; Lisitzin et al., 1971; Cronan and Bode, 1973; Schink et al., 1979) enabled a comparison of modern elemental analysis techniques to assess the quality of the legacy CaCO3 data as a potentially valuable resource to accurately map IC across the UK EEZ. Full details of all 480 samples obtained from the BGS sample repository are given in the Supplementary Material.
In addition, a further 95 Day grab samples were collected in July 2019 from the continental shelf within the Scottish sector of the UK EEZ onboard the MRV Scotia (Supplementary Figure S2J), and 44 samples from the Scottish fjords [supplementing the data reported by Smeaton and Austin (2019)]. Upon collection, all samples were described according to a modified Folk classification scheme (Kaskela et al., 2019).
Geochemical Analysis
The 619 surface samples were analyzed to quantify bulk sediment OC and IC content. The samples were freeze dried and homogenized to a fine powder in preparation for analysis. 30 mg of sample was weighed into a steel crucible and placed into the Elementar Soli TOC. The Soli TOC uses the temperature gradient method (DIN 19539, 2015; Natali et al., 2020) of elemental analysis to quantify OC and IC from a single untreated sample, unlike other methods where acidification steps are required (Verardo et al., 1990; Nieuwenhuize et al., 1994; Harris et al., 2001). This is achieved through ramped heating of the sample at a rate of 70°C min−1 through sequential furnace temperatures of 400°C, 600°C and 900°C. The CO2 evolved at the different temperatures represents the contribution of the various carbon fractions of the sample: 0–400°C Total Organic Carbon (TOC), 400–600°C Residual Oxidizable Carbon (ROC), more commonly referred to as elemental C, and 600–900°C Total Inorganic Carbon (TIC). The amount of CO2 produced from each of the temperature windows is measured by infrared spectrometry. For the purposes of this study, OC was calculated as the sum of TOC and ROC, while IC equals the TIC value. Combining the TOC and ROC measurements allows comparisons between Soli TOC results and secondary OC data produced through traditional methods of elemental analysis (Verardo et al., 1990; Nieuwenhuize et al., 1994) where TOC and ROC cannot be differentiated.
The standard deviation of triplicate measurements (n = 20) were TOC: 0.04% and ROC: 0.06% and TIC: 0.10%. Further quality control was assured by the repeat analysis of standard reference material B2290 (TOC/ROC/TIC silty soil standard from Elemental Microanalysis, United Kingdom) these analyses of standards deviated from the reference value by: TOC = 0.05%, ROC: 0.07% and TIC = 0.12% (n = 50).
Secondary Data Collection
Sediment Type (Point Observations)
Point observations describing the seabed for the UK EEZ were compiled from numerous sources (Supplementary Table S1). The main sources of these data were from habitat surveys which require substrate type to be recorded for each individual habitat; these data were accessed through the European Nature Information System (EUNIS). These data are largely, while not exclusively, collected by scuba divers and/or camera drops, and tend to be from the shallower, marginal areas and therefore underrepresent a significant portion of the more distant UK EEZ seabed (Supplementary Figure S1E).
To overcome this sampling bias, the point observation dataset from EUNIS was further supplemented with seabed descriptions collected from both the UKHO and BGS databases. Both the UKHO and BGS data are geographically restricted to offshore areas. The UKHO have been compiling seabed bottom quality data (i.e. descriptions) for over 100 years to help characterize potential vessel anchoring locations. This record of sediment type data is available through the UKHO but has been largely overlooked as a potentially useful quality-controlled resource for seabed mapping. The seabed descriptions from the BGS originate from surveys which took place during the 1970s and early 1980s. These datasets were further augmented with smaller regional datasets from other sources (Supplementary Figure S1A–D).
In total, 274,531 point-observations describing seabed type were compiled for the UK EEZ in this study. Supplementary Table S1 provides information on the source location of the original data that were used. Through the combination of these datasets, we overcome the shortcoming of any one dataset; the resulting compiled seabed description dataset has excellent spatial coverage across the UK EEZ (Supplementary Figure S1).
Grain Size Data
Grain size is a commonly measured sediment parameter within the UK EEZ as part of the commitment to OSPAR with the database being administered by the International Council for the Exploration of the Sea (ICES). The grain size data included in the ICES database are reported in a variety of ways from full breakdown of different size fractions to just the % by weight <63 µm (Supplementary Figure S3A). Alternatively, the BGS database reports grain size characteristics as gravel, sand and mud fractions. Wherever possible, the data were unified to report the % mud fraction (<63 µm) as this has been shown to be a predictor in modeling porosity and dry bulk density (Richardson and Briggs, 1993; Jenkins, 2005; Diesing et al., 2017).
Carbon Data
The surficial OC data has been compiled from a variety of sources (Supplementary Table S2) across the UK EEZ. The manner in which these data are reported (as with grain size data) varies significantly; the OC contents for specific size fractions are commonly reported (e.g., <63 and <20 µm). Quality control measures were therefore taken to ensure data comparability with the primary OC measurements generated in this study. Only OC data collected from bulk samples were used; OC measured from specific size fractions were rejected. Additionally, the OC data were screened to identify associated information, such as sediment descriptions. Where a data point had an associated sediment Folk class it was used to determine the relationship between OC and sediment type for the UK EEZ (Supplementary Figure S3B). The remaining OC data with no associated sediment class were grouped and used as a ground-truthing and validation dataset (Supplementary Figure S4).
Direct measurements of IC content in sediments within the UK EEZ are relatively rare. As part of the extensive survey undertaken by the BGS in the 1970s and 1980s, the CaCO3 content of all seabed sediment samples were measured (Supplementary Figure S3C). Simple stoichiometry allows the CaCO3 to be converted to IC because 12% by mass of the CaCO3 is C. The CaCO3 content was measured by a variety of methods; the majority of the analyses were carried out using the carbonate bomb method (Schink et al., 1979), with additional gasometric (Hulsemann 1966), gravimetric (Cronan and Bode, 1973) and wet combustion methods (Lisitzin et al., 1971) also utilized. The diversity of techniques used to quantify the CaCO3 content of these sediments may therefore affect the accuracy of the IC contents inferred from the BGS datasets. To test the reliability of these data as a proxy for IC content, we compared the existing reported values against our IC values directly measured by elemental analysis, for the BGS archive sediment samples that we collected. (Geochemical Analysis Section).
Bathymetric and Backscatter Data
Bathymetric data for the UK EEZ (Figure 1A) were accessed from the EMODnet-Bathymetry data repository while the backscatter data were accessed through the BGS offshore index data portal. Unlike Smeaton and Austin (2019) and Hunt et al. (2020), where backscatter data were used to map a significant part of the seabed within Scottish and Irish fjords, the currently limited spatial extent of these surveys across the UK EEZ reduces the role that backscatter can play in mapping. Instead, for the purposes of this study, classification of seabed sediments derived from selected backscatter surveys were used as an additional check and semi-quantitative test of the reliability of the sediment maps produced from the available point data. To achieve this quality control, 29 backscatter datasets where chosen from areas across the UK EEZ (Supplementary Figure S2). These were selected, where backscatter data quality was good and sample descriptions were available. Of the backscatter data available, only the recent (2005 onwards) UKHO data meet these criteria; these surveys are classed as A1, the highest standard under the Category Zone of Confidence (CATZOC) benchmark. Furthermore, to achieve this A1 classification, sediment samples must be collected alongside the backscatter data to provide ground-truthing. Descriptions of these sediments were accessed through the BGS data repository. The final screening criterion was the location of the backscatter survey data to ensure as good spatial coverage of the UK EEZ as possible (Supplementary Figure S2). The full dataset can be found in Supplementary Table S3.
Mapping the Seabed
Current mapping of the UK EEZ such as the BGS 250 k marine sediments and the EMODnet-Geology seabed substrate maps do not provide the required resolution for the purpose of mapping surficial (top 10 cm) OC stored in the sediments. Furthermore, these maps do not include the inshore and coastal areas. For example, 40,180 km2 (9.5% of the Scottish waters) of Scotland’s adjacent coastal zone remains unmapped, even when both of the above mapping products are combined (Smeaton et al., 2020). We have therefore developed a bespoke seabed sediment type map (Figure 2) based on a modified Folk classification scheme (Folk, 1954; Kaskela et al., 2019) for the UK EEZ that overcomes these issues.
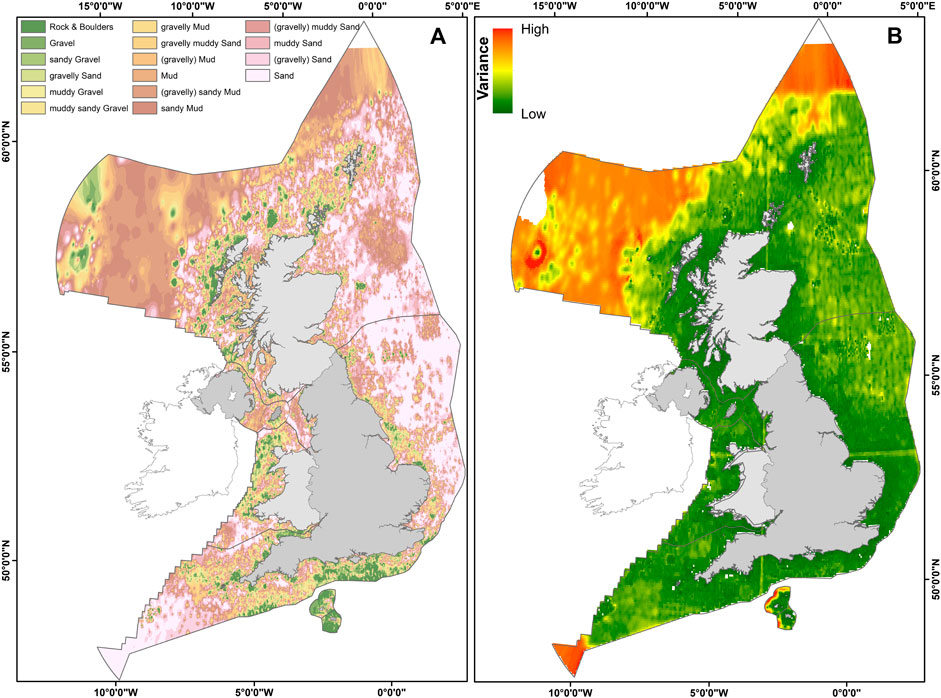
FIGURE 2. Bespoke sediment map of the UK EEZ (A) Spatial distribution of sediment across the UK EEZ illustrated by the 16 Folk classes (Kaskela et al., 2019) (B) Variance in the Kriging analysis as a measure of confidence in the predictions of these sediment classes: Low Variance: High Confidence, High Variance: Low confidence.
Harmonizing the Data
The seabed descriptions compiled from multiple datasets differ in the original classification schemes used to describe the sediment types. The UKHO and BGS follow a modified version of the classical Folk scheme (Folk, 1954; Kaskela et al., 2019); this modified scheme consists of 12 different sediment classes. Furthermore, the sediment types associated with the data accessed through EUNIS and ICES do not utilize a standardized classification scheme and descriptions differ between surveys. To harmonize all of these data sources, a modified 16-class Folk classification scheme was chosen to allow the spatial modeling to be as detailed as possible, while optimizing the available data (Supplementary Figure S5). This system of classification is also useful where there are insufficient data available to generate 16 Folk classes because the classification scheme can easily be devolved to 7 or 5 Folk classes (Kaskela et al., 2019). In conjunction with the classification scheme, a hierarchical classification tree (Supplementary Figure S6) was developed, similar to that used by Smeaton and Austin (2019), allowing the non-standard seabed descriptions to be classified. Quality control measures were undertaken during this classification process, such that if a sediment description did not meet the criteria set out in the classification scheme and tree, the data point was discarded. This was normally because the original sediment description was vague or overly complex. In total, 70,460 sediment descriptions were discarded and 203,710 descriptions were retained.
Broad-scale Seabed Mapping (Point Observations)
The creation of a bespoke sediment map for the UK EEZ is based upon the methodology outlined by Smeaton and Austin (2019). The 203,710 samples and their harmonized sediment descriptions were assigned numerical values following the modified 16-class Folk classification (Supplementary Figure S6). The mean distance between sample points is 12.4 km, driven largely by the increased spacing of sample data in the deep water region to the west of Scotland. Indicator Kriging (Journel, 1983), was chosen as it is best suited to investigate spatial correlation of a highly variable parameter and is well suited to applications involving categorical variables, e.g., sediment type (Marinoni, 2003). This technique was combined with a variable cell size structure, which allows cell size to vary from 500 m2 in the continental shelf and deep sea zones to 5 m2 in the coastal and fjord areas. By varying cell size in this way, fine scale mapping of the intricate coastal areas can be retained while maintaining computational efficiency of the mapping process over the entire UK EEZ. The areal coverage of each sediment type within the UK EEZ was calculated using the Zonal Statistic tool in ArcGIS, which was further broken down across the seabed of the four administrations and UK Crown Dependencies.
In addition to mapping the sediment type, this approach allows the variance in the predictions to be mapped and used as a measure of uncertainty (i.e., as a proxy for confidence in our predictions). Low output variance values indicate a high degree of confidence in the prediction, while high values indicate lower confidence and a need for more data points.
Backscatter
Classification of the 29 backscatter datasets was undertaken following the methodology set out by Smeaton and Austin (2019) where unsupervized classification was utilized. Unlike the sediment maps derived from the point observations which use the 16-class Folk classification, the nature of backscatter data means that it would be unrealistic to map 16 distinct classes. Instead, the devolved form of the Folk classification (5 classes) was utilized to ensure robust, reproducible results were achieved from the available backscatter surveys. Unsupervized classification techniques are used for benthic habitat mapping (Brown et al., 2011; Calvert et al., 2014). Unsupervised classification was performed using the ISO Cluster algorithm in ArcGIS (Brown and Collier, 2008; Ierodiaconou et al., 2011). This method organizes the backscatter raster into a number of distinct groups using the maximum likelihood classification (Hunt et al., 2020).
Two hundred and fifty iterations of the clustering procedure were undertaken; previous work has shown that increasing the number of iterations beyond 250 has minimal impact on the outputs obtained against the increased computational strain (Calvert et al., 2014; Smeaton and Austin, 2019). Ground-truthing of the mapped clusters was undertaken by comparing sediment descriptions from samples collected by UKHO within each survey area. For a cluster to be assigned to a particular sediment type >60% of the sediment descriptions of samples from within the cluster must be in agreement. As with the sediment maps derived from the point data, the Zonal Statistics tool was used to calculate the areal coverage of each of the five sediment classes if present.
To calculate the difference between the maps derived from the point observations and the backscatter, the maps created using the sediment descriptions must, as a first step, be devolved from 16 to 5 sediment classes; this was done by following the hierarchal modified Folk classification scheme (Supplementary Figure S5). Once both datasets are normalized to the same classification scheme, the differences are calculated by subtracting the area coverage of each sediment class derived from the backscatter data from the equivalent sediment class areas derived from the point observation. By comparing the backscatter and point data derived sediment maps it is possible to assess the errors associated with the different methods. These errors, while semi-quantitative, are key to modeling the uncertainties associated with the UK EEZ sediment OC stock.
Surficial Carbon Stock Estimation
Two approaches were adopted to estimate the surficial (top 10 cm) sedimentary C stock across the UK EEZ. The first approach (Smeaton and Austin, 2019) used the new bespoke sediment map and areal coverage estimations for each of the 16 sediment classes. These area estimates were then combined with dry bulk density and C content data to determine the surficial OC stock. To improve the calculation and reporting of uncertainties, the OC stocks were calculated in a Markov chain Monte Carlo (MCMC) framework using the OpenBUGS software package (Lunn et al., 2009). MCMC analysis was applied by taking 1,000,000 out of 100,000,000 random samples from a normal distribution of each variable (porosity, grain density, organic carbon, etc.) to populate equations (1–6). This process generates a significant quantity of solutions which follow a normal distribution. The application of standard descriptive statistical techniques to the pool of generated solutions allows the mean, median, range (minimum and maximum) and standard deviation to be calculated. The second approach employs spatial modeling techniques, to extrapolate between points with known physical and geochemical properties (e.g., Fmud, OC). This approach is undertaken within ArcGIS using the raster calculator tool in combination with Gaussian geostatistical simulations to better determine uncertainties in the calculations.
Porosity and Dry Bulk Density
Globally, there is a general scarcity of readily available physical property data from differing marine sediment types. This is especially true for dry bulk density measurements within the UK EEZ where there are only sporadic data points, mostly from muddy sediments. To compensate for this lack of data, we employ a simple modeling approach outlined by Diesing et al. (2017) to determine the porosity (Φ) and dry bulk density (kg m−3) of the 16 sediment classes. Using the grain size data, specifically the mud fraction (Fmud) in conjunction with an equation from Jenkins (2005).
Both Φ and Fmud are reported as dimensionless fractions. The original equation is based on data analyzed from the Mississippi-Alabama-Florida shelf and the application of this equation to the UK EEZ assumes that the relationship between porosity and Fmud is universal. Diesing et al. (2017) tested this equation with known porosity values from the Celtic Sea (Silburn et al., 2017) with favorable results. To calculate the dry bulk density of each sediment class, the porosity data derived from Eq. 1 was used with Eq. 2 (Diesing et al., 2017).
Unlike Diesing et al. (2017), who used a single grain density value of 2,650 kg m−3, this study compiled a range of grain densities across different sediment types (Opreanu, 2003; Diesing et al., 2017) with a mean value of 2,600 ± 120 kg m−3. These equations were applied to the collated data within the MCMC framework, to ensure accurate calculations of the associated uncertainties. The resulting data were compared to known dry bulk density values from Scottish fjords (Smeaton and Austin, 2019) to assess the quality of the modeling results. This approach to model dry bulk density values was chosen over the pedotransfer function used it the recent global estimation of sedimentary OC stocks (Atwood et al., 2020). The Atwood et al. (2020) pedotransfer function was deemed unsuitable for the UK EEZ because it contains data from inter-tidal blue carbon habitats which skew the conversions and is calibrated with sediment samples containing up to 60% OC; values < 2% OC are typical of most marine continental shelf sediments.
Carbon Data
The relationship between sediment type/grain size and OC content is relatively well understood in coastal and shelf sea settings, in which the finer, muddy sediments hold greater quantities of OC than the coarser sandier sediments (McBreen et al., 2008; Serpetti et al., 2012; Diesing et al., 2017). However, the OC content of these sediments can differ within individual sediment classes and across inshore to shelf environments (Smeaton and Austin, 2019); the latter driven by lateral transport and degradation of the OC (Bao et al., 2018, 2019; Bröder et al., 2018). To overcome the potential biasing of OC values for each sediment class, with weighting towards either higher inshore or lower offshore OC contents (Diesing et al., 2017; Legge et al., 2020; Smeaton et al., 2020), we sub-divided the compiled OC data with associated sediment description into the three EEZ zones (Figure 1B). Statistical analyses of the three groups of OC data (Supplementary Figure 3B) were undertaken to determine the mean, standard deviation and the 5th and 95th percentile values for each of the 16 sediment classes across the 1) Continental shelf, 2) coastal and inshore, and 3) fjord zones. OC data for the shelf slope and deep-sea zone is sparse, therefore the OC values specific to each sediment type from the continental shelf were used as proxies for deep sea OC values.
There is significantly less known about the spatial relationships between IC and sediment type across our shelf seas. The IC data derived from the BGS CaCO3 values were classified by sediment type to test for a relationship and predictive power in order to map the surficial sedimentary IC stock across the EEZ.
Sediment Class Derived Organic Carbon Stock
The areal extent of the 16 sediment classes were broken down into the four defined zones of the UK EEZ (Table 1; Figure 1B). The errors calculated from the differences between sediment maps derived from the point and backscatter data were used to generate uncertainty values (i.e. standard deviations) for the areal coverage of each sediment class. These area estimates, in conjunction with the dry bulk density and C data for each sediment class within each of the three UK EEZ zones, were used with Eqs. 3–6 within a MCMC framework to calculate both the C stock and density for each of the 16 sediment classes across the four UK EEZ zones (Figure 1B). For each sediment class 100,000,000 random simulations were undertaken for each calculation step in sequential order.
The total C stocks for each defined zone, administrations’ waters and UK EEZ as a whole were calculated by summing the individual C stocks for each of the 16 sediment classes.
Surficial Carbon Mapping
For each of the 34,617 (BGS: 32,680, Other: 1,937) point observations with Fmud data, a dry bulk density and OC value with associated ranges (standard deviation) were assigned from one of the four specific UK EEZ zones. Each of the BGS points have an associated IC value calculated from the reported CaCO3 content. The Fmud, OC and IC contents are reported as proportions; consequentially there is a requirement for the data to be transformed before modeling. The data were transformed using the methodology of Diesing et al. (2017), where the data underwent arcsine transformation (Sokal and Rohlf, 1981):
where X is the measured variable as a fraction (between 0 and 1) and Y is the transformed variable. Back-transformation of the modeled values was undertaken via:
Simple Kriging, (Cressie, 1990) was chosen to model the different variables across the EEZ as this approach is suited for continuous data, and Gaussian geostatistical simulations can be integrated into the mapping (Li and Heap, 2014). Gaussian geostatistical simulations are a similar process to MCMC simulations but undertaken within ArcGIS and with the added spatial component. Following the outlined approach, the Fmud, OC and IC content were spatially modeled. Equations (1-6) were sequentially applied to the raster outputs from the modeling. The calculations undertaken using the Raster Calculator Tool were simulated 1,000 times for each calculation stage to ensure accurate C stock and uncertainty estimation. The summation of the values of all grid cells yielded the total OC and IC for the UK EEZ.
Spatial Model Validation
To validate the spatial model, OC values were extracted from the percentage OC raster and compared to the ground-truthing datasets (Carbon Data Section) with the coefficient of determination (R2) being utilized to test the performance of the model. In addition, cross-validation of the results were undertaken in the BLOCKCV package (Valavi et al., 2019) to negate underestimations of errors due to the possibility of spatial autocorrelation between the model outputs and the validation dataset. The BLOCKCV package uses block cross-validation, where data are split strategically rather than randomly, addressing the issue of auto-correlation (Roberts et al., 2017). Within BLOCKCV the mapped OC across the UK EZZ was split into 370 equally sized blocks (2,000 km2) based upon the ICES statistical grid, blocks without ground-truthing data were discarded (n = 84). For each ground-truthing sample, a spatial block was affiliated by spatial location. Random cross-validation models (Kuhn and Johnson, 2013) were run using data from all but one spatial block, with the model performance being estimated from the missing data. To gauge performance of the cross validation, Root-Mean-Square Error (RMSE) and the R2 were used alongside the Kappa Index (Cohen, 1960). A Kappa value of 0 denotes a random classification while a value of 1 represents a perfect classification.
Results and Interpretation
United Kingdom’s Exclusive Economic Zone Seabed Sediments
The seabed sediments of the UK EEZ were successfully mapped (Figure 2) using the approach described above, allowing the areal coverage of each of the 16 sediment classes to be calculated. An area of 725,223 km2 of the UK seabed was mapped with only the most northerly tip of the EEZ (18,726 km2) remaining unmapped due to limited data availability. (Figure 2). To test the quality and performance of the spatial mapping, we compared the 29 select areas of the sediment map derived from the point observations (Figure 2A) to interpolated backscatter surveys (Supplementary Figure S2). Over the 29 selected areas, we observed that the area coverage of rock and boulders, coarse sediment and mixed sediment classes are more commonly underestimated, while the mud to muddy sand and sand classes are more often overestimated by the point observation approach compared to the backscatter-based mapping (Supplementary Table S3). The normalized mean errors for the sediment classes were calculated as Coarse Sediment (5.57%), Mud and muddy Sand (5.23%), Sand (5.17%), Mixed Sediment (4.99%), Rock and Boulders (3.48%); these errors are broadly comparable to those observed from similar analyses undertaken in the Scottish fjords that estimated errors between 0.52% and 5.07% (Smeaton and Austin, 2019). The normalized mean errors calculated through these comparisons were applied to the areal coverage (km2) of the different sediment types in the MCMC analysis, allowing the surficial OC stocks and their uncertainties to be estimated.
The mapped variance in the Kriging predictions (a proxy for confidence in our predictions) clearly shows that high density of point observations results in low variance and high confidence in the Kriging prediction (Figure 2B). The areas with the highest variance are to the extreme north and west of Scotland and the south west tip of the UK EEZ, which have far fewer point observations and hence generate the lower confidence of the Kriging predictions.
A National Overview (Sediment Coverage)
The results of the mapping reveal distinct differences in the national and regional sedimentary composition of the UK EEZ (Figure 3). Sand is the dominant sediment type within the UK EEZ with the largest quantity found in the English sector of the North Sea. In total, the sediments within English adjacent waters contain 58% of the sand in the UK EEZ (Figure 2). Following sand, muddy sediments constitute a large proportion of the UK EEZ seabed, with ∼75% of all the muddy sediments being located within Scottish waters. By expanding the sources of data used in this study beyond the BGS and EMODnet sediment maps, we can better understand the role of estuaries and coastal mud belts as potential hotspots for OC, improving on previous mapping exercises (Diesing et al., 2017; Legge et al., 2020; Smeaton et al., 2020). The fjords of Scotland and Ireland are, for example, dominated by muddy sediments with 40–51% of their seabed classed as muddy sediments, similar to the findings of Smeaton and Austin (2019). In general, coarser sediments tend to accumulate in the English Channel and around the Scottish Islands (Shetland, Orkney and the Outer Hebrides). These regions have both surface and sub-surface oceanographic conditions (Turrell et al., 1996) which facilitate the preferential resuspension of fine and the net accumulation of coarser sediments.
FIGURE 3. (A) Areal coverage [km2] of the 16 different sediment classes across the UK EEZ (B–G). Sediment areal coverage [km2] broken down across the four administrations and the UK Crown Dependencies.
While the seabed of England is dominated by sandy sediment, sediment in Scottish and Northern Irish waters have a significant muddy component, Wales and the Crown dependencies, with smaller seabed areas, exhibit highly variable sediment coverage, most likely a consequence of local geomorphological and oceanographic conditions. The seabed of Wales and the Isle of Man (Figures 3C,G) have the greatest heterogeneity with no one sediment class dominating. In contrast, the seabed around the Channel Islands is largely rock and gravel. Despite the lack of ground-truthing data for this region, we predict that it is unlikely to contain significant OC stores. The sediments of Northern Ireland’s waters resemble those of Scotland with the muddy sediments covering the largest area. The coastal seas of western Scotland and Northern Ireland have an interlinked glacial history (Ehlers et al., 1991; Peters et al., 2015; O’Cofaigh et al., 2019), resulting in comparable coastal geomorphology (i.e. fjords and fjards) and therefore similarities in sediment composition. Further, fjords represent ∼13% of the Northern Irish seabed; these mud- and OC-rich systems are an important factor in total composition of the Northern Irish seabed. The full breakdown of sediment areal coverage can be found in Supplementary Table S5 and within the Supplementary Material.
Estimating Sedimentary OC Stocks
Porosity and Dry Bulk Density
The porosity and dry bulk density values produced from the modeling of Fmud show the expected trends across sediment class, with the coarser sediments exhibiting the lowest porosity and highest dry bulk density values and vice versa for the muddy sediments (Figure 4). The dry bulk density values of the muddy and sandy sediments fall within the range of those expected from the global dry bulk density data compiled by Flemming and Delafontaine, (2000). Additionally, the dry bulk density values compare well to those measured in equivalent sediments from the Scottish fjords (Smeaton and Austin, 2019) and those used by Diesing et al. (2017) in modeling the OC stock of North West European Shelf sediments. The statistical breakdown of the sediment porosity and dry bulk density data can be found in Supplementary Table S6, while the raw data are reported in the Supplementary Material.
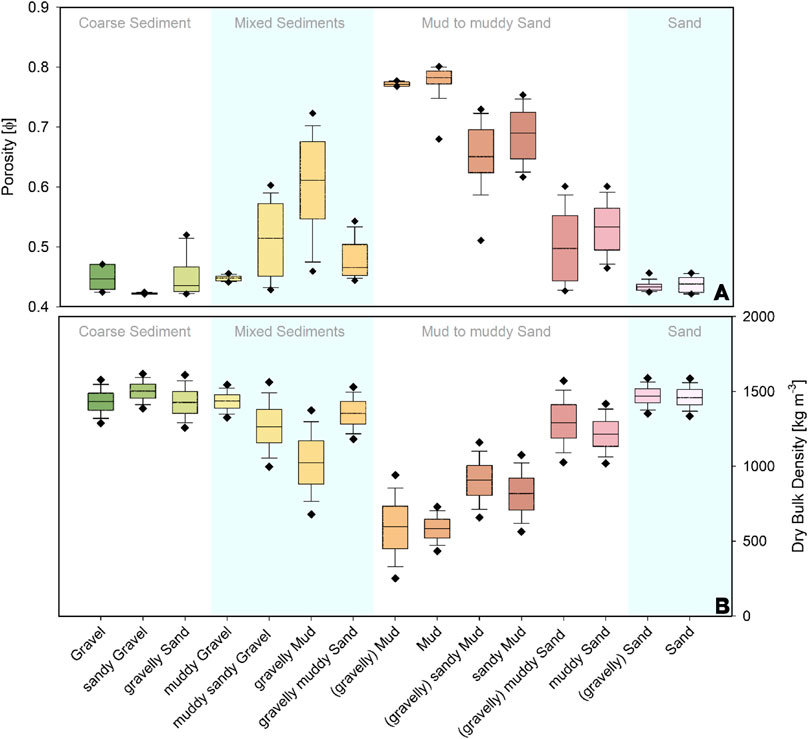
FIGURE 4. Modeled physical property data for sediment types across the UK EEZ (A) Porosity [Φ] (B) Dry bulk density [kg m−3].
Organic Carbon
The relationship between sediment type and OC content across the four zones within the UK EEZ highlight differences in surficial OC stocks (Figure 5). The fjord sediments, for example, are significantly richer in OC than those found in the coastal and offshore areas. Fjords are well known and globally recognized as hotspots for the burial and storage of OC (Smith et al., 2015; Cui et al., 2016; Smeaton et al., 2016, Smeaton et al., 2017; Bianchi et al., 2020). The high OC content of fjord sediments results from being in the immediate vicinity of land, the additional supply of terrestrial OC (Cui et al., 2016; Smeaton and Austin, 2017; Faust and Knies, 2019), the restrictive nature of their submarine geomorphology (Howe et al., 2010; Bianchi et al., 2020) and low oxygen conditions (Woulds et al., 2016; Bianchi et al., 2020), all of which fosters increased deposition and OC preservation. Within the fjords, the finer muddy sediments hold the greatest quantity of OC, the latter decreasing significantly as mean grain size increases (McBreen et al., 2008; Diesing et al., 2017; Smeaton and Austin, 2019; Hunt et al., 2020).
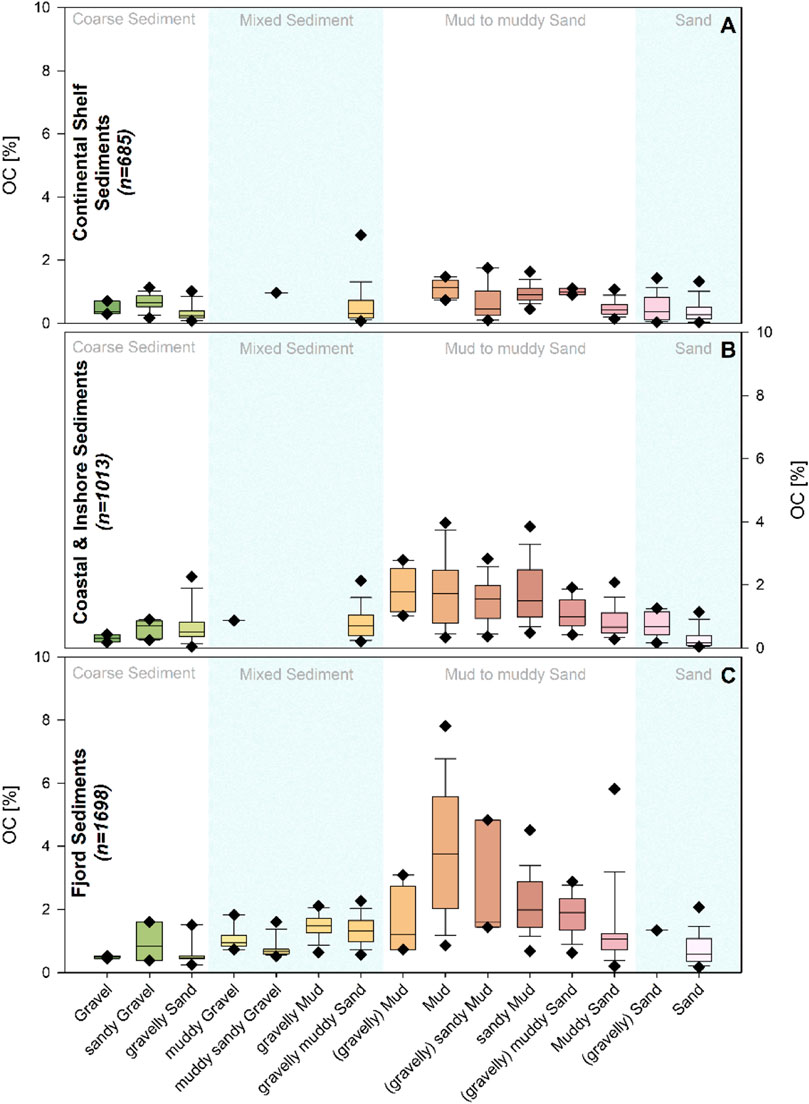
FIGURE 5. OC content [%] across the 16 sediment classes for the different zones of the UK EEZ (A) Continental shelf sediments (n = 685) (B) Coastal and Inshore sediments (n = 1,013) (C) Fjord Sediments (n =1,698).
While less pronounced than in fjord environments, the muddy sediments of coastal and inshore waters also hold higher amounts of OC (Figure 5). These coastal and inshore zones encompasses estuaries and coastal mud belts which, as with fjords, receive significant quantities of additional OC from terrestrial sources. However, unlike the restricted nature of fjords, these areas tend to be well oxygenated and characterized by sediment mobility, factors which increase the rates of OC degradation and lead to the reduced quantities of OC held within the individual sediment types (Aller and Blair 2006; Li et al., 2014; Yao et al., 2014).
The continental shelf sediments differ from sediments in the other two zones in that the OC contents show little variation, with mean OC values ranging between 0.32% for the gravelly sand and 1.10% for mud. These values are comparable to those observed by Diesing et al. (2017) and Smeaton et al. (2020). The similarity of the OC values across sediment classes may partly be driven by the lateral transport of OC across the continental shelf, which enhances oxidation and significantly increases OC degradation in all these sediment types (Bao et al., 2018; Bao et al., 2019; Bröder et al., 2018). Sediment transport across continental shelf seas, which involves a continuum of advection, deposition and resuspension, can take tens to hundreds of years (Bao et al., 2018; Mollenhauer et al., 2017) and these long time spans allow the OC held in surficial sediments to degrade to a similar point across all sediment classes (Figure 5A) where the remaining OC is largely dominated by more recalcitrant and refractory material. The shelf slope and deep sea zone of the UK EEZ (Figure 1B) lacks available OC data. Therefore, to facilitate the mapping and estimation of surficial OC across this large area (194,403 km2), the continental shelf OC values were applied as surrogates for the equivalent sediment types. Continental shelf slopes are known to be sites of high seasonal primary productivity (Rice et al., 1986; Hartman et al., 2010) where significant quantities of fresh OC are delivered to the sediments, potentially yielding OC contents similar to those in continental shelf sediments. Statistical summaries of the OC data for each zone can be found in Supplementary Tables S7 and S8 and the raw data are cataloged in the Supplementary Material.
While it is well recognized that fjords are hotspots for OC burial and storage (Smith et al., 2015; Smeaton et al., 2017), the cross-shelf differences between coastal and offshore sediments have been largely overlooked in previous reporting of continental shelf OC stocks (Diesing et al., 2017; Smeaton et al., 2020). These studies have either not included coastal and inshore areas (Diesing et al., 2017) or applied OC values typical of the continental shelf across all the sediments within their study area (Armstrong et al., 2020; Porter et al., 2020; Smeaton et al., 2020). Therefore these studies are likely to have significantly underestimated surficial sedimentary OC stocks, particularly in muddy sediments in coastal and inshore areas and potentially overestimated the OC stocks of the sediments within the shelf slope and deep sea zone. The integration of the area specific sediment OC data (Figure 5) in tandem with the MCMC modeling of this study should therefore yield improved whole EEZ sedimentary OC stock estimates.
Inorganic Carbon
Examination of the BGS carbonate data suggest, unlike the sediment OC data, that the CaCO3/IC content of the surficial sediment is not related to the sediment type (Supplementary Figure S7). This is most apparent around the Orkney and Shetland Islands which are hotspots for CaCO3 accumulation (Supplementary Figure S3C), where strong bottom currents (Wilson, 1979) may be very effective at sorting sediments and winnowing fine grained material. While these northern shelf sediments are coarse in nature and similar to those found in the south of the UK EEZ, they differ significantly in CaCO3/IC content. The relationship between IC and sediment type is poorly defined across the UK EEZ and this therefore excludes the use of mapped sediment data to approximate a surficial IC stock (Sediment Class Derived OC Stock Section).
The quality of the BGS CaCO3 data were tested against new analyses of the BGS archive samples (Geochemical Analysis Section); this provided quality control of the legacy CaCO3 analytical methods (Hulsemann 1966; Lisitzin et al., 1971; Cronan and Bode, 1973; Schink et al., 1979). A strong relationship (R2 = 0.91) exists between the two datasets, indicating that the BGS legacy CaCO3 data are robust and comparable to modern measurement techniques and are therefore suitable for the IC spatial mapping efforts (Figure 6).
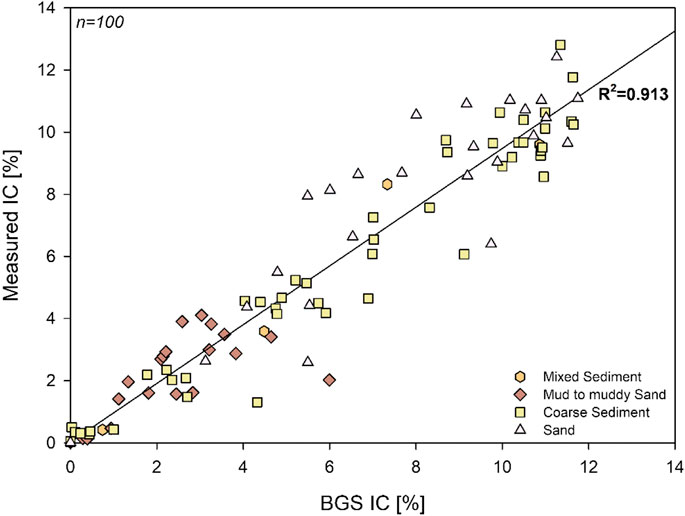
FIGURE 6. Comparison of IC content [%] of archived samples measured through elemental analysis at the University of St Andrews and legacy BGS data produced through various calorimetric methodologies to determine CaCO3 content. The datasets have a coefficient of determination (R2) of 0.913, where y = 0.9455x + 0.0235.
Sediment Classification Derived Organic Carbon Stock
It is estimated that OC stocks for the surficial sediments (top 10 cm) of the UK EEZ hold a total of 622.7 ± 71.1 Mt OC, with the Isle of Man and the Channel Islands holding a further 3.5 ± 0.4 and 2.6 ± 0.4 Mt OC, respectively. Across the UK EEZ, widespread sand deposits store the greatest quantity of OC overall, followed by sandy muds (Figure 7). While sand generally has a lower OC content than other sediment types (Figure 5), its extensive coverage across the UK EEZ (Figure 3) and its relatively high dry bulk density (Figure 4) results in the greatest amounts of OC being held with this sediment type. This confirms earlier observations from the North West European shelf by Diesing et al. (2017). The UK EEZ sedimentary OC stock can be broken down into OC inventories for the four administrations and Crown Dependencies (Table 2). Both Scotland and England store vastly more OC than the other regions or Crown Dependencies, largely because of the seabed area (Table 1). The surficial sediments of Scotland (457,926 km2) store 382.6 ± 34.2 Mt OC, while those within English waters (227,583 km2) store 184.4 ± 33.5 Mt OC. These OC stock differences are driven by shelf area, and further amplified by the presence of abundant OC-rich, muddy sediments in Scottish waters. The OC held within Scotland’s sediment represent ∼64% of the total held within the UK EEZ. The full statistical breakdown of OC densities across sediment type and geographic region can be found in the Supplementary Material.
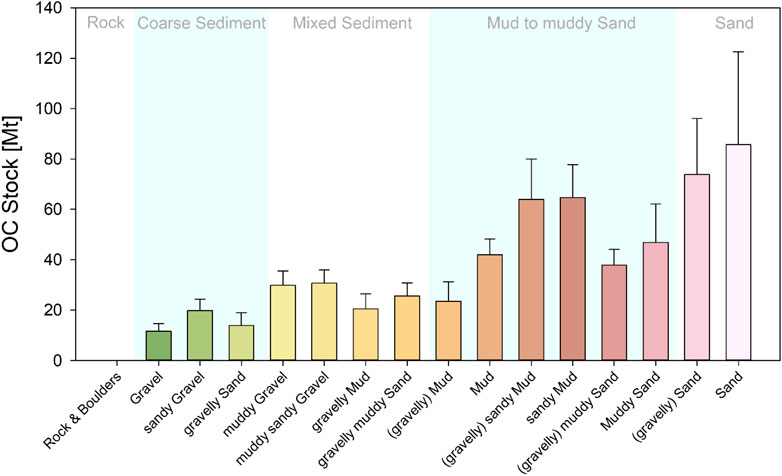
FIGURE 7. OC stocks [Mt] of the 16 different sediments types across the UK EEZ calculated through the sediment classification methodology (Sediment Class Derived OC Stock Section).
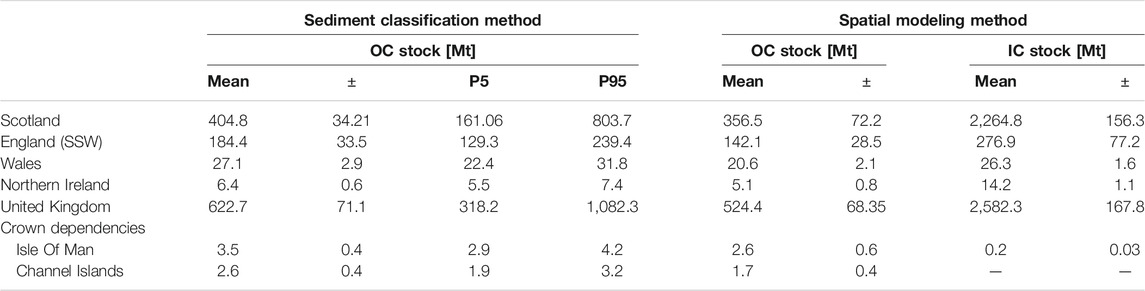
TABLE 2. Surficial sediment C stocks estimated using the sediment classification and spatial modeling methodologies. Data present as mean, standard deviation (1σ) and 5th and 95th percentiles.
The surficial sedimentary OC stocks (Figure 7) highlight that sand and sandy muds hold the greatest amounts of OC, but when normalized for area it is clear that muddy sediments are extremely important OC stores (Figure 8). The highest OC densites (i.e. the quantity of OC held per m2) are found in the muddy sediments within fjords. The mud held within fjords has estimated OC densities of 2.44 ± 1.26 kg m−2, with the highest OC densities in (gravelly) sandy muds, with OC densities of 2.67 ± 1.39 kg m−2. Overall, fjord sediments exhibited a mean OC density of 1.55 ± 0.65 kg m−2 with a range of means of 0.57–2.70 kg m−2. While slightly lower than the OC densities previously reported (1.84–2.03 kg m−2) from Scottish and Irish fjords, the values do fall within the 5th and 95th percentile range calculated by Smeaton and Austin (2019) in this study. Smeaton and Austin (2019) used a simplified 5 class Folk scheme, which resulted in the muddy sediments being amalgamated into a single class, with a resultant higher mean dry bulk density and OC content than that used across the six muddy sediment classes in this study.
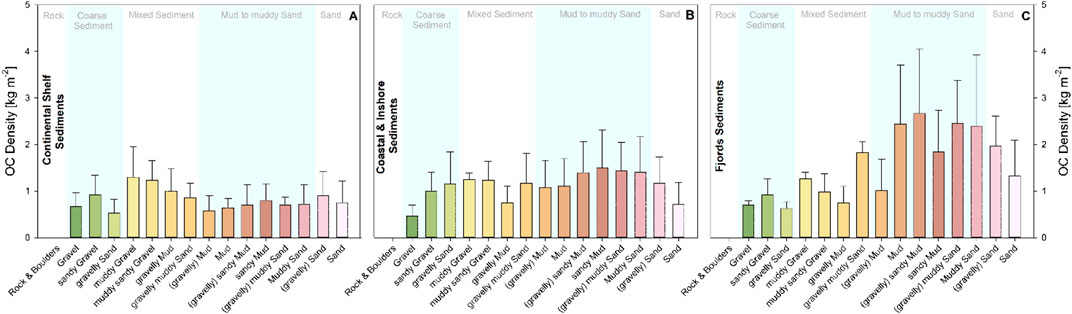
FIGURE 8. Mean OC density [kg m−2] of the 16 sediment classes across the three UK EEZ zones (A) Continental shelf (and shelf slope and deep sea zone) (B) Coastal and inshore (C) Fjords.
Within the coastal zone, the muddy sediments retain the highest OC densities (1.11 ± 0.59 kg m−2) compared to other sediment types. These OC densities decline further in the offshore sediments, where the mixed sediment classes dominate and support the highest overall OC densities of these zones. Detailed reporting of OC densities across sediment type and geographic regions are included in the Supplementary Material.
Spatial Modeling of Surficial Carbon
The spatial modeling approach of this study estimates that the sediments of the UK EEZ hold 524.4 ± 68.35 Mt OC and 2,264.8 ± 156.3 Mt IC, with a further 4.4 ± 0.5 Mt of OC held within the sediments of the Crown Dependencies (Table 2). Unlike the Isle of Man, where it was possible to estimate that the sediments contain 0.2 ± 0.03 Mt IC, no IC stock could be calculated for the Channel Islands because the BGS carbonate data do not extend beyond the UK EEZ (Supplementary Figure S3C).
This approach to estimating the sedimentary C stocks also allowed the IC and OC to be mapped across the UK EEZ. While the mapping highlights that the distribution of seabed sediments is highly heterogeneous the OC density remains relatively uniform across the EZZ. The exception to this is distinct OC hotpots in the estuaries, fjords and the coastal and inshore regions to the west of Scotland (Figure 9A). These results highlight that the use of universal OC data for the entire shelf may lead to an underestimation of the importance of coastal and inshore muds within EEZ-wide C budgets (e.g., Legge et al., 2020). Equally, while the lowest OC densities are found to the west of the Outer Hebrides, the seabed here is largely rock and barren of sediments so these extremely low OC densities are not unexpected. Regional hotspots for IC were identified, often associated with very low OC sediment content around the major Scottish island groups (Orkney, Shetland and the outer Hebrides) and north of Devon and Cornwall in the south-west of England (Figure 9B). The full breakdown of the results can be found in Supplementary Figure S8.
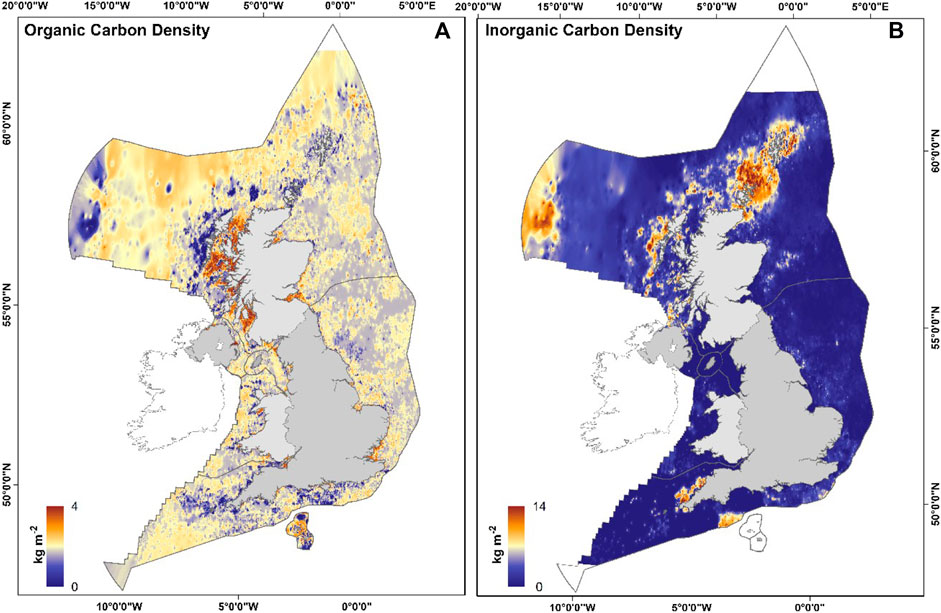
FIGURE 9. Spatial modeling of the UK EEZ sediments (A) OC density [kg m−2] (B) IC density [kg m−2]. These data layers alongside the porosity, dry bulk density, OC content and IC content data layers are available at https://doi.org/10.7489/12354-1.
The OC values (%) were extracted from the raster produced from the spatial model and compared to the ground-truthing data (n = 4,676) collected from the secondary sources (Supplementary Figure S4). The comparison of the two datasets shows a correlation (R2 = 0.64) between the modeled and measured OC (Supplementary Figure S9). The block cross-validation approach produced a Kappa index value of 0.58; random cross-validation indicated that the OC could be predicted with a RMSE of 1.72 and a R2 of 0.53 (Supplementary Table S9). Together, these data indicate that the spatial model is a statistically robust representation of the sediment OC content (with quantitative uncertainty estimates) across the fjord, coastal and inshore and continental shelf zones of the UK EEZ (Figure 1). The sparsity of data within the slope and deep sea zone means that the results of the spatial modeling have not been ground-truthed and caution should therefore be applied when utilizing the OC stock estimates from this region of the UK EEZ.
United Kingdom’s Exclusive Economic Zone Sedimentary C Stock
The sediment classification and spatial mapping approaches to calculating the C stock of the surficial sediments of the UK EEZ return estimates that are within the error of each other (Table 2). The nature of the uncertainties, twinned with the similarity in results from both methods, provides a level of reassurance that the estimates of C stocks and associated uncertainties are robust.
While these two approaches to calculating the surficial sediment OC stocks result in similar estimates, each method carries unique advantages and disadvantages. The first approach using the sediment type to estimate OC stock provides statistically robust uncertainty estimates within a MCMC framework. In addition, this approach can be applied to existing sediment maps and does not require the same quantity of ground-truth data to make first-order estimates of the surficial OC stock of the seabed. The drawbacks to this method are that it does not allow accurate spatial mapping, and hotspots for C burial and storage cannot be readily identified. The second, spatial modeling, approach is far more data and potentially computationally intensive. In certain situations, there may be insufficient data to support this approach. For the UK EEZ, this second approach has allowed the detailed spatial mapping of OC and the identification of OC hotspots. Additionally, this approach has also allowed the IC stock and density to be calculated, which was not possible using the sediment classification approach. It should be noted that there are few global locations with this wealth of CaCO3 data that would currently allow this approach to be adopted. As the spatial modeling approach produces both OC and IC surficial sediment stocks and is more conservative in its estimations, these data are deemed the primary outputs that should be used from this study.
There are hotspots for both OC and IC storage across the surficial sediments of the UK EEZ (Table 3; Figures 9A,B). While fjords are now recognized (Cui et al., 2016; Smeaton et al., 2017; Smeaton and Austin 2019; Smith et al., 2015), other coastal regions are less well understood as OC and IC hotspots. This study highlights the importance of estuaries and restricted areas of the shelf, such as the Minch, as OC-rich areas of the UK EEZ (Figure 9A). These coastal and near-coastal environments are dominated by muds (Figure 2), often supplied with OC by their proximity to the terrestrial environment and local oceanographic conditions (Simpson and Hill, 1986). The surficial muds in these shelf areas hold large quantities of OC, yet unlike fjords this may not translate into significant long-term OC stores at these locations. Coastal muds are subject to different physical and biogeochemical conditions, often being mobile and well oxygenated, factors which facilitate the degradation of the OC (Arndt et al., 2013; Middelburg, 2019). Enhanced OC degradation has been widely observed within estuaries and coastal mud deposits, which are often described as “factories for OC burn off” due to the rate at which fresh OC is remineralized (Aller and Blair 2006; Li et al., 2014; Yao et al., 2014; Zhao et al., 2018). The enhanced degradation of buried OC in these environments may also explain the abundance of gas release features (pockmarks) on the seabed in areas such as the Minch (Audsley et al., 2019). The BGS Quaternary sediment thickness map of the UK EEZ indicates that sediments over much of the UK EEZ extend beyond 50 m in depth. Yet, to extrapolate the surficial OC stocks to these depths, without taking OC burial and degradation into account, as well as changing Quaternary oceanography, including long-term sea-level drivers (Evans et al., 2002; Marretj et al., 2004; Uehara et al., 2006; Ward et al., 2016) would likely result in significant overestimation of the full depth-integrated sedimentary OC stock within these deposits.
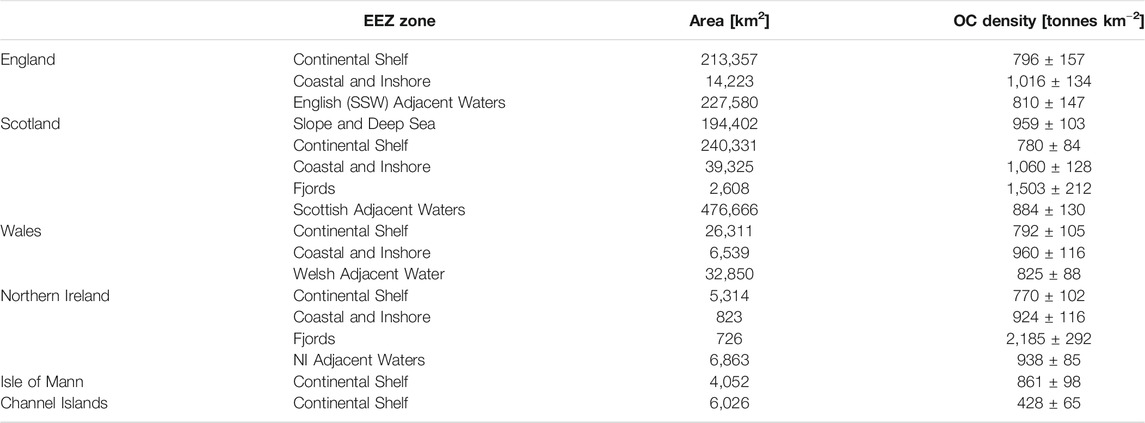
TABLE 3. OC stock (Mt) and density (tonnes km−2) for the seabed monitored and managed by the different administrations, highlighting the hotspots for OC.
As noted previously, hotspots for IC are found around the Orkney and Shetland Islands and the southern part of the Outer Hebrides (Figure 9). In these regions, a significant contribution to the high sediment IC concentrations comes from broken, poorly sorted shells (Akpan and Farrow, 1985; Wilson, 1979). The relatively shallow, productive waters around these areas (Figure 1A) in conjunction with the coarse grained and hard nature of the seabed (Figure 2), provides an ecosystem conducive for marine bivalves, such as horse mussels to thrive (Porter et al., 2020). The density of this shell material and prevailing local currents (Turrell et al., 1996) largely prevent offshore transport of this material which, over time, enables the accumulation of large quantities of shell material/IC in these areas. As with the biogeochemical cycling that drives net OC accumulation in marine sediments, there are important caveats to be made when considering the importance of these C stocks within the larger C cycle and related climate system. Of particular note is the release of CO2 to the ocean/atmosphere system on short timescales due to the consumption of alkalinity during the production of CaCO3/IC (Frankignoulle et al., 1994; Frankignoulle et al., 1995).
Comparison to North Atlantic Sedimentary C Stock Estimates
When compared to other shelf C stock estimates, both within and outside the UK EEZ, our estimates of both OC and IC compare favorably with published literature (Table 4). Avelar et al. (2017), for example, estimated that the UK EEZ holds 811 Mt OC. Their method to calculate the OC stock was relatively simple and was based upon only 102 OC and 137 bulk density values from across the entire UK EEZ. The limited nature of their constraining data likely results in their figures being an overestimation, leading to the disparities between their estimates and OC stock estimates in other studies (Table 4). Estimated OC stocks for the North West European shelf, which partly includes the UK EEZ, are lower than this study, despite the significantly larger area studied (1,111,812 km2; Diesing et al., 2017; Legge et al., 2020). The disparity in these estimates are likely to be due to 1) the inclusion of OC-rich inshore sediments (e.g., fjords) and 2) the differing extent of sediment types, which support different OC densities in each of the study areas. While not well constrained, this study estimates the sediments to the far west of Scotland (slope and deep-sea zone) contain 186.4 ± 20.1 Mt OC; the work of Diesing et al. (2017) did not include this area but did include an extended North Sea sector, dominated by coarse, OC-poor sediments.
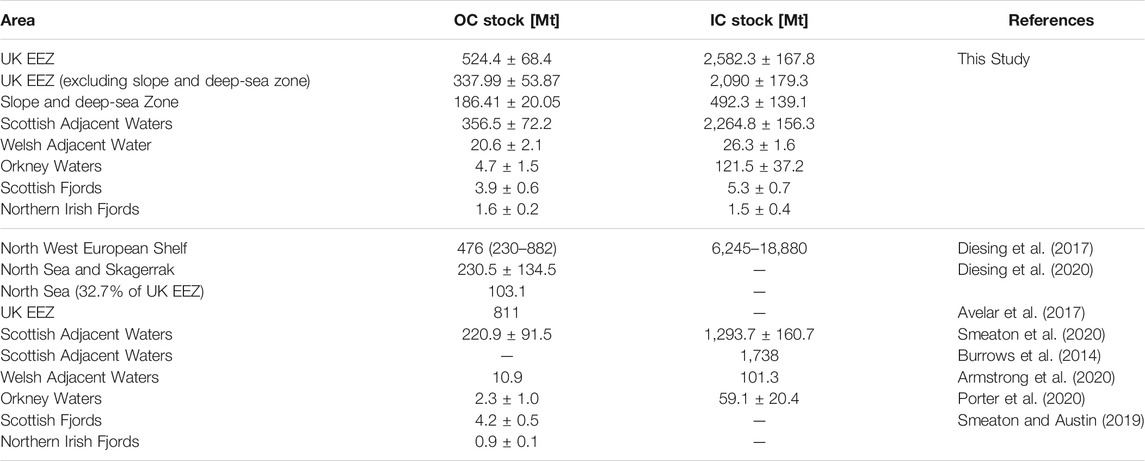
TABLE 4. Comparisons of the estimated surficial sediment OC and IC stocks (Mt) from this study in comparison to published data from NW Europe.
Larger differences are reported in the IC stocks. This study estimates 2,582.3 ± 167.8 Mt IC within the surficial sediments of the UK EEZ, while Legge et al. (2020) estimate a significantly larger IC stock of 6,245 to 18,880 Mt (Table 4). The North West European shelf area is 34% larger than the UK EEZ and contains large areas of coarse and sandy sediment, often containing significant quantities of IC (Boudreau et al., 2001; Hall, 2002; Rao et al., 2008). These differences may explain the disparity in the IC stock estimates and potentially make the results from this study broadly comparable to the minimum value reported by Legge et al. (2020). Considering that our study includes IC hotspots found on the North West European shelf around Orkney and the south-west coast of England, we question the upper limit of the IC stock estimates (18,880 Mt IC) as calculated by Legge et al. (2020), and consider them significantly over-inflated.
At the national and regional scales, comparisons can also be made with other studies. OC and IC sedimentary stock estimates for the Scottish EEZ (Burrows et al., 2014; Smeaton et al., 2020) and the sediments surrounding the Orkney Islands (Porter et al., 2020) are lower than the estimates reported in this study. Burrows et al. (2014), Smeaton et al. (2020), and Porter et al. (2020) report surficial C stock estimates that are based on the available BGS sediment maps, which do not include near coastal areas (40,180 km2 of Scotland’s seabed, for example, is unmapped), with important additional gaps in mapping around the Orkney islands (Porter et al., 2020). The fjordic sediment OC stocks of Smeaton and Austin (2019) compare favorably to those of this study (Table 4).
Management and Mitigation: The Role of Sedimentary C
The 524.4 ± 68.4 Mt OC and 2,582.3 ± 167.8 Mt IC stored within the surficial sediments of the UK EEZ pose many potential questions on how to manage and protect these significant stores of C. The magnitude of marine sediment OC stores have prompted a renewed interest in natural capital accounting and offer some opportunities for their inclusion in national GHG inventories and C trading schemes (Avelar et al., 2017; Luisetti et al., 2020).
The potential for marine sedimentary OC to be managed and included within nationally determined GHG inventories is plausible, yet several hurdles and knowledge gaps remain. The most common and persuasive approach to managing these sedimentary C stores is to reduce seabed disturbance, for example by reducing anthropogenic mobilization of the sediment and remineralization of the OC (Atwood et al., 2020; Diesing et al., 2020; Legge et al., 2020; Luisetti et al., 2019). Bottom trawling has been identified as one of the main causes for seabed disturbance within the UK EEZ (Dunkley and Jean-Luc, 2020). Ecosystem service approaches have equated the damage to the UK EEZ sedimentary OC stores by bottom trawling to an equivalent US$ 0.8 to 6 billion annually for C release and, if the current rate of expansion of the industry continues, it is estimated that US$ 12.5 billion of C could be released annually (Luisetti et al., 2019). In reality, these estimates of damage and C release from bottom trawling are likely to be highly contested. Luisetti et al. (2019) apply a generic C loss rate (0.2 tonnes C ha−1) across all of the UK EEZ seabed, when it is clear that sediment type (Figure 2) and sedimentary OC content (Figure 9) vary significantly, rendering this approach over-simplistic. Furthermore, differences in sediment type largely define fishing grounds with most bottom trawling concentrated in finer grained sediments (Eigaard et al., 2017; Amoroso et al., 2018). Since OC content can vary with sediment type, it therefore seems unlikely that any such C loss would occur at the same rate across all sediment types. Luisetti et al. (2019) do, however, correctly highlight that certain areas and sediment types on the seabed, such as OC-rich muds, may be at greater risk from disturbance and require management and/or protection for their C resources. If these areas of seafloor were to be managed, then focusing on regions of high seafloor OC density, with targeted approaches taken to potentially manage and protect hotspots of OC, such as fjords and coastal muds, would seem an appropriate strategy (Figure 9).
The large IC stocks are mostly made up of broken, poorly sorted shell deposits (Wilson, 1979). As the formation of CaCO3 is a net producer of CO2 (Frankignoulle et al., 1994; Frankignoulle et al., 1995) and we neither know the source nor age of the shell material, both of which are likely to be highly heterogeneous, their inclusion in C budgets remains highly complex and unlikely at this time. Unlike OC, where there is a recognized hazard to the stores (i.e. seabed disturbance), there appear to be few threats to the IC on the seafloor, apart from ongoing ocean acidification. Therefore, management interventions are unlikely to be possible.
We recommend, as the science and policy opportunities mature, that a targeted approach to sedimentary OC hotspots will likely prove the most successful to the future management of these sedimentary OC stores, perhaps through the creation of Marine Protected Area networks that incorporate sedimentary OC in their formal designation status.
Conclusion
Quantifying the magnitude of the surficial sediment C stock and its spatial distribution across the UK EEZ is critical to improve our understanding of marine sedimentary environments as sites for the deposition and storage of C. The surficial sediments of the UK EEZ contain 524.4 ± 68.4 Mt OC and 2,582.3 ± 167.8 Mt IC. The improved spatial mapping of this C highlights well-defined OC accumulation hotspots (fjords, estuaries and coastal muds) and some of these locations offer potentially valuable opportunities for the future management and protection of sedimentary C stores within the UK EEZ. This study provides an additional contribution to the quantification and understanding of marine sediments and their C stores as a significant component of UK natural capital, yet the mechanisms that govern the accumulation, preservation and long-term storage of C in these marine sediments remain poorly defined across much of the UK EEZ.
Data Availability Statement
Datasets generated/analyzed for this study are included in the article/Supplementary Material. Datasets are available Marine Scotland Data (https://data.marine.gov.scot/). OC and IC contents of surficial sediments within Scottish adjacent waters produced as part of this study (https://doi.org/10.7489/12353-1). GIS layers mapping the sediment type, porosity, dry bulk density, C content and C density across the UK EEZ and the territorial waters of the Isle of Man and the Channel Islands (https://doi.org/10.7489/12354-1).
Author Contributions
CS, WA, and WT conceived the study. CS led the design and undertook the research with support from CH and WA. CS wrote the first draft of the manuscript in collaboration with WA; all authors contributed to manuscript revisions and final approval of the submitted version.
Funding
This work was supported by Marine Scotland through the Blue Carbon Forum. Additional support from the NERC Life Sciences Mass Spectrometry Facility (CEH_L_115_05_2018) allowed additional analytical work to be undertaken. BGS provided access to samples through their In-kind sample loan scheme (Loan: 273227).
Conflict of Interest
The authors declare that the research was conducted in the absence of any commercial or financial relationships that could be construed as a potential conflict of interest.
Acknowledgments
The authors would like to thank the captains, crew and fellow scientists from the many research cruises that contributed to the collection of samples utilized in this study. The authors would like to thank the staff of the British Geological Survey Core Store in Keyworth and the British Ocean Sediment Core Research Facility (BOSCORF) for their assistance in gaining access to samples. Additionally, the authors would like to thank the data managers at both the British Geological Survey and the United Kingdom Hydrographic Office for their help in gaining access to the backscatter data and survey reports. We thank Ian Davies (Marine Scotland) and John Baxter (Blue Carbon Forum) for providing useful insights and comments during the development of this manuscript. Lastly, we thank the two reviewers and the editor for providing useful insight, which has improved this manuscript.
Supplementary Material
The Supplementary Material for this article can be found online at: https://www.frontiersin.org/articles/10.3389/feart.2021.593324/full#supplementary-material.
References
Akpan, E. B., and Farrow, G. E. (1985). Shell bioerosion in high-latitude low-energy environments: firths of Clyde and lorne, Scotland. Mar. Geol. 67 (1-2), 139–150.
Aller, R. C., and Blair, N. E. (2006). Carbon remineralization in the Amazon–Guianas tropical mobile mudbelt: a sedimentary incinerator. Continent. Shelf Res. 26 (17-18), 2241–2259.
Amoroso, R. O., Pitcher, C. R., Rijnsdorp, A. D., McConnaughey, R. A., Parma, A. M., Suuronen, P., et al. (2018). Bottom trawl fishing footprints on the world’s continental shelves. Proc. Natl. Acad. Sci. Unit. States Am. 115 (43), E10275–E10282.
Armstrong, S., Hull, S., Pearson, Z., Wilson, R., and Kay, S. (2020). Estimating the carbon sink potential of the Welsh marine environment. Cardiff: NRW, 74.
Arndt, S., Jørgensen, B. B., LaRowe, D. E., Middelburg, J. J., Pancost, R. D., and Regnier, P. (2013). Quantifying the degradation of organic matter in marine sediments: a review and synthesis. Earth Sci. Rev. 123, 53–86.
Atwood, T. B., Witt, A. W., Mayorga, J., Hammill, E., and Sala, E. (2020). Global patterns in marine sediment carbon stocks. Frontiers in Marine Science 7, 1.
Audsley, A., Bradwell, T., Howe, J. A., and Baxter, J. M. (2019). Distribution and classification of pockmarks on the seabed around western Scotland. J. Maps 15 (2), 807–817.
Avelar, S., van der Voort, T. S., and Eglinton, T. I. (2017). Relevance of carbon stocks of marine sediments for national greenhouse gas inventories of maritime nations. Carbon Bal. Manag. 12 (1), 10. doi:10.1186/s13021-017-0077-x
Bao, R., Uchida, M., Zhao, M., Haghipour, N., Montlucon, D., McNichol, A., et al. (2018). Organic carbon aging during across‐shelf transport. Geophys. Res. Lett. 45 (16), 8425–8434.
Bao, R., Zhao, M., McNichol, A., Galy, V., McIntyre, C., Haghipour, N., et al. (2019). Temporal constraints on lateral organic matter transport along a coastal mud belt. Org. Geochem. 128, 86–93.
Bauer, J. E., Cai, W. J., Raymond, P. A., Bianchi, T. S., Hopkinson, C. S., and Regnier, P. A. (2013). The changing carbon cycle of the coastal ocean. Nature 504 (7478), 61–70. doi:10.1038/nature12857
Berner, R. A. (1982). Burial of organic carbon and pyrite sulfur in the modern ocean: its geochemical and environmental significance. United States): Am. J. Sci., 282.
Bianchi, T. S., Arndt, S., Austin, W. E., Benn, D. I., Bertrand, S., Cui, X., et al. (2020). Fjords as aquatic critical zones (ACZs). Earth Sci. Rev. 103145.
Bianchi, T. S., Cui, X., Blair, N. E., Burdige, D. J., Eglinton, T. I., and Galy, V. (2018). Centers of organic carbon burial and oxidation at the land-ocean interface. Org. Geochem. 115, 138–155.
Boudreau, B. P., Huettel, M., Forster, S., Jahnke, R. A., McLachlan, A., Middelburg, J. J., et al. (2001). Permeable marine sediments: overturning an old paradigm. Eos 82, 133–140.
Bröder, L., Tesi, T., Andersson, A., Semiletov, I., and Gustafsson, Ö. (2018). Bounding cross-shelf transport time and degradation in Siberian-Arctic land-ocean carbon transfer. Nat. Commun. 9 (1), 806–808. doi:10.1038/s41467-018-03192-1
Brown, C. J., and Collier, J. S. (2008). Mapping benthic habitat in regions ofgradational substrata: an automated approach utilising geophysical, geological, and biological relationships. Estuar. Coast Shelf Sci. 78, 203–214. doi:10.1016/j.ecss.2007.11.026
Brown, C. J., Todd, B. J., Kostylev, V. E., and Pickrill, R. A. (2011). Imagebased classification of multibeam sonar backscatter data for objective surficial sediment mapping of Georges Bank, Canada. Continent. Shelf Res. 31, S110–S119.
Burrows, M. T., Kamenos, N. A., Hughes, D. J., Stahl, H., Howe, J. A., and Tett, P. (2014). Assessment of carbon budgets and potential blue carbon stores in Scotland’s coastal and marine environment. Edinburgh, United Kingdom: Scottish Natural Heritage Commissioned Report No. 761.
Calvert, J., Strong, J. A., Service, M., McGonigle, C., and Quinn, R. (2014). An evaluation of supervised and unsupervised classification techniques for marine benthic habitat mapping using multibeam echosounder data. ICES J. Mar. Sci. 72, 1498–1513. doi:10.1093/icesjms/fsu223
Cohen, J. (1960). A coefficient of agreement for nominal scales. Educ. Psychol. Meas. 20 (1), 37–46.
Collins, M. B., and Balson, P. S. (2007). Coastal and shelf sediment transport: an introduction. Geological Society, London, Special Publications 274 (1), 1–5.
Cronan, D. S., and Bode, G. W. (1973). “Carbon and carbonate analyses, leg 16,” in Initial reports of the deep sea drilling project. Editors T. H. van Andel, and G. R. Heath (Washington: U.S. Government Printing Office), Vol. XVI, 521–528.
Cui, X., Bianchi, T. S., Savage, C., and Smith, R. W. (2016). Organic carbon burial in fjords: terrestrial versus marine inputs. Earth Planet Sci. Lett. 451, 41–50. doi:10.1016/j.scitotenv.2018.04.242
Diesing, M., Kröger, S., Parker, R., Jenkins, C., Mason, C., and Weston, K. (2017). Predicting the standing stock of organic carbon in surface sediments of the North-West European continental shelf. Biogeochemistry 135, 183–200. doi:10.1007/s10533-017-0310-4
Diesing, M., Thorsnes, T., and Bjarnadóttir, L. R., (2020). Organic carbon in surface sediments of the north sea and skagerrak, Biogeosci. Discuss., doi:10.5194/bg-2020-352,
DIN 19539 (2015). Investigation of solids temperature dependent differentiation of total carbon (TOC400, ROC, TIC900).
Dunkley, F., and Jean-Luc, S. (2020). Marine Unprotected Areas: a case for a just transition to ban bottom trawl and dredge fishing in offshore Marine Protected Areas.
Ehlers, J., Gibbard, P. L., and Rose, J. (1991). Glacial deposits in great britain and Ireland. Rotterdam: Balkema.
Eigaard, O. R., Bastardie, F., Hintzen, N. T., Buhl-Mortensen, L., Buhl-Mortensen, P., Catarino, R., et al. (2017). The footprint of bottom trawling in European waters: distribution, intensity, and seabed integrity. ICES (Int. Counc. Explor. Sea) J. Mar. Sci. 74 (3), 847–865.
Evans, J. R., Austin, W. E. N., Brew, D. S., Wilkinson, I. P., and Kennedy, H. A. (2002). Holocene shelf sea evolution offshore northeast England. Mar. Geol. 191 (3-4), 147–164.
Faust, J. C., and Knies, J. (2019). Organic matter sources in North Atlantic fjord sediments. G-cubed 20 (6), 2872–2885.
Flemming, B. W., and Delafontaine, M. T. (2000). Mass physical properties of muddy intertidal sediments: some applications, misapplications and nonimplications. Continent. Shelf Res. 20, 1179–1197. doi:10.1016/s0278-4343(00)00018-2
Folk, R. L. (1954). The distinction between grain size and mineral composition in sedimentary-rock nomenclature. J. Geol. 62, 344–359. doi:10.1086/626171
Frankignoulle, M., Canon, C., and Gatusso, J.-P. (1994). Marine calcification as a source of carbon dioxide: positive feedback on increasing atmospheric CO2. Limnol. Oceanogr. 39, 458–462. doi:10.4319/lo.1994.39.2.0458
Frankignoulle, M., Pichon, M., and Gattuso, J. P. (1995). “Aquatic calcification as a source of carbon dioxide,” in Proceedings of the NATO ARW on carbon Sequestration in the biosphere. Editor A. Beran (Elsevier), Vol. 133, 265–271.
Friedrich, J., Janssen, F., Aleynik, D., Bange, H. W., Boltacheva, N. A., Çağatay, M. N., et al. (2014). Investigating hypoxia in aquatic environments: diverse approaches to addressing a complex phenomenon. Biogeosciences 11 (4), 1215–1259.
Hall, S. J. (2002). The continental shelf benthic ecosystem: current status, agents for change and future prospects. Environ. Conserv. 29, 350–374. doi:10.1017/s0376892902000243
Harris, D., Horwáth, W. R., and Van Kessel, C. (2001). Acid fumigation of soils to remove carbonates prior to total organic carbon or carbon-13 isotopic analysis. Soil Sci. Soc. Am. J. 65, 1853–1856.
Harris, P. T., Macmillan-Lawler, M., Rupp, J., and Baker, E. K. (2014). Geomorphology of the oceans. Mar. Geol. 352, 4–24.
Hartman, S. E., Larkin, K. E., Lampitt, R. S., Lankhorst, M., and Hydes, D. J. (2010). Seasonal and inter-annual biogeochemical variations in the Porcupine Abyssal Plain 2003–2005 associated with winter mixing and surface circulation. Deep Sea Res. Part II Top. Stud. Oceanogr. 57 (15), 1303–1312.
Hedges, J. I., and Keil, R. G. (1995). Sedimentary organic matter preservation: an assessment and speculative synthesis. Mar. Chem. 49 (2-3), 81–115.
Henrichs, S. M. (1992). Early diagenesis of organic matter in marine sediments: progress and perplexity. Mar. Chem. 39 (1-3), 119–149.
Hodgson, D. M., Bernhardt, A., Clare, M. A., Da Silva, A. C., Fosdick, J. C., Mauz, B., and Romans, B. W. (2018). Grand challenges (and Great Opportunities) in sedimentology, stratigraphy, and diagenesis research. Front. Earth Sci. 6, 173.
Howe, J. A., Austin, W. E., Forwick, M., Paetzel, M., Harland, R., and Cage, A. G. (2010). Fjord systems and archives: a review. Geological Society, London, Special Publications 344 (1), 5–15.
Hulsemann, J. (1966). On the routine analysis of carbonates in unconsolidated sediments. J. Sediment. Res. 36 (2).
Hunt, C. A., Demsar, U., Dove, D., Smeaton, C., Cooper, R., and Austin, W. (2020). Quantifying marine sedimentary carbon: a new spatial analysis approach using seafloor acoustics, imagery, and ground-truthing data in Scotland. Frontiers in Marine Science 7, 588
Ierodiaconou, D., Monk, J., Rattray, A., Laurenson, L., and Versace, V. L. (2011). Comparison of automated classification techniques for predicting benthic biological communities using hydroacoustic and video observations. Continent. Shelf Res. 31, S28–S38.
Jenkins, C. (2005). Summary of the onCALCULATION methods used in dbSEABED. http://pubs.usgs.gov/ds/2006/146/docs/onCALCULATION.pdf.(Accessed June 3rd, 2020).
Journel, A. G. (1983). Nonparametric estimation of spatial distributions. J. Int. Assoc. Math. Geol. 15 (3), 445–468.
Kaskela, A. M., Kotilainen, A. T., Alanen, U., Cooper, R., Green, S., Guinan, J., et al. (2019). Picking up the pieces–Harmonising and collating seabed substrate data for European maritime areas. Geosciences 9, 84. doi:10.3390/geosciences9020084
Lee, T. R., Wood, W. T., and Phrampus, B. J. (2019). A machine learning (kNN) approach to predicting global seafloor total organic carbon. Global Biogeochem. Cycles 33 (1), 37–46.
Legge, O., Johnson, M., Hicks, N., Jickells, T., Diesing, M., Aldridge, J., et al. (2020). Carbon on the northwest European shelf: contemporary budget and future influences. Frontiers in Marine Science 7, 143.
Li, D., Yao, P., Bianchi, T. S., Zhang, T., Zhao, B., Pan, H., et al. (2014). Organic carbon cycling in sediments of the changjiang estuary and adjacent shelf: implication for the influence of three gorges dam. J. Mar. Syst. 139, 409–419.
Li, J., and Heap, A. D. (2014). Spatial interpolation methods applied in the environmental sciences: a review. Environ. Model. Software 53, 173–189.
Lisitzin, A. P., Serova, V. V., Zverinskaya, I. B., Lukashin, V., Gorbunova, Z. N., Gordeev, V. V., et al. (1971). “Geochemical, mineralogical, and paleontological studies,” in Initial reports of the deep sea drilling project. Editor A. G. Fischeret al. (Washington: U.S. Government Printing Office), Vol. VI, 829.
Luisetti, T., Ferrini, S., Grilli, G., Jickells, T. D., Kennedy, H., Kröger, S., et al. (2020). Climate action requires new accounting guidance and governance frameworks to manage carbon in shelf seas. Nat. Commun. 11 (1), 4599–4610. doi:10.1038/s41467-020-18242-w
Luisetti, T., Turner, R. K., Andrews, J. E., Jickells, T. D., Kröger, S., Diesing, M., et al. (2019). Quantifying and valuing carbon flows and stores in coastal and shelf ecosystems in the UK, 35. Ecosystem services, 35, 67–76.
Marinoni, O. (2003). Improving geological models using a combined ordinary–indicator kriging approach. Eng. Geol. 69 (1-2), 37–45.
Marretj, F., Scourse, J., and Austin, W. (2004). Holocene shelf-sea seasonal stratification dynamics: a dinoflagellate cyst record from the Celtic Sea, NW European shelf. Holocene 14 (5), 689–696.
McBreen, F., Wilson, J. G., Mackie, A. S., and Aonghusa, C. N. (2008). Seabed mapping in the southern Irish Sea: predicting benthic biological communities based on sediment characteristics. Chall. Mar. Ecosyst. 606, 93–103. doi:10.1007/978-1-4020-8808-7_9
Middelburg, J. J. (2019). Marine carbon biogeochemistry: a primer for Earth system scientists. Springer.
Mollenhauer, G., Inthorn, M., Vogt, T., Zabel, M., Sinninghe Damsté, J. S., and Eglinton, T. I. (2007). Aging of marine organic matter during cross‐shelf lateral transport in the Benguela upwelling system revealed by compound‐specific radiocarbon dating. G-cubed 8 (9).
Natali, C., Bianchini, G., and Carlino, P. (2020). Thermal stability of soil carbon pools: inferences on soil nature and evolution. Thermochim. Acta 683, 178478.
Nieuwenhuize, J., Maas, Y. E., and Middelburg, J. J. (1994). Rapid analysis of organic carbon and nitrogen in particulate materials. Mar. Chem. 45 (3), 217–224.
Opreanu, G. (2003). Porosity density and other physical properties of deep-sea sediments from the Black Sea. GEO-ECO-MARINA 9-10/2003-2004.
O’Cofaigh, C., Weilbach, K., Lloyd, J. M., Benetti, S., Callard, S. L., Purcell, C., et al. (2019). Early deglaciation of the British-Irish ice sheet on the Atlantic shelf northwest of Ireland driven by glacioisostatic depression and high relative sea level. Quat. Sci. Rev. 208, 76–96. doi:10.1016/j.quascirev.2018.12.022
Peters, J. L., Benetti, S., Dunlop, P., and Cofaigh, C. O. (2015). Maximum extent and dynamic behaviour of the last British–Irish ice sheet west of Ireland. Quat. Sci. Rev. 128, 48–68. doi:10.1016/j.quascirev.2015.09.015
Porter, J., Austin, W., Burrows, M., Clarke, D., Davies, G., Kamenos, N., et al. (2020). Blue carbon audit of Orkney waters. Scottish Marine and Freshwater Science Vol. 11 (No. 3). Marine Scotland science. doi:10.7489/12262-1
Rao, A. M. F., McCarthy, M. J., Gardner, W. S., and Jahnke, R. A. (2008). Respiration and denitrification in permeable continental shelf deposits on the South Atlantic Bight: N2:Ar and isotope pairing measurements in sediment column experiments. Continent. Shelf Res. 28, 602–613. doi:10.1016/j.csr.2007.11.007
Rice, A. L., Billett, D. S. M., Fry, J., John, A. W. G., Lampitt, R. S., Mantoura, R. F. C., et al. (1986). Seasonal deposition of phytodetritus to the deep-sea floor. Proc. Roy. Soc. Edinb. B Biol. Sci. 88, 265–279.
Richardson, M. D., and Briggs, K. B. (1993). On the use of acoustic impedance values to determine sediment properties. Mississippi, United States: NAVAL RESEARCH LAB STENNIS SPACE CENTER MS.(No. NRL/PP/7431-92-0001).
Roberts, D. R., Bahn, V., Ciuti, S., Boyce, M. S., Elith, J., Guillera‐Arroita, G., et al. (2017). Cross‐validation strategies for data with temporal, spatial, hierarchical, or phylogenetic structure. Ecography 40 (8), 913–929.
Schink, J. C., Stockwell, J. H., and Ellis, R. A. (1979). An improved device for gasometric determination of carbonate in sediment. J. Sediment. Res. 49 (2), 651–653.
Serpetti, N., Heath, M., Rose, M., and Witte, U. (2012). High resolution mapping of sediment organic matter from acoustic reflectance data. Hydrobiologia 680, 265–284. doi:10.1007/s10750-011-0937-4
Silburn, B., Sivyer, D. B., Kroeger, S., Parker, R., Mason, C., Nelson, P., et al. (2017). Shelf sea biogeochemistry sediment characterization. Liverpool: British Oceanographic Data Centre, Natural Environment Research Council.
Simpson, J. H., and Hill, A. E. (1986). The Scottish coastal current. In The role of freshwater outflow in coastal marine ecosystems. Berlin, Heidelberg: Springer, 295–308.
Smeaton, C., Austin, W., and Turrell, W., (2020). Re-evaluating Scotland’s sedimentary carbon stocks. Scottish Marine and Freshwater Science, 2 edn, Edinburgh, United Kingdom: Marine Scotland. Vol. 11, doi:10.7489/12267-1
Smeaton, C., Austin, W., Davies, A., Baltzar, A., Abell, R. E., and Howe, J. A. (2016). Substantial stores of sedimentary carbon held in midlatitude fjords. Biogeosciences 13, 5771–5787. doi:10.5194/bg-13-5771-2016
Smeaton, C., Austin, W. E., Davies, A., Baltzer, A., Howe, J. A., and Baxter, J. M. (2017). Scotland’s forgotten carbon: a national assessment of mid-latitude fjord sedimentary stocks. Biogeosciences 14, 5663–5674. doi:10.5194/bg-14-5663-2017
Smeaton, C., and Austin, W. E. N. (2019). Where’s the carbon: exploring the spatial heterogeneity of sedimentary carbon in mid-latitude fjords. Front. Earth Sci. 7, 269.
Smeaton, C., and Austin, W. E. (2017). Sources, sinks, and subsidies: terrestrial carbon storage in mid-latitude fjords. J. Geophys. Res. Biogeosci. 122, 2754–2768. doi:10.1002/2017jg003952
Smith, R. W., Bianchi, T. S., Allison, M., Savage, C., and Galy, V. (2015). High rates of organic carbon burial in fjord sediments globally. Nat. Geosci. 8 (6), 450–453.
Turrell, W. R., Slesser, G., Payne, R., Adams, R. D., and Gillibrand, P. A. (1996). Hydrography of the east Shetland basin in relation to decadal North Sea variability. ICES (Int. Counc. Explor. Sea) J. Mar. Sci. 53 (6), 899–916.
Tyllianakis, D., Spiegelhalter, D., Thomas, A., and Best, N. (2009). The BUGS project: evolution, critique and future directions. Stat. Med. 28 (25), 3049–3067. doi:10.1002/sim.3680
Uehara, K., Scourse, J. D., Horsburgh, K. J., Lambeck, K., and Purcell, A. P. (2006). Tidal evolution of the northwest European shelf seas from the Last Glacial Maximum to the present. J. Geophys. Res.: Oceans 111 (C9).
Valavi, R., Elith, J., Lahoz‐Monfort, J. J., and Guillera‐Arroita, G. (2019). Block CV: an r package for generating spatially or environmentally separated folds for k‐fold cross‐validation of species distribution models. Methods in Ecology and Evolution 10 (2), 225–232.
Verardo, D. J., Froelich, P. N., and McIntyre, A. (1990). Determination of organic carbon and nitrogen in marine sediments using the Carlo Erba NA-1500 Analyzer. Deep Sea Research Part A. Oceanographic Research Papers 37 (1), 157–165.
Wakeham, S.G., and Canuel, E.A., (2006). Degradation and preservation of organic matter in marine sediments. In Marine organic matter: biomarkers, isotopes and DNA. Berlin, Heidelberg: Springer, 295–321.
Ward, S. L., Neill, S. P., Scourse, J. D., Bradley, S. L., and Uehara, K. (2016). Sensitivity of palaeotidal models of the northwest European shelf seas to glacial isostatic adjustment since the Last Glacial Maximum. Quat. Sci. Rev. 151, 198–211.
Wilson, J. B. (1979). Biogenic carbonate sediments on the Scottish continental shelf and on Rockall Bank. Mar. Geol. 33, 85–93.
Woulds, C., Bouillon, S., Cowie, G. L., Drake, E., Middelburg, J. J., and Witte, U. (2016). Patterns of carbon processing at the seafloor: the role of faunal and microbial communities in moderating carbon flows. Biogeosciences 13, 4343–4357. doi:10.5194/bg-13-4343-2016
Yao, P., Zhao, B., Bianchi, T. S., Guo, Z., Zhao, M., Li, D., et al. (2014). Remineralization of sedimentary organic carbon in mud deposits of the Changjiang Estuary and adjacent shelf: implications for carbon preservation and authigenic mineral formation. Continent. Shelf Res. 91, 1–11.
Zhao, B., Yao, P., Bianchi, T. S., Arellano, A. R., Wang, X., Yang, J., et al. (2018). The remineralization of sedimentary organic carbon in different sedimentary regimes of the Yellow and East China Seas. Chem. Geol. 495, 104–117.
Keywords: carbon, sediment, seabed, organic carbon, inorganic carbon, stock, spatial, mapping
Citation: Smeaton C, Hunt CA, Turrell WR and Austin WEN (2021) Marine Sedimentary Carbon Stocks of the United Kingdom’s Exclusive Economic Zone. Front. Earth Sci. 9:593324. doi: 10.3389/feart.2021.593324
Received: 10 August 2020; Accepted: 19 January 2021;
Published: 04 March 2021.
Edited by:
Christian März, University of Leeds, United KingdomReviewed by:
Markus Diesing, Geological Survey of Norway, NorwaySilke Kroeger, Centre for Environment, Fisheries and Aquaculture Science (CEFAS), United Kingdom
Copyright © 2021 Smeaton, Hunt, Turrell and Austin. This is an open-access article distributed under the terms of the Creative Commons Attribution License (CC BY). The use, distribution or reproduction in other forums is permitted, provided the original author(s) and the copyright owner(s) are credited and that the original publication in this journal is cited, in accordance with accepted academic practice. No use, distribution or reproduction is permitted which does not comply with these terms.
*Correspondence: Craig Smeaton, cs244@st-andrews.ac.uk