Transient Modelling of Permafrost Distribution in Iceland
 Justyna Czekirda
 Sebastian Westermann1
  Bernd Etzelmüller
 Tómas Jóhannesson
- 1Department of Geosciences, University of Oslo, Oslo, Norway
- 2Icelandic Meteorological Office, Reykjavík, Iceland
Warming and degradation of permafrost during the ongoing climate change is of growing concern. Recently, permafrost thawing has been recognized as a new factor triggering landslides in Iceland. Therefore, there is an increased need for a more thorough understanding of permafrost distribution and the temporal evolution of the ground thermal regime in this region. This study focuses on regional modelling of ground temperature evolution in Iceland for the last six decades (1960–2016) by employing the transient permafrost model CryoGrid 2 at 1-km spatial resolution. To account for the strong wind redistribution of snow in Iceland, we ran three realizations of the model, by forcing the embodied snow water equivalent model with 50, 100, and 150% of gridded precipitation. The modelled permafrost extent strongly depends on snow depth, with around 3–15 times more cells indicating permafrost in the halved-precipitation run in comparison to the other two precipitation runs. A three- to four-decade-long warming trend has led to warming or degradation of permafrost in some areas of Iceland. We roughly estimate that ~11 and 7% of the land area of Iceland was underlain by permafrost during the periods 1980–1989 and 2010–2016, respectively. Model validation with ground temperature measurements and the distribution of permafrost-related landforms, such as active rock glaciers and stable ice-cored moraines, together with palsas and peat plateaus, shows good agreement. The simulation results may be further used as a baseline for modelling of future permafrost evolution at a regional scale or for identification of landslide-susceptible areas in Iceland.
Introduction
Permafrost temperature is a sensitive climate indicator, providing a filtered signal of surface temperature variations, from annual-scale surface temperature variations at depths of a few meters to century-scale climate change at depths of several 100 m (Lachenbruch and Marshall, 1986). Substantial permafrost warming trends have been observed in most permafrost regions of the Earth during the last decades (e.g., Romanovsky et al., 2010). Because of likely continuation of climate warming and seasonal snow cover changes, future projections indicate shrinkage of the near-surface permafrost extent (e.g., Collins et al., 2013). Enhanced thaw of ice-rich permafrost has the potential to alter the landscape, tundra ecosystems, and associated hydrological processes (e.g., Smith et al., 2005; Jorgenson et al., 2006; White et al., 2007). Furthermore, permafrost thaw affects infrastructure in the Arctic (Hjort et al., 2018; Yumashev et al., 2019) and in high mountains. There, permafrost degradation is considered to be an important factor for geotechnical slope stability, contributing to triggering rockfalls, rock avalanches, or landslides (Gruber and Haeberli, 2007; Ravanel et al., 2010; Krautblatter et al., 2012). In addition, permafrost is one of the largest vulnerable carbon pools, storing two times more organic carbon than the entire atmosphere (Schuur et al., 2008), which may contribute to enhanced greenhouse gas emissions if permafrost thaws. According to recent studies (e.g., Schuster et al., 2018) permafrost contains also a large amount of buried mercury, a release of which may potentially threaten human health. During the ongoing warming, the knowledge of the spatial and temporal evolution of permafrost is thus essential for the assessment of permafrost vulnerability, and plausible impacts of permafrost degradation on the environment.
In the North-Atlantic region, permafrost is widespread and highly diverse, ranging from mountain discontinuous permafrost in Scandinavia (Gisnås et al., 2017), via warm continuous permafrost on Svalbard (e.g., Humlum et al., 2003) to cold continuous permafrost at the east coast in Greenland (Christiansen et al., 2008; Westermann et al., 2015a). Iceland is situated in the transition between mountain permafrost in Norway and continuous permafrost in Greenland and is dominated by both mountain permafrost above c. 800 m a.s.l. in deep regolith-dominated slopes and mountain plateaus, along with sporadic permafrost in palsas and peat plateaus (e.g., Etzelmüller et al., 2007; Farbrot et al., 2007b; Saemundsson et al., 2012). Ground temperatures have been monitored in four shallow boreholes since 2004 (Farbrot et al., 2007b), and show near-surface permafrost temperatures between −1°C to close to 0°C between 800 and 900 m a.s.l. in eastern and central Iceland.
Snow cover and redistribution of snow by strong wind is one of the major factors governing permafrost distribution locally due to maritime climate conditions (Etzelmüller et al., 2007), with frequent low-pressure systems developing around Iceland during all seasons. Moreover, the volcanic activity in Iceland leads to high geothermal heat flux (Hjartarson, 2015), which restricts permafrost thickness and causes the ground temperatures to be very sensitive to the changes in surface temperature (Farbrot et al., 2007b). Thus, permafrost existence is assumed very dynamic in Iceland. This has become obvious recently through three events where ice-cemented debris was observed within landslide deposits (Sæmundsson et al., 2018; Figure 1). The importance of permafrost thaw for slope processes in Iceland has therefore became a focal point of interest over the past few years, where e.g., Sæmundsson et al. (2018) urge that the mentioned landslides “have highlighted the need for a more detailed understanding of the distribution and condition of mountain permafrost within perched talus deposits.” These previous events occurred in unsettled areas; however, a similar type of landslides may occur in the future in other regions of the country, thus increasing hazard risk for infrastructure and inhabitants.
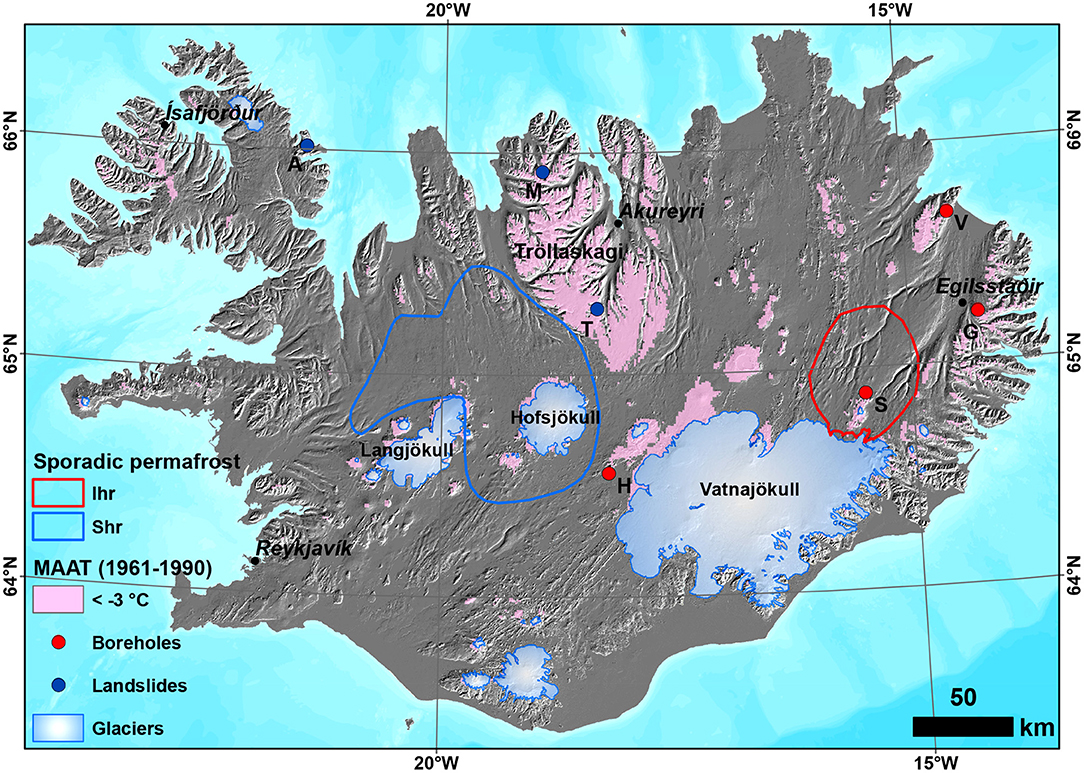
Figure 1. Sporadic permafrost from Brown et al. (1997): Ihr, Isolated patches of permafrost extent with high ground ice content and thin overburden and exposed bedrock; Shr, Sporadic permafrost extent with high ground ice content and thin overburden and exposed bedrock. MAAT < −3°C indicates areas of widespread permafrost as modelled in Etzelmüller et al. (2007). Boreholes: G, Gagnheiði; H, Hágöngur; S, Sauðafell; V, Vopnafjörður. Landslides with ice-cemented deposits: M, Móafellshyrna Mountain; T, Torfufell Mountain; Á, Árnesfjall Mountain. Map data from the National Land Survey of Iceland (NLSI; License: http://www.lmi.is/wp-content/uploads/2013/10/licenceNLSI.pdf).
To address these issues, knowledge about permafrost distribution, dynamics, and sensitivity to climate change is needed. Earlier, the potential permafrost extent in Iceland was simply delineated based on the mean annual air temperature for the normal period of 1961–1990 (Etzelmüller et al., 2007; Figure 1), where threshold values for permafrost presence were derived using ground surface temperature data. Later, equilibrium approaches were presented for the entire North Atlantic region, where the semi-empirical TTOP-model (Smith and Riseborough, 2002; Riseborough et al., 2008) was forced by land surface temperate obtained by satellites (Westermann et al., 2015b). In these approaches, the effects of the snow cover on the ground thermal regime (nival offsets) and the thermal offsets within the active layer were neither addressed nor handled through simplified empirical relationships. Transient behaviour of ground temperatures was not considered.
The overall objective of this study was to model regional permafrost distribution in Iceland transiently for the period 1960–2016. To achieve this task, we implemented a temperature-index snow model for Iceland (Saloranta, 2012) and established a permafrost model using the transient permafrost model CryoGrid 2 (Westermann et al., 2013), with a ground resolution of 1 km. To address sub-grid variability due to snow depth heterogeneity, the permafrost model was run with three precipitation scenarios. The snow and permafrost models were forced by gridded data sets of air temperature and precipitation provided by the Icelandic Meteorological Office (IMO). This paper presents the main results of this study, together with model sensitivity, and discusses the ability to distinguish regions of high interest for probable future landslide hazards due to permafrost thaw.
Geology and climate
Iceland is a geologically young island that is located in the northern part of the North Atlantic ridge, stretching between 63 and 66°N. Currently, the volcanic activity and faulting take place almost exclusively within the neo-volcanic zones, which are 15–50 km-wide belts (Thordarson and Höskuldsson, 2008). Iceland is dominated by basaltic rock, partly highly fractured, and easily weathered.
Iceland has a maritime climate, with mild winters and cool summers. Mean annual air temperature (MAAT) in the normal period 1981–2010 varied from below −5°C at the uppermost parts of the ice caps to above 4–5°C along the southern coast (Crochet and Jóhannesson, 2011). Mean annual precipitation (MAP) during the same normal period is estimated to be above 4,000 mm in the windward mountainous regions in the south, above 1,000 mm in most of the other regions in the south and 500–1,000 mm in the large parts of the northern Iceland (Crochet et al., 2007). The climate has substantially varied since the start of instrumental observations in the nineteenth century. A warm period during the 1930s was followed by a cold period until the early 1990s (Hanna et al., 2004; Figure 2). Since then, air temperature has increased.
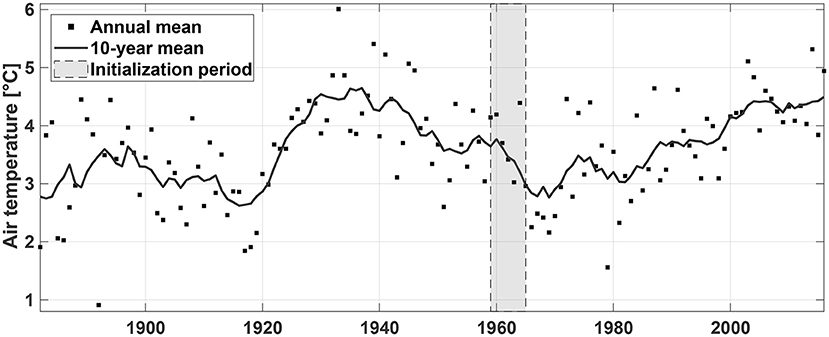
Figure 2. Mean annual air temperature with a 10-year running mean in Akureyri in the period 1882–2016. Initialization period of the transient permafrost model is also shown. Data from the Icelandic Meteorological Office.
Regional distribution and thicknesses of the surficial sediments are generally unclear in Iceland. Soil development throughout the Holocene has been shaped by volcanic eruptions, active aeolian processes and cryoturbation (Arnalds, 2008). Sandy surfaces in the neo-volcanic zones and glacio-fluvial floodplains supply sand-dust material, which is deposited with rates of <0.01 mm yr−1 and >1 mm yr−1 in the areas away from and close to the dust sources, respectively (Arnalds, 2015). In addition, the soil thickening rates increased after the settlement (“Landnám,” around 874 AD), when an extensive land degradation started (Arnalds, 2008). The resulting barren land together with the other poorly vegetated land areas, which occur in the mountains and in areas subjected to volcanic disturbance and catastrophic flooding, currently cover ~42% of Iceland (Arnalds, 2015).
Forcing Data and Modelling Approach
The CryoGrid 2 Model
CryoGrid 2 is a numerical permafrost model, where the evolution of the temperature profile is computed both in the soil and snowpack (when present), by forcing the model with sets of air/surface temperature and snow depth. The model physics is similar to the other transient permafrost models, e.g., GIPL2 (Jafarov et al., 2012; Nicolsky et al., 2017). The detailed description of the equations implemented in the CryoGrid 2 model, together with the numerical solvers, can be found in Westermann et al. (2013). The mathematical basis of the model is one-dimensional transient heat conduction equation that additionally accounts for the latent heat effects due to ice-water phase changes:
where ceff(z, T) [J m−3 K−1], k(z, T) [W m−1 K−1], z, T, t denote the effective volumetric heat capacity, thermal conductivity, depth, temperature and time, respectively. Equation (1) can be applied for spatially distributed permafrost modelling by calculating it for each grid cell, i.e., there is no interaction between the neighbouring cells and the lateral heat flux is thus overlooked in the model. Thermal properties of the subsurface layers are estimated as functions of the thermal properties of the individual soil constituents, such as water, ice, organic matter, mineral content, air, and their respective volumetric fractions. The liquid water and ice contents are obtained in CryoGrid 2 from the functions by Dall'Amico et al. (2011), which link liquid water content, temperature and soil saturation degree. Variations in soil water content depend exclusively on freezing and thawing processes, i.e., water or water vapour movement in the soil, along with additional external water inputs (meltwater, rain), and their impact on the ground temperature are neglected in the model.
A snowpack layer has constant thermal properties in space and time, which are estimated as functions of a uniform snow density. In this study, the thermal conductivity of snow ksnow [W m−1 K−1] was estimated from an equation derived by Yen (1981):
where kice, ρsnow, ρwater denote the thermal conductivity of ice and the densities of snow and water, respectively. The same snow density is used to convert snow water equivalent (SWE), provided as the forcing data, to snow depth. Influence of processes in the snow cover, such as water infiltration, snow melting or refreezing of melt- or rainwater, on the ground temperature is excluded.
Surface Forcing and Boundary Conditions
Gridded Air Temperature Data Set
Gridded air temperature data set was provided by the Icelandic Meteorological Office (IMO). The IMO data set of gridded daily temperature has a 1 km2 resolution and is described in detail in Crochet and Jóhannesson (2011). The data set is in principle based on lapse rate adjustment and interpolation based on meteorological stations on Iceland. The model verification of the mean monthly temperatures for the 1961–1990 period indicated that the modelled temperatures are unbiased in average within ±1°C. The evaluation of the gridded daily temperatures in 1995–2010 estimated 60–80% and 90–95% of the errors to be within ±1 and ±2°C, respectively (Crochet and Jóhannesson, 2011).
Gridded Precipitation Data Sets
Two gridded precipitation data sets from IMO were derived from the large-scale atmospheric conditions based on reanalysis data from the European Centre for Medium-Range Weather Forecasts (ECMWF). The first precipitation data set for the period 1958–2002 has a 1-km resolution (Crochet et al., 2007), and was calculated from a physically-based linear theory model of orographic precipitation (henceforth LT model) developed by Smith and Barstad (2004), where airflow over the orography is estimated using linear mountain-wave theory and a linear cloud physics representation is used to estimate the resulting precipitation field. The second precipitation data set at a 2.5-km resolution for the period between 1980 and 2016 was created using the non-hydrostatic convection-permitting numerical weather prediction (NWP) model HARMONIE (Bengtsson et al., 2017). The gridded precipitation data for Iceland derived with the HARMONIE model were created based on ERA-Interim reanalysis (T255 resolution, ~79 km) data and from ECMWF operational reanalysis in the recent period.
Snow Water Equivalent (SWE) Model
A degree-day based algorithm from Saloranta (2012) was employed to obtain snow water equivalent (SWE). This approach, so-called “seNorge,” is operationally used in Norway to produce daily maps of snow distribution and depth. The SWE model is run for each grid cell separately and is forced by daily mean air temperature and daily sum of precipitation. The model includes the accumulation of snowfall and liquid water content (snowmelt or rainfall) in the snowpack. Precipitation is categorized as liquid or solid based on an air temperature threshold. Snow always accumulates in the snowpack, whereas addition of liquid water cannot exceed a given liquid water-retention capacity parameter that depends on ice content in the snowpack. When air temperature is above a chosen temperature threshold for melting/refreezing, the available ice content melts, otherwise, the available liquid content refreezes to ice. Potential melting and refreezing are quantified based on seasonally varying degree-day factors for melting and refreezing. The detailed description of the equations used in the seNorge model for snowpack water balance can be found in Saloranta (2012).
The SWE model was forced by the gridded daily air temperature and precipitation data sets. The HARMONIE data set was linearly interpolated to 1-km2 cells for exactly the same central grid coordinates as used in the permafrost model. The data set from the HARMONIE was given the higher priority than the results of the LT model since it should be more reliable, according to the validation studies conducted at IMO (Nawri et al., 2017). Therefore, between 1.9.1959 and 31.12.1979 precipitation data set derived from the LT model was used, and in the remaining period, the data set from the HARMONIE model was employed.
Most of the SWE-model parameters for Iceland were assumed or based on the values found in the literature. Correction factors for input precipitation as snow or rain were set to unity. Threshold air temperature for rain/snow was set to 1°C, following different studies from Icelandic glaciers (Jóhannesson et al., 1995; Jóhannesson, 1997; Aðalgeirsdóttir et al., 2006), while we used the base temperature of 0°C as a threshold for melting/refreezing (e.g., DeWalle and Rango, 2008). The degree-day factor for refreezing followed Saloranta (2012), yielding values between 0.32 and 0.6 mm d−1 °C−1 for Iceland, which are within the ranges of the minimum and maximum degree-day refreezing factors found in the literature (Kokkonen et al., 2006; Saloranta, 2012). The snowpack could retain liquid water of maximum 10% of its ice content.
Minimum and maximum degree-day melt factors were derived from snow depth measurements recorded at Icelandic weather stations, located above 150 m a.s.l. with snow cover remaining for at least a few months during winter were analysed. The analysis encompassed only chosen years, where relatively deep snow cover was present during melting season. SWE was calculated from the observed snow depth, assuming snow density of 350 kg m−3 that is an approximate mean value of snow densities in Sigurðsson and Jóhannesson (2014). The same snow density was assumed in the CryoGrid 2 permafrost model to convert SWE to snow depth and to calculate thermal conductivity of snow. The accumulated melt depth Macc[mm] was derived for every chosen melt season between the date of maximum snow depth and modelled snow-free day, i.e., when Macc equals maximum SWE. Macc is given by:
where Tair is air temperature, TM is threshold air temperature for melting (0°C) and t is time interval (1 day). Various combinations of the minimum and maximum degree-day melting factors were tested in order to determine the best possible snow-free date. The initial guess values of the melt factors for snow were assumed to be similar to the melt factors used in the degree-day glacier mass-balance models applied to the Icelandic glaciers: 4.45–5.6 mm d−1 °C−1 (Jóhannesson et al., 1995; Jóhannesson, 1997; Aðalgeirsdóttir et al., 2006). These parameters are higher than the melt factors used in the SWE model for Norway, where minimum degree-day melting factor of 2 mm d−1 °C−1 and maximum degree-day factor of 3–4 mm d−1 °C−1 is used (Saloranta, 2012). In Iceland, snow may have a sand layer on top due to aeolian accumulation, leading to higher melt factors for snow than in Norway. Additionally, maximum degree-day melting factors vary in the SWE model for Norway depending on the latitude and forest cover; however, it was assumed that this approach was unnecessary for Iceland, considering that the forest cover is sparse and its latitudinal extent is much less than Norway's.
The modelled snow extent in periods of 2000 to 2016 was visually compared with the snow extent visible on satellite imagery. An archive of low-resolution optical satellite imagery from Aqua/Terra MODIS is available for Iceland from 2000 until present on NASA Worldview application (https://worldview.earthdata.nasa.gov/) operated by the NASA/Goddard Space Flight Center Earth Science Data and Information System (ESDIS) project. The False Colour Composites (FCCs) 721 were utilized, where shortwave infrared (SWIR; Band 7), near-infrared (NIR; band 2), and visible band (VIS; band 1) are used as red, green and blue components, respectively, of the RGB composite. Snow and ice are in most cases easily distinguishable from clouds in FCC 721 (NASA, 2018).
Surface Forcing and Lower Boundary Conditions
CryoGrid 2 was forced by weekly averaged surface air temperature data and snow depth data derived from the SWE algorithm. As the lower model boundary at 1,000 m depth, we used the published heat flow map by Hjartarson (2015), assuming constant heat flux in time. The heat flux is generally high in Iceland, between 40 to over 300 mW m−2, with the largest values occurring in or near the active volcanic zones. The applied thermal conductivity values varied regionally between 1.6 W m−1 K−1 for the young volcanic rocks, 1.7–1.8 W m−1 K−1 for the intermediate-aged rocks and 1.9 W m−1 K−1 for the oldest volcanic rocks. The influence of paleoclimatic changes, such as glaciations, was assumed to be erased by the high geothermal heat flux and was not accounted for in the heat flow map (Hjartarson, 2015).
Ground Properties
Sediment Cover
Thermal conductivity of the rock matrix or mineral fraction was set to 2 W m−1 K−1 (Flóvenz and Saemundsson, 1993). For each subsurface layer volumetric contents of water (θw), mineral component (θm), organic matter (θo), and air (θa) were defined as means for the whole modelling period. The seasonal variations in the water content or depth to the saturated zone are neglected.
As there is no nationwide map of surficial sediments, subsurface stratigraphy was assigned according to the soil map of Iceland (Arnalds, 2008, 2015). The main soil types in Iceland are Histosols, Histic Andosols, Gleyic Andosols, Brown Andosols, Vitrisols, Leptosols, and Cryosols (Arnalds, 2015). Some grids on the soil map are soil complexes, composed of two or more soil types, because of the small scale of this map. To get an idea of parameter ranges, the model was calibrated against the ground temperature measurements at depths of 1 and 2 m acquired in four shallow boreholes in central and eastern Iceland (Farbrot et al., 2007b). The boreholes are located in the same soil class (Cambic Vitrisol), thus their subsurface parameters (subsurface layers, volumetric contents, and type of the freeze curve) were assumed to be equal. To account for the snow depth heterogeneity within a grid cell, we additionally adjusted snow depth at each borehole site by forcing the seNorge SWE model with precipitation reduced by the most suitable fraction parameter (percentage of precipitation). For the borehole locations, we varied precipitation fraction for each site and conducted multiple tests in order to find the most optimal subsurface parameters. Stratigraphy of the remaining soil classes was chosen based on estimates and values that were found in the literature. Table 1 contains the subsurface parameters for each main soil classes. Subsurface stratigraphy of the soil complexes was calculated as a mean of the single soil classes assuming the equal contribution of these classes to a cell, and in case when the freezing curve was between silt and sand, the latter was applied.
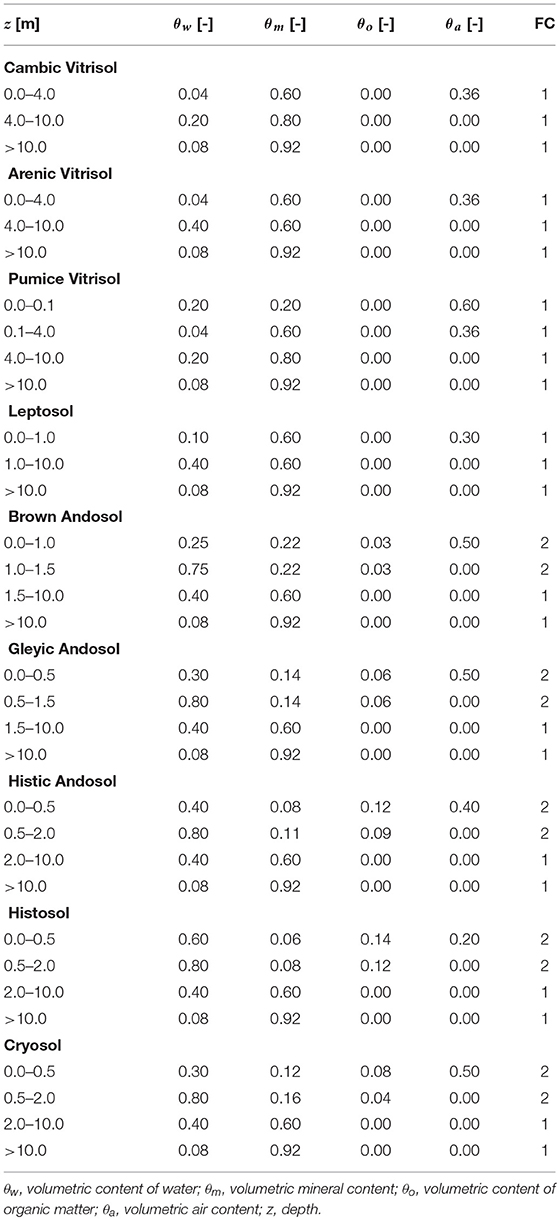
Table 1. Assumed depths of subsurface layers, along with volumetric fractions of the soil constituents and type of freeze curve (FC) for each layer: 1, sand and 2, silt.
Vitrisols and Leptosols
Vitrisols (“vitr” is Latin for “glass”) are soils of the poorly vegetated and barren land areas, i.e., “deserts” (e.g., Arnalds, 2000, 2015). In these areas, very dry conditions prevail owing to: (1) sand-dominated sediments with low water holding capacity and rapid hydraulic conductivity, (2) rapid evaporation during sunny spells in summer, when the dark surfaces heat up, and (3) limited infiltration during winter as a result of impermeable ice formation (Arnalds, 2015). Moreover, snow is removed by wind in the poorly vegetated areas. Hence, only one third to one half of the precipitation infiltrates into the ground (Arnalds, 2015). In absence of measurements for near-surface water contents, a value of 4% vol. water was chosen for Vitrisols, which yielded a satisfactory fit for the borehole locations. However, higher water contents are likely at least periodically, and the effect of near-surface water contents in Vitrisols should be investigated further. Sand fraction dominates in Vitrisols and organic content is low (<1% C) (Arnalds and Kimble, 2001; Arnalds, 2008, 2015). Therefore, the upper layer in Vitrisols was parametrized as sand with 40% porosity and no organic matter. On the soil map there are three subclasses of Vitrisols: (1) Cambic Vitrisols, shallow soils with cambic horizon, often underlain by glacial till, (2) Sandy (Arenic) Vitrisols, which are underlain by lava or till, (3) Pumice Vitrisols, with pumice layer in the top of the soil (Arnalds, 2015). Pumice has very high porosity, hence it was assumed that it could retain water in the pores (20% vol. water). This material can presumably lead to permafrost aggradation, because of its low thermal conductivity (<0.5 W m−1) (Farbrot, 2007). Leptosols encompass lava surfaces and scree slopes, where we assumed dry conditions in the near-surface layer (10% vol. water).
Histosols, Andosols, and Cryosols
Icelandic soils under vegetation have andic (volcanic) and/or histic (organic) properties (Arnalds, 2008). Depending on the rates of eolian and tephra deposition and drainage class, these soils are divided into: Histosols (>20% C average in the top 30 cm; wet), Histic Andosols (12–20% C average in the top 30 cm; poorly drained), Gleyic Andosols (<12% C average in the top 30 cm; poorly drained) and Brown Andosols (<12% C average in the top 30 cm; freely drained). In general, the further away from the active volcanic zones and sources of eolian materials, the wetter and more organic soil exists in the area (Arnalds, 2008). Soils of the wetlands are aquic soils with low organic carbon content (Gleyic Andosols and Histic Andosols) and true peat soils with higher carbon content (Histosols). Vegetated drylands are underlain by Brown Andosols. Histosols and Andosols have low bulk densities (<0.9 g cm−3) and contain large water amounts with a wilting point often >60% water per dry weight of soil (Arnalds, 2015). Cryosols are permafrost soils, related to Gleyic Andosols, and occurring mostly in palsa areas (Arnalds, 2004).
The two uppermost layers for Andosol, Histosol, and Cryosol classes in Table 1 represent the true soils (so-called solum; A and B soil horizons). Total depths of Andosols were rounded values from Óskarsson et al. (2004). Soil textures of Andosols are mostly silt loams (Arnalds, 2015), thus the freeze curve for these soils was parametrized as silt. We estimated the total porosity ϕ of Andosols and Histosols from the average bulk density ρb [g cm−3] and density of the soil particles ρsoil [g cm−3]:
(e.g., Hillel, 2004). Values of ρb for Andosols were also from Óskarsson et al. (2004), whereas ρsoil for Andosols were determined based on the empirical relationship between ρsoil and the organic carbon content C [–]:
as obtained by Poulenard et al. (2003). For Histosols, we assumed ρb of 0.3 g cm−3 (e.g., Arnalds, 2004) and ρsoil of 1.55 g cm−3, which is an average value for Histosols in Redding and Devito (2006). The calculated values of the porosity for Histosols and Andosols are in general high (>70%).
Volumetric water contents θw of Histosols and Andosols were computed from mass wetness w [–] in Arnalds (2015) and ρb, using the following equation:
(e.g., Hillel, 2004). The lower range of the field capacity (0.3 bar) was assumed the most likely representation of the yearly means of water content.
Volumetric organic content θo was determined based on values of average organic carbon content, mentioned in Arnalds (2004, 2015) and Óskarsson et al. (2004), and value for Cryosols was from Ottósson et al. (2016). These gravimetric values were converted to the gravimetric soil organic matter (SOMg [–]), assuming the conversion factor of 2, i.e., the organic matter contains 50% of organic carbon, following Pribyl (2010). θo was finally calculated from the gravimetric organic matter content, using the equation:
where ρo is the density of the organic matter, assumed 1.3 g cm−3 (Farouki, 1981).
Bedrock
To estimate the overall depth of unconsolidated sediments in each soil class, we used zonal statistics over the global depth to bedrock data set (Shangguan et al., 2016), and based on the results we assumed a uniform regolith depth of 10 m to be an adequate approximation for all the soil classes. The global depth to bedrock data set of Shangguan et al. (2016) has large uncertainties, and therefore it was not applied spatially. Porosity of Icelandic basalt decreases in general horizontally with the distance from the spreading zone and vertically with depth (Flóvenz and Saemundsson, 1993). However, owing to the unavailability of such measurements spatially for Iceland, constant bedrock porosity of 8% was assumed, which represents average porosity of basaltic lavas in Iceland (Stefánsson et al., 1997).
Model Initialization, Implementation, and Sensitivity
The model was initialized using the same procedure as described in Westermann et al. (2013). The first five hydrological years (1960–1964) were used to derive the initial temperature profile. Some uncertainties are connected with the initial temperature profile since, i.e., the derivation of the initial profile is based on the equilibrium permafrost model and TTOP is set as surface temperature. Nevertheless, the initial temperature profile impacts primarily the beginning period of the main run (Westermann et al., 2013).
The CryoGrid 2 was implemented for Iceland for the period 01.09.1959–31.12.2016 at a spatial grid resolution of 1 km. In the windy climate of Iceland, snow drift tends to preferentially accumulate snow in gullies, depressions and other small-scale irregularities in the landscape. The effect of this redistribution is clearly seen in satellite images and MODIS images from the spring where the open landscape becomes snow-free long before areas where drift snow tends to accumulate. To account for sub-grid snow variation we ran the model for three snow depth scenarios (50, 100, and 150% of modelled precipitation). The low-snow-depth scenario, which is intended to represent the open, unconfined terrain, was run by reducing the snow depth with an average percentage of precipitation calibrated for the boreholes, which are located at windy sites, i.e., 50% of precipitation. The second run, which represents areas where erosion and accumulation of snow roughly balance, was processed for an average precipitation for a grid cell (100% precipitation), whereas the third run with 150% precipitation is intended to represent areas with substantial accumulation of drift snow, such as relatively gentle leeside slopes, as well as creeks and depressions near the paths of rivers and brooks. Value of 150% precipitation was chosen in order to satisfy conservation of mass within each grid cell, i.e., snow removed from the areas represented by the 50% precipitation scenario is deposited in the areas represented by the 150% precipitation run.
Model sensitivity was conducted by changing the site-specific parameters for the borehole sites. In the model parameters, snow thermal conductivity is a function of snow density. In order to separate its contribution to the model uncertainty, it was tested independently of snow density and vice versa. The range of thermal conductivity for snow density of 300–450 kg m−3 mentioned in Sturm et al. (1997) was applied in the tests.
Validation Data Sets
Ground Temperature Measurements
The simulated ground temperatures were evaluated quantitatively for the borehole sites, located at the previously presumed lower limit of mountain permafrost in Iceland at ~900 m a.s.l. (Etzelmüller et al., 2007). The measurement accuracies vary between 0.01°C and 0.2°C. Boreholes are located on flat and open sites with almost no vegetation. More detailed information about the boreholes can be found in Farbrot et al. (2007b).
Inventories of Permafrost Landforms
Research about landforms indicative of permafrost in Iceland, can be grouped into two quite distinct branches, focusing on different geographical areas: (1) studies about landforms in the widespread mountain permafrost area, represented by active rock glaciers and stable ice-cored moraines, and (2) investigations about isolated and sporadic permafrost landforms, i.e., palsas.
Active rock glaciers are “the visible expression of steady-state creep of ice-supersaturated mountain permafrost bodies in unconsolidated materials” (Barsch, 1996). The distribution of rock glaciers in central north Iceland (Tröllaskagi) was inventoried by Lilleøren et al. (2013) and Guðmundsson (2000). The intact (active and inactive) rock-glaciers are dominated by moraine-derived landforms, caused by the extensive local glaciation in this region (Lilleøren et al., 2013). Stable ice-cored moraines have been defined as permafrost landform, based on discussions in e.g., Etzelmüller and Hagen (2005). The permafrost landform inventory (Lilleøren et al., 2013) indicated that 87 ice-cored moraines exist in the Tröllaskagi area. These landforms are situated at the same elevations as talus and moraine-derived rock glaciers, and therefore they can be used as reliable permafrost indicators in central north Iceland (Lilleøren et al., 2013).
Palsas are peaty mounds with a permafrost nucleus, composed of frozen peat and mineral soil, and dimensions of up to >100 m in width and >10 m in height (Seppälä and Kujala, 2009). In Iceland, palsas are mainly found in the central parts of the Highlands southeast and north of the Hofsjökull glacier, between Langjökull and Hofsjökull glaciers, and in the highlands of Eastern Iceland (Ottósson et al., 2016). The modelled permafrost extent was validated visually based on the extent of palsas as delineated on the map of habitat types in Iceland (scale 1:25 000) from the Icelandic Institute of Natural History (Ottósson et al., 2016). The map was prepared based on data collected after 1999. According to the map, palsas in Iceland cover an area of c. 93 km2.
Results
Model Validation
Validation of Snow Distribution and Depth
For most years and stations, the timing, and measured snow depth is similar to the simulated values in one of the precipitation scenarios. Four examples out of analysed 126 combinations of stations and years are shown in Figure 3. Over- and underestimation errors are apparent in some cases, where the deviations between measurements and simulations can be as large as 1 m.
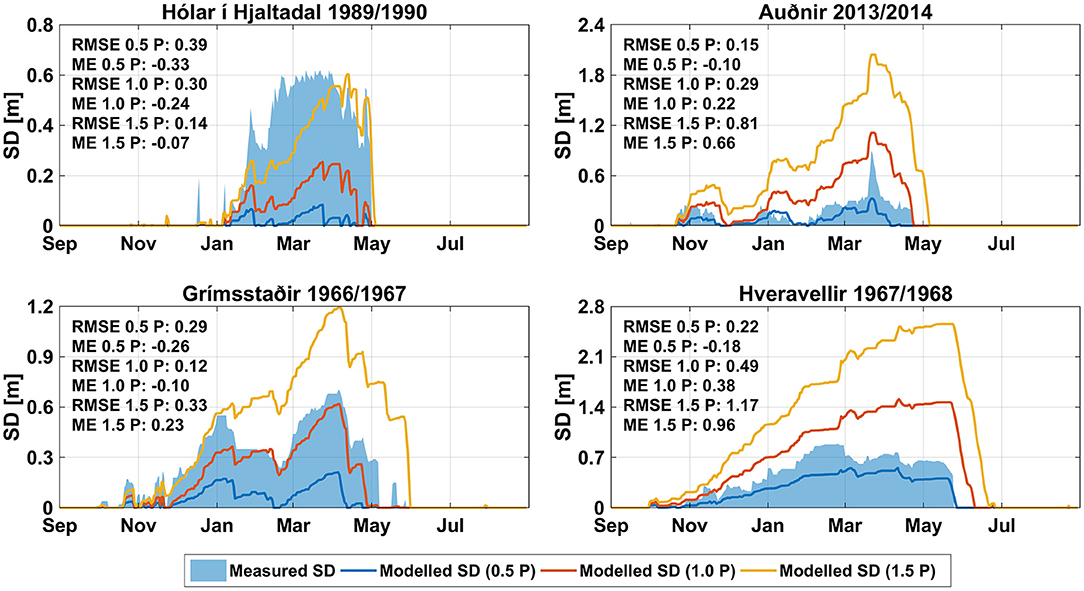
Figure 3. Examples of measured and modelled daily SD (snow depth) for the three precipitation scenarios: 0.5P-50% precipitation, 1.0P-100% precipitation, 1.5P-150% precipitation. SD was obtained using the seNorge SWE sub-model (Saloranta, 2012) and snow density of 350 kg m−3. RMSE-root mean square error, ME-mean error.
The temporal pattern of the modelled snow extent agrees well with the observed snow extent (Figure 4; Supplementary Video 1). Nevertheless, the SWE (seNorge) model has sometimes demonstrated a tendency to: (1) overestimate SWE in west Iceland in April–May, (2) underestimate SWE in eastern Iceland in April–June, and (3) underestimate SWE in the Tröllaskagi peninsula and its vicinity, along with north-western Iceland in June–July.
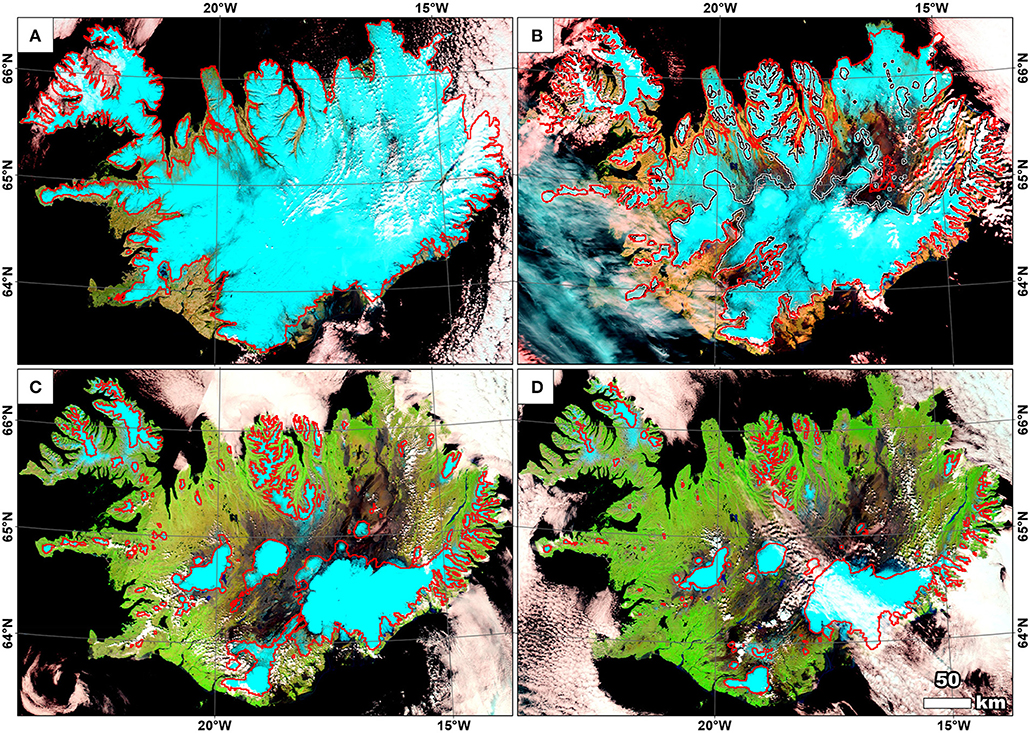
Figure 4. Validation of snow extent in the year 2000: (A) 12.04.2000; (B). Red line: 19.05.2000, Black line with a white border: 26.05.2000; (C) 23.06.2000; (D) 10.07.2000. Backgrounds: MODIS Aqua/Terra FCCs 721 from the same dates as the red lines. Image courtesy of NASA Worldview. For days when there was large disagreement between observed and modelled snow extent (red lines), a black line with a white border was added for a week before or after if the correspondence between modelled and observed snow extent improved.
Permafrost Temperatures
Comparison of the modelled mean annual ground temperature at depths of 1 and 2 m with the ground temperature measurements is shown in Figure 5. We use the results from the 50% precipitation run, which is the closest precipitation fraction to the site-specific precipitation fractions used in the model calibration. The results indicate an RMSE of maximum 0.54°C and a mean error of maximum 0.52°C at both 1 and 2 m depths for all the boreholes.
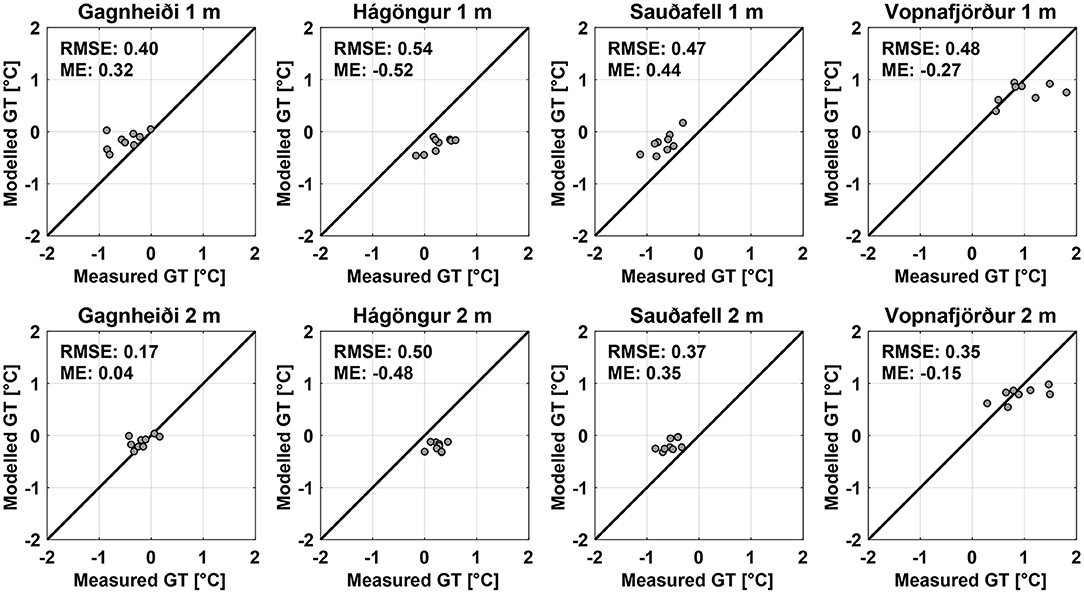
Figure 5. Yearly validation of the modelled ground temperature (GT) at 1 and 2 m depth for the borehole locations. In these simulations, precipitation fraction of 50% was used. RMSE-root mean square error, ME-mean error.
Permafrost Landforms
Figure 6 illustrates visual validation of the modelled permafrost extent and palsa distribution in Iceland. In general, there is a good agreement between the reproduced permafrost and palsa occurrence both in west-central and eastern Iceland. However, some palsa areas south and west of Hofsjökull are not modelled as permafrost. In these regions, however, palsas and peat plateaus are often smaller than a 1-km2 grid cell.
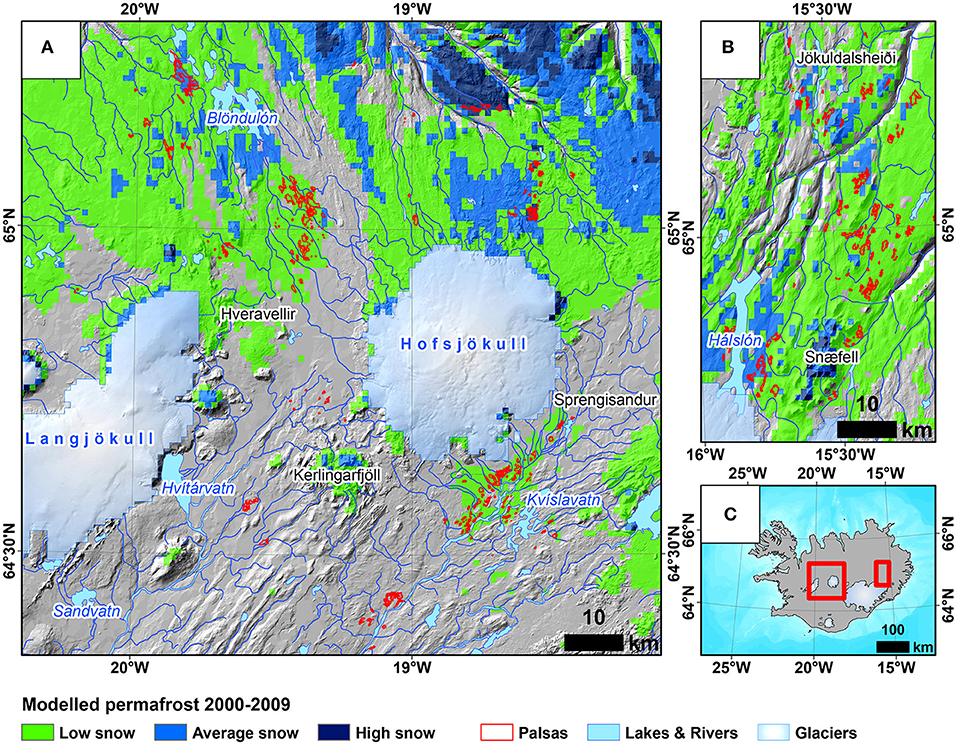
Figure 6. Validation of the permafrost model simulations for the period 2000–2009 based on the palsa distribution in (A) west-central Iceland, (B) eastern Iceland. (C) Inset map showing the location of the west-central (A) and eastern (B) palsa areas. Modelled permafrost based on TTOP is shown (see Figure 9 for details). Palsa distribution data from the Icelandic Institute of Natural History. Map data from NLSI.
Most of the active glacier- and talus-derived rock glaciers, together with the ice-cored moraines are reproduced as permafrost areas (Figure 7); however, some of the landforms in the northern Tröllaskagi, especially ice-cored moraines, are not within the modelled permafrost cells. The comparison indicates that many of the active permafrost landforms are related to areas where permafrost may form even when 150% precipitation is applied in the CryoGrid 2 model, which results from the relatively cold climate in the Tröllaskagi area.
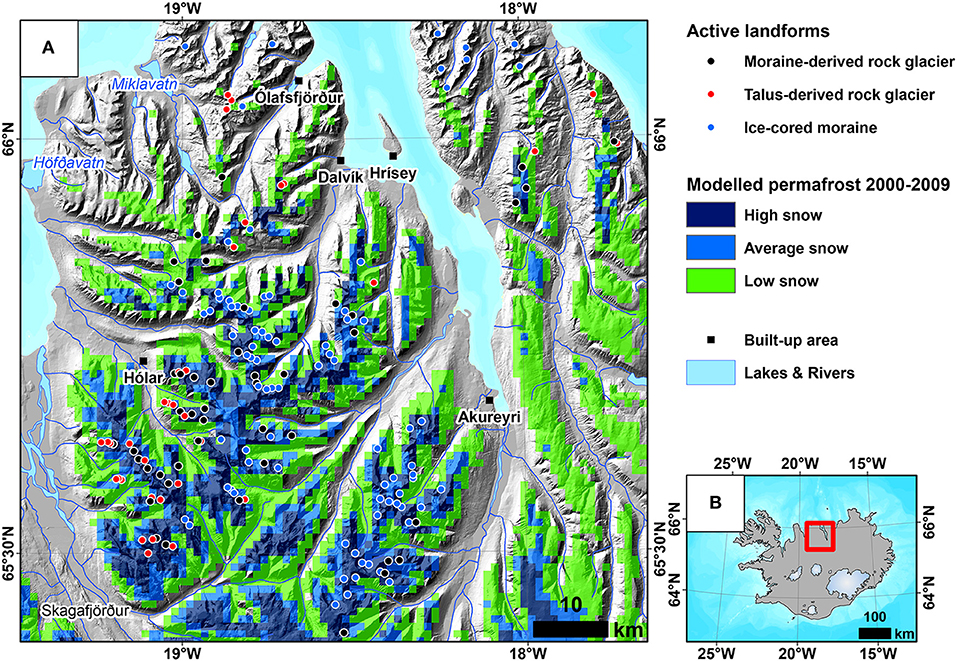
Figure 7. (A) Outcome of the permafrost model simulations for the period 2000–2009 in comparison to the distribution of the active permafrost landforms, such as active moraine- and talus-derived rock glaciers, along with ice-cored moraines, as inventoried by Lilleøren et al. (2013). (B) Inset map. Modelled permafrost based on TTOP is shown (see Figure 9 for details). Map data from NLSI.
Permafrost Distribution and Temperatures
According to the 50% precipitation run, permafrost occurs in large parts of northern and central Iceland, such as Norður-Múlasýsla in the Eastern Region, together with the Northwestern and Northeastern Regions of Iceland (Figure 8; Supplementary Videos 2–4). In the run with the average precipitation, permafrost extent is substantially reduced. Permafrost areas are modelled in the Tröllaskagi peninsula and the adjacent southern areas, the western part of Norður-Múlasýsla, and regions north of Langjökull and Vatnajökull. The last run with 150% precipitation shows the most limited permafrost occurrence in Iceland, primarily in the Tröllaskagi peninsula and other high-mountain areas on the island. According to the runs, the coldest permafrost in Iceland can be found in the Tröllaskagi peninsula and its vicinity. The modelled ground temperatures increased in this region between the decades of the 1980s and 2000s (Figure 8).
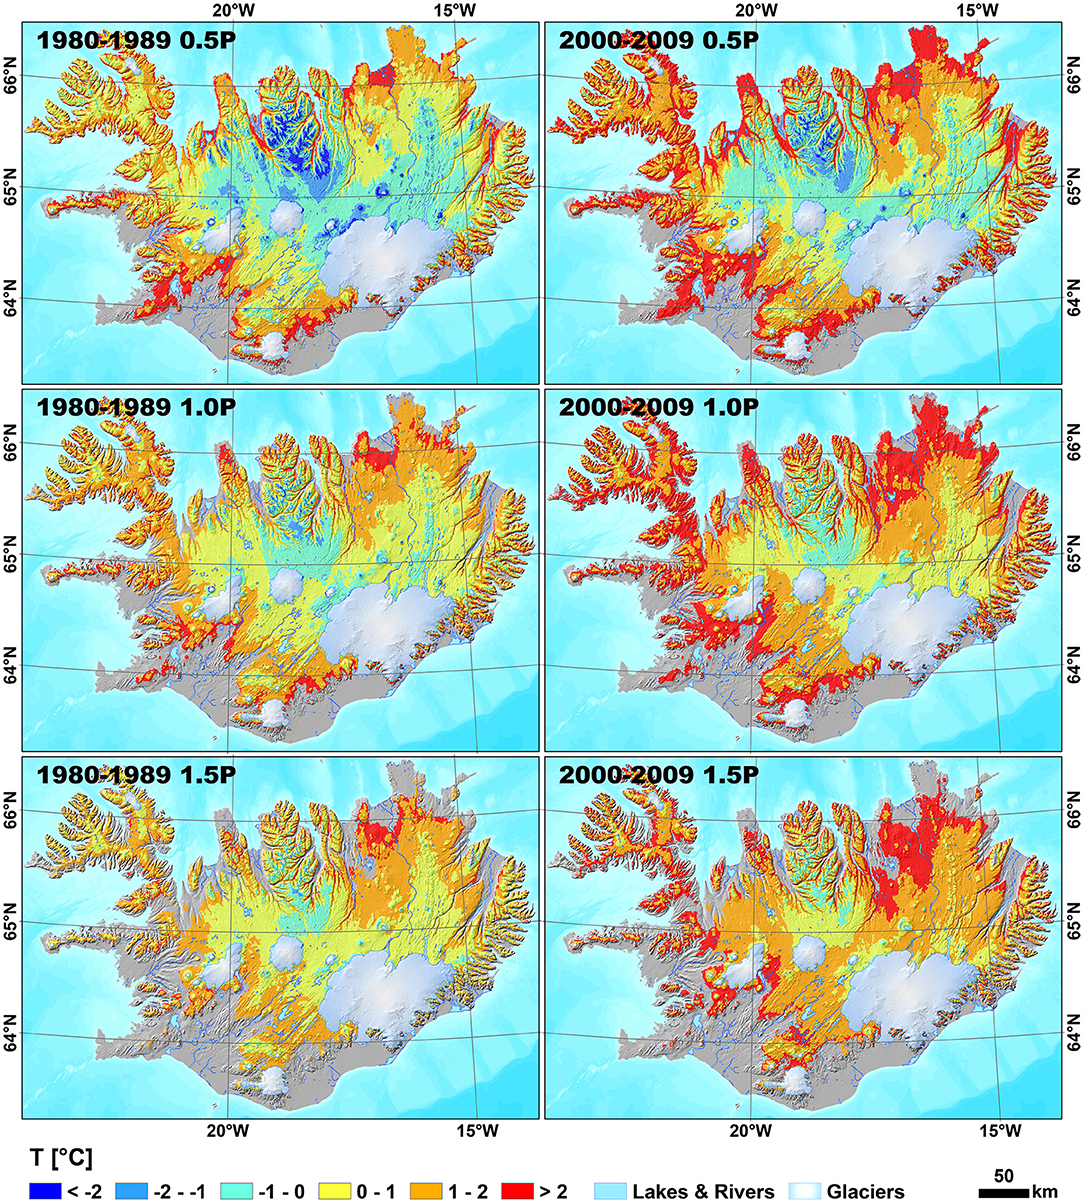
Figure 8. Distribution of the simulated average ground temperature (T) at 2 m depth in the periods 1980–1989 and 2000–2009 for the three precipitation cases: 0.5P-50% precipitation, 1.0P-100% precipitation, 1.5P-150% precipitation. Permafrost cells are displayed in blue hues. Map data from NLSI.
Mean temperature at the top of permafrost (TTOP) was calculated for every snow depth case (Supplementary Videos 5–7) and based on the areas with TTOP at or below 0°C we present modelled permafrost extent for the three snow depth cases in Figure 9 and Supplementary Video 8. The model outcome shows the largest permafrost extent in the period 1980–1989 in the 50 and 100% precipitation runs and in the 1970–1979 in the 150% precipitation run (Figure 9), presumably as a result of the climate deterioration in Iceland until 1980s (e.g., Hanna et al., 2004). In these periods permafrost aggraded up to depths of 1–5 m. These findings are in accordance with the observations by Priesnitz and Schunke (1978) between 1970 and 1976 who expected permafrost aggradation in palsa areas in Iceland.
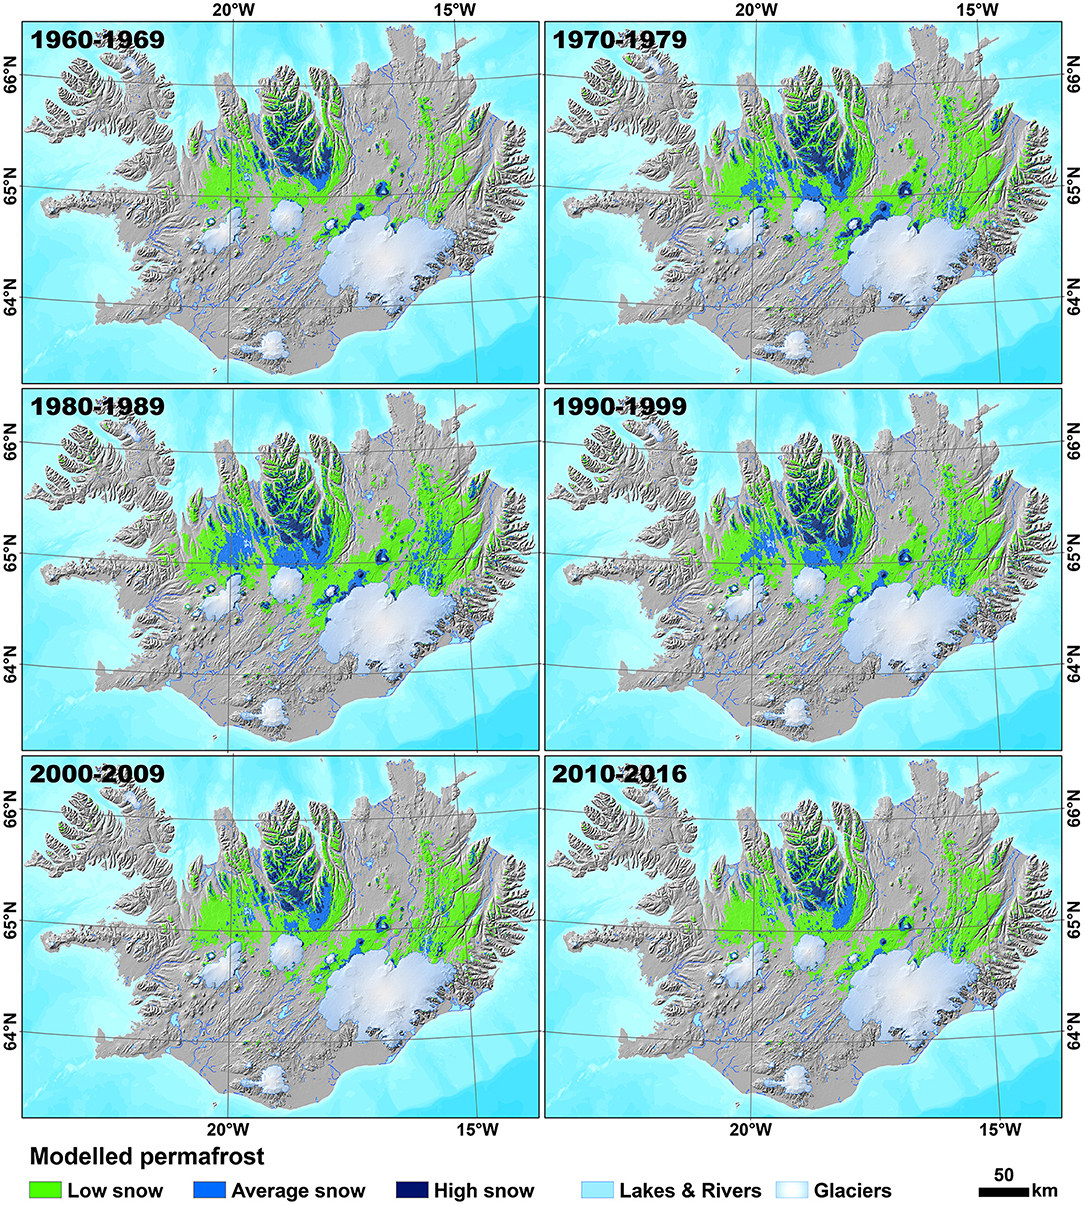
Figure 9. Spatio-temporal evolution of the modelled permafrost extent based on TTOP at or below 0°C in 10 consecutive years for the three snow depth scenarios: “Low snow” represents permafrost reproduced in 50% precipitation scenario, “Average snow” represents permafrost reproduced in 50 and 100% precipitation scenarios, and “High snow” represents permafrost reproduced in all precipitation scenarios. Map data from NLSI.
The 50% precipitation run indicates ~3–5 and 8–15 times more cells with permafrost in comparison to the 100 and 150% precipitation runs, respectively, within the same decades (Table 2). The difference in the number of cells with modelled permafrost is less pronounced for 100 and 150% precipitation cases, with ~2–3 times more cells in the 100% precipitation run. The number of modelled permafrost cells decreases in the subsequent time periods, with the lowest number of cells with permafrost in the period 2010–2016, when it is reduced by 34, 56, and 49% for the 50, 100, and 150% precipitation runs, respectively, in comparison to the period 1980–1989 (Table 2).
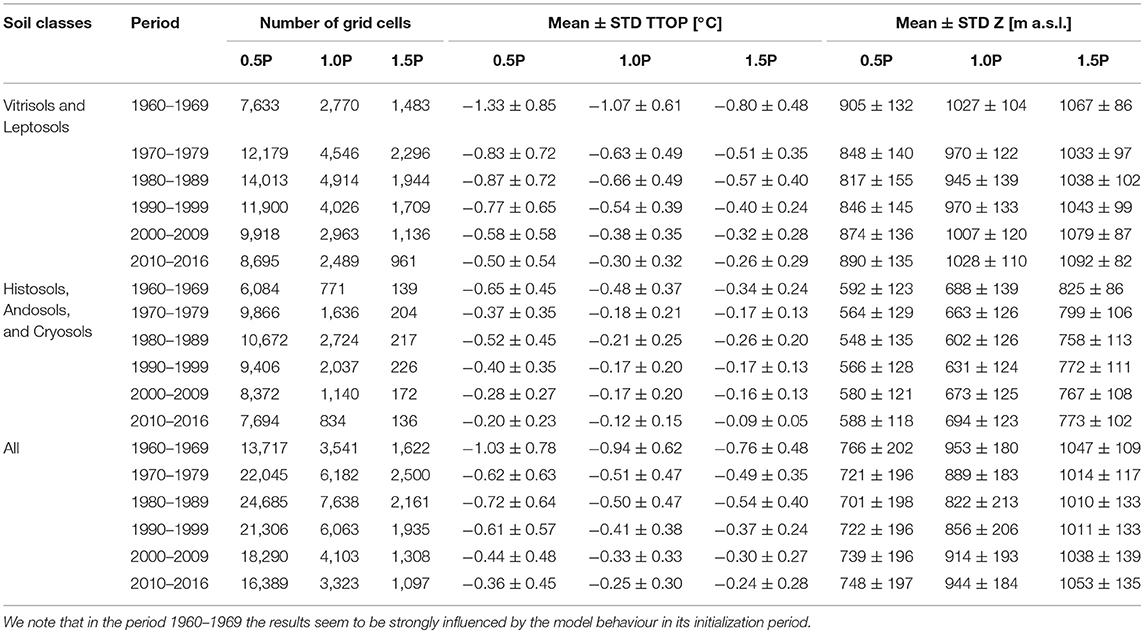
Table 2. Total number of cells with temperature at the top of permafrost (TTOP) <0°C for every precipitation case, average TTOP and its standard deviation (STD), together with average elevation (Z) and its standard deviation of cells with TTOP < 0°C.
Assuming equal contribution of each precipitation scenario to a grid cell, the estimated permafrost area for the period 1980–1989 is c. 11 495 km2 (~11% of Iceland's land area), and c. 6 936 km2 for the period 2010–2016 (~7% of Iceland's land area). This implies a reduction of the permafrost area of c. 40% in Iceland between these two periods. We note, however, that the snow distributions within grid cells are unknown, and these numbers are only very rough estimates of the permafrost area in Iceland.
Table 2 presents the statistics for the bare, vegetated and all soil types, with the total number of cells modelled as permafrost, as well as average and standard deviation of TTOP and average elevation for the same cells. The reproduced permafrost underlies predominantly Vitrisols and Leptosols, with ~1,000–3,500 more cells indicating permafrost than for Histosols, Andosols, and Cryosols for all the runs and periods. This is probably related to the fact that the bare soil classes tend to occur at higher elevation (mean c. 580 m a.s.l.) than the vegetated classes (mean c. 300 m a.s.l.). Mean elevation of the permafrost area for the two classes also varies accordingly, where permafrost cells with Vitrisols and Leptosols have ~250–350 m higher mean elevation than cells with the vegetated soil types. The modelled average temperatures at the top of permafrost are relatively high, with all the values above ~−0.9°C after the first 10 years of simulations.
Figure 10 shows the modelled permafrost distribution at 10 m depth, where the number of cells that show permafrost is substantially reduced in comparison to the permafrost reproduced at 2 m depth (Figure 8) or TTOP (Figure 9). Thus, the CryoGrid 2 model indicates mostly shallow permafrost in Iceland, which is likely a consequence of the high geothermal heat flux and generally warm permafrost, along with probably too little water content for the soil/bedrock. Only minor variations in reproduced permafrost can be observed through time at 10 m depth (Figure 10). We note, however, that the long-term climate signals, e.g., the cooling during the Little Ice Age, are not captured in our simulations; hence, the model likely overestimates deep ground temperatures.
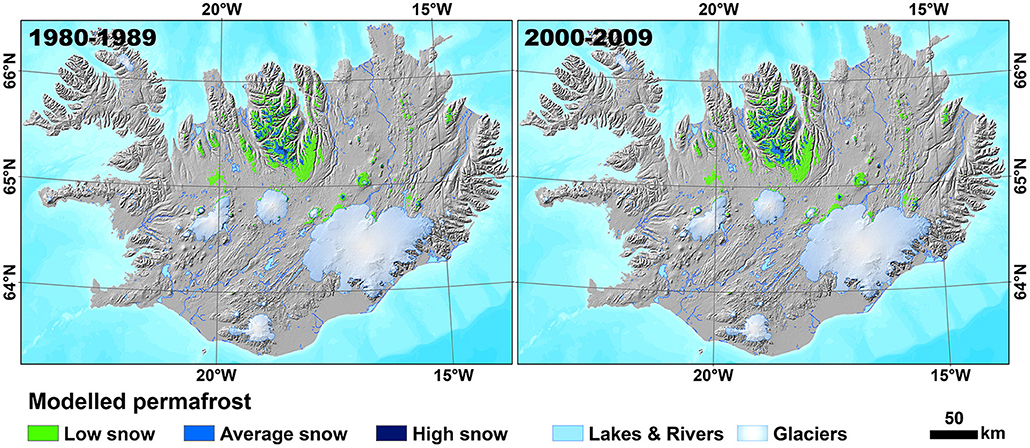
Figure 10. Permafrost extent over the periods 1980–1989 and 2000–2009 based on cells that indicated ground temperature at 10 m depth at or below 0°C in 10 consecutive years for the three snow depth scenarios: “Low snow” represents permafrost reproduced in 50% precipitation scenario, “Average snow” represents permafrost reproduced in 50 and 100% precipitation scenarios, and “High snow” represents permafrost reproduced in all precipitation scenarios. Results for the other periods reveal similar permafrost extent at this depth. Map data from NLSI.
Lower limits of permafrost (LLP) in the northern part of Iceland along a chosen transect are illustrated in Figure 11. The model produces an increase of the LLP from north to south, where absolute values depend on the precipitation assumptions (Figure 11). They increase from around 600–900 m in the north to around 800–1,000 m a.s.l. in the south.
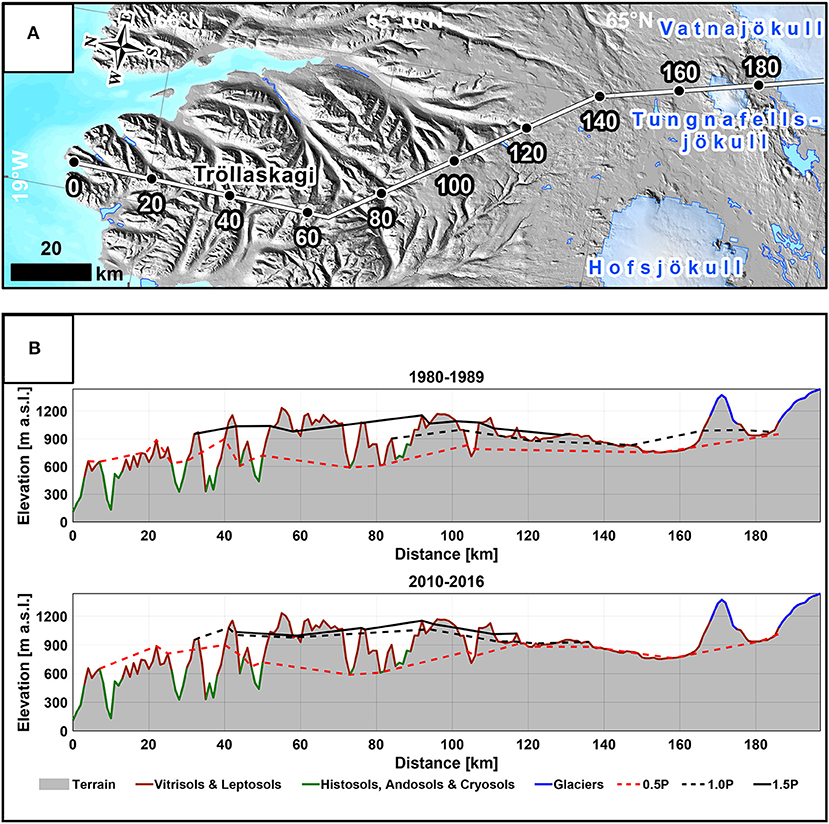
Figure 11. (A) Transect from the northern part of Tröllaskagi to the north of Vatnajökull, similar to the transect in Etzelmüller et al. (2007). Numbers indicate distance along the transect in km. Map data from NLSI. (B) Lower limits of permafrost along the transect shown in A for the three precipitation scenarios: 0.5P-50% precipitation, 1.0P-100% precipitation, 1.5P-150% precipitation, in the periods 1980–1989 and 2010–2016.
Sensitivity Tests for Borehole Locations
Sensitivity of the model to uncertainties in the thermal properties of snow and subsurface for the borehole sites is shown in Table 3. Volumetric mineral and water content in the middle layer, depth to bedrock, and bedrock porosity have minor importance (≤0.1°C) for the near-surface ground temperatures. Increase in mineral content in the upper layer or thermal conductivity of the mineral fraction allows for greater heat penetration in summer, resulting in higher mean ground temperatures, even up to 0.3°C higher than the default parameters. Higher water contents lead to longer zero curtain effect, leading to ground temperature being modelled up to 1.3°C warmer for 30% vol. water in comparison to 1% vol. water. Snow density influences both snow depth and specific effective volumetric heat capacity of snow, and its increase yields up to 0.8°C colder ground temperatures. Larger snow thermal conductivity causes more effective heat loss during winter, which results in much lower ground temperatures. The differences in the modelled average ground temperatures between the runs with the lowest and highest values of the thermal conductivity of snow are ~2°C. The impact of the precipitation fraction on the modelled ground temperatures is somehow more complicated, because apart from snow depth, also snow timing is involved. Ground temperatures often increase for larger precipitation fraction, e.g., at Sauðafell and Hágöngur; however, prolonged snow cover leads sometimes to colder ground temperature, e.g., at Gagnheiði and Vopnafjörður when comparing 100 and 150% precipitation cases. The deviations in the simulated ground temperature between the lowest and highest precipitation runs are up to ~1.6°C. The sensitivity tests indicate thus the following tested parameters to be the major factors (sorted by their importance) influencing the modelled ground temperature: (1) thermal conductivity of the snow, (2) precipitation fraction, (3) water content in the upper layer, (4) snow density, mineral content in the upper layer and thermal conductivity of the mineral fraction.
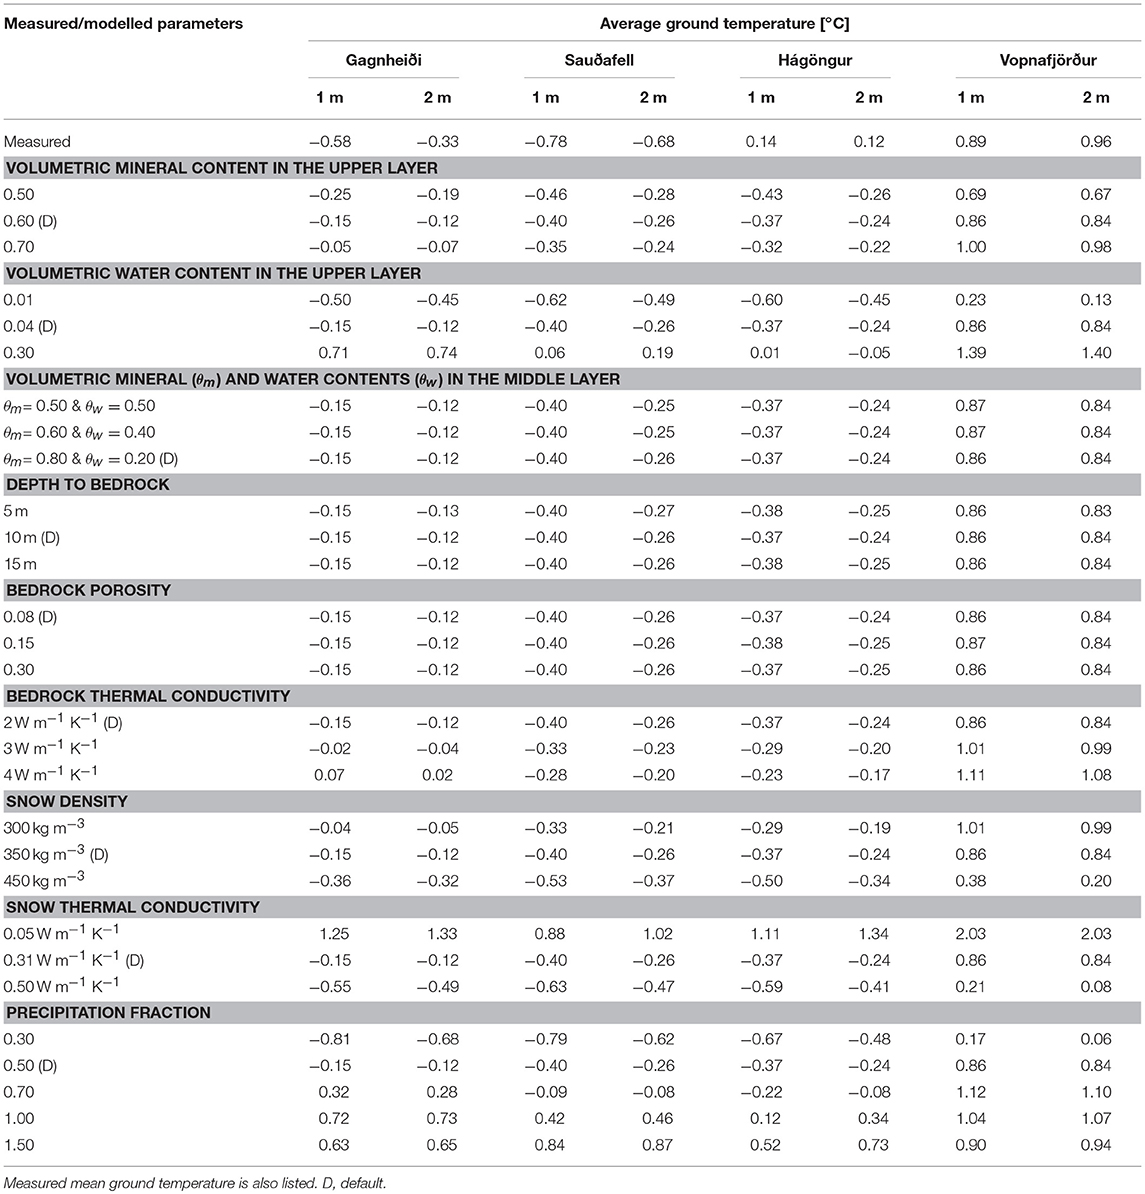
Table 3. Sensitivity of the modelled mean ground temperature at depths of 1 and 2 m to uncertainties in the chosen subsurface and snow parameters in the period 1.09.2004–31.08.2006.
Discussion
Uncertainties and Limitations
Spatial modelling over larger areas and over longer periods always will lead to uncertainties related to the chosen spatial and temporal resolution, affecting forcing data and thus the results. The chosen 1 km2 resolution is fine in relation to most climate models; however, it is too coarse to address processes related to: (1) topography (e.g., detailed assessment of permafrost in slopes, e.g., Noetzli et al., 2007; Magnin et al., 2017); (2) convective heat transfer in volcanic rift zones (Flóvenz and Saemundsson, 1993), (3) convective heat transfer in block ground material (Juliussen and Humlum, 2008; Wicky and Hauck, 2017) or (4) temporal and spatial variations in soil water content (Marmy et al., 2013; Scherler et al., 2013). Some uncertainties of this study are, however, related to site-specific conditions, problems with input data sets or model limitations, and are therefore discussed in a closer context. In general, probability of permafrost occurrence is relatively high in grid cells where permafrost is modelled in the scenario with the deepest snow cover (150% precipitation fraction), especially because less than average snow depths (<100% precipitation fraction in our study) likely dominate in mountain areas (e.g., Gisnås et al., 2014).
Boundary Conditions
The CryoGrid 2 model was forced with a weekly-averaged data set of gridded daily temperature in Iceland derived by interpolating data from sparse stations, which are mainly located along the coast (Crochet and Jóhannesson, 2011). The quality of the data set is thus best at lower elevations where the stations are denser; however, the establishment of the automatic stations in the early 1990s and deployment of stations to higher elevations in the 2000s improved the data set. The gridded data set captures spatial air temperature variations exclusively due to elevation and neglects other factors such as e.g., distance to the coast or temperature inversions (Crochet and Jóhannesson, 2011). Apart from the effect of elevation, the mean summer temperature increases towards the interior of Iceland, whereas the mean winter temperature decreases with increasing distance to the shore (Einarsson, 1984).
Precipitation and Snow Depth
Snow depth was derived from a degree–day SWE model using two precipitation data sets and constant snow density. Between 9/1959 and 12/1979, we used precipitation data set derived from the linear theory model (LT-model) of orographic precipitation described in Crochet and Jóhannesson (2011). Evaluation of daily precipitation simulated by LT-model indicated that this model has flaws related to a misidentification of the wet and dry regions, errors in the model parameters, and large-scale wind field, yielding over- or underestimated daily precipitation, especially severe on the windward side of the mountains (Crochet et al., 2007). In 1980–2016, the SWE model was forced with precipitation data set created using the HARMONIE–AROME model. Validation showed that the model produced more accurate precipitation estimates than the LT-model (Nawri et al., 2017). However, the HARMONIE–AROME model tended to underestimate daily precipitation during winter (DJF) due to underestimation of extreme precipitation events and showed a frequent overestimation of daily precipitation (Nawri et al., 2017). Furthermore, the HARMONIE–AROME model has a resolution of 2.5 km, hence it may fail to predict weather extremes smaller than that scale, and precipitation was linearly interpolated to a 1 km grid, introducing possible errors. The inconsistencies between the two data sets (Supplementary Figure 1) could have affected the modelled ground temperatures during the 1980s and possibly 1990s.
Snow depth data was obtained from a degree-day model using spatially and temporally constant parameters, except for degree–day melt and refreezing factors, which varied seasonally. The employed single-layer snow scheme is simple, and thus its ability to account for internal snow processes and the energy balance components is limited. The more physically-based approaches to snow modelling with multiple snow layers would likely yield more accurate snow-depth estimates (e.g., the detailed snowpack scheme Crocus; Vionnet et al., 2012); however, they are often impractical. The merits of the applied algorithm are therefore its simplicity, fast runtime and low data requirements, with the disadvantages of errors due to the simple formulation (e.g., Hock, 2003; Kokkonen et al., 2006). One major factor is that we applied a constant snow density of 350 kg m−3, even though snow densities of up to 400–450 kg m−3 were measured in north Iceland for a stable mid-winter snow cover (Haraldsdóttir et al., 2001), and varies elsewhere (Sigurðsson and Jóhannesson, 2014). The seNorge model includes also a second submodule that yields snow depth and snowpack density (Saloranta, 2012). However, this submodule was not applied in this study since it considers snow compaction only as a result of the snow weight, overlooking snow compaction resulting from wind drift, which is probably the main cause for snow compaction in environments like Iceland. The snow depth measurements conducted at permafrost monitoring sites in southern Norway (Westermann et al., 2013) showed that snow density did not increase significantly from the snowpack surface to the snowpack base, likely because the wind compaction dominates. Similarly, in case of Iceland, the existing measurements of snow density do not necessarily indicate an increase towards the snowpack bottom (Sigurðsson and Jóhannesson, 2014). Other processes, such as e.g., sublimation were neglected in the snow model. It is emphasised earlier that the employment of a more sophisticated snow model does not guarantee better results in Iceland, since the main limitation is the lack of accurate snow observations in this region (Haraldsdóttir et al., 2001).
Furthermore, snow redistribution by wind is difficult to account for in a regional model, since there is a substantial sub-grid variability in snow depths within a 1-km spatial grid. This issue has been addressed earlier in a more simple modelling approach using statistical distributions of snow depths within grid cells, so the ensemble approach with many model realizations could be implemented (Westermann et al., 2015b; Gisnås et al., 2017). Such procedures could potentially be implemented in a transient permafrost model. The validation data would, however, require the measurements of the snow depths within grid cells, and such data is unavailable for Iceland. The representativity of the chosen precipitation factors for a grid cell is thus challenging to quantify without the mentioned data. Therefore, only a simple weighting using factors of 1/3 for each scenario was applied to calculate the total permafrost area in Iceland.
Model Parameters
Thermal properties of subsurface materials were calculated according to volumetric fractions of soil constituents assigned based on the soil map of Iceland (Arnalds, 2008, 2015). It is obvious that the map is a representation of major soil types in Iceland, and soil or sediment heterogeneity on a sub-pixel scale is neglected, along with the lack of detailed knowledge of sediment thicknesses. Surficial geologic maps are often used in transient permafrost models (e.g., Jafarov et al., 2012; Westermann et al., 2013) to specify the subsurface layers, which is a more suitable representation of the variation in stratigraphy of the deeper ground layers. Unfortunately, no geomorphological map of Iceland has been published, hence only the soil map could be employed. The sensitivity test also showed that variations in ground properties are less important than other factors, e.g., in relation to snow. There are also some uncertainties connected with the bedrock porosity, depth to bedrock, and bedrock conductivity. We used constant values for thermal conductivity and porosity of the basaltic rock (Pálmason et al., 1979; Flóvenz and Saemundsson, 1993; Hjartarson, 2015), knowing that the influence of bedrock porosity and depth to bedrock has only marginal impact on the 1 and 2 m ground temperatures for the borehole locations. Nevertheless, these variables have presumably more pronounced effect on the deeper ground temperatures or within areas of exposed bedrock. There is no typical bedrock class in the classes of the ground stratigraphy used in this study.
Small topographic features and vegetation both influence snow redistribution, acting as snow traps (Pomeroy et al., 2006; Jafarov et al., 2018). The role of vegetation is, however, limited in Iceland, since areas at higher elevations are commonly barren or half vegetated (Ottósson et al., 2016). The heterogeneous snow cover affect furthermore the soil moisture and thus the ground thermal regime. The model simulations could be further improved by running multiple model realizations taking into consideration sub-grid variability in the surface topography and the subsurface stratigraphy, as proposed by Westermann et al. (2017).
Model Performance
Validation
The validation indicated quite good results with maximum RMSE of 0.54°C and a mean error of maximum 0.52°C for all the borehole locations. The model performance is similar to the performance reported in other studies employing spatially distributed transient permafrost models (Jafarov et al., 2012; Westermann et al., 2013, 2017). Most palsas are modelled as permafrost areas according to the CryoGrid 2 runs (Figure 6); however, the consistency between the modelled permafrost distribution and palsas does not necessarily indicate that the palsa areas are reproduced as permafrost related specifically to these landforms. The uncertainties are mainly connected with the chosen ground stratigraphy and the precipitation fractions, with the latter having presumably the largest influence. Previous investigations of palsas in Iceland indicate that their organic content is relatively low due to the accumulation of wind-transported sediments (Saemundsson et al., 2012) and peat cover is generally thin (Friedman et al., 1971). Thermal offsets might, therefore, not be the most crucial factor for palsa formation in Iceland. Snow removal by wind from the tops of palsas has been previously recognized as an important factor for growth and maintenance of palsas (e.g., Seppälä, 1982). It is uncertain whether the 50% precipitation run is sufficient to account for the limited snow cover in these areas. The precipitation fraction should be probably further reduced to properly reproduce palsa areas. However, short and relatively cold summers might also contribute to the existence of palsas in Iceland (Friedman et al., 1971; Saemundsson et al., 2012). Furthermore, we note that there is a scale mismatch between 1-km2 model cells and the landforms that are local features, usually covering an area of <1 km2. Nevertheless, we emphasize that it is feasible to reproduce palsa permafrost even in a simple one-dimensional model at 1 km2 scale, provided that the ground stratigraphy and snow forcing are tuned specifically for these landforms. Such approach has limitations, particularly it cannot yield a total area of permafrost in palsas or capture the true processes and factors for thermal stability of palsas that are more complex (Aas et al., 2019;Martin et al., 2019).
Active rock glaciers are reliable permafrost indicators (Barsch, 1996; Farbrot et al., 2007a; Berthling, 2011; Lilleøren et al., 2013). Comparison of the modelled permafrost extent with the distribution of the active permafrost landforms in the Tröllaskagi peninsula showed good agreement (Figure 7); nevertheless, some landforms in the north were outside of the modelled permafrost area. The disagreement may be explained by the location of these landforms at the northern-facing slopes receiving less direct solar radiation and having lower surface temperature than the gridded temperature used in the permafrost model. Lilleøren et al. (2013) mentions also that the active permafrost-related landforms in the northern part of Tröllaskagi (~400 m a.s.l.) occur at lower elevation than the landforms in the south (above 800–900 m a.s.l.), where aspect is recognized as one of the possible factors for the permafrost occurrence in the northern area. It is, however, also possible that the modelling period is too short to reproduce permafrost at lower elevations close to the coast and should be extended to e.g., the Little Ice Age, when the climate was colder.
Therefore, in general we find that the model results satisfactorily describe the distribution and thermal regime of permafrost in Iceland, given the shortcomings related to the 1 km2 resolution. Permafrost extent was larger than permafrost reproduced in Etzelmüller et al. (2007). The model reproduced also the general characteristics of permafrost in Iceland, i.e., it indicated warm and mostly shallow permafrost, which is in accordance with previous conclusions by Farbrot et al. (2007b) on the dynamics of permafrost in Iceland. The Tröllaskagi area is the area with the highest likelihood of widespread permafrost in Iceland according to the runs, where permafrost was reproduced even in the snow-rich scenario. Permafrost was almost absent in south Iceland, with exception of e.g., high mountain ridges near Hekla and Torfajökull. Permafrost occurrence at Hekla has been previously reported by Farbrot (2007) and Kellerer-Pirklbauer et al. (2007), and CryoGrid 2 indicates permafrost in this area.
The multiple model realizations for the various snow depths within grid cells in the equilibrium permafrost models (e.g., Gisnås et al., 2017) allowed for the calculation of permafrost percentage and classification of each grid cell into a permafrost zone, such as continuous, discontinuous and sporadic permafrost. This required, however, e.g., 100 model realizations per grid cell and additional assumptions about the statistical snow distribution within grid cells. In our study, the number of runs per grid cell had to be reduced because of the large computational requirements in a transient permafrost model. The interpretation of our results with respect to the classic permafrost zonations is thus more difficult. Study on small-scale snow variability of Gisnås et al. (2014) was conducted in similar permafrost environments of southern Norway, and demonstrated that most of the snow heights within 1 km x 1 km area were less than average snow depth. The 100% precipitation run in our study corresponds to the average snow depth, hence the halved-precipitation run could be considered as the most frequent within a 1-km2 grid cell. Furthermore, based on the right-skewed distributions of snow depth in wind-exposed mountains (See e.g., Gisnås et al., 2014, 2016), the frequency is lower for the average snow depth (100% precipitation run) and lowest for the 150% precipitation run. Therefore, most of the reproduced permafrost cells in Iceland is likely sporadic to maybe even discontinuous. Permafrost cells modelled in the 150% precipitation run can possibly represent the continuous permafrost zone.
Model Application
Regional permafrost models can have wide application and help discussions of topics within basic and applied science. Three examples are given below:
(1) Ground temperature is an important factor for understanding geomorphological processes, as emphasized in e.g., Berthling and Etzelmüller (2011) for periglacial geomorphology, or Etzelmüller and Hagen (2005), and Haeberli (2005) for the interaction of permafrost and glaciers.
(2) In steep mountain areas, permafrost influences slope stability (e.g., Gruber and Haeberli, 2007; Krautblatter et al., 2012). Even if the model is not designed to model high topographic heterogeneity, the transient changes in mountain areas can be resolved. In three landslides that occurred at in Iceland, ice-cemented blocks were observed within the deposits (Sæmundsson et al., 2014, 2018). Permafrost was still present at the time of the landslides, since the landslide deposits that were observed contained ice at the time of the slides. For instance, at Móafellshyrna site, blocks with pore-filling ice of size up to 12 m wide and 10 m high were found (Sæmundsson et al., 2018). To test the evolution of the ground thermal regime at the landslide sites we run our model using site-specific parameters (Figure 12). All the locations have or had permafrost according to the CryoGrid 2 runs; nevertheless, the Árnesfjall site had only very shallow permafrost of ~1 m until 2000. Since the slopes of the source areas face north, the amount of direct solar radiation they receive is likely small, and it should have probably been accounted for. Furthermore, the modelling period might be too short to reproduce permafrost at Árnesfjall. The modelled ground temperatures illustrated in Figure 12 show substantial overall ground temperature warming for the source locations of the landslides, especially since 2000–2005. At Torfufell and Móafellshyrna, the CryoGrid 2 model indicates a slight decrease in the depth of permafrost base around the dates of these landslides, whereas maximum thaw depths are relatively stable throughout the entire modelling period. Considering the model uncertainties, the decrease in the depth of permafrost base could be even more severe. Sæmundsson et al. (2018) argue that the most likely triggering factor of the slide at Móafellshyrna was thawing of the deeper permafrost, implying that the longer-term (decade-scale) ground temperature warming was responsible for this event. The authors additionally discussed the base-up permafrost thawing as a probable reason for this slide, contributing among other things to lubrication of the base of the colluvium and lowering cohesion. Three-dimensional effects could also play a role, e.g., warming of bedrock at the southern side and propagation of the thermal wave to the northern side, together with warmer water input from the southern side (Sæmundsson et al., 2018). The CryoGrid 2 simulations confirm the previous interpretations of the landslide at Móafellshyrna, both the long-term warming of permafrost and the permafrost degradation at the bottom.
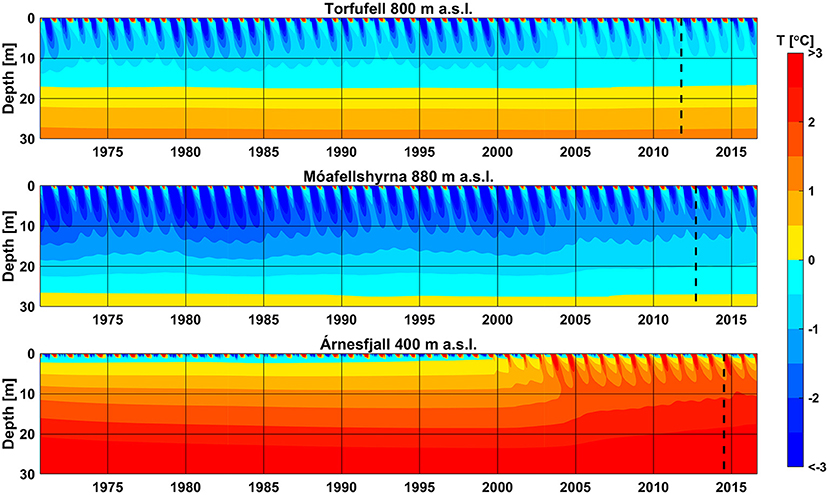
Figure 12. Evolution of ground temperature for the source areas of the landslides with ice-cemented debris in the period 1970–2016. Lapse rate of 0.0065°C m−1 was used to correct for elevation differences between the elevation of the source areas and elevation of the gridded air temperature [following recommendations in Crochet and Jóhannesson (2011)]. To account for that the source areas are steep (45–60°) and do not accumulate much snow, precipitation fraction of 0.1 was applied in the modelling. Ground stratigraphy of Leptosols (see Table 1) was assumed. The dashed lines indicate dates of the landslides. Torfufell Mountain in north Iceland (14.10.2011) with a source area at an elevation of ~800 m a.s.l., (2) Móafellshyrna Mountain in the Tröllaskagi area (20.09.2012) with a source area at an elevation of ~880 m a.s.l., and (3) Árnesfjall Mountain in Westfjords (10.07.2014).
(3) The CryoGrid 2 runs indicated that the permafrost temperatures are relatively high in Iceland, with most of the average ground temperatures above −2°C. As a consequence, permafrost in Iceland is certainly highly vulnerable to current and future atmospheric warming. Our modelling indicates that the number of modelled permafrost cells already has decreased considerably in 2010–2016 in comparison to earlier decades. Moreover, as noted by Farbrot et al. (2007b) permafrost at Hágöngur site (at that time 5–6 m thick) would be very sensitive to any changes in temperature or snow depth, and between 2012 and 2015 permafrost degraded completely at that site, exemplifying permafrost sensitivity in Iceland. Projected climate warming will likely lead to further permafrost degradation in Iceland, especially in case of shallower permafrost. Deeper permafrost will probably need more time to disappear completely. To assess future climate impacts on permafrost in Iceland, the modelled permafrost profiles at the end of the simulations could be used as initial conditions for modelling future permafrost evolution by forcing the CryoGrid 2 model with projected climate scenarios. Such approach would combine and improve the previous modelling methods [e.g., sub-grid snow depth and equilibrium model in Gisnås et al. (2017), or no sub-grid snow depth and transient model in Westermann et al. (2013)] by both considering the sub-grid variability in snow depths and additionally being able to capture the ground thermal response to changing atmospheric forcing and precipitation.
Conclusions
From this study, the following conclusions can be drawn:
• Snow is the most crucial factor for permafrost simulation. Snow depth, distribution, and duration were satisfactorily simulated during our study, with some deviations. The permafrost model was most sensitive to (1) thermal conductivity of the snow, (2) precipitation fractions, (3) water content in the upper layer, and (4) snow density, volumetric mineral content in the upper layer, and thermal conductivity of the mineral fraction.
• CryoGrid2 modelled ground temperatures well, with an accuracy of ~0.5°C for mean annual near-surface ground temperatures. Spatially, the model runs indicated permafrost in most of the palsa areas with an exception of small palsas near Hofsjökull. In addition, most stable-ice cored moraines and active rock-glaciers were within the modelled permafrost cells.
• Permafrost occurs mainly in central and north Iceland, particularly in the Tröllaskagi peninsula, where the simulated permafrost temperatures are generally lowest and permafrost is deepest. For the period of 2010–2016, lower permafrost limits in the Tröllaskagi area are modelled at 600–900 m a.s.l. at windy sites and at 1,000–1,150 m a.s.l. in snow-rich areas.
• Substantial differences in permafrost extent were observed when forcing the model with the different precipitation fractions. The 50% precipitation run indicated ~3–5 and 8–15 times more cells with permafrost in comparison with the 100 and 150% precipitation runs, whilst 100% precipitation run reproduced ~2–3 times more permafrost cells than 150% precipitation run.
• Icelandic permafrost is predominantly warm and probably quite shallow. Such conditions make it especially vulnerable to climate warming.
• The three- to four-decade-long warming trend in Iceland has led to the recent permafrost warming or degradation, according to the model output. This was especially evident for the period between 2010 and 2016, when the number of the modelled permafrost cells was reduced by 34, 56, and 49% for the 50, 100, and 150% precipitation runs, respectively, in comparison to the period 1980–1989.
Projected climate warming will likely lead to further warming or degradation of permafrost in Iceland, thus the frequency of the permafrost-induced landslides might potentially increase in Iceland. The model results yield a realistic picture of permafrost distribution at a regional scale, hence future permafrost evolution in Iceland could be modelled transiently at such scale using the ground temperature profiles reproduced in this study. Nevertheless, the simulation results should be carefully used to identification of areas susceptible to permafrost-related hazards. The simulated ground temperatures presented in this study might be overestimated in steep and north-facing slopes; hence, it should be considered that the modelled ground temperatures are representative mostly at a regional scale.
Author Contributions
JC, SW, and BE contributed to the conception and design of the study. JC performed snow and permafrost modelling. TJ provided the data and contributed to snow modelling. BE provided validation data from Iceland. JC wrote the first drafts of the manuscript, with various additions by BE. All authors contributed to manuscript revisions, and approved the submitted version.
Funding
Field visits in Iceland have been financed by the University of Oslo and Jarðfræðistofan ehf. (Ágúst Guðmundsson).
Conflict of Interest Statement
The authors declare that the research was conducted in the absence of any commercial or financial relationships that could be construed as a potential conflict of interest.
Acknowledgments
This work is partly based on a MSc thesis submitted to the Department of Geosciences, University of Oslo. Help in field was provided by Kjetil Skarsvåg Ovesen. The simulations were performed on the Abel Cluster, owned by the University of Oslo and Uninett/Sigma2, and operated by the Department for Research Computing at USIT, the University of Oslo IT-department. In addition, we acknowledge the editor and reviewers for providing valuable comments that greatly improved the manuscript. We want to thank all mentioned individuals and institutions.
Supplementary Material
The Supplementary Material for this article can be found online at: https://www.frontiersin.org/articles/10.3389/feart.2019.00130/full#supplementary-material
References
Aðalgeirsdóttir, G., Jóhannesson, T., Björnsson, H., Pálsson, F., and Sigurðsson, O. (2006). Response of Hofsjökull and southern Vatnajökull, Iceland, to climate change. J. Geophys. Res. 111:F03001. doi: 10.1029/2005JF000388
Aas, K. S., Martin, L., Nitzbon, J., Langer, M., Boike, J., Lee, et al. (2019). Thaw processes in ice-rich permafrost landscapes represented with laterally coupled tiles in a land surface model. Cryosphere 13, 591–609. doi: 10.5194/tc-13-591-2019
Arnalds, O. (2000). “Desertification: an appeal for a broader perspective,” in Rangeland Desertification, eds O. Arnalds and S. Archer (Dordrecht: Kluwer Academic Publishers), 5–15. doi: 10.1007/978-94-015-9602-2
Arnalds, O., and Kimble, J. (2001). Andisols of deserts in Iceland. Soil Sci. Soc. Am. J. 65, 1778–1786. doi: 10.2136/sssaj2001.1778
Barsch, D. (1996). Rockglaciers: Indicators for the Present and Former Geoecology in High Mountain Environments. Heidelberg: Springer Verlag.
Bengtsson, L., Andrae, U., Aspelien, T., Batrak, Y., Calvo, J., de Rooy, W., et al. (2017). The HARMONIE–AROME model configuration in the ALADIN–HIRLAM NWP System. Monthly Weather Rev. 145, 1919–1935. doi: 10.1175/MWR-D-16-0417.1
Berthling, I. (2011). Beyond confusion: rock glaciers as cryo-conditioned landforms. Geomorphology 131, 98–106. doi: 10.1016/j.geomorph.2011.05.002
Berthling, I., and Etzelmüller, B. (2011). The concept of cryo-conditioning in landscape evolution. Quat. Res. 75, 378–384. doi: 10.1016/j.yqres.2010.12.011
Brown, J., Ferrians, O. J. Jr., Heginbottom, J. A., and Melnikov, E. S. (1997). Circum-Arctic Map of Permafrost and Ground-Ice Conditions. Reston, VA: U.S. Geological Survey.
Christiansen, H. H., Sigsgaard, C., Humlum, O., Rasch, M., and Hansen, B. U. (2008). Permafrost and periglacial geomorphology at Zackenberg. Adv. Ecol. Res. 40, 151–174. doi: 10.1016/S0065-2504(07)00007-4
Collins, M., Knutti, R., Arblaster, J., Dufresne, J.-L., Fichefet, T., Friedlingstein, P., et al. (2013). “Long-term climate change: projections, commitments and irreversibility,” in Climate Change 2013: The Physical Science Basis Contribution of Working Group I to the Fifth Assessment Report of the Intergovernmental Panel on Climate Change, eds T. Stocker, D. Qin, G.-K. Plattner, M. Tignor, S. Allen, J. Boschung, et al. (Cambridge; New York, NY: Cambridge University Press), 1029–1136.
Crochet, P., and Jóhannesson, T. (2011). A data set of gridded daily temperature in Iceland, 1949–2010. Jökull 61, 1–17.
Crochet, P., Jóhannesson, T., Jónsson, T., Sigurðsson, O., Björnsson, H., Pálsson, F., et al. (2007). Estimating the spatial distribution of precipitation in Iceland using a linear model of orographic precipitation. J. Hydrometeorol. 8, 1285–1306. doi: 10.1175/2007JHM795.1
Dall'Amico, M., Endrizzi, S., Gruber, S., and Rigon, R. (2011). A robust and energy-conserving model of freezing variably-saturated soil. Cryosphere 5, 469–484. doi: 10.5194/tc-5-469-2011
DeWalle, D. R., and Rango, A. (2008). Principles of Snow Hydrology. Cambridge: Cambridge University Press. doi: 10.1017/CBO9780511535673
Etzelmüller, B., Farbrot, H., Guðmundsson, Á., Humlum, O., Tveito, O. E., and Björnsson, H. (2007). The regional distribution of mountain permafrost in Iceland. Permafrost and Periglacial Processes 18, 185–199. doi: 10.1002/ppp.583
Etzelmüller, B., and Hagen, J. O. (2005). Glacier-permafrost interaction in Arctic and alpine mountain environments with examples from southern Norway and Svalbard. Geol. Soc. Lond. Spec. Publ. 242, 11–27. doi: 10.1144/GSL.SP.2005.242.01.02
Farbrot, H. (2007). Distribution, Thermal Regime and Geomorphic Significance of Mountain Permafrost in Northern Europe–Examples from Iceland, Northern Norway and Svalbard (Ph.D. thesis). Department of Geosciences, University of Oslo.
Farbrot, H., Etzelmüller, B., Guðmundsson, Á., Humlum, O., Kellerer-Pirklbauer, A., Eiken, T., et al. (2007a). Rock glaciers and permafrost in Tröllaskagi, northern Iceland. Zeitschrift für Geomorphol. Suppl. Issues 51, 1–16. doi: 10.1127/0372-8854/2007/0051S2-0001
Farbrot, H., Etzelmüller, B., Schuler, T. V., Guðmundsson, Á., Eiken, T., Humlum, O., et al. (2007b). Thermal characteristics and impact of climate change on mountain permafrost in Iceland. J. Geophys. Res. 112:F03S90. doi: 10.1029/2006JF000541
Farouki, O. T. (1981). Thermal Properties of Soils. Hanover: Cold Regions Research and Engineering Laboratory. doi: 10.21236/ADA111734
Flóvenz, Ó. G., and Saemundsson, K. (1993). Heat flow and geothermal processes in Iceland. Tectonophysics 225, 123–138. doi: 10.1016/0040-1951(93)90253-G
Friedman, J. D., Johansson, C. E., Oskarsson, N., Svensson, H., Thorarinsson, S., and Williams, R. S. (1971). Observations on Icelandic polygon surfaces and palsa areas. Photo interpretation and field studies. Geografiska Annaler. Ser. Phys. Geogr. 53, 115–145. doi: 10.2307/520785
Gisnås, K., Etzelmüller, B., Lussana, C., Hjort, J., Sannel, A. B. K., Isaksen, K., et al. (2017). Permafrost map for Norway, Sweden and Finland. Permafrost and Periglacial Processes 28, 359–378. doi: 10.1002/ppp.1922
Gisnås, K., Westermann, S., Schuler, T. V., Litherland, T., Isaksen, K., Boike, J., et al. (2014). A statistical approach to represent small-scale variability of permafrost temperatures due to snow cover. Cryosphere 8, 2063–2074. doi: 10.5194/tc-8-2063-2014
Gisnås, K., Westermann, S., Schuler, T. V., Melvold, K., and Etzelmüller, B. (2016). Small-scale variation of snow in a regional permafrost model. Cryosphere 10, 1201–1215. doi: 10.5194/tc-10-1201-2016
Gruber, S., and Haeberli, W. (2007). Permafrost in steep bedrock slopes and its temperature-related destabilization following climate change. J. Geophys. Res. 112:F02S18. doi: 10.1029/2006JF000547
Guðmundsson, A. (2000). Frerafjöll, Urðarbingir á Tröllaskaga (Master's thesis). University of Iceland, Reykjavík. In Icelandic.
Haeberli, W. (2005). Investigating glacier-permafrost relationships in high-mountain areas: historical background, selected examples and research needs. Geol. Soc. Lond. Spec. Publ. 242, 29–37. doi: 10.1144/GSL.SP.2005.242.01.03
Hanna, E., Jónsson, T., and Box, J. E. (2004). An analysis of Icelandic climate since the nineteenth century. Int. J. Climatol. 24, 1193–1210. doi: 10.1002/joc.1051
Haraldsdóttir, S. H., Ólafsson, H., Durand, Y., Mérindol, L., and Giraud, G. (2001). SAFRAN- Crocus snow simulations in an unstable and windy climate. Ann. Glaciol. 32, 339–344. doi: 10.3189/172756401781819120
Hjartarson, Á. (2015). “Heat flow in Iceland,” in Proceedings World Geothermal Congress 2015 (Melbourne, VIC).
Hjort, J., Karjalainen, O., Aalto, J., Westermann, S., Romanovsky, V. E., Nelson, F. E., et al. (2018). Degrading permafrost puts Arctic infrastructure at risk by mid-century. Nat. Commun. 9:5147. doi: 10.1038/s41467-018-07557-4
Hock, R. (2003). Temperature index melt modelling in mountain areas. J. Hydrol. 282, 104–115. doi: 10.1016/S0022-1694(03)00257-9
Humlum, O., Instanes, A., and Sollid, J. L. (2003). Permafrost in Svalbard: a review of research history, climatic background and engineering challenges. Polar Res. 22, 191–215. doi: 10.1111/j.1751-8369.2003.tb00107.x
Jafarov, E. E., Coon, E. T., Harp, D. R., Wilson, C. J., Painter, S. L., Atchley, A. L., et al. (2018). Modeling the role of preferential snow accumulation in through talik development and hillslope groundwater flow in a transitional permafrost landscape. Environ. Res. Lett. 13:105006. doi: 10.1088/1748-9326/aadd30
Jafarov, E. E., Marchenko, S. S., and Romanovsky, V. E. (2012). Numerical modeling of permafrost dynamics in Alaska using a high spatial resolution dataset. Cryosphere 6, 613–624. doi: 10.5194/tc-6-613-2012
Jóhannesson, T. (1997). The response of two Icelandic glaciers to climatic warming computed with a degree-day glacier mass-balance model coupled to a dynamic glacier model. J. Glaciol. 43, 321–327. doi: 10.1017/S0022143000003270
Jóhannesson, T., Sigurdsson, O., Laumann, T., and Kennett, M. (1995). Degree-day glacier mass-balance modelling with applications to glaciers in Iceland, Norway and Greenland. J. Glaciol. 41, 345–358. doi: 10.1017/S0022143000016221
Jorgenson, M. T., Shur, Y. L., and Pullman, E. R. (2006). Abrupt increase in permafrost degradation in Arctic Alaska. Geophys. Res. Lett. 33:L02503. doi: 10.1029/2005GL024960
Juliussen, H., and Humlum, O. (2008). Thermal regime of openwork block fields on the mountains Elgåhogna and Sølen, central-eastern Norway. Permafrost and Periglacial Processes 19, 1–18. doi: 10.1002/ppp.607
Kellerer-Pirklbauer, A., Farbrot, H., and Etzelmüller, B. (2007). Permafrost aggradation caused by tephra accumulation over snow-covered surfaces: examples from the Hekla-2000 eruption in Iceland. Permafrost and Periglacial Processes 18, 269–284. doi: 10.1002/ppp.596
Kokkonen, T., Koivusalo, H., Jakeman, A., and Norton, J. (2006). “Construction of a degree-day snow model in the light of the ten iterative steps in model development,” in Proceedings of the iEMSs Third Biennial Meeting: “Summit on Environmental Modelling and Software”. International Environmental Modelling and Software Society (Burlington, VT).
Krautblatter, M., Moser, M., Schrott, L., Wolf, J., and Morche, D. (2012). Significance of rockfall magnitude and solute transport for rock slope erosion and geomorphic work in an Alpine trough valley (Reintal, German Alps). Geomorphology 167, 21–34. doi: 10.1016/j.geomorph.2012.04.007
Lachenbruch, A. H., and Marshall, B. V. (1986). Changing climate: geothermal evidence from permafrost in the Alaskan Arctic. Science 234, 689–696. doi: 10.1126/science.234.4777.689
Lilleøren, K. S., Etzelmüller, B., Gärtner-Roer, I., Kääb, A., Westermann, S., and Guðmundsson, A. (2013). The distribution, thermal characteristics and dynamics of permafrost in Tröllaskagi, Northern Iceland, as inferred from the distribution of rock glaciers and ice-cored moraines. Permafrost and Periglacial Processes 24, 322–335. doi: 10.1002/ppp.1792
Magnin, F., Westermann, S., Pogliotti, P., Ravanel, L., Deline, P., and Malet, E. (2017). Snow control on active layer thickness in steep alpine rock walls (Aiguille du Midi, 3842 m asl, Mont Blanc massif). Catena 149, 648–662. doi: 10.1016/j.catena.2016.06.006
Marmy, A., Salzmann, N., Scherler, M., and Hauck, C. (2013). Permafrost model sensitivity to seasonal climatic changes and extreme events in mountainous regions. Environ. Res. Lett. 8:035048. doi: 10.1088/1748-9326/8/3/035048
Martin, L. C. P., Nitzbon, J., Aas, K. S., Etzelmüller, B., Kristiansen, H., and Westermann, S. (2019). Stability conditions of peat plateaus and palsas in northern Norway. J. Geophys. Res. 124, 705–719. doi: 10.1029/2018JF004945
NASA (2018). NASA Worldview. Available online at: https://worldview.earthdata.nasa.gov/ (accessed May 26, 2018).
Nawri, N., Pálmason, B., Petersen, G. N., Björnsson, H., and Þ*orsteinsson, S. (2017). The ICRA Atmospheric Reanalysis Project for Iceland. Icelandic Meteorological Office, Technical Report 2017–005.
Nicolsky, D. J., Romanovsky, V. E., Panda, S. K., Marchenko, S. S., and Muskett, R. R. (2017). Applicability of the ecosystem type approach to model permafrost dynamics across the Alaska North Slope. J. Geophys. Res. 122, 50–75. doi: 10.1002/2016JF003852
Noetzli, J., Gruber, S., Kohl, T., Salzmann, N., and Haeberli, W. (2007). Three-dimensional distribution and evolution of permafrost temperatures in idealized high-mountain topography. J. Geophys. Res. 112:F02S13. doi: 10.1029/2006JF000545
Óskarsson, H., Arnalds, Ó., Gudmundsson, J., and Gudbergsson, G. (2004). Organic carbon in Icelandic Andosols: geographical variation and impact of erosion. Catena 56, 225–238. doi: 10.1016/j.catena.2003.10.013
Ottósson, J. G., Sveinsdóttir, A., and Harðardóttir, M. (eds.) (2016). Vistgerðir á Íslandi, Fjölrit Náttúrufræðistofnunar 54. Garðabær: Náttúrufræðistofnun Íslands (Icelandic Institute of Natural History). In Icelandic with English summary.
Pálmason, G., Arnórsson, S., Fridleifsson, I. B., Kristmannsdóttir, H., Saemundsson, K., Stefánsson, V., et al. (1979). “The Iceland crust: evidence from drillhole data on structure and processes,” in Deep Drilling Results in the Atlantic Ocean: Ocean Crust, eds M. Talwani, C. G. Harrison and D. E. Hayes (Washington, DC: American Geophysical Union), Maurice Ewing Series 2, 43–65.
Pomeroy, J. W., Bewley, D. S., Essery, R. L. H., Hedstrom, N. R., Link, T., Granger, R. J., et al. (2006). Shrub tundra snowmelt. Hydrol. Processes Int. J. 20, 923–941. doi: 10.1002/hyp.6124
Poulenard, J., Podwojewski, P., and Herbillon, A. J. (2003). Characteristics of non-allophanic Andisols with hydric properties from the Ecuadorian páramos. Geoderma 117, 267–281. doi: 10.1016/S0016-7061(03)00128-9
Pribyl, D. W. (2010). A critical review of the conventional SOC to SOM conversion factor. Geoderma 156, 75–83. doi: 10.1016/j.geoderma.2010.02.003
Priesnitz, K., and Schunke, E. (1978). “An approach to the ecology of permafrost in Central Iceland,”in Third International Conference on Permafrost, Edmonton, Canada (Ottawa, ON: National Research Council of Canada), 474–479.
Ravanel, L., Allignol, F., Deline, P., Gruber, S., and Ravello, M. (2010). Rock falls in the Mont Blanc Massif in 2007 and 2008. Landslides 7, 493–501. doi: 10.1007/s10346-010-0206-z
Redding, T. E., and Devito, K. J. (2006). Particle densities of wetland soils in northern Alberta, Canada. Can. J. Soil Sci. 86, 57–60. doi: 10.4141/S05-061
Riseborough, D., Shiklomanov, N., Etzelmüller, B., Gruber, S., and Marchenko, S. (2008). Recent advances in permafrost modelling. Permafrost and Periglacial Processes 19, 137–156. doi: 10.1002/ppp.615
Romanovsky, V. E., Smith, S. L., and Christiansen, H. H. (2010). Permafrost thermal state in the Polar Northern Hemisphere during the international polar year 2007–2009: a synthesis. Permafrost and Periglacial Processes 21, 106–116. doi: 10.1002/ppp.689
Sæmundsson, Þ., Helgason, J. K., and Pétursson, H. P. (2014). “Decline of mountain permafrost and the occurrence of recent large debris slides in Iceland,” in European Geosciences Union, General Assembly 2014 (Vienna).
Sæmundsson, Þ., Morino, C., Helgason, J. K., Conway, S. J., and Pétursson, H. G. (2018). The triggering factors of the Móafellshyrna debris slide in northern Iceland: intense precipitation, earthquake activity and thawing of mountain permafrost. Sci. Total Environ. 621, 1163–1175. doi: 10.1016/j.scitotenv.2017.10.111
Saemundsson, T., Arnalds, O., Kneisel, C., Jonsson, H. P., and Decaulne, A. (2012). The Orravatnsrustir palsa site in Central Iceland–Palsas in an aeolian sedimentation environment. Geomorphology 167, 13–20. doi: 10.1016/j.geomorph.2012.03.014
Saloranta, T. M. (2012). Simulating snow maps for Norway: description and statistical evaluation of the seNorge snow model. Cryosphere 6, 1323–1337. doi: 10.5194/tc-6-1323-2012
Scherler, M., Hauck, C., Hoelzle, M., and Salzmann, N. (2013). Modeled sensitivity of two alpine permafrost sites to RCM-based climate scenarios. J. Geophys. Res. 118, 780–794. doi: 10.1002/jgrf.20069
Schuster, P. F., Schaefer, K. M., Aiken, G. R., Antweiler, R. C., Dewild, J. F., Gryziec, J. D., et al. (2018). Permafrost stores a globally significant amount of mercury. Geophys. Res. Lett. 45, 1463–1471. doi: 10.1002/2017GL075571
Schuur, E. A. G., Bockheim, J., Canadell, J. G., Euskirchen, E., Field, C. B., Goryachkin, S. V., et al. (2008). Vulnerability of permafrost carbon to climate change: implications for the global carbon cycle. BioScience 58, 701–714. doi: 10.1641/B580807
Seppälä, M. (1982). “An experimental study of the formation of palsas,” in Proceedings Fourth Canadian Permafrost Conference (Ottawa, ON: National Research Council of Canada), 36–42.
Seppälä, M., and Kujala, K. (2009). The role of buoyancy in palsa formation. Geol. Soc. Lond. Spec. Publ. 320, 51–56. doi: 10.1144/SP320.4
Shangguan, W., Hengl, T., Mendes de Jesus, J., Yuan, H., and Dai, Y. (2016). Mapping the global depth to bedrock for land surface modeling. J. Adv. Model. 9, 65–88. doi: 10.1002/2016MS000686
Sigurðsson, O., and Jóhannesson, T. (2014). Samantekt um Snjómælingar á Hálendi Íslands. Icelandic Meteorological Office. (In Icelandic).
Smith, L. C., Sheng, Y., MacDonald, G. M., and Hinzman, L. D. (2005). Disappearing Arctic Lakes. Science 308, 1429–1429. doi: 10.1126/science.1108142
Smith, M. W., and Riseborough, D. W. (2002). Climate and the limits of permafrost: a zonal analysis. Permafrost and Periglacial Processes 13, 1–15. doi: 10.1002/ppp.410
Smith, R. B., and Barstad, I. (2004). A linear theory of orographic precipitation. J. Atmos. Sci. 61, 1377–1391. doi: 10.1175/1520-0469(2004)061<1377:ALTOOP>2.0.CO;2
Stefánsson, V., Sigurðsson, Ó., Guðmundsson, Á., Franzson, H., Friðleifsson, G. Ó., and Tulinius, H. (1997). “Core measurements and geothermal modelling,” in Second Nordic Symposium on Petrophysics: Fractured reservoirs. Nordic Petroleum Technology Series (Göteborg, Sweden), 199–220.
Sturm, M., Holmgren, J., König, M., and Morris, K. (1997). The thermal conductivity of seasonal snow. J. Glaciol. 43, 26–41. doi: 10.1017/S0022143000002781
Vionnet, V., Brun, E., Morin, S., Boone, A., Faroux, S., Moigne, P. L., et al. (2012). The detailed snowpack scheme Crocus and its implementation in SURFEX v7.2. Geosci. Model Dev. 5, 773–791. doi: 10.5194/gmd-5-773-2012
Westermann, S., Elberling, B., Højlund Pedersen, S., Stendel, M., Hansen, B. U., and Liston, G. E. (2015a). Future permafrost conditions along environmental gradients in Zackenberg, Greenland. Cryosphere 9, 719–735. doi: 10.5194/tc-9-719-2015
Westermann, S., Østby, T. I., Gisnås, K., Schuler, T. V., and Etzelmüller, B. (2015b). A ground temperature map of the North Atlantic permafrost region based on remote sensing and reanalysis data. Cryosphere 9, 1303–1319. doi: 10.5194/tc-9-1303-2015
Westermann, S., Peter, M., Langer, M., Schwamborn, G., Schirrmeister, L., Etzelmüller, B., et al. (2017). Transient modeling of the ground thermal conditions using satellite data in the Lena River delta, Siberia. Cryosphere 11, 1441–1463. doi: 10.5194/tc-11-1441-2017
Westermann, S., Schuler, T. V., Gisnås, K., and Etzelmüller, B. (2013). Transient thermal modeling of permafrost conditions in Southern Norway. Cryosphere 7, 719–739. doi: 10.5194/tc-7-719-2013
White, D., Hinzman, L., Alessa, L., Cassano, J., Chambers, M., Falkner, K., et al. (2007). The arctic freshwater system: changes and impacts. J. Geophys. Res. 112:G04S54. doi: 10.1029/2006JG000353
Wicky, J., and Hauck, C. (2017). Numerical modelling of convective heat transport by air flow in permafrost talus slopes. Cryosphere 11, 1311–1325. doi: 10.5194/tc-11-1311-2017
Yen, Y.-C. (1981). Review of Thermal Properties of Snow, Ice and Sea Ice. Hanover: Technical report, Cold Regions Research and Engineering Laboratory.
Keywords: permafrost, Iceland, transient permafrost modelling, maritime permafrost, permafrost dynamics
Citation: Czekirda J, Westermann S, Etzelmüller B and Jóhannesson T (2019) Transient Modelling of Permafrost Distribution in Iceland. Front. Earth Sci. 7:130. doi: 10.3389/feart.2019.00130
Received: 23 January 2019; Accepted: 13 May 2019;
Published: 04 June 2019.
Edited by:
Benjamin M. Jones, University of Alaska Fairbanks, United StatesReviewed by:
Elchin Jafarov, Los Alamos National Laboratory (DOE), United StatesNoriaki Ohara, University of Wyoming, United States
Copyright © 2019 Czekirda, Westermann, Etzelmüller and Jóhannesson. This is an open-access article distributed under the terms of the Creative Commons Attribution License (CC BY). The use, distribution or reproduction in other forums is permitted, provided the original author(s) and the copyright owner(s) are credited and that the original publication in this journal is cited, in accordance with accepted academic practice. No use, distribution or reproduction is permitted which does not comply with these terms.
*Correspondence: Justyna Czekirda, justyna.czekirda@geo.uio.no