In situ Viscometry of Primitive Lunar Magmas at High Pressure and High Temperature
 Nachiketa Rai1
  Jean-Philippe Perrillat2*
  Mohamed Mezouar3
  Aurélia Colin4
  Sylvain Petitgirard5
  Wim van Westrenen6
- 1Department of Earth Sciences, Indian Institute of Technology, Roorkee, India
- 2Laboratoire de Géologie de Lyon, UMR5276, Université Lyon 1, Ens de Lyon, CNRS, Villeurbanne, France
- 3European Synchrotron Radiation Facility, Grenoble, France
- 4Géosciences Environnement Toulouse, UMR 5563, Toulouse, France
- 5Institute of Geochemistry and Petrology, Department of Earth Sciences, Eidgenössische Technische Hochschule Zürich, Zurich, Switzerland
- 6Department of Earth Sciences, Vrije Universiteit Amsterdam, Amsterdam, Netherlands
Understanding the dynamics of the magmatic evolution of the interior of the Moon requires accurate knowledge of the viscosity (η) of lunar magmas at high pressure (P) and high temperature (T) conditions. Although the viscosities of terrestrial magmas are relatively well-documented, and their relation to magma composition well-studied, the viscosities of lunar titano-silicate melts are not well-known. Here, we present an experimentally measured viscosity dataset for three end member compositions, characterized by a wide range of titanium contents, at lunar-relevant pressure-temperature range of ∼1.1–2.4 GPa and 1830–2090 K. In situ viscometry using the falling sphere technique shows that the viscosity of lunar melts varies between ∼0.13 and 0.87 Pa-s depending on temperature, pressure and composition. Viscosity decreases with increasing temperature with activation energies for viscous flow of Ea = 201 kJ/mol and Ea = 106 kJ/mol for low-titanium (Ti) and high-Ti melts, respectively. Pressure is found to mildly increase the viscosity of these intermediate polymerized melts by a factor of ∼1.5 between 1.1 and 2.4 GPa. Viscosities of low-Ti and high-Ti magmas at their respective melting temperatures are very close. However at identical P-T conditions (∼1.3 GPa, ∼1840 K) low-Ti magmas are about a factor of three more viscous than high-Ti magmas, reflecting structural effects of Si and Ti on melt viscosity. Measured viscosities differ significantly from empirical models based on measurements of the viscosity of terrestrial basalts, with largest deviations observed for the most Ti-rich and Si-poor composition. Viscosity coefficients for these primitive lunar melts are found to be lower than those of common terrestrial basalts, giving them a high mobility throughout the lunar mantle and onto the surface of the Moon despite their Fe and Ti-rich compositions.
Introduction
A combination of recent analyses of Apollo-era samples (e.g., Borg et al., 2011; Saal et al., 2013; Tartèse and Anand, 2013; Hauri et al., 2015), reassessment of lunar seismic data (Garcia et al., 2011; Weber et al., 2011), orbital measurements from recent lunar missions (e.g., Pieters et al., 2009; Yamamoto et al., 2010; Wu et al., 2012; Wieczorek et al., 2013), and results from advanced experimental and computational studies (e.g., de Vries et al., 2010; Elardo et al., 2011; Jutzi and Asphaug, 2011; Cuk and Stewart, 2012; van Kan Parker et al., 2012; Lin et al., 2017a,b; Charlier et al., 2018; Rapp and Draper, 2018; Zhao et al., 2019) are revolutionizing our view of the formation and general evolution of the surface and interior of the Moon. Detailed models of key aspects of lunar magmatic evolution are still hampered by a lack of quantitative constraints on the physical properties of lunar magma at high pressures (P) and temperatures (T). This lack of data plagues the accuracy of models of the physical and thermodynamic properties and resulting dynamics of the lunar interior. For example, the plagioclase-rich crust of the Moon exposed in the highland terranes is widely believed to have formed due to flotation of plagioclase in a global, crystallizing lunar magma ocean (Herbert et al., 1977; Elkins-Tanton, 2008; Lin et al., 2017a,b; Charlier et al., 2018; Rapp and Draper, 2018). Dynamic models of this flotation (Warren, 1990; Elkins-Tanton et al., 2011; Suckale et al., 2012) suffer from scarcity of data on the variations of density of both crystals and melts, and on the viscosity of lunar melts (which determine the upward velocity of rising crystals), at lunar high pressure-temperature conditions. Petrogenetic models for the origin of lunar mare basalts and picritic glasses are also strongly dependent on the dynamics of melt transport, and hence on lunar magma viscosities under high P-T conditions, on their route to the surface (e.g., Grove and Krawczynski, 2009).
Viscosity (η) is a critically important physical property of magma, governing the efficiency, rate and nature of melt transport and affecting the rates of crystallization and differentiation processes. It is a consequence of atomic-scale transport, and is therefore directly related to the structure and thermodynamic properties of the magma. Prediction of variations in viscosity as a function of pressure, temperature, and composition is challenging. Several empirical models have been proposed for predicting the temperature-composition dependence of magma viscosity over a range of anhydrous and hydrous terrestrial magma compositions at atmospheric pressure (Shaw, 1972; Hui and Zhang, 2007; Giordano et al., 2008). While these models are very successful in predicting the viscosities of terrestrial magmas, they have been shown inaccurate for compositions relevant to magmatism on other terrestrial bodies (e.g., Chevrel et al., 2014; Sehlke and Whittington, 2016). One particular feature of lunar magmas is their very wide range of titanium contents (Delano, 1986). The TiO2 content of primitive lunar melts sampled during the Apollo missions varies between 0.26 wt.% for the Apollo 15C green glass to 16.4 wt.% for the Apollo 14 black glass (Delano, 1986). Chemical composition of lunar basalts estimated by remote sensing methods also confirm the wide range of TiO2 contents in lunar basalts ranging from less than ∼1 wt% to more than 14 wt% (Giguere et al., 2000; Carter et al., 2009). No systematic viscosity data set is available for the viscosity of titanium-rich magmas that do not occur on Earth but are widespread on the Moon. The empirical nature of current melt viscosity models precludes confident extrapolation to compositions outside of their calibration range. In addition, the effect of pressure on magma viscosity is poorly constrained, precluding extrapolation of the low-pressure model to lunar interior pressures.
This study aims to provide new viscosity data obtained from experimental in situ measurements on a range of primitive lunar melt compositions ranging from the Apollo 15 green glass with low Ti content to the Apollo 14 black glass with very high Ti contents. Using in situ falling sphere viscometry we assess the effects of pressure and temperature on primitive lunar melt viscosity, quantify the difference between measured values and model predictions, and describe the implications of our results for lunar magmatic processes.
Materials and Methods
Liquid viscosity at high pressure and high temperature conditions was determined using the in situ falling sphere technique developed over two decades ago (e.g., Kanzaki et al., 1987; Suzuki et al., 2002). In this technique, X-ray radiographic images record the rate of downward descent of an X-ray opaque dense marker sphere as it falls through a molten sample of lower density. Experiments were performed at beamline ID27 of the European Synchrotron Radiation Facility (ESRF) in Grenoble (France) that combined a Vx5-type Paris-Edinburgh (P-E) press with in situ X-ray radiography and diffraction setups (Mezouar et al., 2005; Perrillat, 2008).
Starting material consisted of synthetic equivalents of low-titanium Apollo 15C green glass (0.26 wt% TiO2), high-titanium Apollo 14 black glass (16.4 wt% TiO2), and intermediate Ti-content Apollo 17 (74,220) orange glass (9.1 wt% TiO2). These compositions bracket the observed Ti content variation in Apollo surface samples and enable quantification of the effect (linear or non-linear) of composition on lunar melt viscosity. The nominal bulk compositions of the starting mixtures are given in Table 1. High purity (99.5–100.05%, Alafa Aesar) powdered oxides MgO, MnO, Fe2O3, Al2O3, TiO2, SiO2, Cr2O3 and carbonates Na2CO3, KCO3, and CaCO3 were used to prepare the starting compositions. The oxides MgO, MnO, Al2O3, TiO2, and SiO2 were fired at 1000°C while the other oxides and carbonates were dried at 110°C prior to use. To prepare the starting glasses, required proportions of oxides and carbonates were first intimately mixed under ethanol in an agate mortar, and then dried in air and decarbonated in a Pt crucible in a one-atmosphere furnace by gradually raising the temperature from 650 to 1200°C over a period of 7 h. The Pt crucible had previously been iron-saturated to minimize Fe loss during starting composition preparation. Each individual mixture was finely ground in an agate mortar under acetone and subsequently fired at 1500°C. The resulting glasses were ground under ethanol once more in an agate mortar for 1 h, dried and stored at 110°C before use, in order to ensure a nominally anhydrous content for the powdered glasses. The polymerization index NBO/T is calculated from the ratio of non-bridging oxygens to the number of network-forming cations, following Mysen (1990), and assuming all Ti cations are tetrahedrally coordinated.
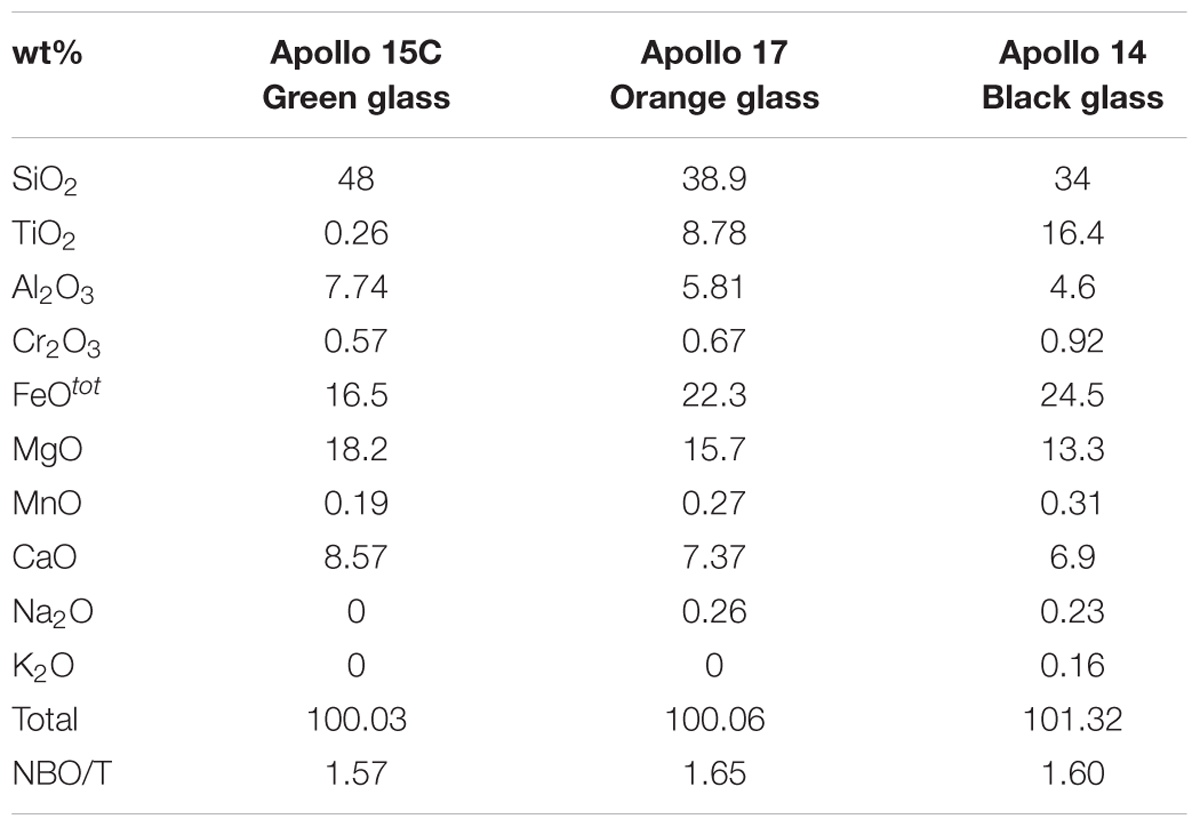
Table 1. Compositions of synthetic Apollo green, orange, and black glasses based on electron microprobe measurements (from Delano, 1986).
The configuration of the cell assembly used is shown in Figure 1. It consists of a boron epoxy gasket, a cylindrical graphite furnace and a single crystal diamond capsule as sample container. The latter is ideal for these kinds of experiments because of the high melting point, the high X-ray transparency and chemical inertia of diamond. The capsule is designed to hold the melt inside the sample chamber and minimize contamination by chemical interaction with its environment. Moreover, the high thermal conductivity of diamond ensures the lack of thermal gradients over the sample. For falling sphere viscometry, we used rhenium spheres because of their high density at 1 atmosphere of 21.02 g/cm3 (Ahrens and Johnson, 1995), high melting point (3453 K at atmospheric pressure, Vohra et al., 1987) and minimal chemical interaction with the samples. Pilot experiments with tungsten carbide (WC) spheres showed significant to total sphere dissolution at high temperature, precluding their use. Spheres were fabricated by arc melting from thin strips of 25 μm thick Re foil in order to produce spheres 40–68 μm in diameter as measured by optical microscopy with an accuracy of 2 μm. Finely powdered starting material was packed inside the diamond cylinder (1.5 mm length and 0.5 mm internal diameter), and a single rhenium sphere was placed in the upper one third of the sample material and positioned as close as feasible to the center relative to the capsule diameter. In order to avoid wall effects that could affect the sphere settling velocity, the diameter of the sphere was limited to about one 10th of the diameter of the sample or smaller. The diamond capsule was loaded between two graphite caps, 0.5 mm thick. These caps act as pistons, transferring pressure to the sample (Figure 1). The diamond cylinder and graphite caps were enclosed in an hBN cylinder, acting as P-transmitting media. A poly-ether-ether-ketone (PEEK) ring was added around the gasket to prevent the gasket from flowing out during heating and compression. P-T calibrants were packed in a lateral hand-drilled hole, Ø ∼ 0.2 mm, in the middle of the hBN cylinder, touching the outside of the diamond capsule. Calibrants were high-purity Pt powder (99.99%, Alfa Aesar) mixed with hBN powder (99.99 wt%, Goodfellow). This high-pressure sample assembly was fully pressure-calibrated by van Kan Parker et al. (2010), who showed that at T > 1250 K, pressure is fully transmitted by the graphite end caps to the sample.
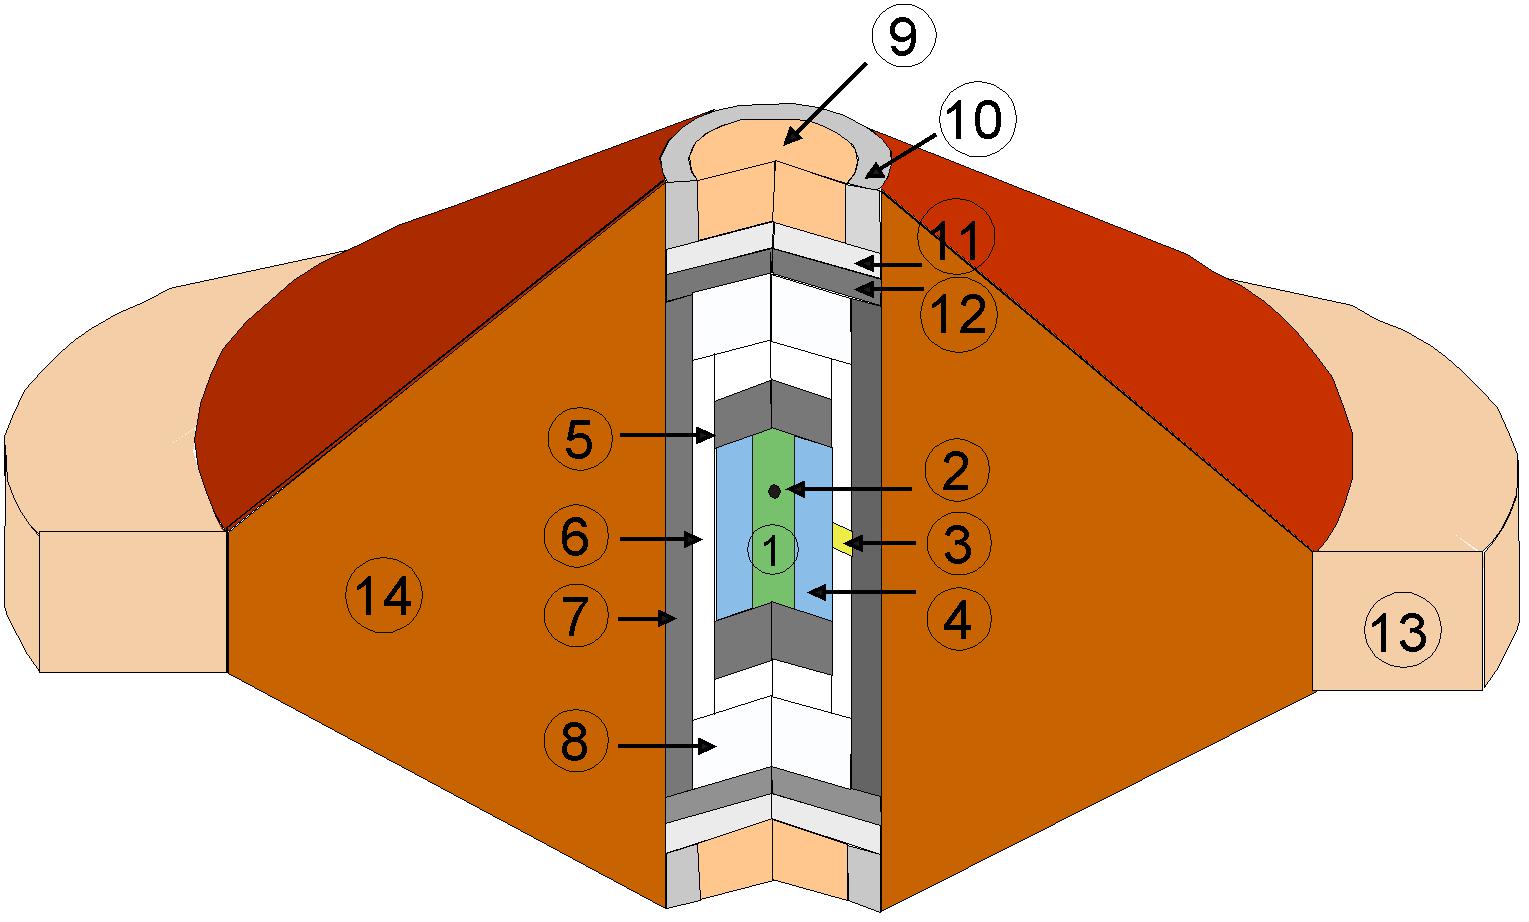
Figure 1. Cell assembly used for in situ viscosity measurements. (1) sample, (2) rhenium sphere, (3) hBN + Pt calibrant, (4) single crystal diamond capsule, 1.5 mm length and 0.5 mm internal diameter, (5) graphite end-cap, (6) hBN capsule, (7) graphite heater, (8) hBN lid, (9) MgO powder, (10) steel ring, (11) molybdenum disk, (12) graphite disk, (13) PEEK containment ring, and (14) boron epoxy gasket.
Following the approach of Rai et al. (2013), after loading the cell assembly in the P-E press, the cells were first cold compressed before increasing the temperature in small steps up to approximately 200 K below the liquidus temperature of the compositions and maintained there for several minutes to allow thermal settling of the assembly. Heating to the final temperature was performed very rapidly at a rate of 100 W/min to ensure full and rapid melting of the sample above the liquidus. At different stages of the experiments, synchrotron X-ray diffraction patterns were systematically collected for both sample and calibrants. All 2D diffraction images were treated and integrated using the Fit2D data analysis software (Hammersley et al., 1996). Sample diffraction patterns were used to assess the physical state of the sample (Figure 2). Note that the diffuse scattering from the liquid that is observed in diffraction patterns (Figure 2 middle) is not readily suitable for structural investigations of the melt structure because (i) incident X-ray energy was optimized for radiography contrast instead of diffraction quality and (ii) measured intensities were not corrected for the response of the Sollers slit which is non-linear (see Morard et al., 2011). Calibrant diffraction patterns were analyzed using the EXPGUI graphical interface of GSAS which is a comprehensive system for the refinement of structural models to x-ray diffraction data (Toby, 2001). In order to calculate the P-T conditions from the diffraction lines of hBN and Pt, third order Birch Murnaghan equations of state (EOS) for Pt (Fei et al., 2004) and hBN (Zhao et al., 1997; Le Godec et al., 2000) were used. Temperature and pressure uncertainties resulting from the cross-calibration of the equations of state of the two calibrants are estimated as ±50 K and ±0.2 GPa, respectively. The absence of peaks from sample X-ray diffraction patterns was used to confirm that superliquidus temperatures had been reached, and the P-T conditions at which this occurred are in agreement with the melting phase relations (Figure 3) determined ex situ for the bulk compositions used (Wagner and Grove, 1997; Elkins-Tanton et al., 2003a; van Kan Parker et al., 2012).
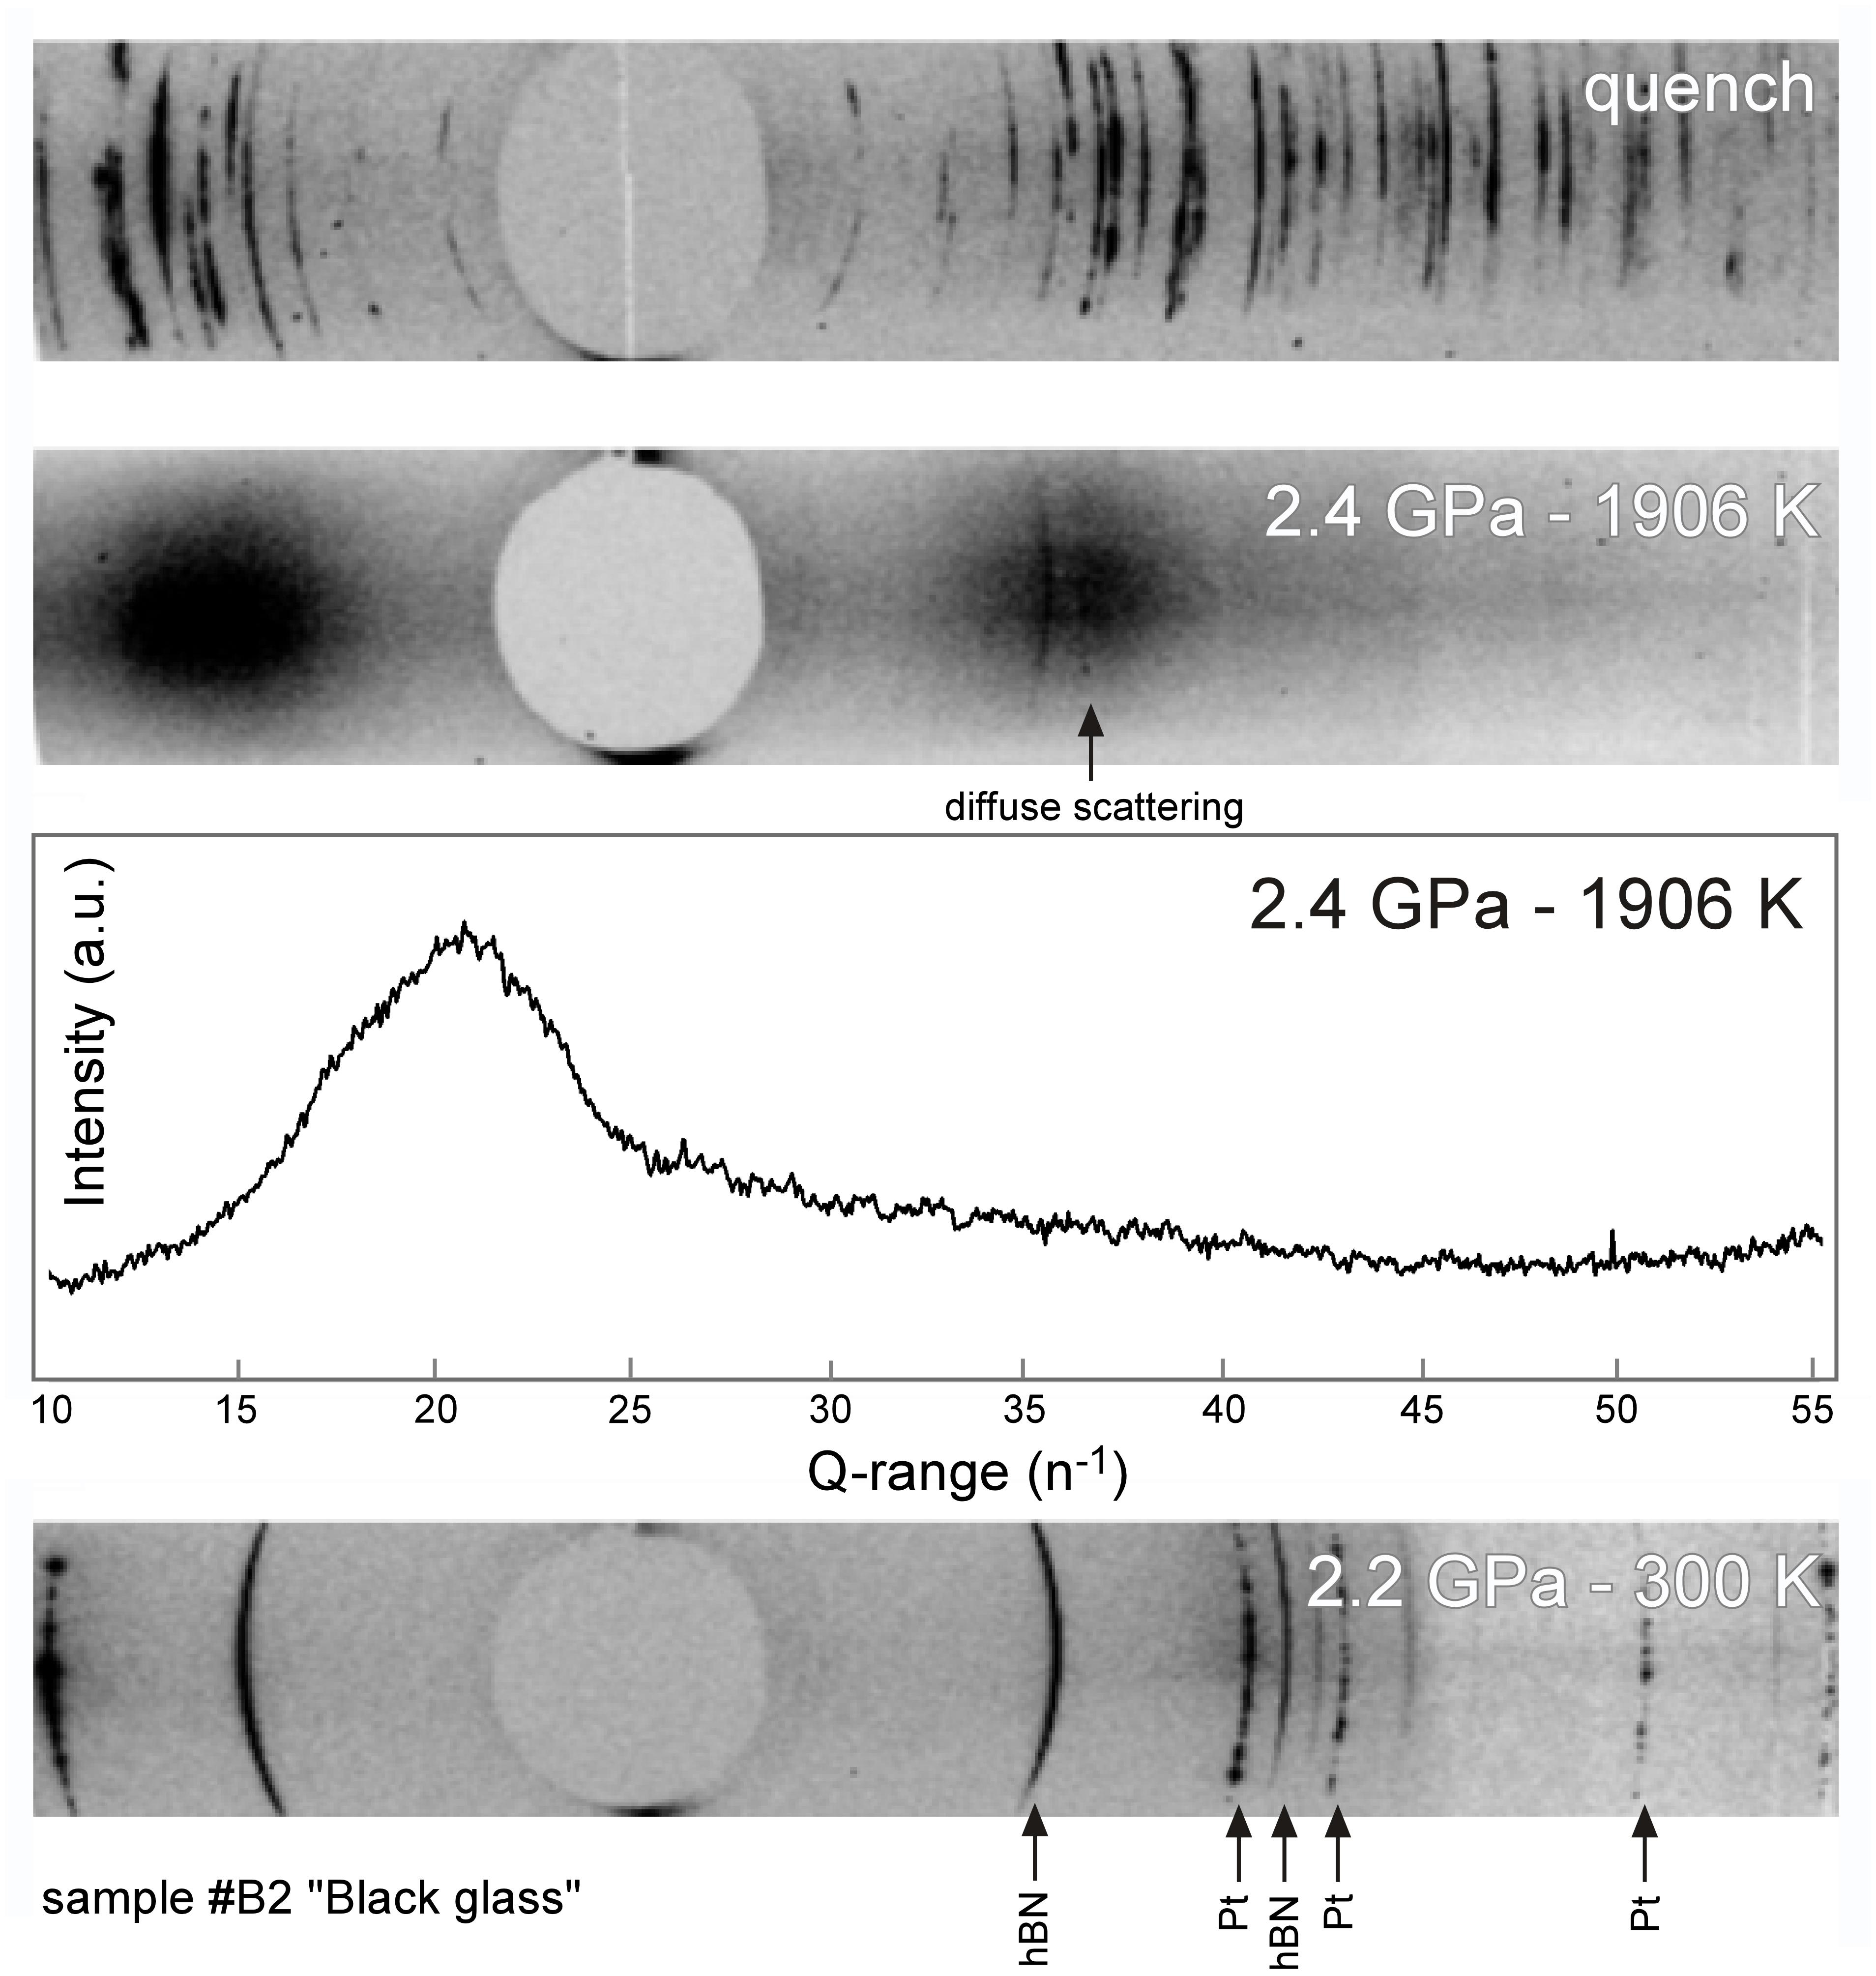
Figure 2. Typical X-ray diffraction images acquired on sample B2, black glass composition; at (bottom) sub-liquidus conditions, showing diffraction lines of hBN and Pt calibrants; at (middle) superliquidus conditions of 2.4 GPa – 1906 K. Full melting is evidenced by a broad band of diffuse scattering and the absence of diffraction spots. The corresponding integrated intensity spectrum is plotted in Q-range scale. (top) After temperature quench, the sample is fully recrystallized.
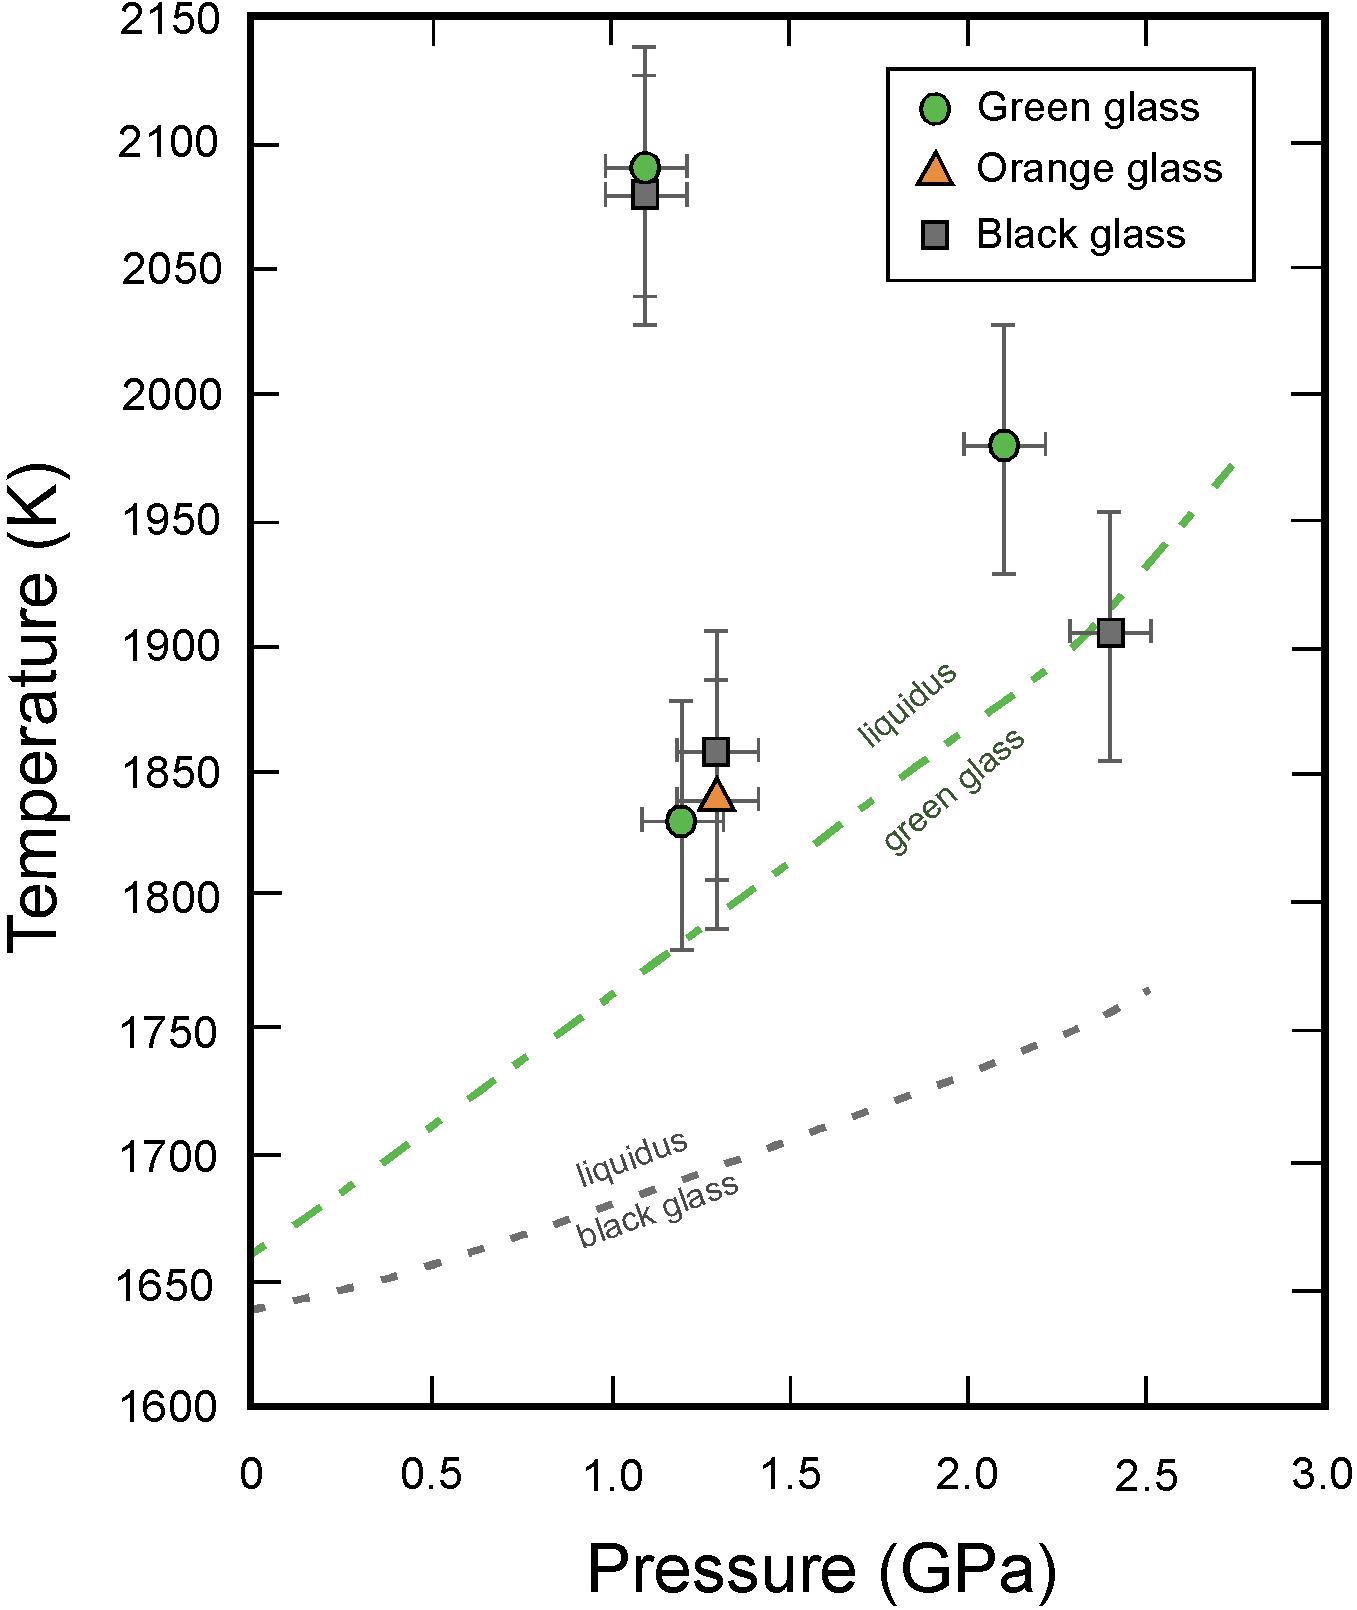
Figure 3. Pressure-temperature conditions of the in situ viscosity measurements for the green (circles), orange (triangles) and black (squares) glasses, compared with experimentally determined liquidi for the green, orange and black glasses compositions (Wagner and Grove, 1997; Elkins-Tanton et al., 2003b; van Kan Parker et al., 2012). Error bars derive from errors in cross-calibration of P-T calibrants.
Radiographic images were acquired every 20 ms during the final temperature increase using a high-speed CCD camera (Perrillat et al., 2010). Images recorded the fall of the dense Re sphere as soon as the melting temperature was reached. During and after radiographic observations, P-T conditions were held constant and diffraction patterns of the liquid and P-T calibrants were collected. The sample was then quenched in temperature by cutting power to the furnace.
Results
We performed a total of seven successful runs covering the temperature range between 1830 and 2090 K and pressure range from 1.1 to 2.4 GPa (Figure 3 and Table 2). Time-lapsed radiographic images of a typical successful run are shown in Figure 4, with a falling rhenium sphere measured at 2.4 GPa and 1906 K in a molten black glass sample (sample B2, also shown in Figure 2). The corresponding time versus falling distance profile (Figure 4) is constructed from the location of the top and bottom points of the sphere, tracked on each individual frame using the Metavue® image software. The time-falling distance plot shows a sigmoid shape with non-linear regions at both ends, reflecting acceleration as the sphere starts to fall before achieving the terminal velocity, and deceleration of the sphere as it approaches the bottom of the capsule. The time versus falling distance profiles in all runs reported in this study do not exhibit variations or discontinuities that could be related to convection or thermal gradients in the cell. The velocity curve in the inset of Figure 4 is derived by fitting the time-distance profile with a cubic spline function and numerical differentiation. It shows a plateau of constant velocity consistent with the achievement of steady state velocity. The terminal velocity is determined by linear regression of this flat-top interval. Comparison of rates derived from the motion of the top and bottom of the spheres in the same run and errors calculated from the fitting procedures yield an absolute uncertainty of ±2 to ±18 μm/s in the resulting terminal velocities.
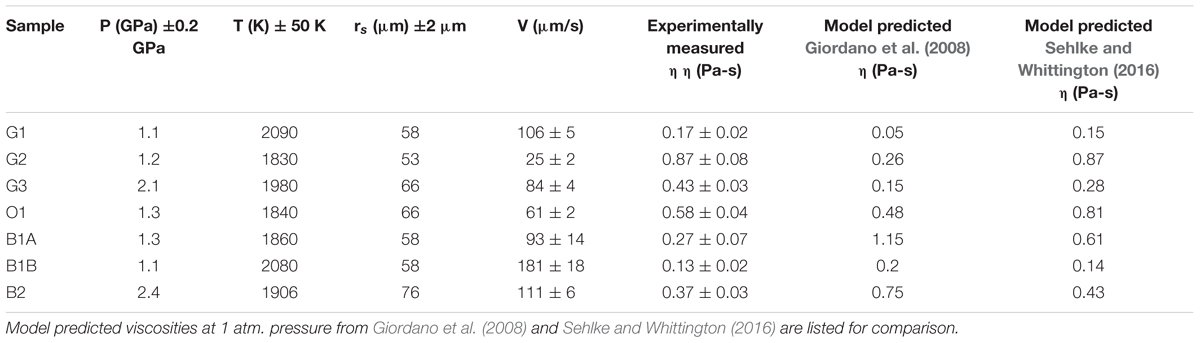
Table 2. Experimental run conditions, measured viscosities and uncertainties.
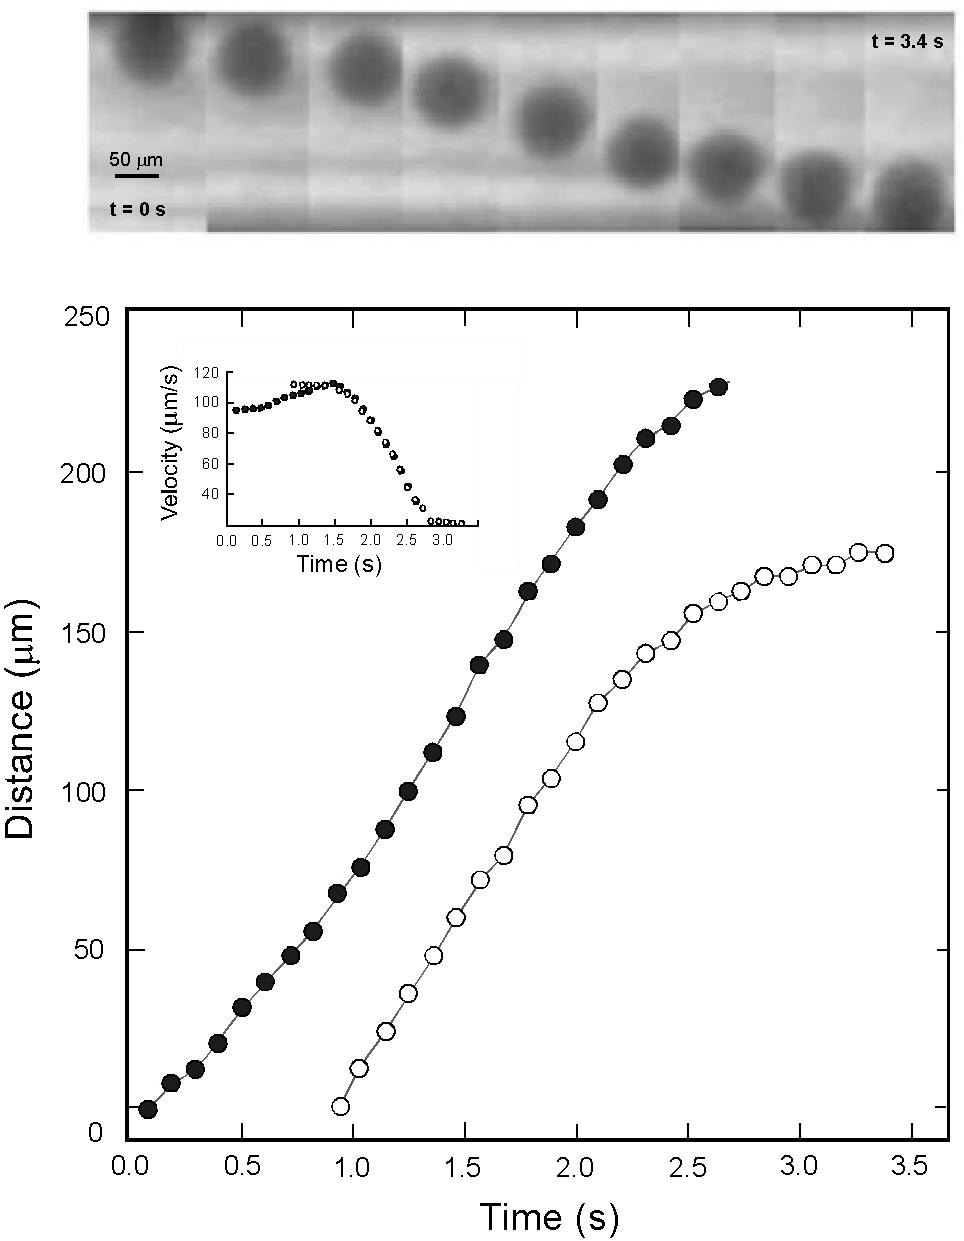
Figure 4. (Top) Radiographic images of a falling Rhenium sphere from sample B2 at 2.4 GPa – 1906 K and (Bottom) the corresponding distance vs. time plot. The location of the top and bottom points of the sphere, represented as open and filled symbols respectively, were tracked on each individual frame using the Metavue® image software.The goal of using both the top and bottom points of the sphere rather than its centroid is to increase the fall length measurement. The inset shows the derived falling velocities for this experiment. The achievement of a plateau at 111 ± 6 μm/s is a good indication that the sphere reached its terminal settling velocity.
For a solid sphere of density ρs and radius rs falling in a liquid of density ρl, the viscosity η is given by Stokes’ relation:
where g is the acceleration due to gravity, and V the settling velocity. The parameters F and K correspond to the wall effect (Faxen, 1925) and finite length (Kingery, 1959) corrections respectively, where:
In these equations, rc is the internal diameter of the capsule (rc = 0.25 mm), and h the sample length, taken to be the entire fall distance. The densities of the melts were calculated from the equation of state parameters of the Apollo green, orange and black glasses reported in van Kan Parker et al. (2012). The density of rhenium at high pressure and temperature was calculated from its equation of state (e.g., Ahrens and Johnson, 1995).
Because of the large contrast between the density of Re and the density of silicate melts, the viscosity estimates are not significantly affected by uncertainties in the densities of the sphere and the melt. For example, an error of 500 g cm-3 on the parameter (ρs – ρl) in Eq. 1 results in <3% error in the calculated melt viscosity. Overall uncertainty mainly stems from the dispersion in falling velocities leading to absolute errors of ±0.02 to ±0.08 Pa.s on melt viscosities. Experimental conditions, sphere diameters, terminal velocities and calculated viscosities are summarized in Table 2. The viscosity coefficients obtained in this study range from 0.13 Pa-s for the black glass at 1.1 GPa and 2080 K to 0.87 Pa-s at 1.2 GPa and 1830 K for the green glass composition.
Discussion
Effects of Temperature, Pressure, and Composition
Measurements were made over the temperature range 1830–2090 K, which for all three compositions includes the region above the liquidus. A graphical illustration of the logarithm of viscosity as a function of reciprocal temperature for each glass composition is given in Figure 5. Within the investigated temperature range, the viscosities can be reasonably assumed to follow a simple Arrhenius relationship:
where η0T is a pre-exponential factor, Ea the activation energy for viscous flow, and R the gas constant. The values of logη0,T and Ea in Eq. 4 were calculated from simple linear regression of logη on 1/T from nearly isobaric experiments at 1.1–1.2 GPa for the green glass, and 1.1–1.3 GPa for the black glass composition. The best fit parameters are Ea = 201 ± 26 kJ/mol – logη0,T = -5.8 ± 0.7 Pa-s and Ea = 106 ± 46 kJ/mol – logη0,T = -4.1 ± 1.5 Pa-s for the green and black glass, respectively. For the orange glass, we consider the activation energy Ea to range between the two above values considering its intermediate composition.
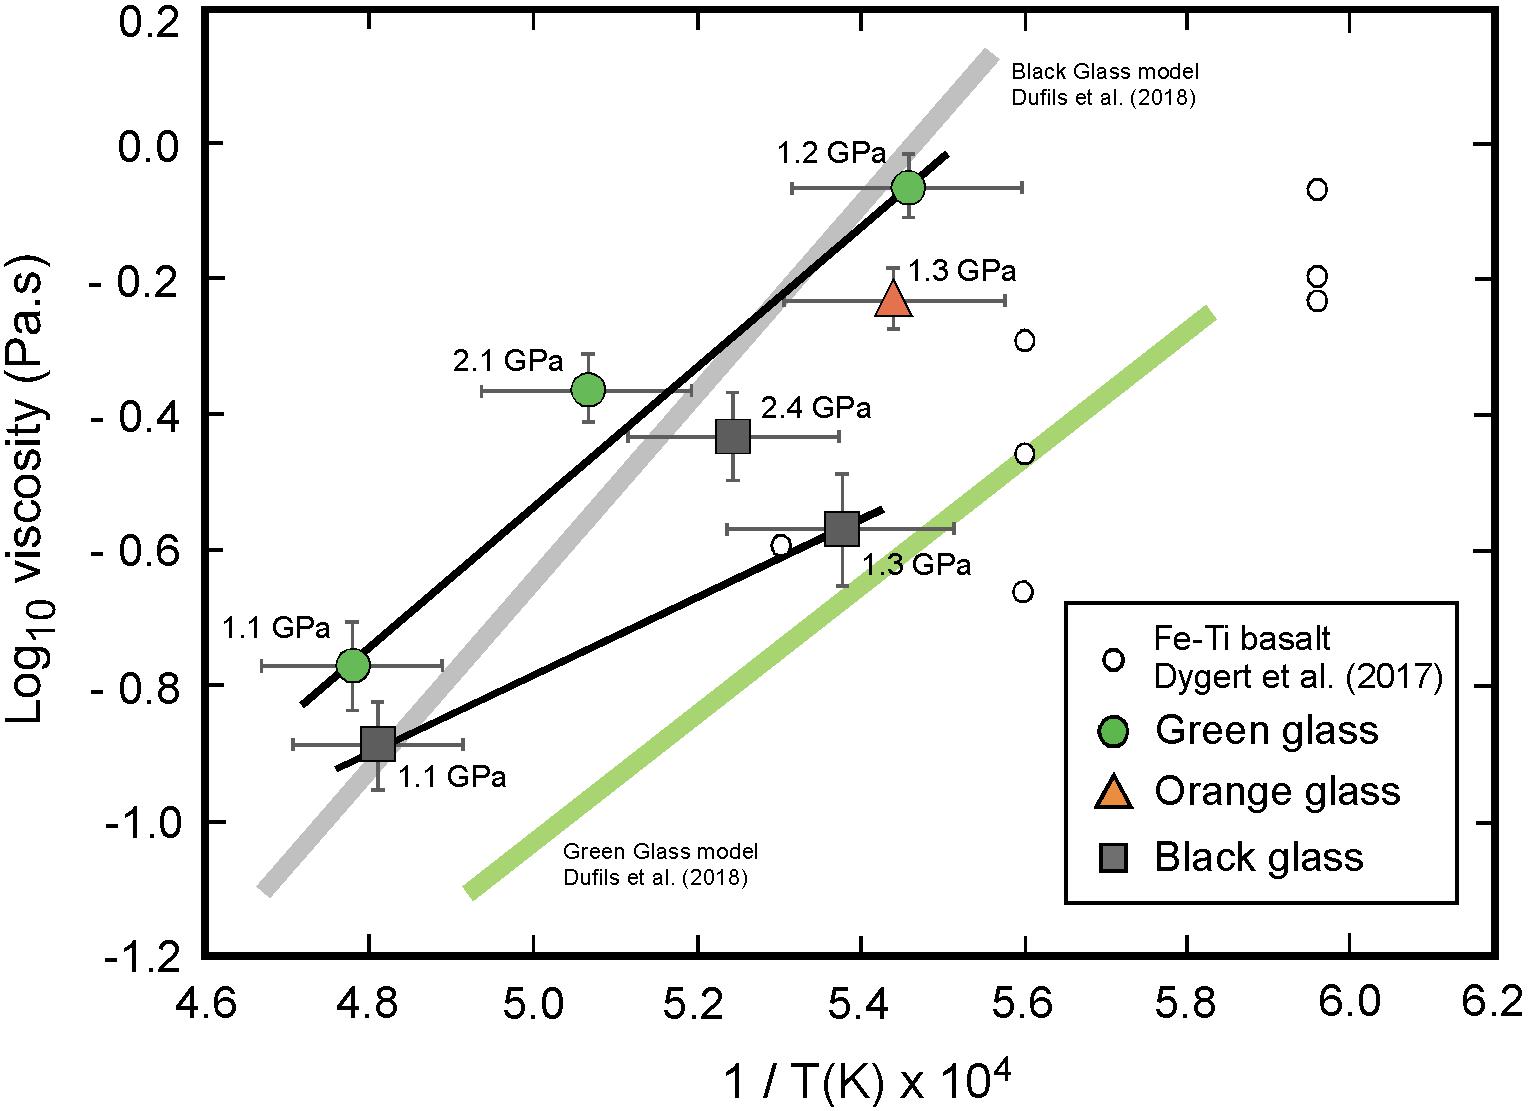
Figure 5. Experimentally determined viscosities as a function of temperature for the green (circles), orange (triangles), and black (squares) glass compositions. In this high-temperature region, the green and black glasses exhibit Arrhenian behavior with activation energies (Ea) determined from a linear fit to data using Eq. 4. Experimental data from Dygert et al. (2017) for a Fe-Ti lunar basalt are also shown, as well as the models of Dufils et al. (2018) for green and black glasses compositions.
These activation energies suffer from significant uncertainties because of the limited dataset; however, they are in agreement with activation energies for viscous flow determined experimentally at high-temperature (T > 1600 K) and ambient pressure for a variety of silicate melts (Mysen and Richet, 2005). For example, Liebske et al. (2005) measured an activation energy Ea = 197 kJ/mol for a peridotite liquid. For Ti-bearing ferrobasaltic melts, Chevrel et al. (2014) reported Ea = 179 kJ/mol for a 1.1 wt% TiO2 and 20.36 wt% FeO composition, and Dygert et al. (2017) derived Ea = 153 kJ/mol for a 4.1 wt% TiO2 and 29,9% FeO liquid. For lunar mare basalt compositions, the high-temperature data of Uhlmann et al. (1974) on a synthetic Apollo15 green glass showed Ea = 167 kJ/mol, and the more recent experimental measurements by Sehlke and Whittington (2016) on a high-Ti (9.54 wt% TiO2) sample produced Ea = 165 kJ/mol. The present activation energy for the green glass Ea = 201 ± 26 kJ/mol is also consistent with the value of Ea = 180 kJ/mol recently estimated by Dufils et al. (2018) using molecular dynamics simulation on a similar green glass (A15G) composition.
As for temperature, the pressure dependence of melt viscosity can be described by an Arrhenian behavior:
where η0,P is the zero pressure viscosity, and V∗ the activation volume of viscous flow. Experimentally determined viscosities as a function of pressures are reported in Figure 6. To evaluate the variation of melt viscosity with pressure at constant temperature, we have interpolated viscosity data using the above Arrhenius parameters Ea and logη0,T to common isotherms T = 1980 K and T = 1906 K, for the green and black glass respectively. Both isotherms show a linear variation of logη with pressure, with best fitted parameters of linear regression V∗ = 2.2 ± 2 cm3/mol – logη0,P = -0.5 ± 0.1 Pa-s for the green glass, and V∗ = 5.9 ± 2 cm3/mol – logη0,P = -0.8 ± 0.1 Pa-s for the black glass (Figure 6). Previous studies found the pressure-viscosity relationship to depend on the degree of polymerization of the melt (for a review see, Wang et al., 2014). While viscosities of depolymerized melts (NBO/T > 2) increase monotonically with pressure, those of polymerized melts (NBO/T < 1) initially decrease with pressure, defining a viscosity minimum. For example, Liebske et al. (2005) found a positive activation volume V∗ = 4.9 cm3/mol for peridotite liquid (NBO/T ≈ 2.5) in the 0–7 GPa range. In contrast, for liquid basalt (NBO/T ≈ 0.8) Sakamaki et al. (2013) observed a decrease up to 4 GPa following an activation volume of V∗ = -5.1 cm3/mol. For the high-Ti black glass composition of our study with NBO/T ≈ 1.6, the positive values of V∗ imply an increase of viscosity by a factor of ∼1.5 between 1.1 and 2.4 GPa. This minor increase in pressure is consistent with the free-volume theory, and with predictions from MD simulations (Dufils et al., 2018) on green (A15G), orange (A17O), and black (A14B) glass compositions.
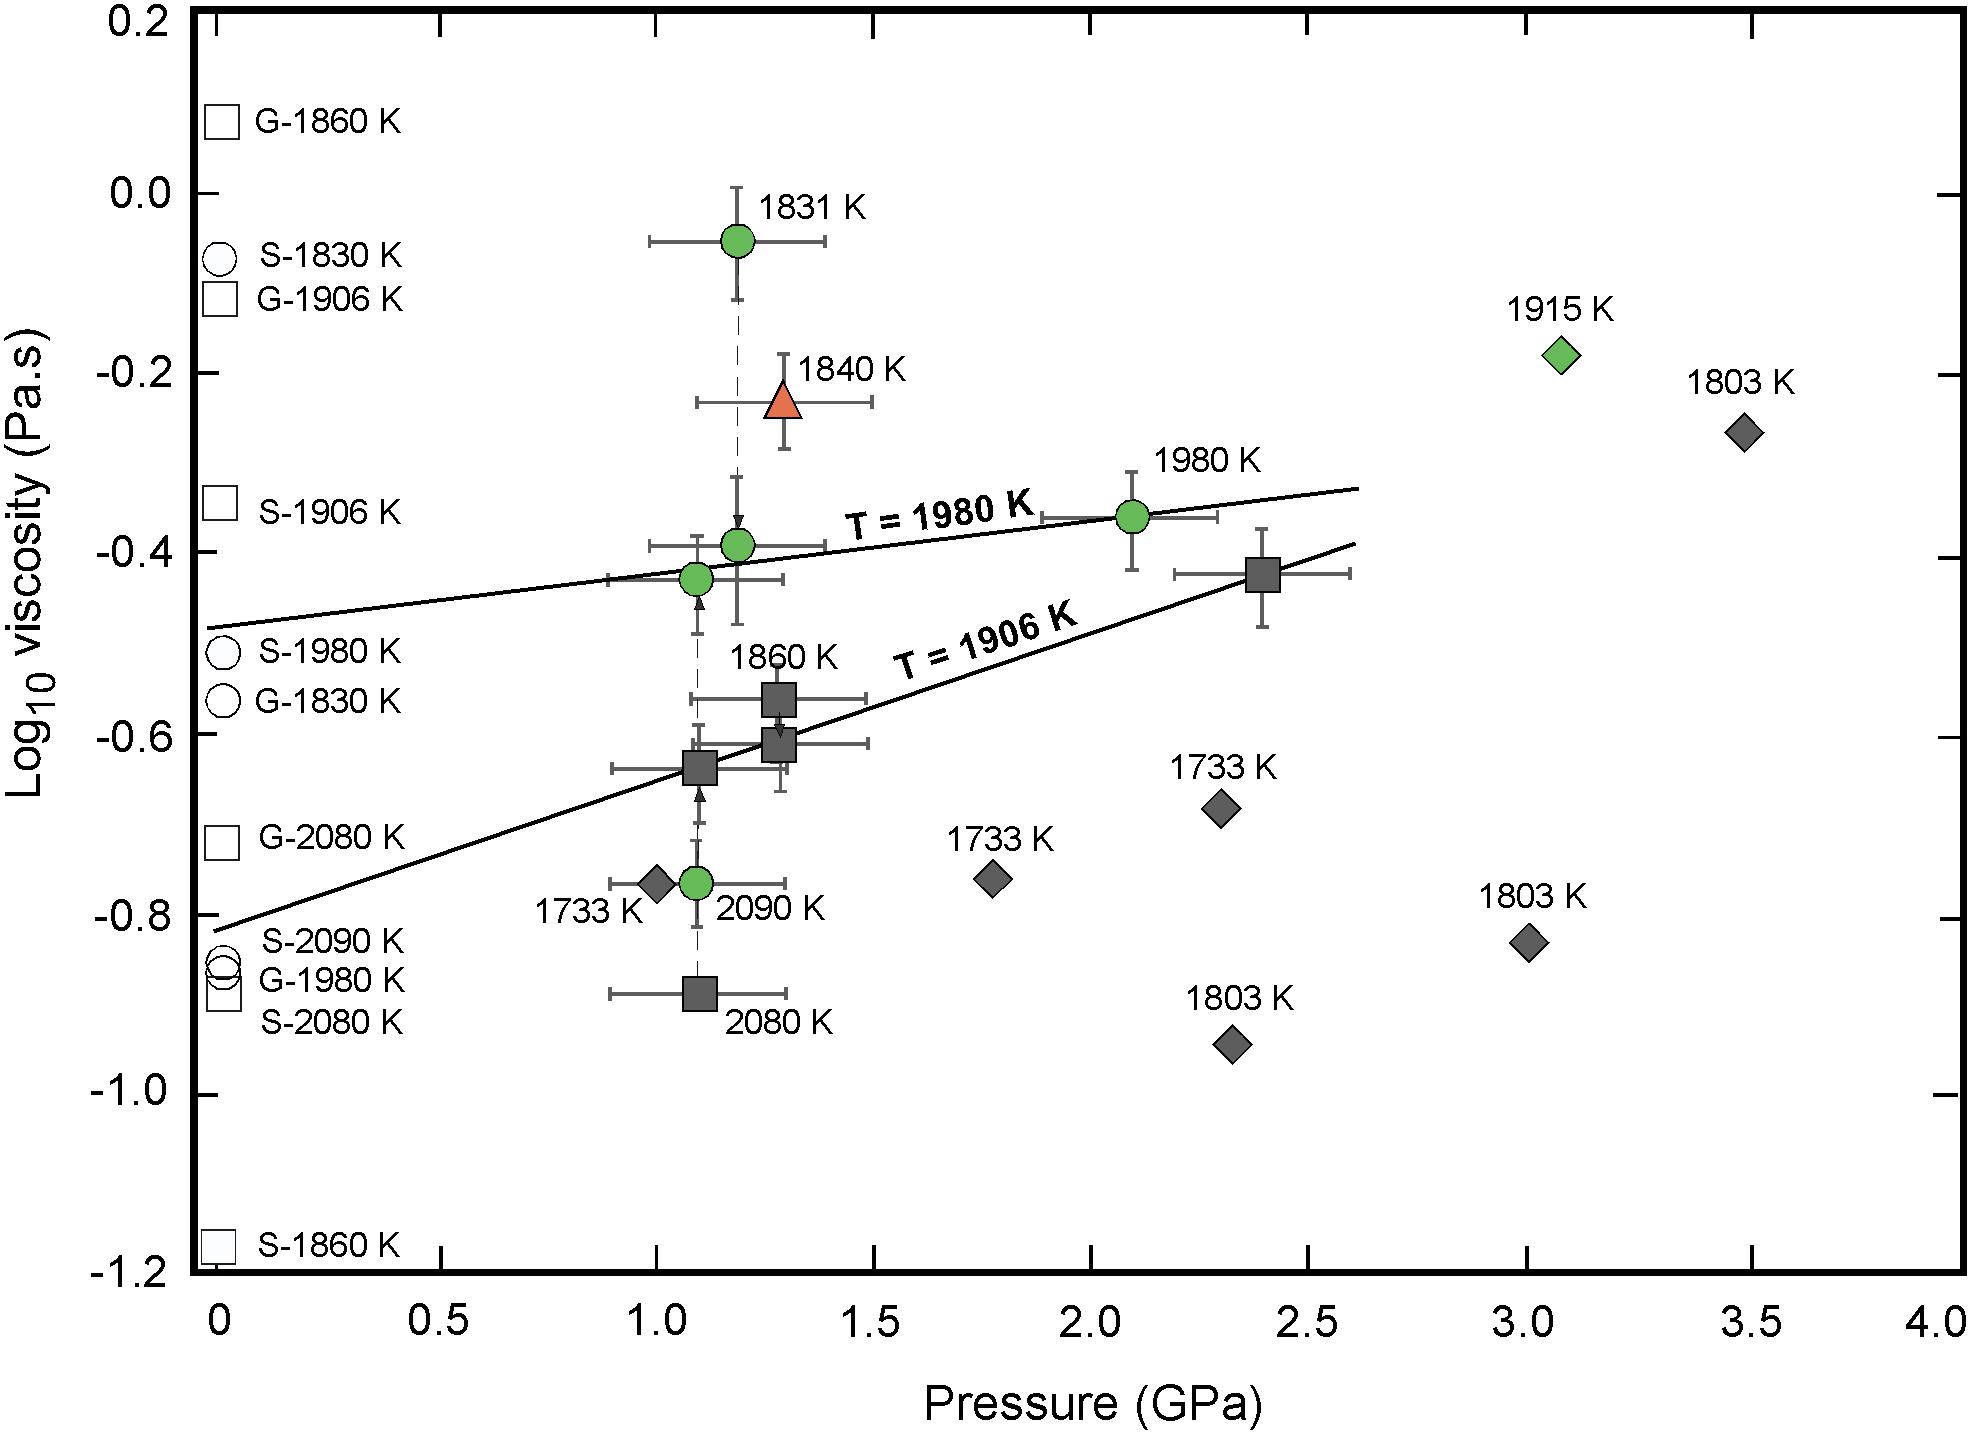
Figure 6. Pressure dependence of viscosity for the green (circles) orange (triangles), and black (squares) lunar melts. The viscosities increase steadily between 1.1 and 2.4 GPa. The activation volume (V∗) of viscous flow for the green and black glasses were calculated along the 1980 and 1906 K isotherms, respectively, by fitting experimental data to Eq. 5. Literature data from Maeda et al. (2004; green diamond), Suzuki et al. (2009; black diamonds) are shown for comparison, as well as model predicted viscosity values at 1 atm and high-temperature by Giordano et al. (2008) and Sehlke and Whittington (2016) for the green (empty circles) and black (empty squares) glasses.
Equations 4 and 5 can be used to predict viscosity values at common P-T conditions, enabling isolation of melt compositional effects. In Figure 7 the viscosities of green, orange, and black glass melts at their respective melting temperatures (Tm) at ∼1.2–1.3 GPa are plotted against their TiO2/(TiO2 + SiO2) contents. Also reported are the viscosity data of samples G2, O1, and B1A corrected to a common pressure – temperature point of 1.3 GPa and 1840 K, close to the experimentally investigated conditions. While the viscosities of low-Ti and high-Ti magmas at their respective liquidi are very close, under similar temperature conditions, the viscosity of the green glass melt is found to be the highest, the orange glass melt having an intermediate value and black glass melt with the highest Ti content being least viscous. Quantitatively, our data suggest a viscosity decrease by a factor of ∼3 from low-Ti to high-Ti lunar magma at identical P-T conditions.
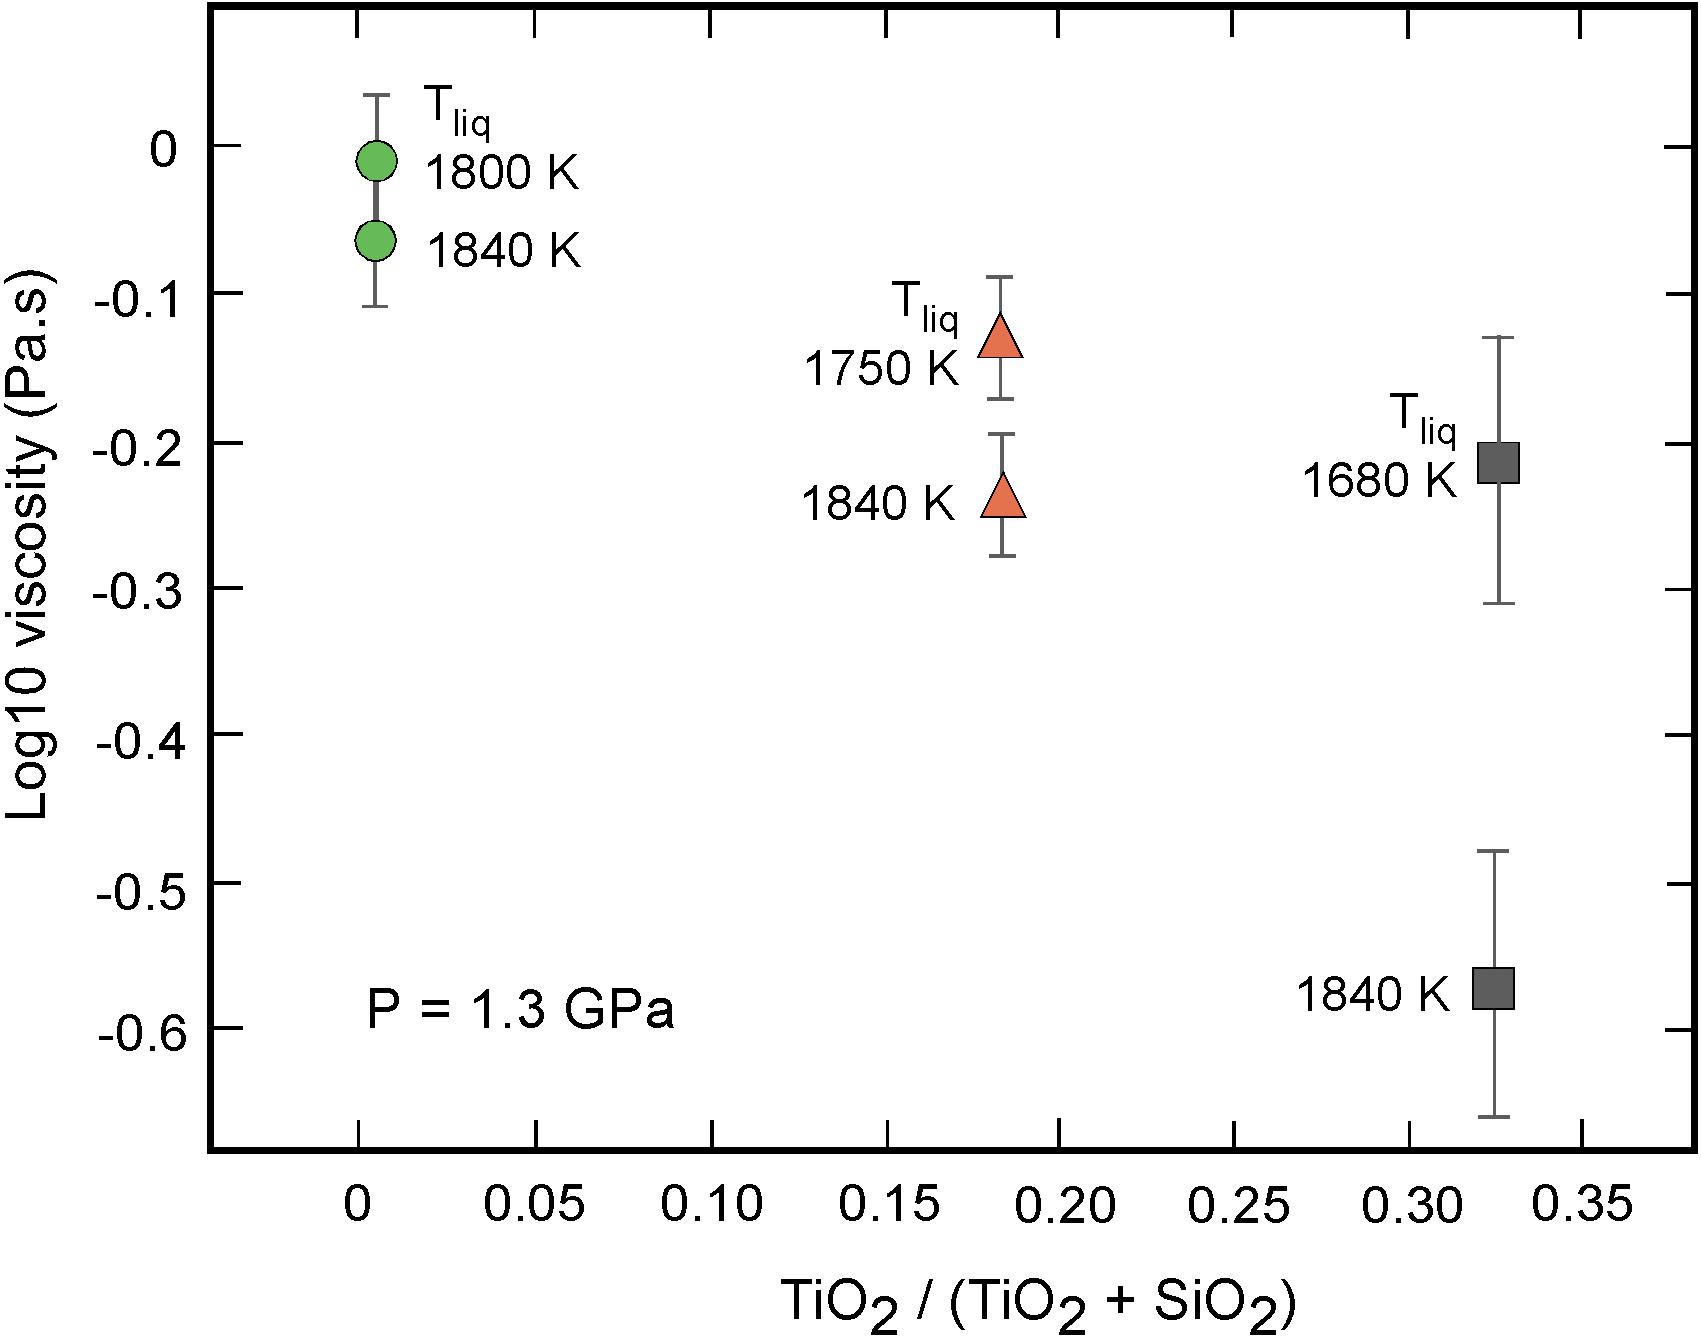
Figure 7. The viscosity of lunar melts as a function of the titanium content TiO2/(TiO2 + SiO2). To asses melt compositional effects, experimental viscosity data of samples G2, O1, and B1A were extrapolated to (i) their respective liquidus temperatures at 1.3 GPa, and to (ii) a common pressure – temperature of 1.3 GPa – 1840 K using the present Arrhenius parameters. At similar P-T conditions, the viscosity is found to significantly decrease with the Ti content.
At first sight, this compositional dependence may seem unexpected since titanium is generally considered to be a network former, in which case increasing amounts of TiO2 in silicate melts would make it more polymerized and hence more viscous (Mysen et al., 1980). However, the structural role of titanium in silicate melts has previously been found to be complex, with more than one structural position of Ti4+ and possible variations in coordination (Mysen and Richet, 2005). Hence, physical properties such as melt viscosities are a complex function of chemical composition and temperature. Dingwell (1992) measured the shear viscosities of titanium silicate liquids in the CaSiO3-TiO2 and Na2SiO3-TiO2 systems, and reported a decrease in viscosity with the addition of TiO2. Experimental studies on titanium-bearing slags (Zhang and Jahanshahi, 2004) also showed that the addition of TiO2 and Ti2O3 resulted in a significant decrease in viscosity, similar to our findings. Dygert et al. (2013) reached the same conclusions for lunar picritic melts based on the abundance of quench growth textures in Ti-rich melts relative to their low-Ti counterparts. This compositional dependence is however not reproduced in MD simulations (Dufils et al., 2018) which reflects the difficulty to capture the complex structural effect of Ti in models.
Several hypotheses have been proposed to explain this dependence. The substitution of Si by Ti in tetrahedral sites probably makes Ti-O-Ti bonds weaker than Si-O-Al and Si-O-Si bonds, because the Ti cation is larger than that of Si (Mysen et al., 1980); and could lead to the observed melt viscosity to decrease with increasing TiO2 content. Moreover, increasing the TiO2 content of the melt, a significant proportion of Ti4+ cations can be coordinated with more than four oxygens, forming Ti[5] or Ti[6] polyhedra (Dickinson and Hess, 1985; Henderson and Fleet, 1995). Such an increase in coordination number would reduce the degree of polymerization and hence viscosity. Dygert et al. (2013) proposed that the addition of TiO2 in these lunar silicate melts leads to the formation of regions enriched in Fe-O-Ti complexes, effectively depolymerizing the melt. Interestingly, the X-ray intensity scattered by the present molten glasses (Supplementary Figure S1) displays a change in the first sharp diffraction peak (FSDP) position as a function of composition. The position of the FSDP is shifted to higher Q with increasing Ti content (where Q = 4πsinθ/λ is the momentum transfer, θ the half scattering angle, and λ the wavelength). The FSDP is generally accepted to be related to intermediate-range order (IRO) of the network (Salmon, 1994; Inamura et al., 2004). Hence, the observed FSDP shift argues for a more closely packed IRO of the black glass relative to the green one, which would agree with the more depolymerized and less viscous character of these Ti-rich lunar magmas. A definitive answer on the origin of the observed Ti viscosity dependence would require thorough additional experimental investigations and/or numerical modeling of the structural effects of Ti incorporation in silicate liquids.
Comparison With Previous Work and Model Predictions
The first viscosity measurements on lunar lavas were performed soon after the Apollo missions in the early seventies (Murase and McBirney, 1970; Weill et al., 1971; Uhlmann et al., 1974). These early works already outlined the lower viscosity of Ti-bearing lavas relative to terrestrial basalts (Hawaii, Columbia River Basalts). Uhlmann et al. (1974) reported a 1 atm viscosity for molten Apollo 15 green glass of η = 1.07 Pa-s at 1785 K, and Murase and McBirney (1970) obtained η = 0.6 Pa-s for molten Apollo 11 orange glass at 1773 K – 1 atm. For comparison with our high-temperature-pressure data, the 1 atm measurement of Uhlmann et al. (1974) was extrapolated to T = 1980 K using the Ea for green glass derived in this study, and then compared with the one extrapolated at ambient P along the 1980 K isotherm in Figure 6. The corrected Uhlmann et al. (1974) viscosity η = 0.54 Pa-s is higher than the one derived from our data η = 0.33 Pa-s; however the difference is not unacceptable considering experimental uncertainties. Recently, Sehlke and Whittington (2016) measured the 1 atm viscosity of a synthetic high-Ti lunar basalt (LM sample, 9.52 wt% TiO2), and obtained η = 0.19 Pa-s at 1850 K, which extrapolates to η = 0.14 Pa-s at 1906 K. This value is again close to our present estimate for black glass composition η = 0.15 Pa-s at 1 atm – 1906 K. Dygert et al. (2017) reported a viscosity of η = 0.22–1.45 Pa-s at experimental conditions, 1573–1873 K and 0.1–4.4 GPa, for a late Lunar Magma Ocean (LMO) analog. Although a direct comparison cannot be made because the composition of the late LMO (Fe- and Ti-rich ferrobasalt) is quite different from the present primitive lunar melts, both studies point to very low viscosities for these lunar melts.
Owing to experimental difficulties, published data on the viscosity of primitive lunar melts at high P-T conditions are scarce. The only literature data are a single viscosity point for the green glass composition at 3.1 GPa and 1915 K by Maeda et al. (2004), and six viscosity points for the black glass composition measured by Suzuki et al. (2009) in the 1733–1803 K and 1.0–3.5 GPa range. These data are plotted in Figure 6 for comparison with the present measurements. The single green glass viscosity η = 0.64 Pa-s from Maeda et al. (2004) at 3.1 GPa and 1915 K is higher than the value η = 0.43 Pa-s measured through our measurement at 2.1 GPa, confirming the viscosity increase with pressure under isothermal conditions. For the black glass composition, viscosity data of Suzuki and colleagues exhibit a positive activation energy Ea = 240 kJ/mol (calculated from their 1703 and 1833 K measurements at 2.3 GPa) and an increase with pressure from η = 0.11 Pa-s at 2.3 GPa to η = 0.58 Pa-s at 3.5 GPa and 1803 K. Reported viscosities for these high Ti-bearing glasses are lower than those presently measured for the green and orange glass compositions (Figure 6), in agreement with our findings of a viscosity decrease with increasing Ti content. However, their absolute viscosities are significantly lower than measured in this study, and cannot be reconciled with our data even considering the large experimental uncertainties. Both glasses have a similar chemistry (i.e., Apollo 14 black glass) so that compositional effects can be ruled out, suggesting experimental inconsistencies between both studies. In this context, we note that the Suzuki and colleagues measurements are also significantly lower than the MD simulations by Dufils et al. (2018) performed on a similar Apollo 14 black glass composition. We are confident about the observed differences between measurements performed on different compositions, because our results were all obtained using an identical experimental and analytical technique.
Several empirical models have been proposed to predict silicate melt viscosities as a function of chemical composition and temperature (Bottinga and Weill, 1972; Giordano and Dingwell, 2003; Hui and Zhang, 2007; Giordano et al., 2008; Sehlke and Whittington, 2016). These models are based on experimental measurements done on natural terrestrial and some planetary compositions and their synthetic analogs at atmospheric pressure (Hui and Zhang, 2007; Giordano et al., 2008). Figure 6 and Table 2 show a comparison of the experimentally measured viscosities for the green, orange and black glass compositions to the viscosity values predicted by the empirical model of Giordano et al. (2008) and Sehlke and Whittington (2016) based on composition and temperature at ambient pressure. For comparison we also extrapolated our high-pressure data to 1 atm using the Arrhenius relationship (Figure 6), although these low pressure estimates are actually very dependent on the uncertainty on the activation volume V∗. The green glass model predicted viscosity by Giordano et al. (2008) at 1980 K falls significantly below our extrapolated value at 1 atm., while the Sehlke and Whittington (2016) model better reproduce the experimental data. However, for the orange and black glasses we find that both model values are significantly higher than the experimentally measured viscosity values. This overestimation of viscosities is higher for the black glass than the orange glass, and reflects the prediction of the models of increasing viscosity with increasing TiO2 content of the melt, contrary to our experimental observations.
This shows that empirical models that can successfully predict the viscosities of a wide range of hydrous and anhydrous terrestrial compositions cannot be extrapolated to predict viscosities of Ti rich lunar melts. This could be due to reasons that include (1) the TiO2 content of the black and orange glasses are out of the range of compositions on which this model is based upon and (2) our viscosity measurements were done at high pressure conditions whereas models are based on 1 atm data. Considering the recent identification of significant amount of water in the source of several basaltic lunar magmas (Hauri et al., 2011, 2015; Hui et al., 2013; Saal et al., 2013), there is a clear need for more experimental data on melt viscosity determinations on lunar compositions including the effect of H2O and other volatile species.
Implications for Lunar Evolution
Primitive lunar melts occur as basaltic flows filling impact basins and as picritic glass beads erupted in lava fountains. These volcanic rocks have crystallization ages typically between 3900 and 3200 Ma, and have been sourced from deep silicate reservoirs in the lunar mantle generated during the LMO crystallization (e.g., Grove and Krawczynski, 2009). Petrogenetic models account for their elevated Ti abundances by either invoking a hybrid source produced by mixing late-stage ilmenite-pyroxene cumulates of the LMO with low-Ti rocks during a mantle overturn (Ringwood and Kesson, 1976; Hess and Parmentier, 1995), or by assimilation of Fe-Ti oxides in picritic glass melts as they migrate to the surface (Hubbard and Minear, 1975; Wagner and Grove, 1997). The combination of inferred deep formation (i.e., 200–500 km) and observed high titanium and iron contents begs the question of mobility of these primitive melts relative to their sources rocks. Gravity-driven transportation of magmatic liquids within a planetary interior is proportional to hydrostatic melt mobility Δρ/η, where Δρ is the density contrast between the magmatic liquid and the surrounding solid silicate and η the viscosity of the melt (Kono et al., 2014). Since current viscosity prediction models are not applicable to lunar melt compositions at non-ambient pressures, it becomes crucial that only relevant input values determined through experimental measurements are used in lunar interior evolution models. By looking at different bulk compositions our data provide insight into the first-order effects of titanium on melt physical properties. Calculating values for melt densities from EoS and the lunar mantle density profile from van Kan Parker et al. (2012), and using the viscosity values derived from this work, we find that under identical conditions of P-T (1.3 GPa, 1840 K), the black glass melt would exhibit maximum mobility (1.64 g cm-3 Pa-1s-1), the orange glass melt would show intermediate mobility (0.9 g cm-3 Pa-1s-1) and the green glass melt would show lowest mobility (0.62 g cm-3 Pa-1s-1). This suggests that the low buoyancy of high-Ti melts relative to the Moon’s interior density profile is counterbalanced by their very low viscosity, enabling their rise through the lunar mantle. Additionally, these very high melt mobilities, much higher compared to terrestrial basaltic lavas (Sato, 2005; Villeneuve et al., 2008; Sakamaki et al., 2013), would lead to fast migration rates of these picritic glasses. Rapid magma ascent would affect the extent of chemical reaction (i.e., assimilation, fractionation) of magmas with cumulate piles during their route to the surface, and also aid final eruption through the anorthosite crust.
Conclusion
We have presented the first comprehensive experimentally measured viscosity of pristine lunar melts that span a range of TiO2 contents from 0.26 to 16.4 wt%, showing that viscosity is a complex function of chemical composition under high pressure and high temperature conditions. We find an Arrhenian dependence of lunar melt viscosities on temperature, and an increase in viscosity with pressure for these intermediate polymerized melts. We also show that there can be a substantial change in lunar melt viscosities with changing TiO2 content of the melt.
The possibility of linking viscosity variations to local melt structure variations paves the way to comprehensive structural models of magma viscosity. We find that experimentally derived viscosity coefficients for the lunar glasses are lower than those reported for terrestrial basalts. Such low viscosities would be consistent with thin and extensive lunar lavas flows as observed (Head, 1976). We also find significant differences between the experimentally derived values and model predicted values, which underlines the need for a systematic experimental determination of viscosities of lunar melts under relevant high P-T conditions. In spite of recent development of empirical viscosity models for terrestrial compositions, there is still a need for a more extensive model that would also be applicable to terrestrial silicate melts for a range of temperature and pressure conditions.
Author Contributions
NR, J-PP, and WvW designed the project, analyzed the results, and wrote the manuscript with input from all authors. All authors performed the experiments.
Funding
This work was funded through a Netherlands Space Office/Netherlands Organisation for Scientific Research Planetary Science User Support Programme grant and Vici grant to WvW.
Conflict of Interest Statement
The authors declare that the research was conducted in the absence of any commercial or financial relationships that could be construed as a potential conflict of interest.
Acknowledgments
We acknowledge the European Synchrotron Radiation Facility for the allocation of beamtime, and Alexander Sehlke for providing an excel spreadsheet of its configurational entropy model for the viscosity of planetary melts.
Supplementary Material
The Supplementary Material for this article can be found online at: https://www.frontiersin.org/articles/10.3389/feart.2019.00094/full#supplementary-material
FIGURE S1 | X-ray intensity scattered by the green, orange, and black molten glasses under similar conditions of 1.2 ± 0.2 GPa and 1850 ± 50 K. The first sharp diffraction peak (FSDP) position is shifted to higher Q with increasing Ti content.
References
Ahrens, T. J., and Johnson, M. L. (1995). “Shock wave data for minerals,” in Mineral Physics and Crystallography: A Handbook of Physical Constants, ed. T. J. Ahrens (Washington, DC: American Geophysical Union), 143–183.
Borg, L. E., Connelly, J. N., Boyet, M., and Carlson, R. W. (2011). Chronological evidence that the moon is either young or did not have a global magma ocean. Nature 477, 70–72. doi: 10.1038/nature10328
Bottinga, Y., and Weill, D. (1972). The viscosity of magmatic silicate liquids: a model for calculation. Am. J. Sci. 272, 438–475 doi: 10.2475/ajs.272.5.438
Carter, L. M., Campbell, B. A., Hawke, B. R., Campbell, D. B., and Nolan, M. C. (2009). Radar remote sensing of pyroclastic deposits in the southern mare serenitatis and mare vaporum regions of the moon. J. Geophys. Res. Planets 114:E11004. doi: 10.1029/2009JE003406
Charlier, B., Grove, T. L., Namur, O., and Holtz, F. (2018). Crystallization of the lunar magma ocean and the primordial mantle-crust differentiation of the moon. Geochim. Cosmochim. Acta 234, 50–69. doi: 10.1016/j.gca.2018.05.006
Chevrel, M. O., Baratoux, D., Hess, K.-U., and Dingwell, D. B. (2014). Viscous flow behavior of tholeiitic and alkaline Fe-rich martian basalts. 124, 348–365. doi: 10.1016/j.gca.2013.08.026
Cuk, M., and Stewart, S. T. (2012). Making the moon from a fast-spinning earth: a giant impact followed by a resonant despinning. Science 338:1047. doi: 10.1126/science.1225542
de Vries, J., van den Berg, A., and van Westrenen, W. (2010). Formation and evolution of a lunar core from ilmenite-rich magma ocean cumulates. Earth Planet. Sci. Lett. 292, 139–147. doi: 10.1016/j.epsl.2010.01.029
Delano, J. W. (1986). Pristine lunar glasses – Criteria, data, and implications. J. Geophys. Res. 91, 201–213. doi: 10.1029/jb091ib04p0d201
Dickinson, J. E., and Hess, P. C. (1985). Rutile solubility and titanium coordination in silicate melts. Geochim. Cosmochim. Acta 49, 2289–2296. doi: 10.1016/0016-7037(85)90229-7
Dingwell, D. B. (1992). Density of some titanium-bearing silicate liquids and the composition-dependence of the partial molar volume of TiO2. Geochim. Cosmochim. Acta 56, 3403–3407. doi: 10.1016/0016-7037(92)90387-x
Dufils, T., Sator, N., and Guillot, B. (2018). Properties of planetary silicate melts by molecular dynamics simulation. Chem. Geol. 493, 298–315. doi: 10.1016/j.chemgeo.2018.06.003
Dygert, N., Liang, Y., and Hess, P. (2013). The importance of melt TiO2 in affecting major and trace element partitioning between Fe-Ti oxides and lunar picritic glass melts. Geochim. Cosmochim. Acta 106, 134–151. doi: 10.1016/j.gca.2012.12.005
Dygert, N., Lin, J. F., Marshall, E. W., Kono, Y., and Gardner, J. E. (2017). A low viscosity lunar magma ocean forms a stratified anorthitic flotation crust with mafic poor and rich units. Geophys. Res. Lett. 44, 282–211. doi: 10.1002/2017GL075703
Elardo, S. M., Draper, D. S., and Shearer, C. K. (2011). Lunar magma ocean crystallization revisited: bulk composition, early cumulate mineralogy, and the source regions of the highlands Mg-suite. Geochim. Cosmochim. Acta 75, 3024–3045. doi: 10.1016/j.gca.2011.02.033
Elkins-Tanton, L. T. (2008). Linked magma ocean solidification and atmospheric growth for Earth and Mars. Earth Planet. Sci. Lett. 271, 181–191. doi: 10.1016/j.epsl.2008.03.062
Elkins-Tanton, L. T., Burgess, S., and Yin, Q. Z. (2011). The lunar magma ocean: reconciling the solidification process with lunar petrology and geochronology. Earth Planet. Sci. Lett. 304, 326–336. doi: 10.1016/j.epsl.2011.02.004
Elkins-Tanton, L. T., Chatterjee, N., and Grove, T. L. (2003a). Experimental and petrological constraints on lunar differentiation from the Apollo 15 Green picritic glasses. Meteorit. Planet. Sci. 38, 515–527. doi: 10.1111/j.1945-5100.2003.tb00024.x
Elkins-Tanton, L. T., Parmentier, E. M., and Hess, P. C. (2003b). Magma ocean fractional crystallization and cumulate overturn in terrestrial planets: implications for Mars. Meteorit. Planet. Sci. 12, 1753–1771. doi: 10.1111/j.1945-5100.2003.tb00013.x
Faxen, H. (1925). Gegenseitige einwirkung zweier kugelen, die ineiner zähen flüssigkeit fallen. Arkiv Mat. Astron. Fysik 19, 1–8.
Fei, Y. W., Li, J., Hirose, K., Minarik, W., Van Orman, J., Sanloup, C., et al. (2004). Critical evaluation of pressure scales at high temperatures by in situ X-ray diffraction measurements. Phys. Earth Planet. Int. 143, 515–526. doi: 10.1016/s0031-9201(04)00085-8
Garcia, R. F., Gagnepai Beyneix, J., Chevrot, S., and Lognonné, P. (2011). Very preliminary reference moon model. Phys. Earth Planet. Int. 188, 96–113. doi: 10.1016/j.pepi.2011.06.015
Giguere, T. A., Taylor, G. J., Hawke, B. R., and Lucey, P. G. (2000). The titanium contents of lunar mare basalts. Meteor. Planet. Sci. 35, 193–200. doi: 10.1111/j.1945-5100.2000.tb01985.x
Giordano, D., and Dingwell, D. B. (2003). Non-arrhenian multicomponent melt viscosity: a model. Earth Planet. Sci. Lett. 208, 337–349. doi: 10.1016/s0012-821x(03)00042-6
Giordano, D., Russell, J. K., and Dingwell, D. B. (2008). Viscosity of magmatic liquids: a model. Earth Planet. Sci. Lett. 271, 123–134. doi: 10.1016/j.epsl.2008.03.038
Grove, T. L., and Krawczynski, M. J. (2009). Lunar mare volcanism: where did the magmas come from? Element 5, 29–34. doi: 10.2113/gselements.5.1.29
Hammersley, A. P., Svensson, S. O., Hanfland, M., Fitch, A. N., and Häusermann, D. (1996). Two-dimensional detector software: from real detector to idealized image or two-theta scan. High Press. Res. 14, 235–248. doi: 10.1080/08957959608201408
Hauri, E. H., Saal, A. E., Rutherford, M. J., and van Orman, J. A. (2015). Water in the moon’s interior: truth and consequences. Earth Planet. Sci. Lett. 409, 252–264. doi: 10.1016/j.epsl.2014.10.053
Hauri, E. H., Weinreich, T., Saal, A. E., Rutherford, M. C., and Van Orman, J. A. (2011). High pre-eruptive water contents preserved in lunar melt inclusions. Science 333, 213–215. doi: 10.1126/science.1204626
Head, J. W. III. (1976). Lunar volcanism in space and time. Rev. Geophys. 14, 265–300. doi: 10.1029/RG014i002p00265
Henderson, G. S., and Fleet, M. E. (1995). The structure of Ti-silicate glasses by micro-raman spectrocopy. Can. Mineral. 33, 399–408.
Herbert, F., Drake, M. J., Sonett, C. P., and Wiskerchen, M. J. (1977). “Some constraints on the thermal history of the lunar magma ocean,” in Proceedings of the Lunar Planetary Science Conference (New York, NY: Pergamon Press), 573–582.
Hess, P. C., and Parmentier, E. M. (1995). A model for the thermal and chemical evolution of the moon’s interior: implications for the onset of mare volcanism. Earth Planet. Sci. Lett. 134, 501–514. doi: 10.1016/0012-821x(95)00138-3
Hubbard, N. J., and Minear J. W. (1975). “ (New York, NY: Pergamon Press, Inc.), . doi: 10.1016/0012-821x(95)00138-3
Hui, H., Peslier, A. H., Zhang, Y., and Neal, C. R. (2013). Water in lunar anorthosites and evidence for a wet early moon. Nat. Geosci. 6, 177–180. doi: 10.1038/ngeo1735
Hui, H., and Zhang, Y. (2007). Toward a general viscosity equation for natural anhydrous and hydrous silicate melts. Geochim. Cosmochim. Acta 71, 403–416. doi: 10.1016/j.gca.2006.09.003
Inamura, Y., Katayama, Y., Utsumi, W., and Funakoshi, K. (2004). Transformations in the intermediate-range structure of SiO2 glass under high pressure and temperature. Phys. Rev. Lett. 93:015501. doi: 10.1103/PhysRevLett.93.015501
Jutzi, M., and Asphaug, E. (2011). Forming the lunar farside highlands by accretion of a companion moon. Nature 476, 69–72. doi: 10.1038/nature10289
Kanzaki, M., Kurita, K., Fuji, T., Kato, T., Shimomura, O., and Akimoto, S. (1987). “A new technique to measure viscosity and density of silicate melts at high pressure,” in High Pressure Research in Mineral Physics, eds M. H. Manghnani and Y. Syono (Washington, DC: American Geophysical Union), 195–200. doi: 10.1029/gm039p0195
Kono, Y., Kenney-Benson, C., Hummer, D., Ohfuji, H., Park, C., Shen, G., et al. (2014). Ultralow viscosity of carbonate melts at high pressures. Nat. Commun. 5L:5091. doi: 10.1038/ncomms6091
Le Godec, Y., Martinez-Garcia, D., Mezouar, M., Syfosse, G., Itie, J. P., and Besson, J. M. (2000). Thermoelastic behaviour of hexagonal graphite-like boron nitride. High Press. Res. 17, 35–46. doi: 10.1080/08957950008200304
Liebske, C., Schmickler, B., Terasaki, H., Poe, B. T., Suzuki, A., Funakoshi, K., et al. (2005). Viscosity of peridotite liquid up to 13 GPa: implications for magma ocean viscosities. Earth Planet. Sci. Lett. 240, 589–604. doi: 10.1016/j.epsl.2005.10.004
Lin, Y. H., Troche, E. J., Steenstra, E. S., and van Westrenen, W. (2017a). Evidence for an early wet Moon from experimental crystallization of the lunar magma ocean. Nat. Geosci. 10, 14–18. doi: 10.1038/NGEO2845
Lin, Y. H., Tronche, E. J., Steenstra, E. S., and van Westrenen, W. (2017b). Experimental constraints on the solidification of a nominally dry lunar magma ocean. Earth. Planet. Sci. Lett. 471, 104–116. doi: 10.1016/j.epsl.2017.04.045
Maeda, M., Ohtani, E., Suzuki, A., Funakoshi, K., Terasaki, H., and Okada, T. (2004). Density and Viscosity of Lunar Basaltic Magma Under High Pressure. Tokyo: Japanese Geosciences Union.
Mezouar, M., Crichton, W. A., Bauchau, S., Thurel, F., Witsch, H., Torrecillas, F., et al. (2005). Development of a new state-of-the-art beamline optimized for monochromatic single-crystal and powder X-ray diffraction under extreme conditions at the ESRF. J. Synchrotron Rad. 12, 659–664. doi: 10.1107/S0909049505023216
Morard, G., Mezouar, M., Bauchau, S., Alvarez-Murga, M., Hodeau, J. L., and Garbarino, G. (2011). High efficiency multichannel collimator for structural studies of liquids and low-Z materials at high pressures and temperatures. Rev. Sci. Instrum. 82:023904. doi: 10.1063/1.3551988
Murase, T., and McBirney, A. R. (1970). Viscosity of lunar lavas. Science 167, 1491–1493. doi: 10.1126/science.167.3924.1491
Mysen, B. O. (1990). Relationships between silicate melt structure and petrologic processes. Earth Sci. Rev. 27, 281–365. doi: 10.1016/0012-8252(90)90055-z
Mysen, B. O., and Richet, P. (2005). Silicate Glasses and Melts. Amsterdam: Elsevier. doi: 10.1016/0012-8252(90)90055-z
Mysen, B. O., Virgoo, D., and Scarfe, C. M. (1980). Relations between the anionic structure and viscosity of silicate melts – A Raman spectroscopic study. Am. Min. 65, 690–710.
Perrillat, J.-P. (2008). Kinetics of high-pressure mineral phase transformations using in situ time-resolved X-ray diffraction in the Paris-Edinburgh cell: a practical guide for data acquisition and treatment. Mineral. Mag. 72, 683–695. doi: 10.1180/minmag.2008.072.2.683
Perrillat, J.-P., Mezouar, M., Garbarino, G., and Bauchau, S. (2010). In situ viscometry of high pressure melts in the Paris-Edinburgh cell: application to liquid FeS. High Press. Res. 30, 415–423. doi: 10.1080/08957959.2010.494844
Pieters, C. M., Goswami, J. N., Clark, R. N., Annadurai, M., Boardman, J., Buratti, B., et al. (2009). Character and spatial distribution of OH/H2O on the surface of the moon seen by M3 on chandrayaan-1. Science 326, 568–572. doi: 10.1126/science.1178658
Rai, N., Perrillat, J. P., Mezouar, M., Petitgirard, S., Colin, A., and van Westrenen, W. (2013). “The viscosity of lunar magmas at high pressure and temperature,” in Proceedings of the 44th Lunar and Planetary Science Conference, The Woodlands. doi: 10.1126/science.1178658
Rapp, J. F., and Draper, D. S. (2018). Fractional crystallization of the lunar magma ocean: updating the dominant paradigm. Meteorit. Planet. Sci. 53, 1432–1455. doi: 10.1111/maps.13086
Ringwood, A. E. and Kesson, S. E. (1976). “A dynamic model for mare basalt petrogenesis,” in Proceeding of the 7th Lunar and Planetary Science Conference (New York, NY: Pergamon Press, Inc.), doi: 10.1126/science.1178658
Saal, A. E., Hauri, E. H., Van Orman, J. A., and Rutherford, M. J. (2013). Hydrogen isotopes in lunar volcanic glasses and melt inclusions reveal a carbonaceous chondrite heritage. Science 340, 1317–1320. doi: 10.1126/science.1235142
Sakamaki, T., Suzuki, A., Ohtani, E., Terasaki, H., Urakawa, S., Katayama, Y., et al. (2013). Ponded melt at the boundary between the lithosphere and asthenosphere. Nat. Geosci. 6, 1041–1044. doi: 10.1038/NGEO1982
Salmon, P. S. (1994). Real space manifestation of the first sharp diffraction peak in the structure factor of liquid and glassy materials. Proc. Math. Phys. Sci. 445, 351–365. doi: 10.1098/rspa.1994.0065
Sato, H. (2005). Viscosity measurements of subliquidus magmas: 1707 basalt of Fuji volcano. J. Mineral. Petrol. Sci. 100, 133–142. doi: 10.2465/jmps.100.133
Sehlke, A., and Whittington, A. G. (2016). The viscosity of planetary tholeiitic melts: a configurational entropy model. Geochim. Cosmochim. Acta 191, 277–299. doi: 10.1016/j.gca.2016.07.027
Shaw, H. R. (1972). Viscosities of magmatic silicate liquids: an empirical method of prediction. Am. J. Sci. 272, 870–893. doi: 10.2475/ajs.272.9.870
Suckale, J., Elkins-Tanton, L. T., and Sethian, J. A. (2012). Crystals stirred up: 2. Numerical insights into the formation of the earliest crust on the Moon. J. Geophys. Res. 117:E08005. doi: 10.1029/2012JE004067
Suzuki, A., Ohtani, E., Funakoshi, K., Terasaki, H., and Kubo, T. (2002). Viscosity of albite melt at high pressure and high temperature. Phys. Chem. Min. 29, 159–165. doi: 10.1007/s00269-001-0216-4
Suzuki, A., Ohtani, E., Nishida, K., Tateyama, R., Terasaki, H., Shibazaki, Y., et al. (2009). Viscosity of lunar high Ti magma at high pressure. Photon Fact. Act. Rep. 26:178.
Tartèse, R., and Anand, M. (2013). Late delivery of chondritic hydrogen into the lunar mantle: insights from mare basalt. Earth Planet. Sci. Lett. 361, 480–486. doi: 10.1016/j.epsl.2012.11.015
Toby, B. H. (2001). EXPGUI, a graphical user interface for GSAS. Appl. Cryst. 34, 210–213. doi: 10.1107/s0021889801002242
Uhlmann, D. R., Klein, L., Kritchevsky, G., and Hopper, R. W. (1974). “The formation of lunar glasses,” in Proceedings of the Lunar Planetary Science 5th Conference (New York, NY: Pergamon Press, Inc.), 2317–2331. doi: 10.1107/s0021889801002242
van Kan Parker, M., Sanloup, C., Sator, N., Guillot, B., Tronche, E., Perrillat, J.-P., et al. (2012). Neutral buoyancy of titanium-rich melts in the deep lunar interior. Nat. Geosci. 5, 186–189. doi: 10.1038/ngeo1402
van Kan Parker, M., Sanloup, C., Tronche, E., Perrillat, J.-P., Mezouar, M., Rai, N., et al. (2010). Calibration of a diamond capsule cell assembly for in situ determination of liquid properties in the Paris-Edinburgh press. High Press. Res. 30, 332–341. doi: 10.1080/08957959.2010.484283
Villeneuve, N., Neuville, D. R., Boivin, P., Bachèlery, P., and Richet, P. (2008). Magma crystallization and viscosity: a study of molten basalts from the Piton de la Fournaise volcano (La Réunion island). Chem. Geol. 256, 242–251. doi: 10.1016/j.chemgeo.2008.06.039
Vohra, Y. K., Duclos, S. J., and Ruoff, A. L. (1987). High-pressure X-ray diffraction studies on rhenium up to 216 GPa (2.16 Mbar). Phys. Rev. B 36, 9790–9792. doi: 10.1103/physrevb.36.9790
Wagner, T. P., and Grove, T. L. (1997). Experimental constraints on the origin of lunar high-Ti ultramafic glasses. Geochim. Cosmochim. Acta 61, 1315–1327. doi: 10.1016/s0016-7037(96)00387-0
Wang, Y., Sakamaki, T., Skinner, L. B., Jing, Z., Yu, T., Kono, Y., et al. (2014). Atomistic insight into viscosity and density of silicate melts under pressure. Nat. Comm. 5:3241. doi: 10.1038/ncomms4241
Warren, P. H. (1990). Lunar anorthosites and the magma-ocean plagioclase-flotation hypothesis: importance of FeO enrichment in the parent magma. Am. Min. 75, 46–58.
Weber, R. C., Lin, P.-Y., Garnero, E. J., Williams, Q., and Lognonne, P. (2011). Seismic detection of the Lunar core. Science 331, 309–312. doi: 10.1126/science.1199375
Weill, D. F., Grieve, R. A., McCallum, I. S., and Bottinga, Y. (1971). Mineralogy-petrology of lunar samples. Microprobe studies of samples 12021 and 12022; viscosity of melts of selected lunar compositions. Proc. Lunar Conference 2, 413–430.
Wieczorek, M. A., Neumann, G. A., Nimmo, F., Kiefer, W. S., Taylor, G. J., Melosh, H. J., et al. (2013). The crust of the Moon as seen by GRAIL. Science 339, 671–675. doi: 10.1126/science.1231530
Wu, Y., Xue, B., Zhao, B., Lucey, P., Chen, J., Xu, X., et al. (2012). Global estimates of lunar iron and titanium contents from the Chang’ E-1 IIM data. J. Geophys. Res. – Planets 117:E2. doi: 10.1029/2011JE003879
Yamamoto, S., Nakamura, R., Matsunaga, T., Ogawa, Y., Ishihara, Y., Morota, T., et al. (2010). Possible mantle origin of olivine around lunar impact basins detected by SELENE. Nat. Geosci. 3, 533–536. doi: 10.1038/ngeo897
Zhang, L. and Jahanshahi, S. (2004). “Modelling viscocity of TiOx containing silicate melts,” in VII International Conference on Molten Slags Fluxes and Salts (Johannesburg: The South African Institute of Mining and Metallurgy), 51–56. doi: 10.1038/ngeo897
Zhao, Y., de Vries, J., van den Berg, A. P., Jacobs, M. H. G., van Westrenen, W. (2019). The participation of ilmenite-bearing cumulates in lunar mantle overturn. Earth Planet. Sci. Lett. 511, 1–11. doi: 10.1016/j.epsl.2019.01.022
Keywords: moon, viscosity, high-pressure, synchrotron, magmas
Citation: Rai N, Perrillat J-P, Mezouar M, Colin A, Petitgirard S and van Westrenen W (2019) In situ Viscometry of Primitive Lunar Magmas at High Pressure and High Temperature. Front. Earth Sci. 7:94. doi: 10.3389/feart.2019.00094
Received: 18 January 2019; Accepted: 15 April 2019;
Published: 30 April 2019.
Edited by:
Zhicheng Jing, Southern University of Science and Technology, ChinaReviewed by:
Chrystele Sanloup, Sorbonne Universités, FranceTatsuya Sakamaki, Tohoku University, Japan
Copyright © 2019 Rai, Perrillat, Mezouar, Colin, Petitgirard and van Westrenen. This is an open-access article distributed under the terms of the Creative Commons Attribution License (CC BY). The use, distribution or reproduction in other forums is permitted, provided the original author(s) and the copyright owner(s) are credited and that the original publication in this journal is cited, in accordance with accepted academic practice. No use, distribution or reproduction is permitted which does not comply with these terms.
*Correspondence: Jean-Philippe Perrillat, jean-philippe.perrillat@univ-lyon1.fr