Automated Electrocardiogram Analysis Identifies Novel Predictors of Ventricular Arrhythmias in Brugada Syndrome
 Gary Tse1*
  Sharen Lee2
  Andrew Li3 Dong Chang4 Guangping Li1
  Jiandong Zhou5
  Tong Liu1*
  Qingpeng Zhang5*
- 1Tianjin Key Laboratory of Ionic-Molecular Function of Cardiovascular Disease, Department of Cardiology, Tianjin Institute of Cardiology, Second Hospital of Tianjin Medical University, Tianjin, China
- 2Laboratory of Cardiovascular Physiology, Faculty of Medicine, Li Ka Shing Institute of Health Sciences, The Chinese University of Hong Kong, Hong Kong, China
- 3Faculty of Science, University of Calgary, Calgary, AB, Canada
- 4Xiamen Cardiovascular Hospital, Xiamen University, Xiamen, China
- 5School of Data Science, City University of Hong Kong, Hong Kong, China
Background: Patients suffering from Brugada syndrome (BrS) are at an increased risk of life-threatening ventricular arrhythmias. Whilst electrocardiographic (ECG) variables have been used for risk stratification with varying degrees of success, automated measurements have not been tested for their ability to predict adverse outcomes in BrS.
Methods: BrS patients presenting in a single tertiary center between 2000 and 2018 were analyzed retrospectively. ECG variables on vector magnitude, axis, amplitude and duration from all 12 leads were determined. The primary endpoint was spontaneous ventricular tachycardia/ventricular fibrillation (VT/VF) on follow-up.
Results: This study included 83 patients [93% male, median presenting age: 56 (41–66) years old, 45% type 1 pattern] with 12 developing the primary endpoint (median follow-up: 75 (Q1–Q3: 26–114 months). Cox regression showed that QRS frontal axis > 70.0 degrees, QRS horizontal axis > 57.5 degrees, R-wave amplitude (lead I) < 0.67 mV, R-wave duration (lead III) > 50.0 ms, S-wave amplitude (lead I) < −0.144 mV, S-wave duration (lead aVL) > 35.5 ms, QRS duration (lead V3) > 96.5 ms, QRS area in lead I < 0.75 Ashman units, ST slope (lead I) > 31.5 deg, T-wave area (lead V1) < −3.05 Ashman units and PR interval (lead V2) > 157 ms were significant predictors. A weighted score based on dichotomized values provided good predictive performance (hazard ratio: 1.59, 95% confidence interval: 1.27–2.00, P-value<0.0001, area under the curve: 0.84).
Conclusions: Automated ECG analysis revealed novel risk markers in BrS. These markers should be validated in larger prospective studies.
Introduction
Brugada syndrome (BrS), originally described in 1992, is an electrical disease that is associated with higher risks of life-threatening ventricular tachycardia (VT)/ventricular fibrillation (VF) and sudden cardiac death (SCD). Symptoms (1, 2), ECG markers (3) and invasive tests such as electrophysiological studies (4–6) have been used for risk stratification, but prediction remains difficult (7), especially in asymptomatic patients (8). In prior studies, ECG markers have been determined manually, but these measurements are limited by inter-observer variability and have subjective bias. By contrast, automated measurements have not been used for risk prediction, yet they may reveal useful information that is difficult to extract manually (9, 10). In this study, we extracted raw ECG data files, exported the automated measurements and tested the hypothesis a score system based on these variables can predict spontaneous VT/VF in a cohort of BrS patients.
Methods
Study Population
This retrospective study received Ethics approval from The Joint Chinese University of Hong Kong – New Territories East Cluster Clinical Research Ethics Committee and is based on datasets that have already been made available in an online repository (https://zenodo.org/record/3266172; https://zenodo.org/record/3266179; https://zenodo.org/record/3351892). The diagnosis of BrS is made based on the 2017 ACC/AHA/HRS Guideline (11), after reviewing documented patient history, and confirmed by analysis of all documented ECG by S.L. and G.T. Type 1 Brugada pattern is defined as a coved-shape ST segment with elevation of >2 mm followed by a negative T-wave, and type 2 pattern is defined as convex ST segment with >0.5 mm elevation followed by variable T-wave, resulting in a saddleback-shaped morphology (12). The study inclusion criteria were: (1) BrS diagnosis and (2) raw ECG data were available for automated ECG analysis.
Baseline Characteristics and ECG Measurements
Clinical data was extracted from electronic health records. The following baseline clinical data were collected: (1) sex; (2) age of initial Brugada pattern presentation; (3) follow-up period; (4) type of Brugada pattern and presence of fever at initial presentation; (5) family history of BrS and VF/ SCD; (6) manifestation of syncope and if present, the number of episodes; (7) manifestation of VT/VF and if present, the number of episodes; (8) sodium channel blocker challenge test and results; (9) concomitant presence of other arrhythmia; (10) implantation of ICD. Patients presented with two or more episodes of VT/VF were defined to be of high VT/VF burden. Automatically measured parameters from ECG related to the P, Q, R, S and T-wave were extracted. The full list of variables is shown in Supplementary Table 1.
Primary Outcome, Statistical Analysis, and Creation of a Score-Based System for Risk Prediction
The primary outcome was new occurrences of spontaneous VT/VF after diagnosis of BrS. The outcome was assessed by review of inpatient and outpatient case records. Cox regression was used to identify ECG variables that were significant predictors of the primary outcome. The following steps were undertaken to create a score system for risk stratification: (1) the variables related to Q, R, S and T waveforms that achieved P-values < 0.10 were identified, (2) related variables were discarded, (3) the location out of all 12 leads with the lowest P-values was selected, (4) optimum cut-off was calculated from receiver operating characteristic analysis, (5) each variable was dichotomized based on the cut-off, (6) calculation of beta coefficient and ORs for each dichotomized variable, (7) weight-adjusted score by proportion of beta coefficients and P-values.
Results
A total of 83 patients were included [93% male, median presenting age: 56 (41–66) years old] were included. The clinical characteristics of this cohort are shown in Table 1. The prevalence of an initial type 1 Brugada pattern on presentation was 45%. Twelve patients developed spontaneous VT/VF with a median follow-up of 74 (Q1–Q3: 26–114) months. Automated measurements of the ECG variables were extracted from the raw data (Figure 1).
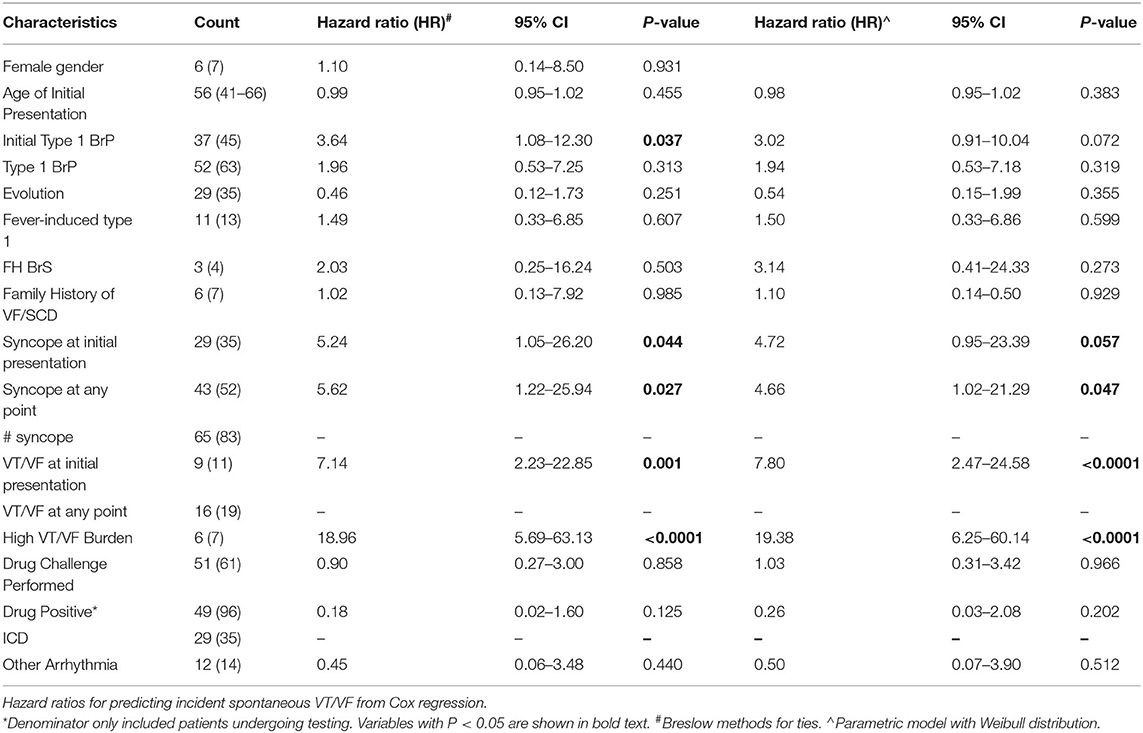
Table 1. Baseline characteristics of the Brugada patients (n = 83) included in this study.
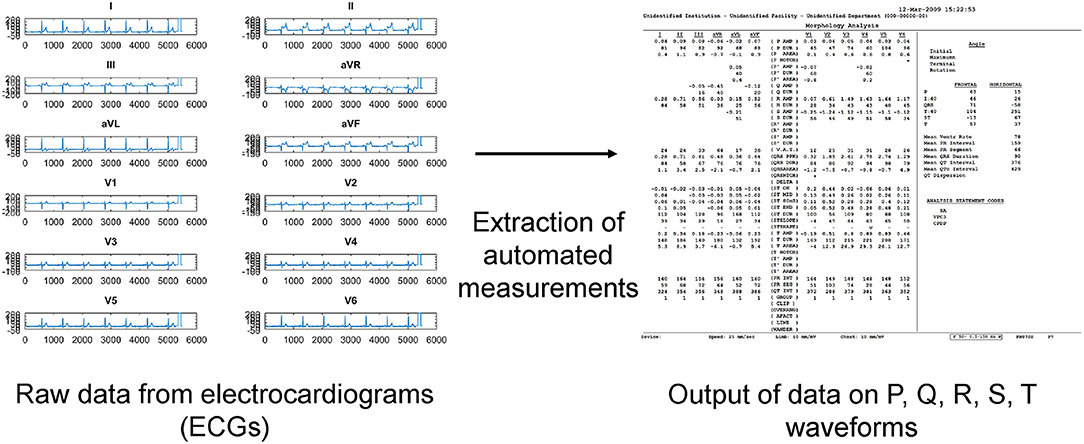
Figure 1. Extraction of automated electrocardiographic (ECG) variables from raw data files.
A weighted score system for risk stratification was created, as illustrated in Figure 2. Briefly, ECG variables related to Q, R, S and T waveforms, which achieved significance of P-values < 0.10 on Cox regression, were identified. Their median values (Q1–Q3) and hazard ratios (HR) with 95% confidence intervals (CIs) for classifying incident spontaneous VT/VF are shown in Table 2, whereas optimum cut-off values and area under the curve (AUC) from receiver operating characteristic (ROC) analysis are shown in S2. For each variable, the lead with the lowest P-value was selected. This selection process yielded 11 ECG variables: vector magnitude of the initial 40 ms of the transverse QRS signal, QRS horizontal axis, ST horizontal axis, R-wave amplitude in lead I, R-wave duration in lead III, S-wave amplitude in lead I, S-wave duration in lead aVL, QRS duration in lead V3, QRS area in lead aVL, ST slope in lead I, T-wave area in lead V1 and PR interval in lead V2. Vector magnitude of the initial 40 ms of the transverse QRS signal was not processed further as not all ECGs had this variable reported.
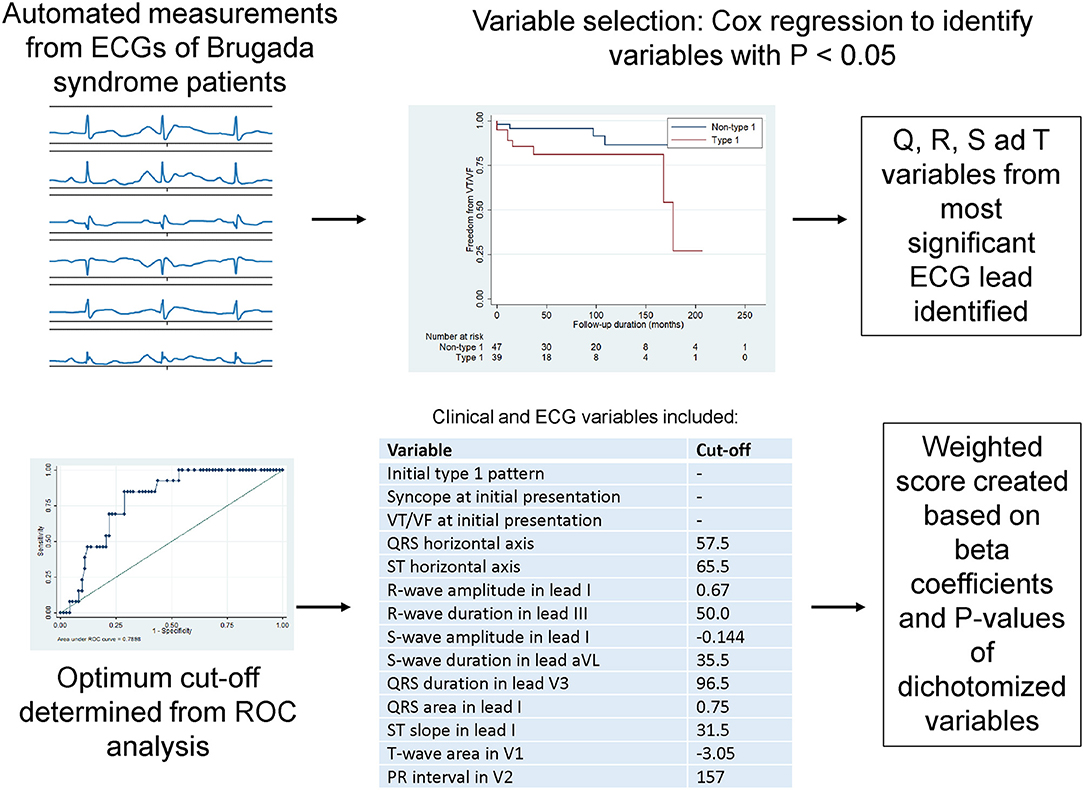
Figure 2. Steps for creating a weighted score system based on automated ECG measurements on ventricular depolarization and repolarization.
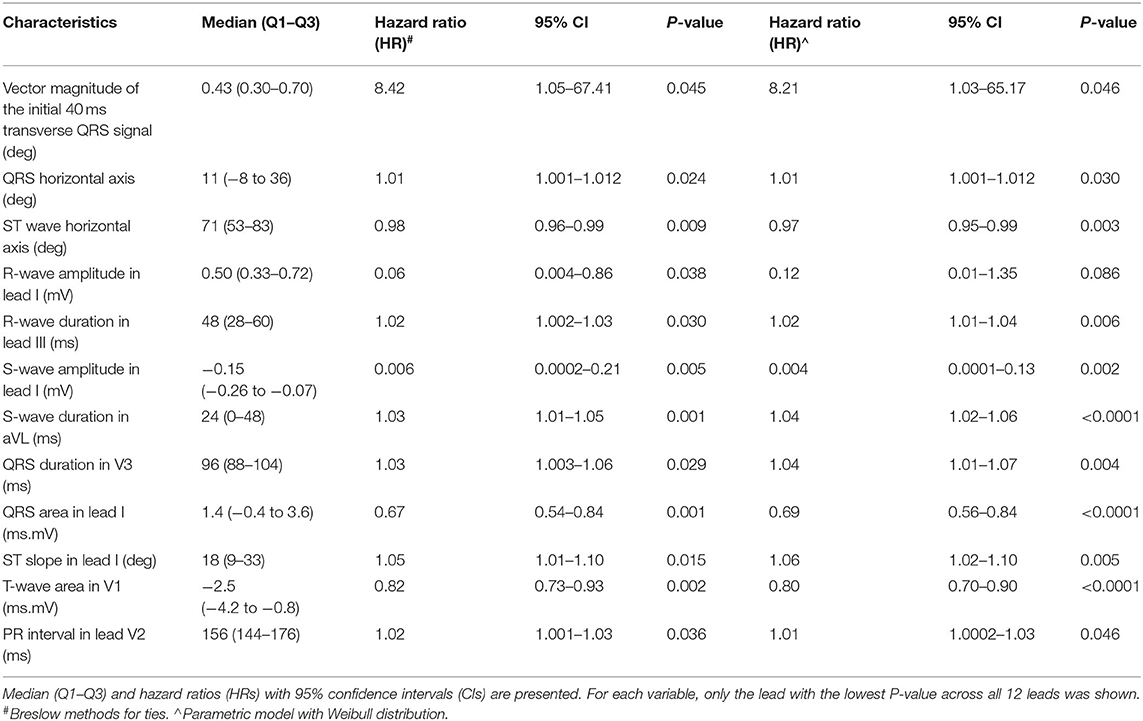
Table 2. Significant ECG variables of Q, R, S, and T waves for predicting incident spontaneous VT/VF from univariate Cox regression.
The remaining ECG variables were then dichotomized based on the optimum cut-off values from receiver operating characteristic (ROC) analysis. The dichotomized ECG variables were weighted based on the beta coefficients and P-values. After dichotomization, two variables lost significance for prediction (highlighted in red in Supplementary Table 3) and therefore the final score had a total of eight ECG and three clinical variables (Supplementary Table 4). A histogram plot for this weighted score is shown in Supplementary Figure 1. This weighted score provided good predictive performance when analyzed as a continuous variable [hazard ratio (HR): 1.59, 95% confidence interval (CI): 1.27–2.00, P-value < 0.0001, area under the curve (AUC): 0.84; Supplementary Figure 3] or a dichotomized variable (HR: 14.88, 95% CI: 3.99–55.50, P-value < 0.0001, AUC: 0.81) (Supplementary Table 5). A simplified algorithm was generated using decision tree learning for potential clinical application (AUC: 0.93, Supplementary Tables 6, 7; Supplementary Figure 3).
Discussion
The main findings of this study is that (i) automated measurements from raw ECG data can be extracted and used for risk stratification, (ii) ST slope was identified as a novel risk marker, and (iii) a weighted score system based on QRS frontal axis, R-wave duration (lead III), S-wave duration (lead I), QRS duration (lead I) and ST slope (lead I) predicted incident spontaneous VT/VF with an AUC of 0.95.
Previously, investigators have commented that manual measurements may be susceptible to variations and errors (13). Indeed, accuracy and reproducibility of measurements made manually have not been examined (14). Our study provides the proof-of-concept that the axis of the QRS vector, depolarization and repolarization variables extracted automatically from raw ECG data can predict arrhythmic events with good fidelity. In BrS, both depolarization and repolarization abnormalities are posited to play important roles in ventricular arrhythmogenesis (15, 16). ECG indices related depolarization (13), such as QRS duration, QRS dispersion, R-wave and S-wave durations have been identified as useful predictors in this condition (3, 17–21). For Brugada syndrome, QRS vector magnitude was identified as a predictor of ventricular arrhythmias (22). In keeping with their findings, our study similarly demonstrated that the magnitude of initial 40 ms transverse QRS signal was borderline predictive of VT/VF (P-value = 0.051). However, the magnitude of the maximum transverse QRS vector or of its terminal portion were not significant predictors.
By contrast, repolarization abnormalities, as reflected by alterations in the ST segment, QT or Tpeak-Tend intervals, are also important arrhythmogenic substrates in BrS (23–26). Our novelty is the demonstration that the slope of ST segment is significantly associated with arrhythmic risk. Whilst the angle between the R' wave and the vertical line has been used to distinguish Brugada pattern from other causes with similar morphology, such as right bundle branch block (27), we are not aware of any previous study demonstrating the use of R or ST angles for risk stratification. Moreover, Tend, and sometimes Tpeak, can be difficult to determine with a degree of certainty with different methods of determining its location (28). Recently, an automated algorithm calculated a global Tpeak based on the root mean square average of Tpeak from individual leads with a similar methodology for determining Tend (29). Whether these measurements provide more accurate risk stratification than manual measurements in BrS and other disease cohorts remain to be tested. Other than outcome prediction, other investigators have used automated ECG variables for disease detection and tracking (30). Future studies should examine whether serial changes in ECG variables can improve disease detection especially in type 2 Brugada subjects and be used to track disease progression in BrS.
From our predictive analysis, we generated a simple algorithm based on decision tree learning method for potential clinical application, as we have done so previously for other cohorts (31, 32). For Brugada syndrome, other decision tree-type algorithms have been proposed (33–35). These algorithms should be compared for their ability to predict arrhythmic outcomes. Previously, other groups have developed useful clinical risk scores for risk stratification in BrS. For example, Subramanian et al. proposed a score based on four variables: the presence of spontaneous type 1 pattern, QRS fragmentation in the inferior leads, S-wave upslope duration ≥0.8 and Tpeak-Tend intervals ≥ 100 ms with an excellent AUC of 0.95 (36). As not all of the above variables were obtained from the automated ECG outputs in our study. Future studies should develop novel algorithms to automatically identify the presence or absence of QRS fragmentation and to determine Tpeak-Tend intervals to allow comparisons of between the different risk scores.
Limitations
Several limitations of our study should be noted. Firstly, the size of our cohort is relatively small. Our findings should be validated in larger prospective studies. Secondly, the majority of patients with detected VT/VVF events had ICDs implanted. Therefore, we cannot exclude ascertainment bias, where silent VT/VF events were missed in those without ICDs. Secondly, our extraction did not enable us to determine the Tpeak-Tend interval. Future work should focus on modifying existing algorithms to determine Tpeak and Tend, which would allow us to determine to extent to which repolarization abnormalities contribute to the arrhythmic substrate in BrS. Thirdly, the ECG predictors identified in this study may not be exclusive for BrS and may also be useful for risk stratification in other cardiovascular diseases such as myocardial infarction. This remains to be elucidated in future studies.
Conclusions
Automated ECG measurements related to depolarization and repolarization are useful for risk stratification in BrS. These markers should be validated in larger prospective studies. If the predictability of automated measurements is verified, they have the potential to open the gate for the wide application of advanced machine learning models to facilitate risk stratification and clinical decision making in BrS and other diseases.
Data Availability Statement
The raw data supporting the conclusions of this article are available in the datasets already made available in an online repository (https://zenodo.org/record/3266172; https://zenodo.org/record/3266179; https://zenodo.org/record/3351892).
Ethics Statement
The studies involving human participants were reviewed and approved by the Joint Chinese University of Hong Kong – New Territories East Cluster Clinical Research Ethics Committee. Written informed consent for participation was not required for this study in accordance with the national legislation and the institutional requirements.
Author Contributions
GT: study conception, study supervision, project planning, data interpretation, statistical analysis, manuscript drafting, and critical revision of manuscript. SL, DC, GL, AL, and JZ: data analysis, data interpretation, statistical analysis, manuscript drafting, and critical revision of manuscript. TL and QZ: data analysis, data interpretation, statistical analysis, study supervision, and critical revision of manuscript. All authors contributed to the article and approved the submitted version.
Funding
This work was supported by the Research Foundation of Major Science and Technology Projects of Tianjin Municipal Science and Technology Bureau (Grant No. 18ZXRHSY00180) and in part by the Health and Medical Research Fund (HMRF) Grant No. 16171991.
Conflict of Interest
The authors declare that the research was conducted in the absence of any commercial or financial relationships that could be construed as a potential conflict of interest.
Supplementary Material
The Supplementary Material for this article can be found online at: https://www.frontiersin.org/articles/10.3389/fcvm.2020.618254/full#supplementary-material
References
1. Sieira J, Dendramis G, Brugada P. Pathogenesis and management of Brugada syndrome. Nat Rev Cardiol. (2016) 13:744–56. doi: 10.1038/nrcardio.2016.143
2. Gourraud JB, Barc J, Thollet A, Le Marec H, Probst V. Brugada syndrome: diagnosis, risk stratification and management. Arch Cardiovasc Dis. (2017) 110:188–95. doi: 10.1016/j.acvd.2016.09.009
3. Asvestas D, Tse G, Baranchuk A, Bazoukis G, Liu T, Saplaouras A, et al. High risk electrocardiographic markers in Brugada syndrome. Int J Cardiol Heart Vasc. (2018) 18:58–64. doi: 10.1016/j.ijcha.2018.03.001
4. Priori SG, Gasparini M, Napolitano C, Della Bella P, Ottonelli AG, Sassone B, et al. Risk stratification in Brugada syndrome: results of the PRELUDE (PRogrammed ELectrical stimUlation preDictive valuE) registry. J Am Coll Cardiol. (2012) 59:37–45. doi: 10.1016/j.jacc.2011.08.064
5. Letsas KP, Efremidis M, Asvestas D, Vlachos K, Georgopoulos S, Tse G, et al. Right ventricular outflow tract electroanatomical abnormalities predict ventricular fibrillation inducibility in Brugada Syndrome. Circ Arrhythm Electrophysiol. (2018) 11:e005928. doi: 10.1161/CIRCEP.117.005928
6. Asada S, Morita H, Watanabe A, Nakagawa K, Nagase S, Miyamoto M, et al. Indication and prognostic significance of programmed ventricular stimulation in asymptomatic patients with Brugada syndrome. Europace. (2020) 22:972–9. doi: 10.1093/europace/euaa003
7. Sacilotto L, Scanavacca MI, Olivetti N, Lemes C, Pessente GD, Wulkan F, et al. Low rate of life-threatening events and limitations in predicting invasive and non-invasive markers of symptoms in a cohort of type 1 Brugada syndrome patients. Data and insights from the GenBra Registry. J Cardiovasc Electrophysiol. (2020) 31:2920–8. doi: 10.22541/au.159225401.16289810
8. Letsas KP, Asvestas D, Baranchuk A, Liu T, Georgopoulos S, Efremidis M, et al. Prognosis, risk stratification, and management of asymptomatic individuals with Brugada syndrome: a systematic review. Pacing Clin Electrophysiol. (2017) 40:1332–45. doi: 10.1111/pace.13214
9. Delinière A, Baranchuk A, Giai J, Bessiere F, Maucort-Boulch D, Defaye P, et al. Prediction of ventricular arrhythmias in patients with a spontaneous Brugada type 1 pattern: the key is in the electrocardiogram. EP Europace. (2019) 21:1400–9. doi: 10.1093/europace/euz156
10. Delinière A, Chevalier P. Prediction of ventricular arrhythmias in Brugada syndrome patients: is it time for automatized electrocardiogram analysis?—Authors' reply. EP Europace. (2020) 22:674–5. doi: 10.1093/europace/euaa011
11. Shen WK, Sheldon RS, Benditt DG, Cohen MI, Forman DE, Goldberger ZD, et al. 2017 ACC/AHA/HRS guideline for the evaluation and management of patients with syncope: a report of the American College of Cardiology/American Heart Association Task Force on Clinical Practice Guidelines and the Heart Rhythm Society. Circulation. (2017) 136:e60–122. doi: 10.1161/CIR.0000000000000498
12. Antzelevitch C, Brugada P, Borggrefe M, Brugada J, Brugada R, Corrado D, et al. Brugada syndrome: report of the second consensus conference: endorsed by the Heart Rhythm Society and the European Heart Rhythm Association. Circulation. (2005) 111:659–70. doi: 10.1161/01.CIR.0000152479.54298.51
13. Nagase S. Risk stratification in Brugada syndrome - Significance of ECG and depolarization abnormality. Int J Cardiol. (2020) 303:56–7. doi: 10.1016/j.ijcard.2019.12.047
14. Garcia Iglesias D, Rubin Lopez JM, Perez Diez D, Moris De La Tassa C, Calvo D. Prediction of ventricular arrhythmias in Brugada syndrome patients: is it time for automatized electrocardiogram analysis? Europace. (2020) 22:674. doi: 10.1093/europace/euz333
15. Ragab AAY, Houck CA, Van Der Does L, Lanters EAH, Muskens A, et al. Prediction of ventricular tachyarrhythmia in Brugada syndrome by right ventricular outflow tract conduction delay signs. J Cardiovasc Electrophysiol. (2018) 29:998–1003. doi: 10.1111/jce.13496
16. Tse G, Li KHC, Li G, Liu T, Bazoukis G, Wong WT, et al. Higher dispersion measures of conduction and repolarization in type 1 compared to non-type 1 Brugada Syndrome patients: an electrocardiographic study from a single center. Front Cardiovasc Med. (2018) 5:132. doi: 10.3389/fcvm.2018.00132
17. Tokioka K, Kusano KF, Morita H, Miura D, Nishii N, Nagase S, et al. Electrocardiographic parameters and fatal arrhythmic events in patients with Brugada syndrome: combination of depolarization and repolarization abnormalities. J Am Coll Cardiol. (2014) 63:2131–8. doi: 10.1016/j.jacc.2014.01.072
18. Ragab AAY, Houck CA, Van Der Does L, Lanters EAH, Burghouwt DE, et al. Usefulness of the R-wave sign as a predictor for ventricular tachyarrhythmia in patients with Brugada Syndrome. Am J Cardiol. (2017) 120:428–34. doi: 10.1016/j.amjcard.2017.04.044
19. Rattanawong P, Riangwiwat T, Prasitlumkum N, Limpruttidham N, Kanjanahattakij N, Chongsathidkiet P, et al. Baseline fragmented QRS increases the risk of major arrhythmic events in Brugada syndrome: Systematic review and meta-analysis. Ann Noninvasive Electrocardiol. (2018) 23:e12507. doi: 10.1111/anec.12507
20. Giustetto C, Nangeroni G, Cerrato N, Rudic B, Tulumen E, Gribaudo E, et al. Ventricular conduction delay as marker of risk in Brugada Syndrome. Results from the analysis of clinical and electrocardiographic features of a large cohort of patients. Int J Cardiol. (2020) 302:171–7. doi: 10.1016/j.ijcard.2019.11.121
21. Rattanawong P, Kewcharoen J, Techorueangwiwat C, Kanitsoraphan C, Mekritthikrai R, Prasitlumkum N, et al. Wide QRS complex and the risk of major arrhythmic events in Brugada syndrome patients: a systematic review and meta-analysis. J Arrhythm. (2020) 36:143–52. doi: 10.1002/joa3.12290
22. Ragab AAY, Houck CA, Van Der Does L, Lanters EAH, Muskens A, et al. QRS vector magnitude as predictor of ventricular arrhythmia in patients with Brugada Syndrome. Am J Cardiol. (2019) 123:1962–6. doi: 10.1016/j.amjcard.2019.03.018
23. Wilde AAM, Postema PG, Di Diego JM, Viskin S, Morita H, Fish JM, et al. The pathophysiological mechanism underlying Brugada syndrome: depolarization versus repolarization. J Mol Cell Cardiol. (2010) 49:543–53. doi: 10.1016/j.yjmcc.2010.07.012
24. Tse G, Yan BP. Traditional and novel electrocardiographic conduction and repolarization markers of sudden cardiac death. Europace. (2017) 19:712–21. doi: 10.1093/europace/euw280
25. Honarbakhsh S, Providencia R, Lambiase PD. Risk Stratification in Brugada Syndrome: current status and emerging approaches. Arrhythm Electrophysiol Rev. (2018) 7:79–83. doi: 10.15420/aer.2018.2.2
26. Tse G, Zhou J, Lee S, Liu T, Bazoukis G, Mililis P, et al. Incorporating latent variables using nonnegative matrix factorization improves risk stratification in Brugada Syndrome. J Am Heart Assoc. (2020) 9:e012714. doi: 10.1161/JAHA.119.012714
27. De Luna AB, Garcia-Niebla J, Baranchuk A. New electrocardiographic features in Brugada syndrome. Curr Cardiol Rev. (2014) 10:175–80. doi: 10.2174/1573403X10666140514101546
28. Tse G, Gong M, Wong WT, Georgopoulos S, Letsas KP, Vassiliou VS, et al. The Tpeak - Tend interval as an electrocardiographic risk marker of arrhythmic and mortality outcomes: A systematic review and meta-analysis. Heart Rhythm. (2017) 14:1131–7. doi: 10.1016/j.hrthm.2017.05.031
29. Rosenthal TM, Masvidal D, Abi Samra FM, Bernard ML, Khatib S, Polin GM, et al. Optimal method of measuring the T-peak to T-end interval for risk stratification in primary prevention. Europace. (2018) 20:698–705. doi: 10.1093/europace/euw430
30. Tison GH, Zhang J, Delling FN, Deo RC. Automated and interpretable patient ECG profiles for disease detection, tracking, and discovery. Circ Cardiovasc Qual Outcomes. (2019) 12:e005289. doi: 10.1161/CIRCOUTCOMES.118.005289
31. Tse G, Lakhani I, Zhou J, Li KHC, Lee S, Liu Y, et al. P-wave area predicts new onset atrial fibrillation in mitral stenosis: a machine learning approach. Front Bioeng Biotechnol. (2020) 8:479. doi: 10.3389/fbioe.2020.00479
32. Tse G, Zhou J, Lee S, Liu Y, Leung KSK, Lai RWC, et al. Multi-parametric system for risk stratification in mitral regurgitation: a multi-task Gaussian prediction approach. Eur J Clin Invest. (2020) 50:e13321. doi: 10.1111/eci.13321
33. Berne P, Brugada J. Brugada Syndrome 2012. Circ J. (2012) 76:1563–71. doi: 10.1253/circj.CJ-12-0717
34. Walia J, Steinberg C, Laksman Z. Brugada syndrome: updated perspectives. Res Rep Clin Cardiol. (2019) 10:19–32. doi: 10.2147/RRCC.S182162
35. Mcenteggart S, Estes NAM. III. Prediction and prevention of sudden death in the Brugada Syndrome. Am J Cardiol. (2019) 124:1797–802. doi: 10.1016/j.amjcard.2019.08.044
Keywords: Brugada syndrome, automated ECG, risk stratification, depolarization, repolarization
Citation: Tse G, Lee S, Li A, Chang D, Li G, Zhou J, Liu T and Zhang Q (2021) Automated Electrocardiogram Analysis Identifies Novel Predictors of Ventricular Arrhythmias in Brugada Syndrome. Front. Cardiovasc. Med. 7:618254. doi: 10.3389/fcvm.2020.618254
Received: 16 October 2020; Accepted: 17 December 2020;
Published: 14 January 2021.
Edited by:
Antonio Zaza, University of Milano-Bicocca, ItalyReviewed by:
Carlo Napolitano, University of Pavia, ItalyPedro Brugada, Independent Researcher, Brussels, Belgium
Copyright © 2021 Tse, Lee, Li, Chang, Li, Zhou, Liu and Zhang. This is an open-access article distributed under the terms of the Creative Commons Attribution License (CC BY). The use, distribution or reproduction in other forums is permitted, provided the original author(s) and the copyright owner(s) are credited and that the original publication in this journal is cited, in accordance with accepted academic practice. No use, distribution or reproduction is permitted which does not comply with these terms.
*Correspondence: Gary Tse, garytse86@gmail.com; Tong Liu, liutongdoc@126.com; Qingpeng Zhang, qingpeng.zhang@cityu.edu.hk