Enhancing the Application of Earth Observations for Improved Environmental Decision-Making Using the Early Warning eXplorer (EWX)
 Shraddhanand Shukla1*
  Martin Landsfeld1 Michelle Anthony2 Michael Budde3
  Gregory J. Husak1
  James Rowland3 Chris Funk3,1
- 1Department of Geography, Climate Hazards Center, University of California, Santa Barbara, Santa Barbara, CA, United States
- 2KBR Technical Support Services Contract, Contractor to the U.S. Geological Survey Earth Resources Observation and Science Center, Sioux Falls, SD, United States
- 3U.S. Geological Survey, Earth Resources Observation and Science Center, Sioux Falls, SD, United States
The mitigation of losses due to extreme climate events and long-term climate adaptation requires climate informed decision-making. In the past few decades, several remote sensing and modeled-based Earth observations (EOs) have been developed to provide an unprecedented global overview and routine monitoring of climate and its impacts on vegetation and hydrologic conditions, with the goal of supporting informed decision-making. However, their usage in decision-making is particularly limited in climate-risk vulnerable and in situ data-scarce regions such as sub-Saharan Africa, due to lack of access to EOs. Here, we describe the Early Warning eXplorer (EWX), which was developed to address this crucial limitation and facilitate the application of EOs in decision-making, particularly in the food and water-insecure regions of the world. First, the EWX's core framework, which includes (i) the Viewer, (ii) GeoEngine, and (iii) Support Applications, is described. Then, a comprehensive overview of the Viewer, which is a web-based interface used to access EOs, is provided. This includes a description of (i) the maps and associated features to access gridded EO data and anomalies for different temporal averaging periods, (ii) time series graphs and associated features to access EOs aggregated over polygons such as administrative boundaries, and (iii) commonly used EOs served by the EWX that provide assessments of climate and vegetation conditions. Next, examples are provided to demonstrate how EWX can be used to monitor development, progression, spatial extent, and severity of climate-driven extreme events to support timely decisions related to mitigation of food insecurity and flooding impacts. Finally, the value of a regional implementation of EWX at the Regional Centre for Mapping of Resources for Development (RCMRD) in Nairobi, Kenya, is highlighted. Regional implementation of the EWX facilitates access to regionally focused EOs and their availability at polygon boundaries most relevant to the local decision-makers. Similar instances of EWX implemented in other regions, especially those susceptible to food and water security, will likely further enhance the application of EOs for informed decision-making.
Introduction
Food and water security, globally, is susceptible to climate-related risks due to climate variability and change (Schmidhuber and Tubiello, 2007; Milly et al., 2008; Falkenmark, 2013; Wheeler and von Braun, 2013; Campbell et al., 2016). Annual economic losses due to climate extremes are estimated to be at about $100B (US Dollars) between 2004 and 2014 (FAO, 2016). Mitigation of the adverse socio-economic impacts of climate extremes, as well as long-term climate resilience and adaptation, is critically dependent on timely access to Earth observations (EOs). These EOs include satellite-based precipitation, temperature, and vegetation greenness, as well as modeled data sets including reanalysis products, simulated hydrologic fluxes, and dynamical sub-seasonal to seasonal climate forecasts. During the past three decades, major strides have been taken in the development and operational production of satellite and model-based EOs, often spanning the entire globe. These efforts have improved monitoring of the Earth for scientific and decision-making applications (Wulder and Coops, 2014). For example, availability (now open access) of 40+ years of Landsat data sets has facilitated routine monitoring at a global scale and long-term ecological change assessments (Wulder et al., 2012). Availability of high-resolution (10–60 m) multi-spectral imagery from the Sentinel series (Donlon et al., 2012; Drusch et al., 2012; Torres et al., 2012; Szantoi and Strobl, 2019) has allowed for potential application of EOs in decision-making at a truly local scale. Satellite-based estimates of precipitation (Huffman et al., 2010; Ashouri et al., 2015; Funk et al., 2015a; Skofronick-Jackson et al., 2017), evapotranspiration (Jiang et al., 2020; Senay et al., 2020), surface soil moisture (Brown et al., 2013; Dorigo et al., 2017; Das et al., 2018), and total moisture—derived from monthly gravity field estimates made by the twin Gravity Recovery and Climate Experiment (Tapley et al., 2004; Rodell et al., 2018)—have allowed for improved understanding of change in water availability, and for monitoring extreme events such as drought and floods. Additionally, model-based (and assimilated observational estimates) climate reanalysis (Saha et al., 2010; Hersbach and Dee, 2016; Gelaro et al., 2017) and weather (Hamill et al., 2006) to subseasonal (Pegion et al., 2019) to seasonal scale (Molteni et al., 1996; Kirtman et al., 2013) climate or hydrologic forecasting products (Arsenault et al., 2020) allow for the early warning of climate extreme events, and hence, support decisions that save lives and resources. However, despite the availability of these and several other EOs, application of these data sets for decision-making in some of the most vulnerable regions across the globe, such as sub-Saharan Africa (SSA), has still been limited. The Early Warning eXplorer (EWX) has been developed and implemented to address this important limitation. The EWX provides easy and routine access to critical EOs with the primary goal of enhancing their application for disaster mitigation and supporting long-term resilience. Here, we provide an overview of the EWX, describe its features, and demonstrate examples of how the EWX can be used to empower decision-making, especially in the vulnerable regions of SSA.
The EWX Overview
The EWX is implemented based on three main components (Figure 1). The first component, the EWX Viewer, is accessible to users through a browser (the EWX overview). The viewer is the interface through which users can visualize EOs in the form of maps (spatial representation of gridded EOs) and time series graphs, as well as extract EO data for desired focus domain and time period for further analysis.
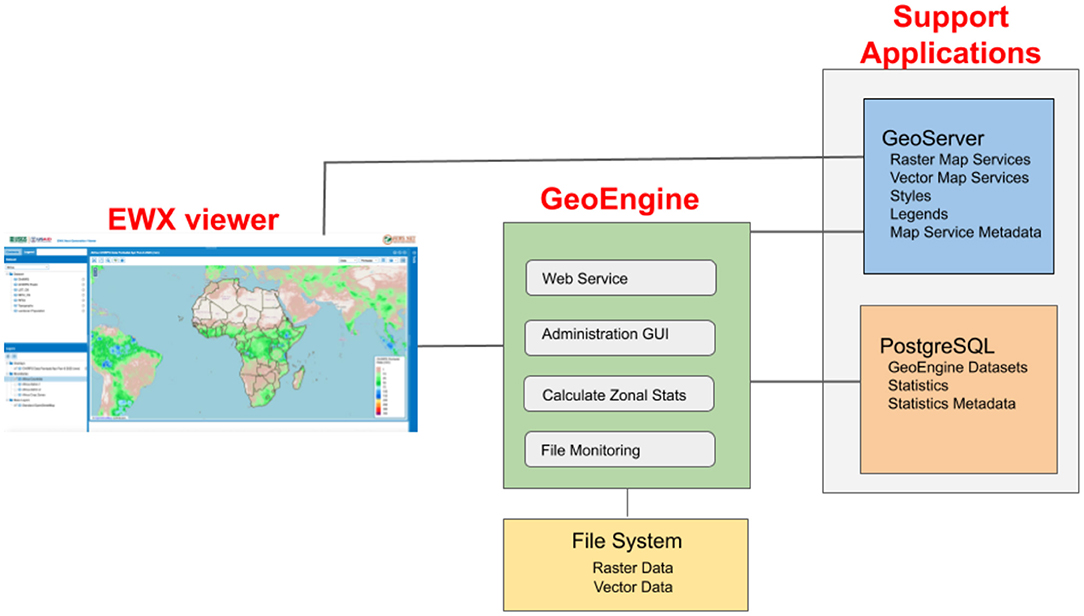
Figure 1. Flow chart of the main components of the Early Warning eXplorer.
The second component is the GeoEngine processing server, which is the core processor of the EWX System. The primary functions of the GeoEngine include:
(i) providing web services to the EOs and time series data,
(ii) serving as a graphical user interface for administrators to add and delete raster and vector data sets, and define their combinations for calculating summary statistics,
(iii) monitoring file system for updates in the availability of EOs,
(iv) syncing the map serving GeoServer contents with the file system as it is updated,
(v) calculating spatially averaged data sets and statistics as required by any modifications or addition of boundaries or EO fields and
(vi) storing and retrieving outputs to and from the database.
The third component, Support Applications, contains applications including a map server, a GeoServer instance, and a PostgreSQL database for storage and retrieval of the statistics and the file system, which is continually monitored for new or deleted EOs. GeoServer is an open-source geospatial data server that implements Open Geospatial Consortium (OGC) standards, serves maps to the EWX Viewer and other GeoEngine clients, and allows for serving of data via different web services such as Web Map Service (WMS), Web Feature Service (WFS), Web Coverage Service (WCS), and Web Mapping Service with Time (WMST). A PostgreSQL database stores derived data sets and statistics, maintains metadata about calculated statistics (for example, when they were last calculated), and maintains an inventory of coverages and their associations, periodic data sets, and vector data sets.
Currently, multiple versions of the EWX exist, and they are listed in Table 1. Each of these versions is based on the above-mentioned framework. The U.S. Geological Survey's (USGS) EWX is the first instance of EWX. The USGS also hosts EWX-lite, which is a limited version of the EWX designed for regions with poor internet connections. The University of California, Santa Barbara's (UCSB) EWX provides access to several EOs that are currently “experimental.” The Regional Centre for Mapping of Resources for Development (RCMRD) EWX is the first instance of EWX in SSA. As described in detail in section concluding remarks, this version of EWX was implemented to support capacity building in the region of eastern and southern Africa. It is expected that, depending on users' EO needs, they can decide to access EOs using any of the versions of the EWX. There are several EOs that are common to all versions of the EWX. If a user wants to access those common EOs, they can choose any EWX version. If a user wants to access “experimental” EOs that are not available on the USGS's EWX version, they can access them on UCSB's version. Similarly, users from eastern and southern Africa may want to access EOs from RCMRD's version of EWX, especially if they want to access EOs at custom zones (e.g., Administrative-3 polygons or grazing area polygons) that are not available on USGS and UCSB's versions. The variety within these different instances of the EWX highlights the flexibility of the platform to respond to the needs of specialized communities.
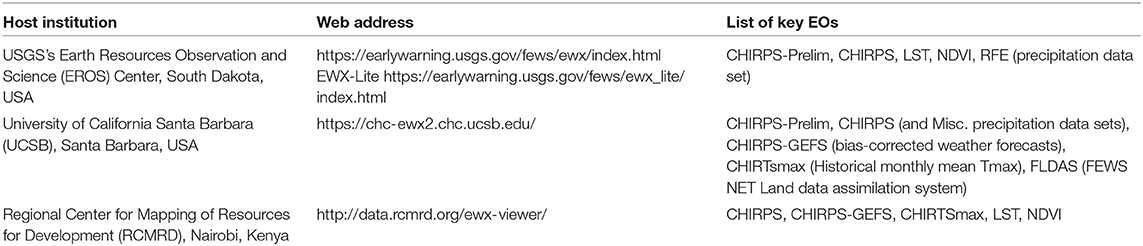
Table 1. Different versions of EWX.
Additionally, the USGS's instance of EWX is available for different regions of the globe. Currently (2020), the regions for which EWX is available are (shown in Figure 2): (i) Global, (ii) Africa, (iii) East Africa (EA), (iv) Central America, and Caribbean, (v) Central Asia, (vi) Middle East, and (vii) South America. Different regional instances of EWX allow for easy and quick access to the EOs by zooming to the spatial extent of the given region. Additionally, regional instances allow for access to EOs that are most useful for the given region. For example, the regional instance for Central Asia provides access to snow depth and snow water equivalent, as snow is a prominent source of water supply in that region.
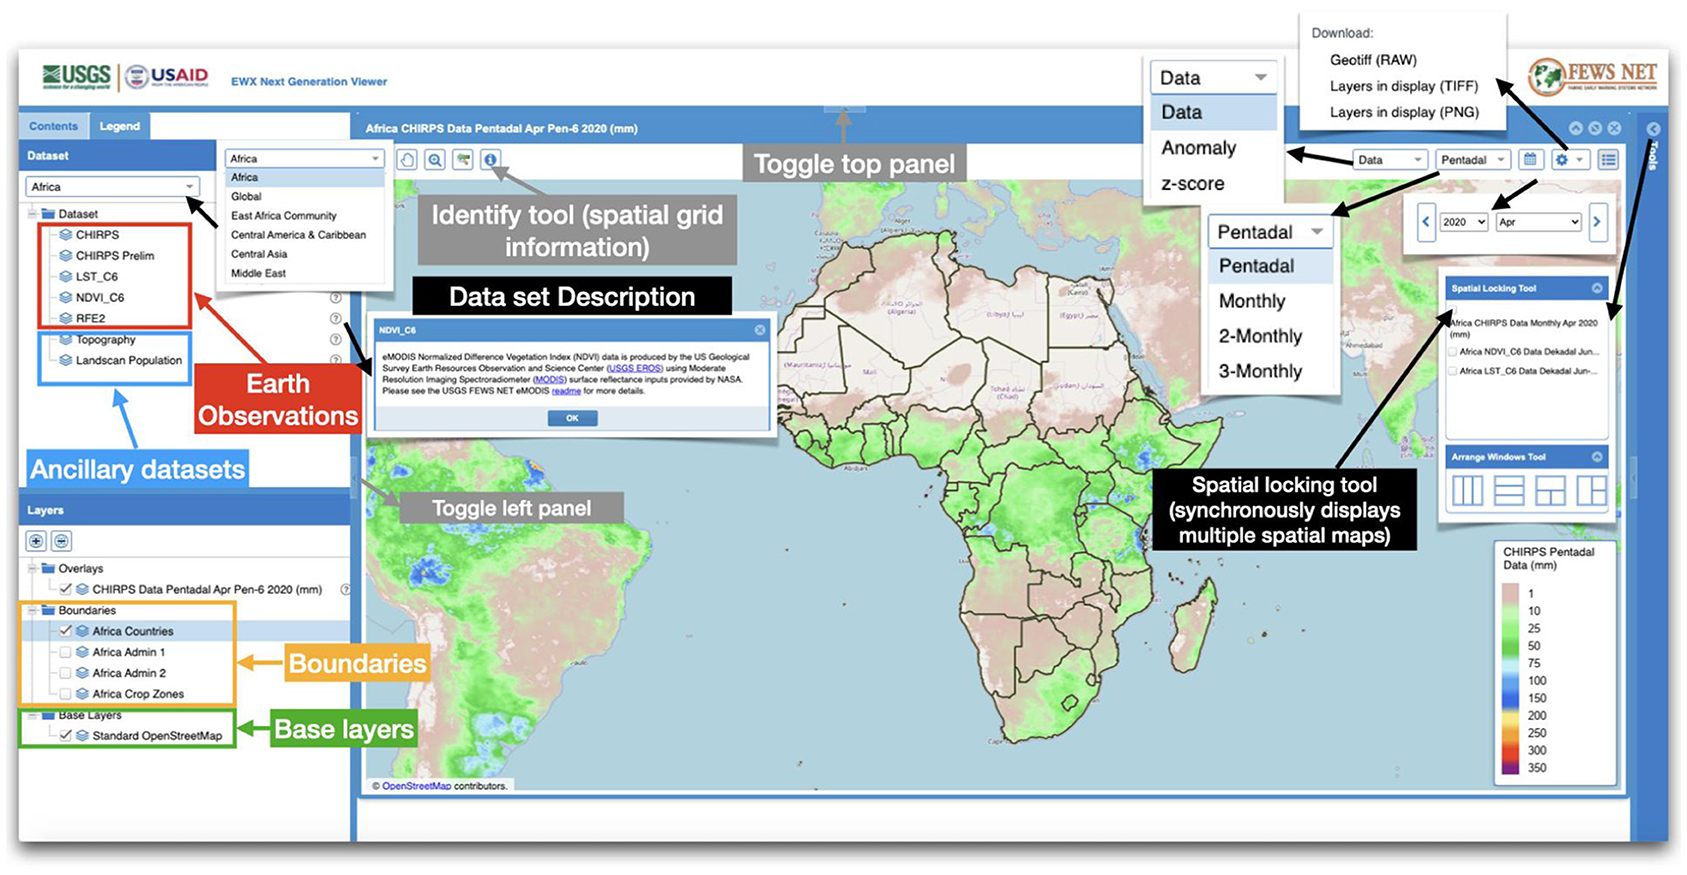
Figure 2. Overview of the USGS EWX viewer and its selected main features and options.
In the following sections, we provide a detailed overview of the viewer, describe several features of the viewer that facilitate visualization and access to EOs, describe select, widely used EOs that EWX provides access to, and finally we, provide examples of how EWX can be used to monitor climate extremes and perform analyses to support decision-making.
THE EWX VIEWER
This section provides an overview of the EWX viewer, including its main components, examples of the EOs available through EWX, and select primary features for spatial and temporal mapping of the EOs. Figure 2 shows the USGS Earth Resources Observation and Science (EROS) Center's version of the EWX viewer. The left panel of this page lists all Datasets (top left panel) that are accessible to the users and Layers (e.g., Boundaries), which are available to overlay the data sets to extract spatially averaged time series. The USGS's EWX currently provides access to EOs such as precipitation estimates, land surface temperature, and vegetative greenness. These EOs are best suited to monitor meteorological and agricultural drought conditions, and examine long-term changes and trends. In addition to EOs, the EWX also provides access to Ancillary data sets, such as topography and population density based on Landscan. Topography is helpful for providing physical context for EOs (for example, high-elevation areas tend to have higher rainfall,) and population is helpful for providing social context (i.e., the number of people in a region affected by climate extreme events). The EWX allows users to access EOs in terms of absolute values, as well as absolute anomaly and standardized anomaly. EOs are also typically available for different temporal aggregation periods, ranging from the pentadal (5-days accumulations) to a 3-monthly period. Availability of EOs at different temporal aggregation periods allows for monitoring of short-term variability of weather conditions (e.g., dry and wet spells, and cool and hot spells) using pentadal and dekadal (10-days accumulations) aggregation periods, and monitoring of the season as a whole, with a 3-months averaging period. The EWX allows access to historical data, which can be located by using a drop-down calendar menu and selecting years, months, or seasons, and day, pentad or dekad during the month.
The EWX allows quick visualization of EOs in the form of maps and time series graphs. Maps show the value or anomalies of a selected EO (Figure 3), averaging period, and region at the native grid-cell resolution [which varies from 5 km X 5 km for Climate Hazards Center InfraRed Precipitation with Station data (CHIRPS) and CHIRPS-Global Ensemble Forecast System to 250 m for Normalized Difference Vegetation Index] of the EO. Time series graphs provide spatially averaged (averaged over all grid cells within a selected boundary) values or anomalies of a selected EO for the selected region and boundary (Figure 4). In the case of a variable like snow water equivalent (SWE), the graphs indicate SWE totaled over the given basin. The mapping option provides maps of absolute value, additive anomaly, and standardized anomaly (or percent anomaly, in the case of NDVI) for a given EO (Figure 3). These map images can be downloaded in PNG format. The underlying spatial data for the selected region can also be downloaded in GeoTIFF format. Thus, a user can extract the EOs in GeoTIFF format and input the data to any widely used Geographical Information System tool for further analysis, or for overlaying with other maps that are not available from the EWX. A user may also want to download data in GeoTIFF format to work with their existing mapping tools to provide maps in the standard format for their agency's bulletin. For example, the Zambia Meteorological Department (ZMD) downloads CHIRPS-GEFS (bias-corrected and downscaled weather forecasts) from the UCSB's EWX (Table 1), maps it using their own tools, and includes it in the ZMD's Crop Weather Bulletin (Shukla et al., 2020b). Maps are most useful for national, regional, and international decision-makers who may be interested in assessing the climate and/or vegetation conditions at a broad spatial scale. Maps allow for identification of “hotspots” that may be experiencing the most severe anomalies (e.g., droughts and floods) during a given event. Maps are also helpful for assessing the spatial extent (e.g., regional vs. local) of a given climate extreme. The “Spatial Locking Tool” option, highlighted in Figure 3, is useful for comparing maps of (i) absolute magnitude, anomaly, and Z-score for a given time period for a given EO, or (ii) a given EO for different time periods, or (iii) different EOs as well as different time periods (Figure 2). Typically, maps are used as a first glimpse of the climate and/or vegetation conditions, followed by time series graphs to get a more in-depth, localized assessment of the conditions and its evolution in time.
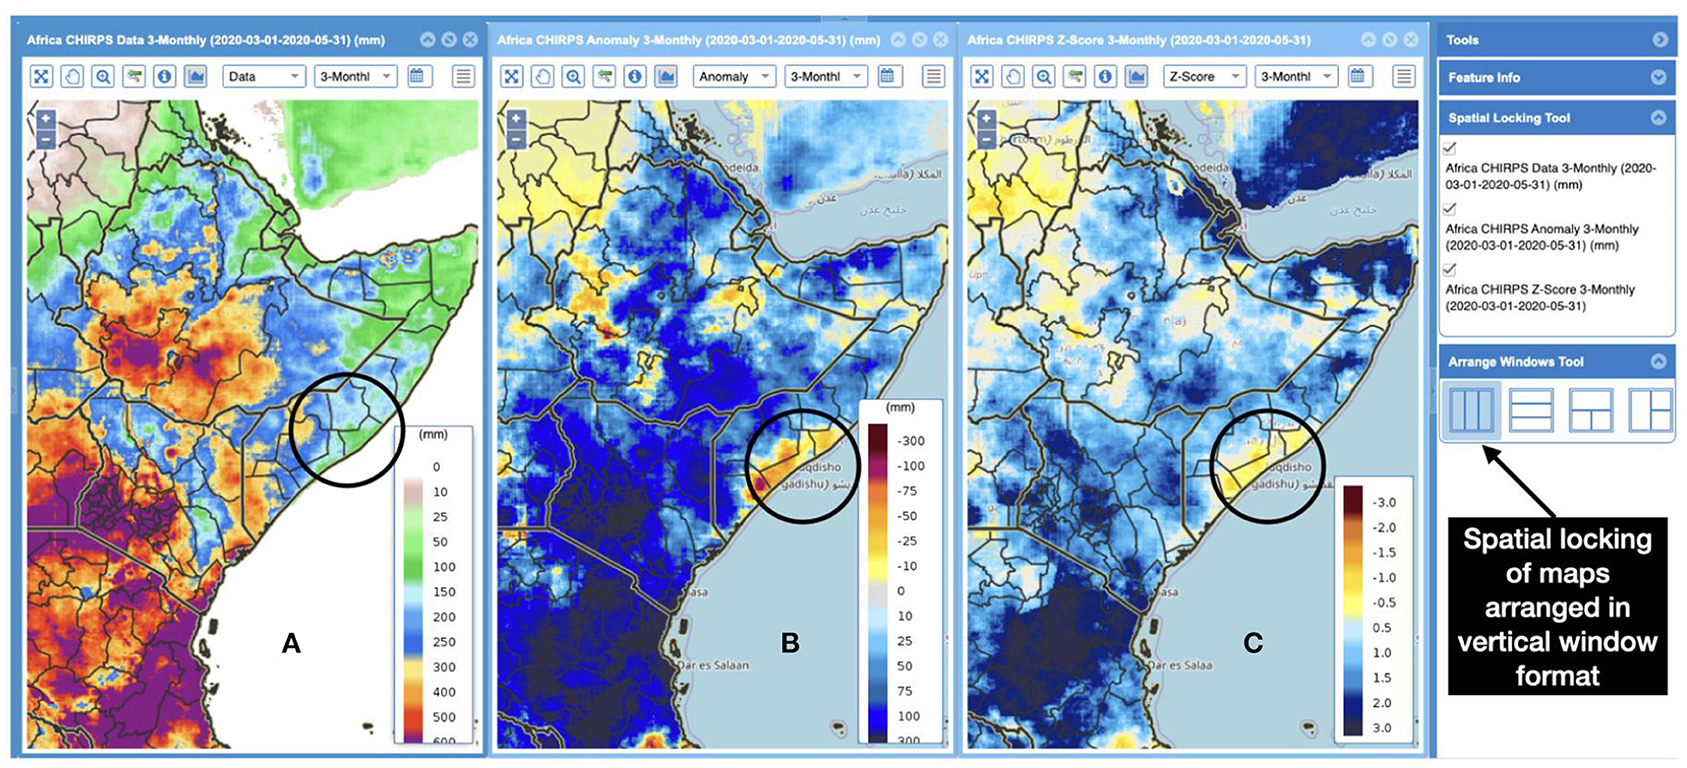
Figure 3. Spatially locked maps of March-May 2020 season CHIRPS precipitation (A) absolute magnitude, (B) additive anomaly, and (C) standardized anomaly over East Africa.
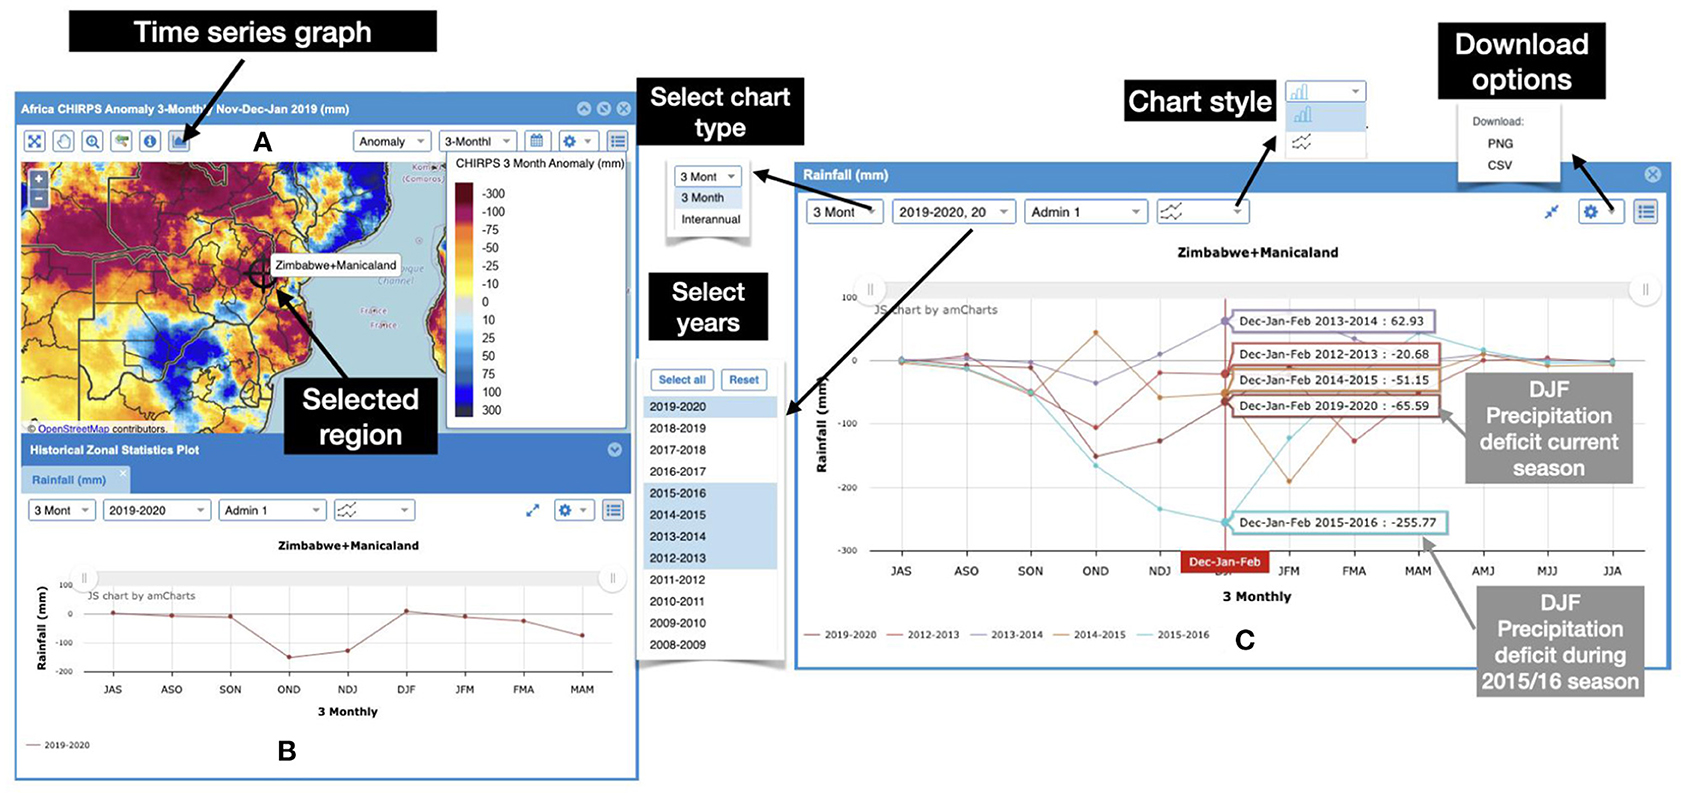
Figure 4. Examples of the time series graphs and selected primary options. (A) shows the location of administrative unit-1, Manicaland in Zimbabwe as well as the time series graph option, (B) shows the time series graph of the anomaly of 3-months total precipitation for 2019–2020 season, (C) shows a comparison between the anomalies during 2019/2020 with that of past selected years, as well as it highlights the key graphing options.
Time series graphs provide a localized, spatially averaged view of the climate and vegetation conditions within a historical perspective (Figure 4). The USGS's EWX provides access to EO time series spatially averaged over (i) Administrative Unit-1 or−2 and (ii) Crop zones in several developing regions across the globe, such as Africa, Central America, the Caribbean, Central Asia, the Middle East, and South America. For the Middle East region, the spatial aggregation is also available for a few selected watersheds. Aggregation over these boundaries allows the data to be directly relevant for decision-making, including urgent mitigation and/or long-term resilience. For example, aggregation over administrative unit-1 or−2 may allow for a targeted delivery of relief at a sub-national scale in the case of climate-driven food insecurity. Aggregation over crop zones ignores areas that are not major-producing regions at a national level, and are most useful for assessing agricultural conditions and for crop production outlooks. Figure 4B shows the time series of CHIRPS anomaly over a 3-months averaging period, over an administrative unit-1 (Manicaland, Zimbabwe). The location of this administrative unit can be seen by the “target symbol” in the map of CHIRPS anomaly, Figure 4A. The “target symbol” appears after the user selects the “Time series graph” option, as shown in Figure 4A. After selecting the EO (CHIRPS 3 monthly anomaly, in this case) and desired spatial domain, (Manicaland, Zimbabwe) a time series graph is created (Figure 4B). This graph can be linked with the map using the docking option in the time series graph, as in Figures 4A,B. This option allows quick access to time series for several different domains within the map (Figures 4A,B). The “target symbol” will move as the user selects different domains. The CHIRPS 3-monthly anomaly time series selected for Manicaland, Zimbabwe shows precipitation anomaly for each of the 3-months averaging periods in the latest “water year.” In Southern Hemisphere regions, the “water year” starts from July and ends in June. The time series graph (Figure 4B) shows a deficit of rainfall during the beginning of the rainy season. Both Oct-Dec (OND) and Nov-Jan (NDJ) seasonal anomalies are substantially below normal. It also shows a recovery in rainfall deficit late in the season, resulting in Dec-Feb (DJF) anomalies being near normal. Depending on the region and crop type, early and mid-seasonal precipitation deficit can have severe implications in terms of agricultural production and food insecurity. Figure 4C shows several different mapping options available for time series graphs (top right) that allow for the selection of any combination of years from the historical record (current and past years), as well as the climatological mean, chart types (line and bar plots), and download options (.CSV to get the underlying data and PNG to get the figure). Figure 4C also shows the 3-months anomaly of CHIRPS for several different years in the past, which can be used to quickly assess the severity of the anomalies in the current years relative to the anomalies in the past years. The user can also see values of anomalies as they move the cursor to a different 3-months averaging period. For example, in Figure 4C, the cursor is on the DJF season to display the anomalies for all years from 2013 to 14 through the current year. This option is also helpful when assessing impacts of the climate or vegetation anomalies. For example, a user can compare the anomalies of the current year with past years to identify the year with the most similar level of anomalies. This can help identify analog years for which impacts of anomalies are already known (e.g., shortfall in production or level of food insecurity), and similar impacts can therefore be assumed for the current year. For example, Figure 4C shows that, although this region experienced a drought in December-February 2019/2020 with precipitation deficit being 65.9 mm, this drought was not as severe as the past major drought in 2015-16, during which the precipitation deficit was 255.77 mm.
Earth Observations (EOs)
The USGS's EWX provides access to several different Earth observations (EOs) to support the timely analysis of climate, vegetation, and land surface conditions in order to monitor the status of natural hazards such as droughts and floods. In addition to EOs facilitating routine monitoring, EWX also provides access to forecasts (such as precipitation forecasts) to facilitate early warning (Table 1). The list of EOs available through the EWX varies based on the focus regions, as well as the version of the EWX (Table 1); however, below is a list of the prominent EOs that are common in different versions of EWX (Table 1), which cover at least quasi-global domain and are also widely used for monitoring and early warning purposes. These EOs are available for all regions through the USGS's EWX and across all versions of EWX (Table 1). It is important to mention that the EWX framework allows for the inclusion of additional gridded EOs as needed or when applicable for a given region. For example, SWE and snow depth data are available for central Asia, where snow plays a crucial role in food and water security.
Climate Hazards Center InfraRed Precipitation With Station Data (CHIRPS)
The CHIRPS is a precipitation data set (Funk et al., 2015a) that is widely used for routine monitoring (Funk et al., 2019), as well as long-term change and variability analysis. This data set spans more than 35 years, allowing for a long-term context through which to examine present hazards such as drought. It is available at 0.05 deg X 0.05 deg spatial resolution and spans the globe between 50 deg N and 50 deg S.
At the core of this data set are three main components: (i) a high-quality precipitation climatological mean, CHPClim, (Funk et al., 2015b) at 0.05 deg X 0.05 deg to allow for accurate variation of precipitation based on changes in topography, (ii) a satellite-based infrared brightness temperature data set, used to estimate variability in precipitation, and (iii) in situ reports of precipitation collected from several (about 15 to 20) global, regional, and national databases.
A more detailed description of CHIRPS methodology can be found in Funk et al. (2015a), but briefly, the development of CHIRPS involves the following primary steps:
(1) Generation of high-quality gridded mean precipitation (CHPClim) using in situ observations
(2) Conversion of infrared (IR) cold cloud brightness temperature into precipitation estimates and conversion of IR based on precipitation estimates into multiplicative anomalies
(3) Multiplication of IR-based precipitation anomalies to a high-quality mean precipitation data set to get CHIRP
(4) Adjustment and bias-correction of CHIRP relative to in situ precipitation reports, which are human inspected for consistency and erroneous entries. This blending of in situ reports with satellite-based precipitation estimates allows for greater accuracy of this data set (through in situ reports), as well as greater spatial and temporal coverage (through satellite-based inputs).
Figure 3 shows the maps depicting CHIRPS precipitation for the March-May 2020 season in terms of absolute magnitude (Figure 3A), additive anomaly (Figure 3B), and standardized anomaly (Figure 3C). As highlighted in section example applications to support decision-making, this season is marked by flooding and landslide events; however, anomaly maps used in conjunction with the absolute magnitude map highlight parts of Somalia that experienced drought during this otherwise much wetter than normal year in this region as a whole.
Climate Hazards Center InfraRed Precipitation With Station Data-Prelim (CHIRPS-Prelim)
As mentioned above, one of the primary strengths of CHIRPS is blending with in situ precipitation data. This blending helps unbias the data set and enhances its accuracy. However, in situ-based precipitation data are typically not available in real time. Generally, in situ reports of precipitation are available for the blending process about 2 weeks after the end of a month. This delay of a few weeks can pose a challenge in the application of CHIRPS for real-time monitoring, which is particularly essential during a rainy season. To reduce the latency and allow for near-real-time availability of the precipitation data set, CHIRPS-Prelim is made available. The process of generating CHIRPS-Prelim is similar to the CHIRPS process, with the main difference being its reliance on Global Telecommunication System (GTS) stations only, which are available in near-real time. Blending of CHIRP with GTS-only stations allows for the latency of CHIRPS-Prelim to be <5 days. As in situ reports for a given month are made available, CHIRPS (final version) is generated using those reports. Note that, in general, the differences in CHIRPS-Prelim and CHIRPS are within acceptable limits, as both data sets share the same climatological mean. Any differences between both data sets are random rather than systematic in nature. Additionally, Dinku et al. (2018) found the difference between CHIRP, which is solely based on satellite-based observations and is at the core of both CHIRPS-Prelim and CHIRPS, and CHIRPS to be minor over East Africa. Figure 5 shows a map of CHIRPS-Prelim precipitation globally. Maps such as this one are updated every 5th day when CHIRPS-Prelim is updated and can be accessed using the EWX.
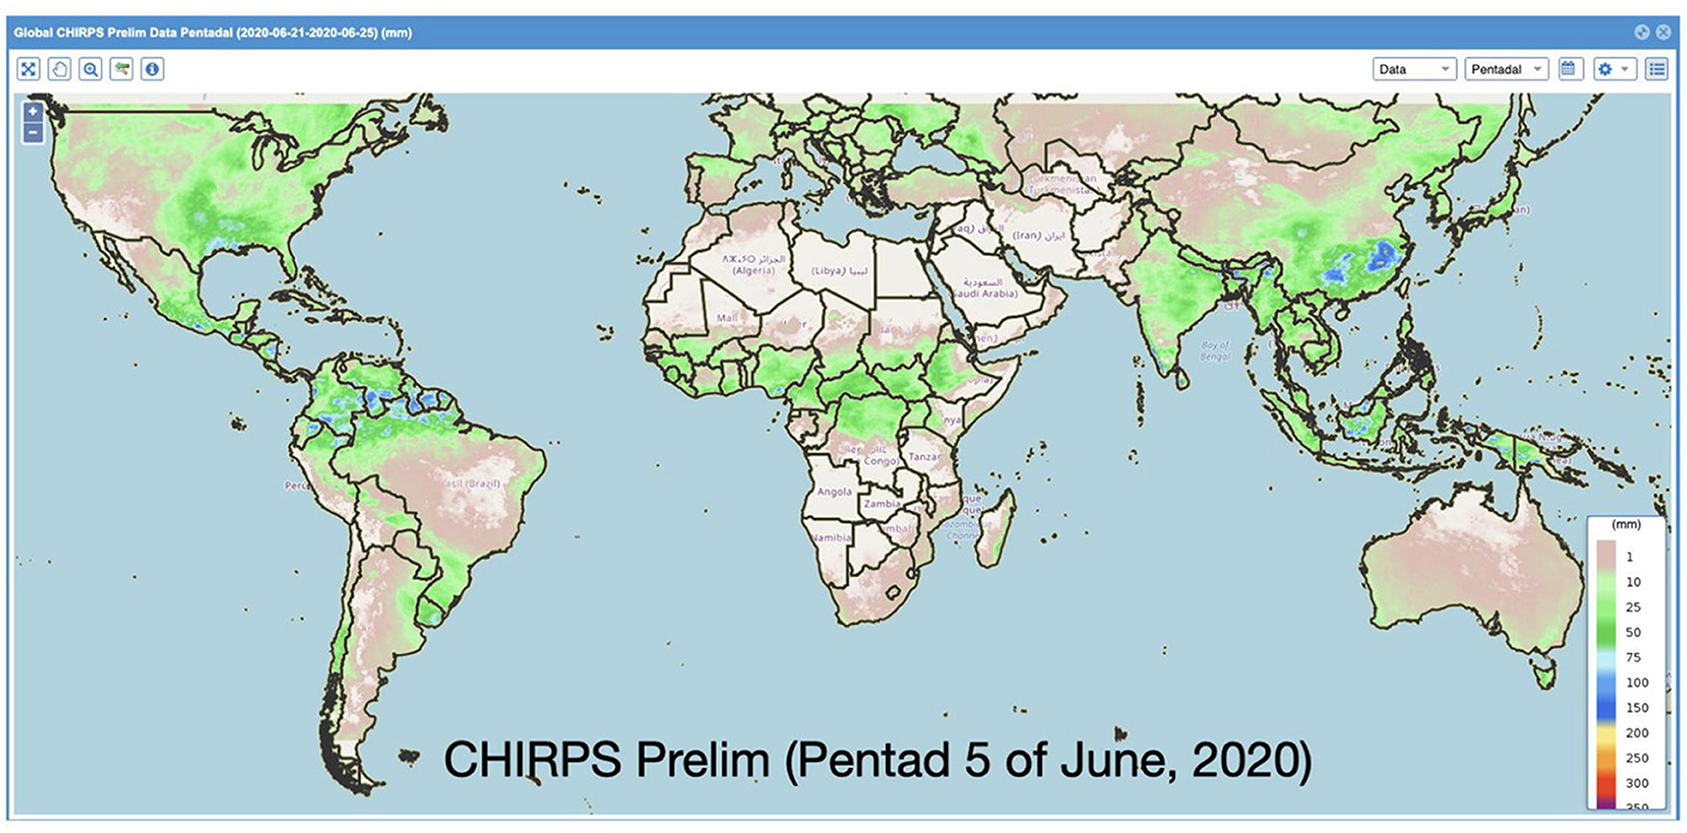
Figure 5. Map of CHIRPS-prelim, which shows total precipitation received globally during the pentad 5 (21–25) of June 2020.
Moderate Resolution Imaging Spectroradiometer (MODIS) Land Surface Temperature (LST)
The EWX also provides access to near-real-time MODIS-based Land Surface Temperature (LST) estimates version 6 (Wan, 2014). MODIS LST is an important data set for drought monitoring, especially in the regions and times of the season that are “water limited” (Karnieli et al., 2010). LST is a key land surface process parameter, which reflects the results of energy and water fluxes between the land surface and atmosphere. In case of lack of sufficient moisture for evaporation, and hence, evaporative cooling, LST becomes higher than normal, and LST anomalies can help detect the moisture deficit and drought conditions. Conversely, cooler-than-normal LST can indicate healthy vegetation conditions or regions with excess moisture. Figure 6 shows October-December LST anomalies over east Africa for 2 extreme years, 2016 (Figure 6A) and 2019 (Figure 6B), as shown by the CHIRPS anomaly for those seasons (Figures 6C,D), 2016 was a drought year (hence, above-normal LST) and 2019 was a wet year (hence, below-normal LST).
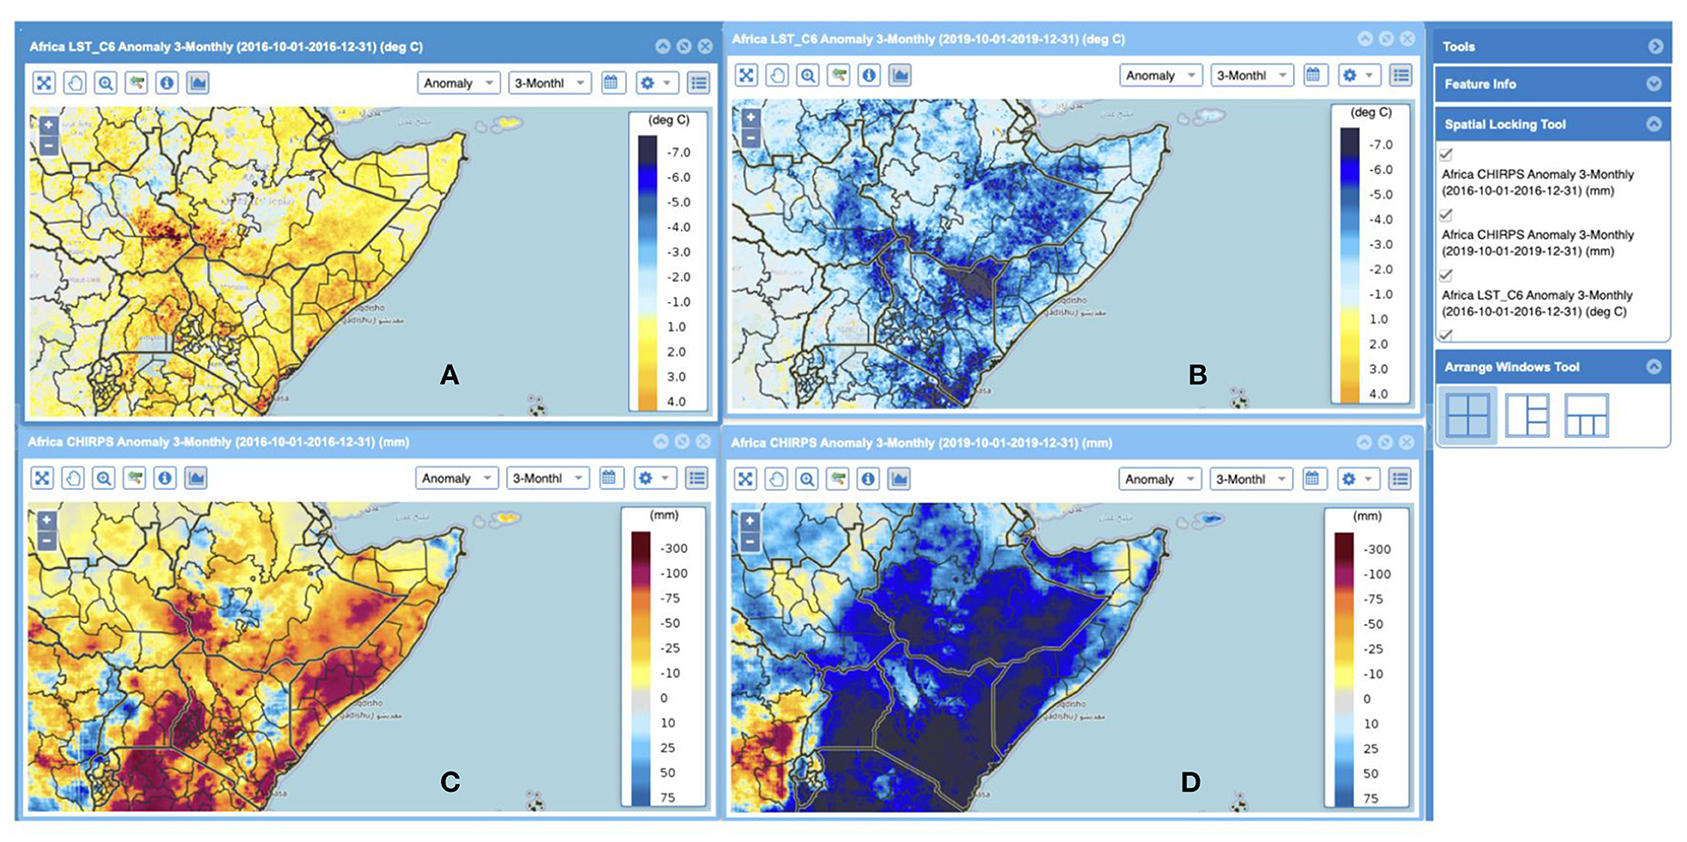
Figure 6. Maps of absolute anomalies of October-December LST for (A) 2016 and (B) 2019. October-December 2016 was a drought year for the region and October-December 2019 was a pluvial year as shown by corresponding CHIRPS anomaly for (C) 2016 and (D) 2019.
eMODIS Normalized Difference Vegetation Index (NDVI)
The USGS EROS generates a suite of products based on expedited Moderate Resolution Imaging Spectrometer (eMODIS) data (Jenkerson et al., 2010). eMODIS NDVI, which is available at 250 m X 250 m spatial resolution, is part of this suite and is generated to facilitate real-time and remote monitoring of vegetation conditions, particularly drought conditions. Vegetation conditions can help provide assessments of agricultural yield and production (Vrieling et al., 2008, 2011; Funk and Budde, 2009), as well as pasture availability (Pricope et al., 2013; Begue et al., 2014), both of which contribute to food availability and livelihoods—and therefore, to food security. The EWX provides access to dekadal-scale eMODIS NDVI data, as well as absolute anomaly and percent of median. NDVI anomaly maps are typically used for monitoring spatial extent and variability, as well as severity of vegetation drought conditions. For example, Figure 7 shows NDVI in percent of median for the last dekad of February during the last few years; these maps highlight that the region of southern Africa (SA) experienced multiple drought events in recent years. Multiple widespread droughts, and in some cases, consecutive drought events (repeated droughts in the same region) in SA have led to substantial increases in the number of people needing emergency food assistance since 2015 (FEWS NET, 2020).
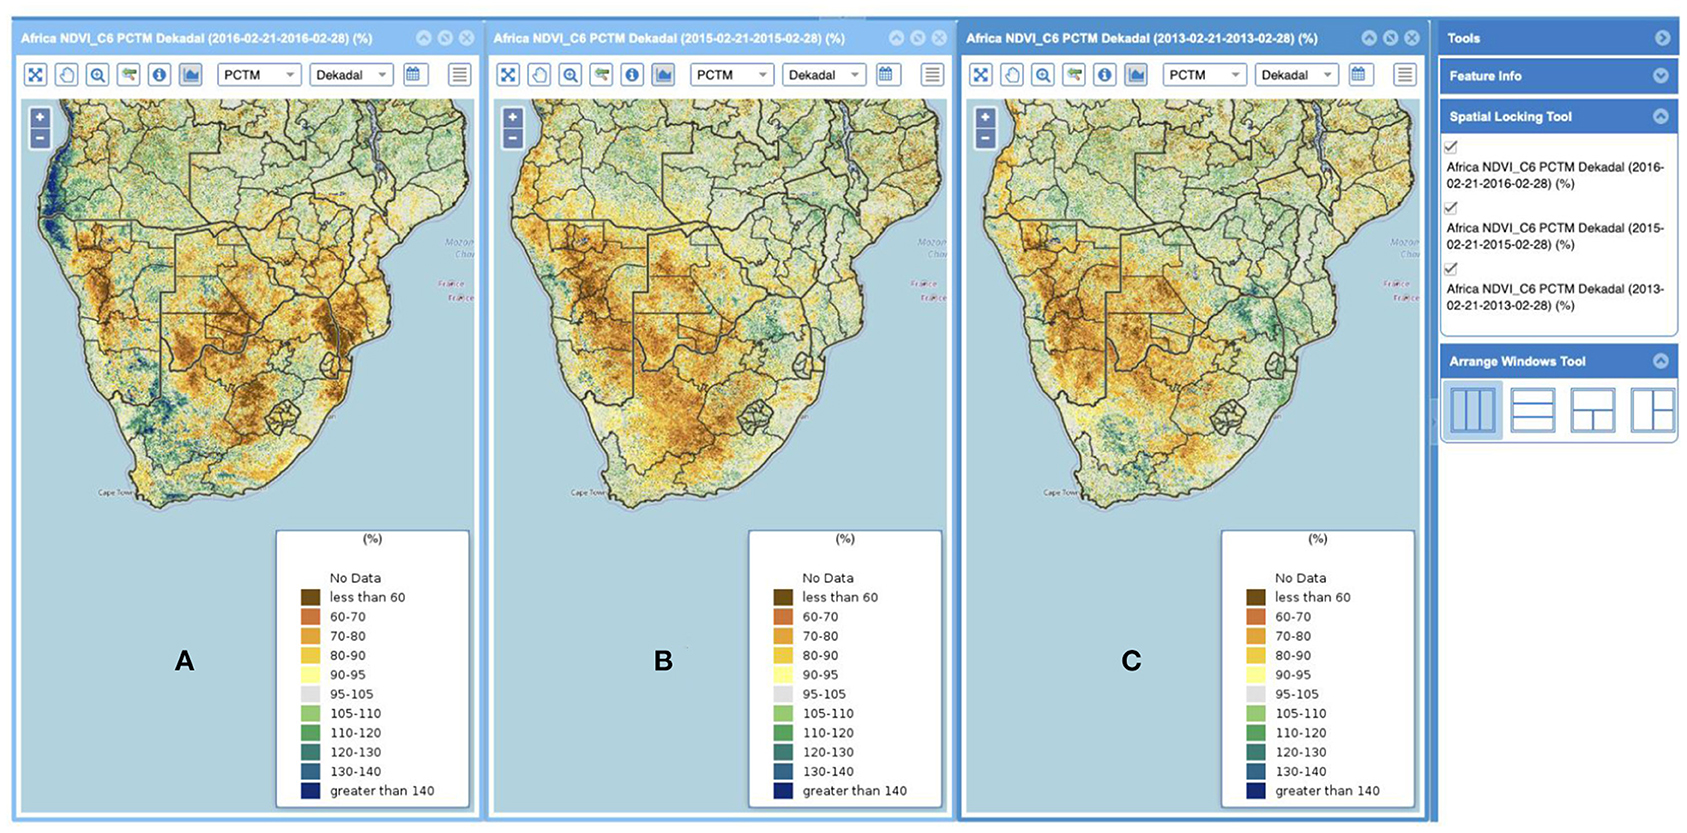
Figure 7. Maps of eMODIS NDVI in % of median, for the third dekad of February during the (A) 2015/16, (B) 2014/15, (C) 2012/13 seasons showing multiple drought events in the region.
CHIRPS-Global Ensemble Forecast System (CHIRPS-GEFS)
In addition to the satellite (and in-situ) based EOs, EWX also allows access to weather forecasts. At present UCSB and RCMRD's instances of EWX, provide access to CHIRPS-GEFS which is a precipitation forecast product, in the form of maps and time-series graphics. EROS's EWX provides access to this product in the form of time-series graphs.
CHIRPS-GEFS is generated by downscaling and bias-correcting National Centers for Environmental Prediction's (NCEP) Global Ensemble Forecast System (GEFS) precipitation forecasts (Hamill et al., 2006). The process of downscaling and bias-correction of NCEP's GEFS to generate CHIRPS-GEFS, yields precipitation forecasts that are climatologically and resolution wise compatible with CHIRPS precipitation dataset [see section climate hazards center infrared precipitation with station data (CHIRPS)].
At first the ensemble mean of daily precipitation forecasts is calculated using the ensemble from operational NCEP-GEFS forecasts at resolution 0.50 X 0.50, then the ensemble mean daily forecasts are accumulated to get 5, 10, and 15-days total precipitation forecasts. Following which total precipitation forecasts are downscaled from their native resolution to 0.050 X 0.050 spatial resolution (same as the spatial resolution of CHIRPS). Finally, a rank-based quantile mapping approach is used to bias-correct downscaled forecasts relative to the empirical distribution (sampled from 2000 to 2019 period, which is the longest common period between the hindcast and CHIRPS climatology) of CHIRPS 5, 10, and 15-days values. The result of the quantile-matching scheme is that the average and variance of the CHIRPS data are approximately retained in the resulting CHIRPS-GEFS values, which allows for seamless application of CHIRPS-GEFS in conjunction with CHIRPS. At present CHIRPS-GEFS is being used for complementing routine agroclimatological monitoring products that are based on observations. Depending on time of the season, 15-days lead precipitation forecasts can be crucial for supporting early assessments of agropastoral conditions. For example, with CHIRPS (precipitation observation) and CHIRPS-GEFS (precipitation forecast) combination time series in EWX, users can quickly evaluate if the next 2 weeks of forecast precipitation amounts would exacerbate observed deficits or be substantial enough to reduce the deficits.
Example Applications to Support Decision-Making
The strength of EWX lies in its ready access to EOs, including maps, time series graphs, and analysis-ready data to support informed decision-making. The EWX is best suited to support decisions to mitigate impacts of climate-driven disasters, and to support long-term climate adaptation. In this section, we provide a few key examples of the application of the EWX in providing access to EOs for improved assessment of climate-driven extreme events and understanding of long-term climate variability and change.
The EWX is an effective tool for monitoring climate-driven extreme events, particularly drought events, which tend to develop more slowly than pluvial events. Drought conditions during a rainy season can lead to an increase in food insecurity, and drought monitoring during the rainy season can therefore support early warning of food insecurity. The EWX is also particularly attractive for monitoring, as it provides access to low-latency, gridded rainfall data sets, allowing for timely drought monitoring as opposed to relying on local in situ rainfall reports, which are often available with a lag of a few weeks.
In this section, using the example of the SA drought in 2015–16 (Archer et al., 2017; Funk et al., 2018; Shukla et al., 2020a), we demonstrate the value of the EWX as a drought monitoring tool. This drought event led to massive increases in food insecurity in the region. As per the Southern Africa Development Community (SADC) estimate (SADC, 2016), 23 million people in the region needed emergency food assistance.
Early warning of drought to support food insecurity starts several months before a season (Funk et al., 2019). In advance of a rainy season, the main focus is given to large-scale climate and sea surface temperature (e.g., El Niño-Southern Oscillation) conditions. Based on the large-scale climate anomalies, assumptions are made for how the rainy season will evolve. Prior to the start of 2015/16 rainy season in SA, as per the International Research Institute for Climate and Society (IRI) and Climate Prediction Center (CPC), who provided official El Niño-Southern Oscillation forecasts on July 9, 2015, the chances of an El Niño persisting through February were >90%. In addition to the high probability of El Niño development, the dynamical forecasts from the North American Multi-model System (NMME) (Kirtman et al., 2013) were forecasting the El Niño to be in the “strong” category (3-months average Niño 3.4 SST anomaly > 2°C). Historically, El Niño has been linked to enhanced probability of below-normal rainfall in the SA region (Reason and Jagadheesha, 2005; Meque and Abiodun, 2015; Manatsa et al., 2017; Gore et al., 2020), and the past “strong” El Niño events, such as 1982–83 and 1991–92, resulted in severe droughts (Pomposi et al., 2018). The Southern Africa Regional Climate Outlook Forum (SARCOF-19), held in August 2015, indicated enhanced chances of below-normal rainfall in the central and southern part of the SA region. As the rainy season approaches, this context of a higher chance of below-normal rainfall is critical, as it triggers close monitoring of rainfall and drought conditions (Funk et al., 2019).
Using the EWX, rainfall anomalies can be monitored closely given the context of the rainfall outlook. For example, Figure 8 shows the monthly rainfall anomalies from October 2015 through February 2016. It is clear from these maps that close monitoring of rainfall anomalies confirmed the high chances of rainfall drought development in the region. Starting from October 2015, several of the regions in central and southern SA experienced well-below-average rainfall. Rainfall deficits particularly intensified in parts of Zimbabwe and Mozambique. Displaying the crop zone boundaries (in red) on the maps highlights the fact that crop zones experienced the most severe deficit in rainfall, which has a direct effect on crop production in a rainfed region. The December to February (DJF) period is when this region typically receives most of its rainfall, so deficits during those months of 2015/16 were particularly serious.
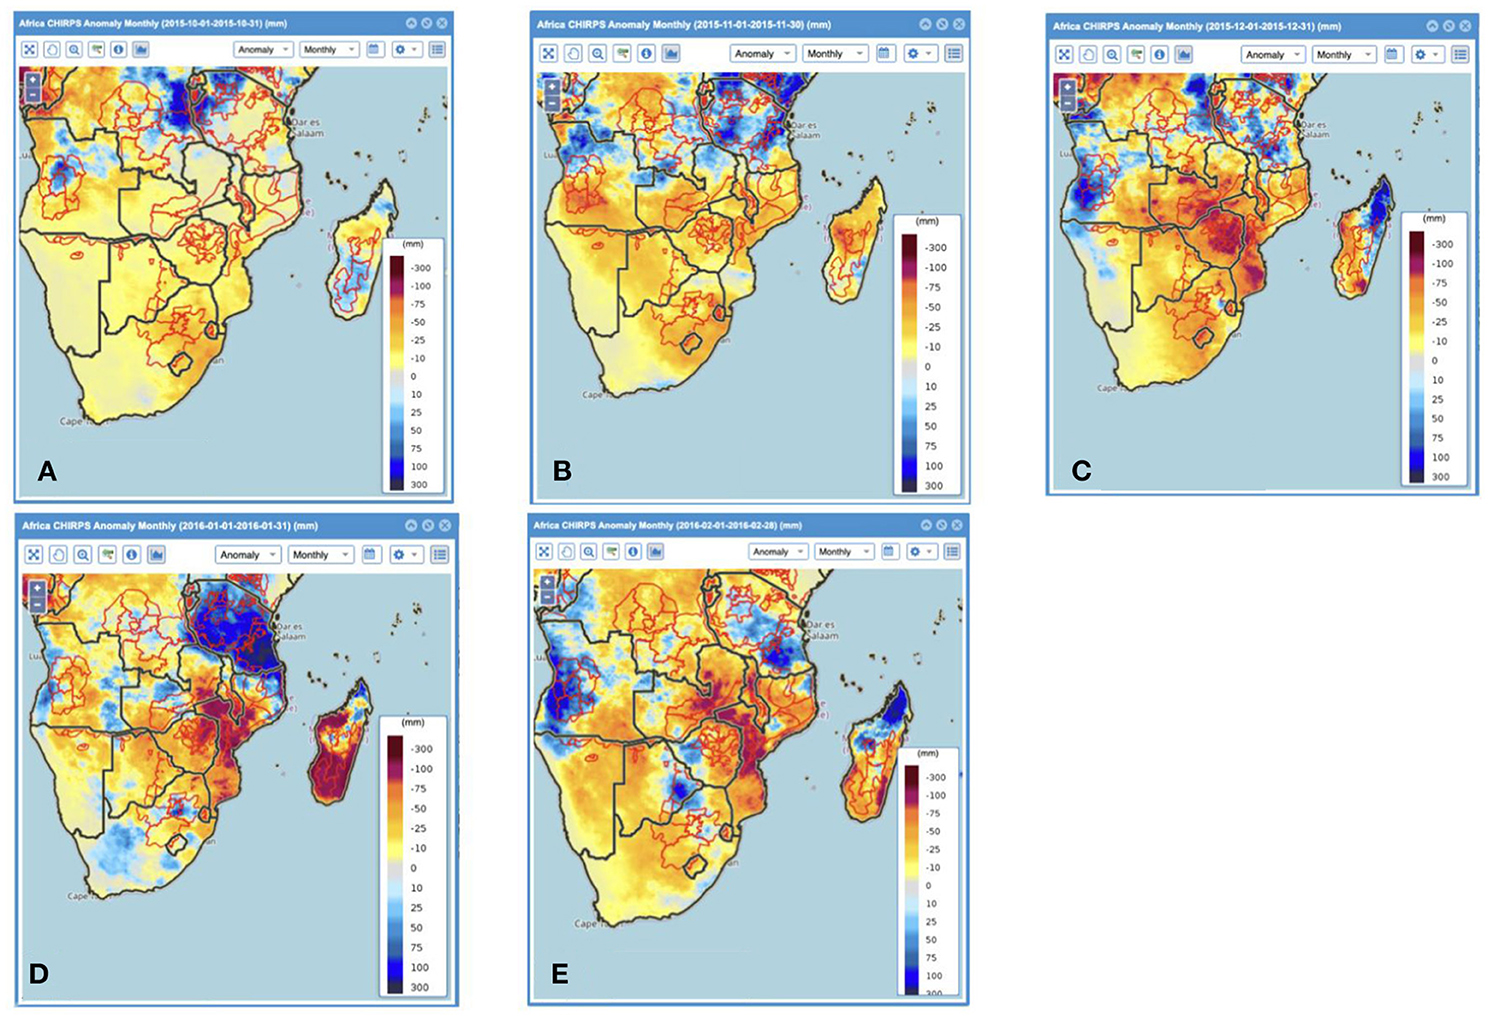
Figure 8. Maps showing monthly precipitation anomaly for (A) Oct 2015, (B) Nov 2015, (C) Dec 2015, (D) Jan 2016, and (E) Feb 2016 over the southern Africa region. The crop zone boundary layer (in red color) is overlaid on the maps.
Post February 2016, the EWX allows for a seasonal (DJF) assessment of the climate and vegetation conditions in the region. Figure 9 shows the December-February anomalies of precipitation (Figure 9A) and LST (Figure 9B). These maps highlight (i) the regions that experienced the most severe seasonal rainfall deficit and (ii) that this rainfall deficit was also accompanied by large positive anomalies in the LST (which, in part, may be due to the rainfall deficit, but also partly due to long-term climate change). The impact of rainfall deficit and high LST is reflected in the NDVI anomaly as of the first dekad of March 2016 (Figure 9C), as several regions of central and southern countries in SA were experiencing negative NDVI anomalies. A closer look at the time series graphs shows NDVI anomalies over the selected crop zones in Mozambique (Figure 9D) and Zimbabwe (Figure 9E) highlights two key points with direct implications to food insecurity: (i) prior to the 2015/16 droughts, these regions had already experienced multiple drought events (negative NDVI anomalies during November to March), and (ii) the NDVI anomalies in 2015/16 were generally more severe than in past years, indicating a more severe drought in this region following multiple droughts. As a result of these multiple drought events, the food insecurity in these regions reached the “Crisis” phase (per Integrated Food Security Phase Classification), as indicated by FEWS NET's food insecurity maps of “current situations” released in June 2016. The “Crisis” phase of acute food insecurity is when emergency food assistance is needed. Note that, by the end of February 2016, maps and graphs showed the severe drought conditions in these regions and demonstrated that this drought followed multiple drought events in the last few years. This highlights the value of drought monitoring using the EWX as an early warning tool for food insecurity.
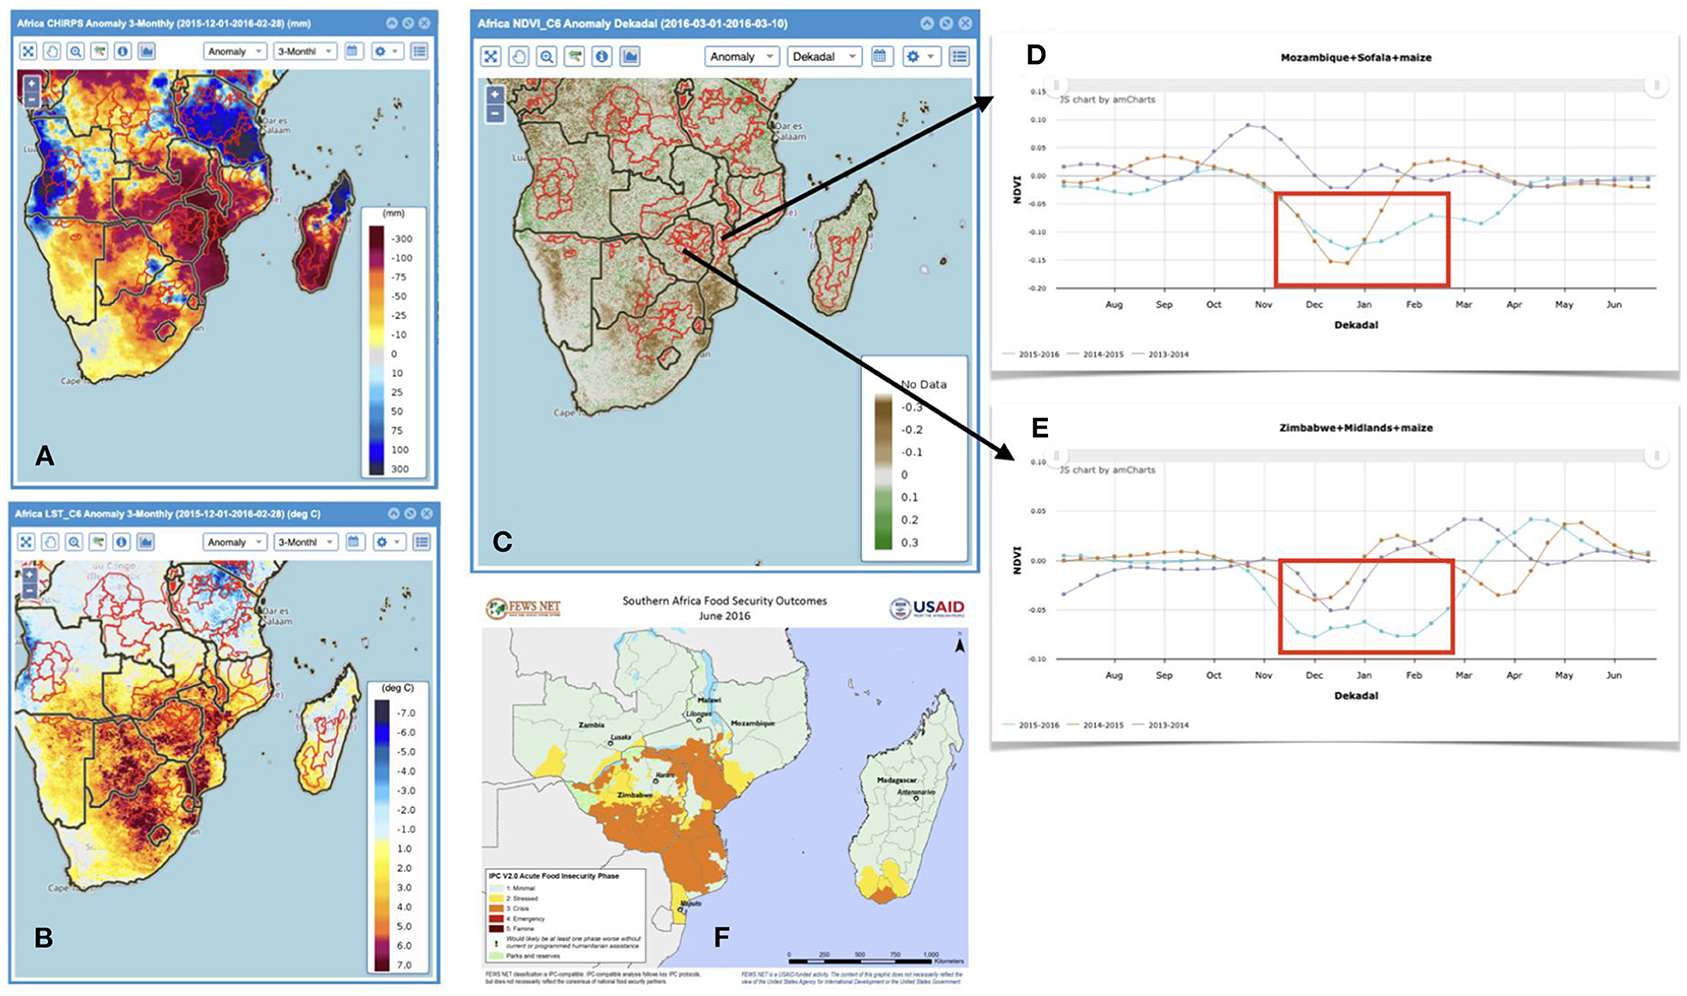
Figure 9. Seasonal overview of December-February 2015/16 season (A) CHIRPS anomaly (B) LST anomaly (C) NDVI anomaly for the first dekad of March, time series of NDVI anomalies for 2015–16 compared with the anomalies from the past 3 years for administrative unit-1 in (D) Mozambique and (E) Zimbabwe. (F) shows the food insecurity reports as of June 2016 (Source FEWS NET).
As another example of monitoring climate extreme events using EWX, Figure 10 shows how near-real-time precipitation maps and time series graphs can be used to monitor flooding conditions. Parts of EA experienced floods and landslides driven by extreme precipitation events. Several news outlets reported loss of lives and structures due to these extreme events, particularly during April and May. Figure 10A shows the March-May standardized precipitation anomaly map for Kenya. Comparing this map with that of the number of people displaced due to floods estimated by the United Nations Office for the Coordination of Humanitarian Affairs (UNOCHA, 2020) (Figure 10B) indicates that several of the regions with the highest number of displaced people also experienced March-May rainfall >2 standard deviations above the mean. A closer examination of the precipitation totals at pentadal scale for the administrative Unit-1 Turkana in northwest Kenya (Figure 10C) and Kisumu in southwest Kenya (Figure 10D) shows several pentads with much above-normal rainfall (blue line) than the climatological mean for these regions (red lines). This is another example of how the EWX can be used to monitor climate extremes, and, in this case, extreme precipitation totals that can lead to flooding and landslides.
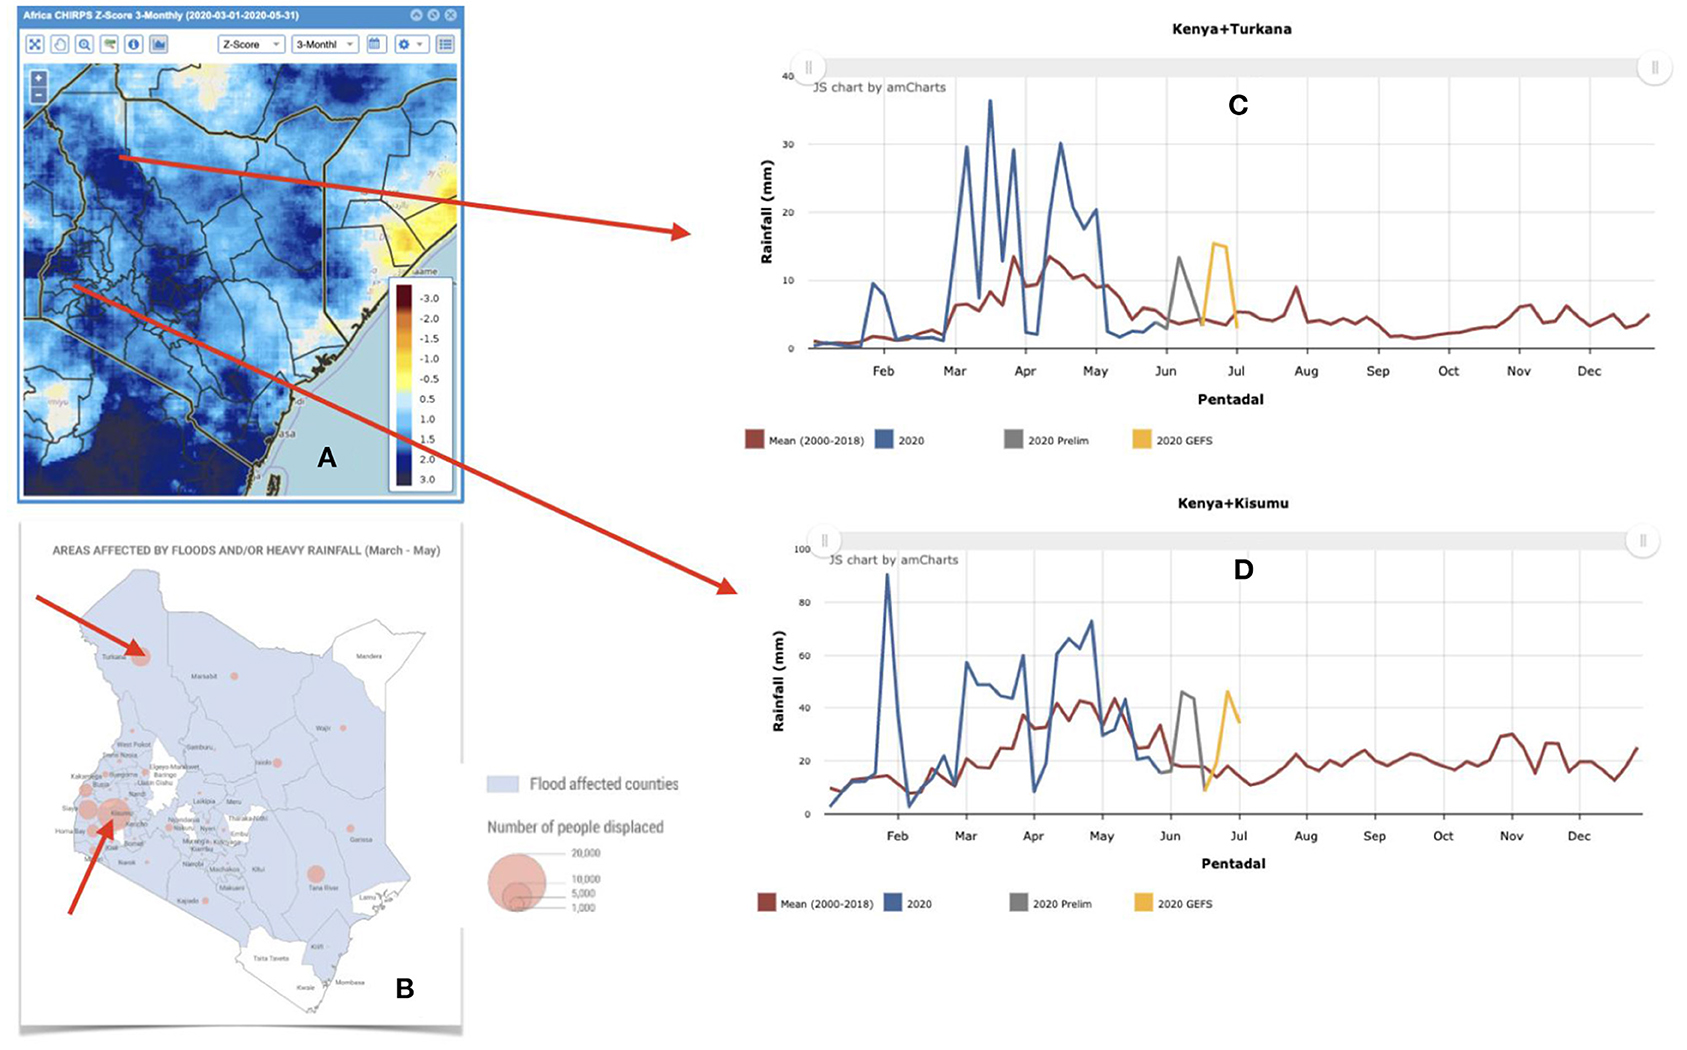
Figure 10. Seasonal overview of March-May 2020 season for East Africa (A) CHIRPS standardized anomaly (B) report of number of people displaced (source UNOCHR), time series of pentadal total rainfall during the season for two of the most affected regions in Kenya (C) Turkana and (D) Kisumu.
In addition to monitoring climate and vegetation conditions and extreme events, the EWX can also be used for visualizing and accessing analysis-ready data for examining long-term climate variability and change. The time series option can be used to extract spatially averaged EOs for a given time period (e.g., a given season) for all years, which can allow for examination of the climate variability and change in the given EO variable, season, and region. For example, Figure 11 shows time series of precipitation for 1981-present for an administrative unit-1 in Mali (Figure 11A) for the July-September season, and in Ethiopia for March-May and October-December seasons (Figure 11B) for the 3 months of their primary rainy seasons. The time series of July-September precipitation in the administrative unit-1 in Mali shows an apparent increase in precipitation. The time series of seasonal precipitation in the administrative unit-1 in Ethiopia shows the past extreme October-December precipitation events (e.g., 1997) and how the most recent October-December season compares with past extreme events. The underlying data of such time series can be downloaded for further analysis of climate variability and change.
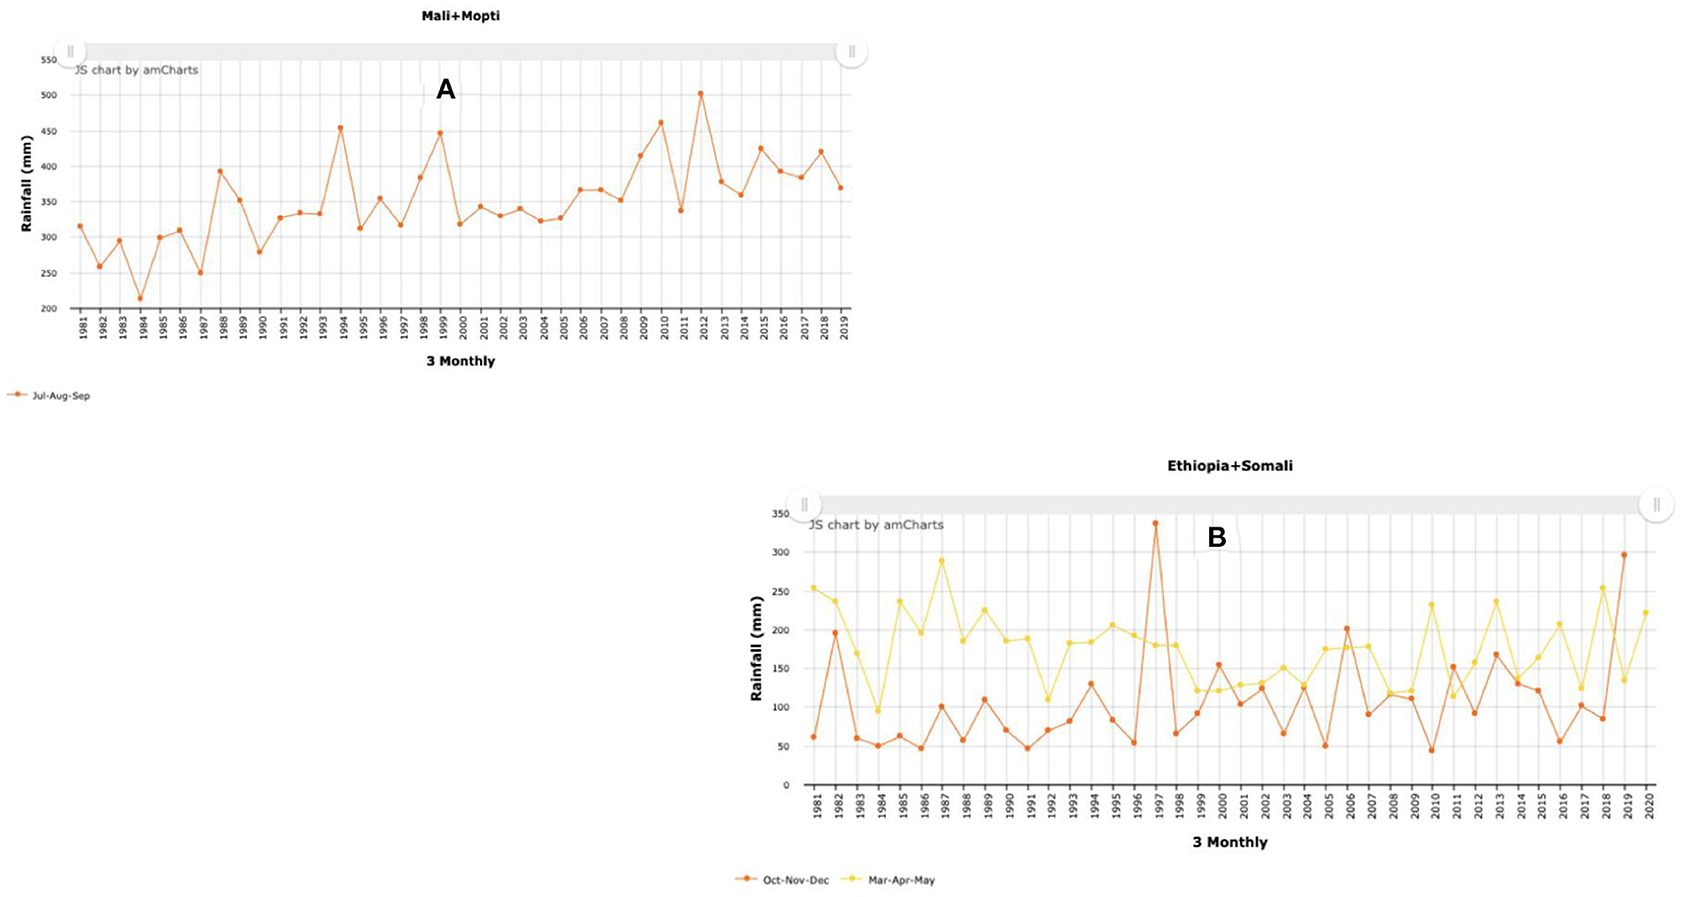
Figure 11. Time series graphs of seasonal precipitation for the main rainy seasons in an administrative unit-1 of (A) Mali (July-Sep season) and (B) Ethiopia (Mar-May and Oct-Dec season). These time series graphs and underlying data allow for analysis of long-term climate variability and change.
Finally, RCMRD'S EWX provides another important example of the value of this tool, highlighting the application of EWX in the region of eastern and southern Africa. An instance of EWX was installed at RCMRD through a recently completed SERVIR Applied Science Team (AST) project (Shukla et al., 2020b) (Table 1). A regional implementation of the EWX allowed RCMRD to add EOs that are most needed for addressing environmental challenges in the region. This implementation also allowed RCMRD to provide spatially averaged EOs for the boundaries that are most relevant for regional decision-making purposes. For example, RCMRD's EWX provides spatially averaged EOs for administrative three polygons for Kenya and Tanzania, which can help facilitate application of EOs for decisions at the ward level. Additionally, RCMRD's EWX allows access to EOs averaged over Northern Rangelands Trust (NRT) conservancies (Figure 12A) and Rapid grazing blocks (Figure 12B), and NRT grazing blocks (Figure 12C) which makes the EOs directly applicable for decision-makers such as NRT, which is a Kenya-based conservancy organization that aims to support the development of resilient communities in the region. Ever since its implementation, this version of the EWX has regularly provided access to EOs to regional users—mainly in Kenya, Tanzania, and Ethiopia (as per the usage statistics). Figure 13A shows the key usage statistics, including the number of users and number of page views for the cloud instance of the RCMRD EWX page between October 2019 through June 2020. During this time period, this page was viewed a total of 1,222 times, out of which 634 were unique views. On average, users spent about 5 min on this page. For comparison, Figure 13B shows the number of users and page views of USGS's EWX and EWX-Lite.
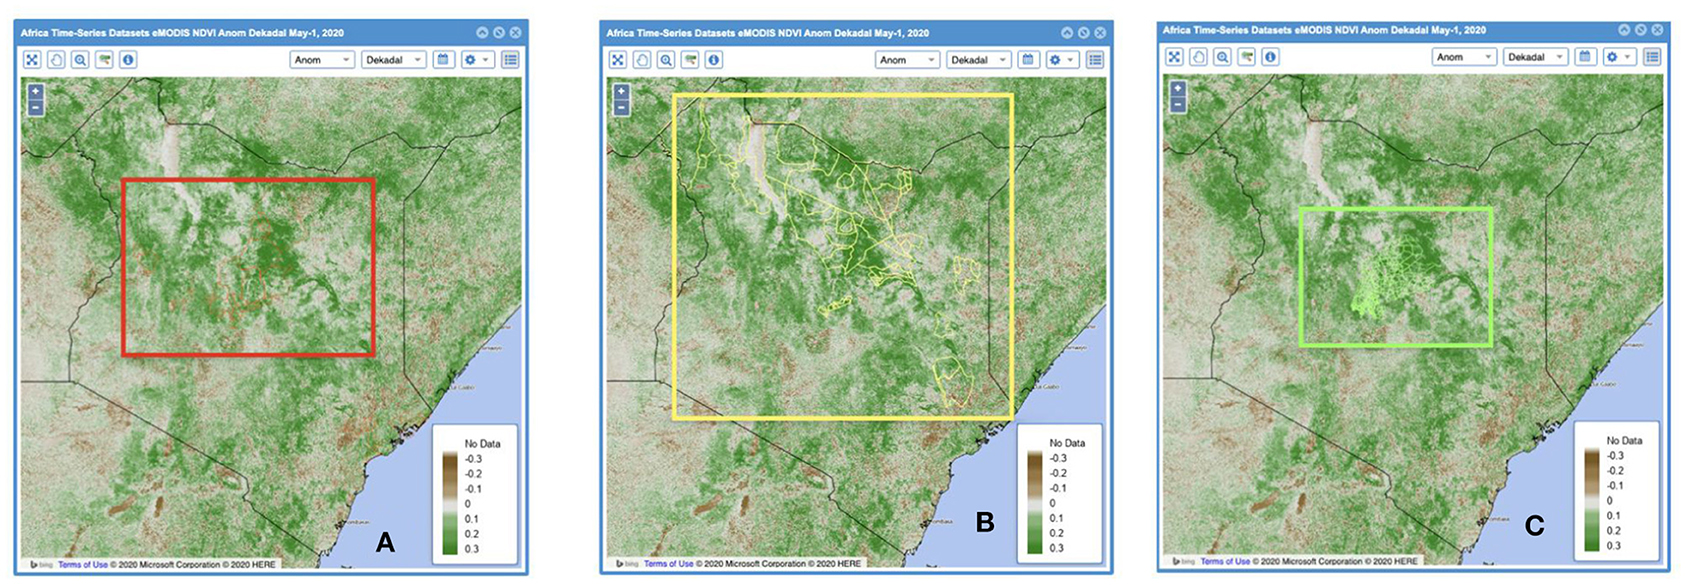
Figure 12. Example of boundary layers provided through RCMRD's EWX to support country level decision makers such as Northern Regional Trust (NRT). Shown are boundary layers for (A) NRT conservancies (B) Rapid grazing blocks and (C) NRT grazing blocks. The boundary layers are overlaid over a map showing NDVI anomaly as of the first dekad of May 2020.
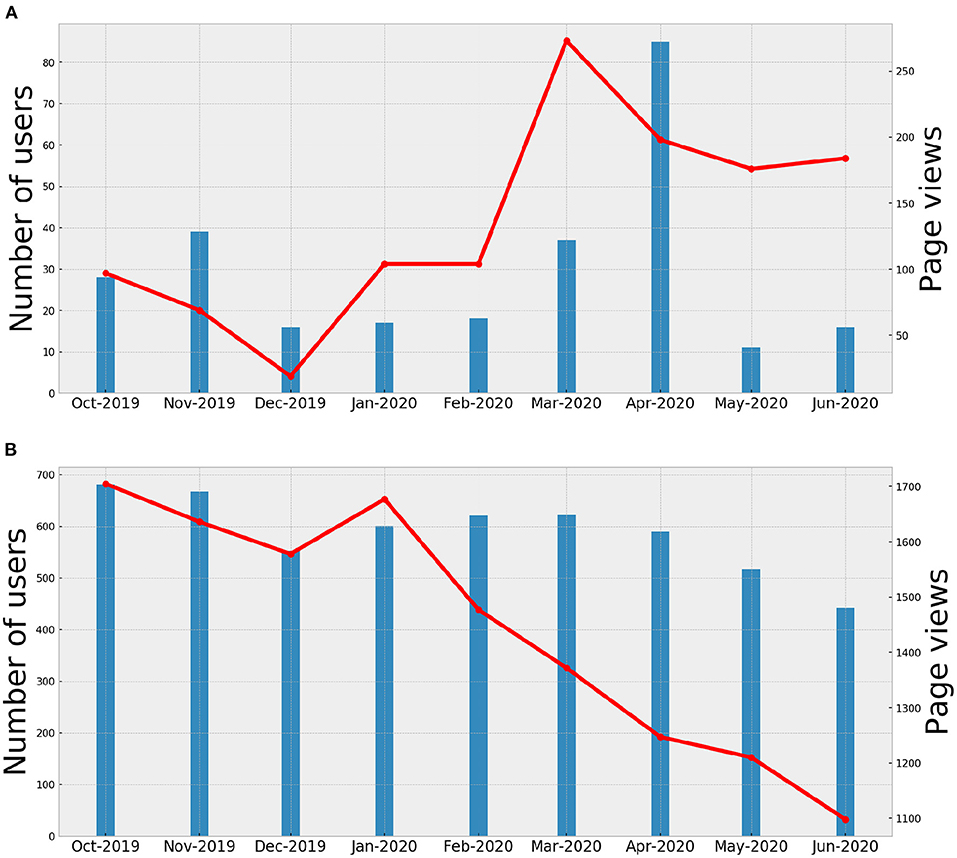
Figure 13. Key usage statistics of (A) RCMRD EWX and (B) USGS EWX, between October 2019 to June 2020. (Number of users per month is shown by blue bars and the number of page views is shown by the red line).
Concluding Remarks
Climate-related risks to food and water security are on the rise globally. Regions of the globe that are prone to food and water insecurity, most of which are in sub-Saharan Africa, are not only sensitive to climate-related risks, but they also face several challenges in terms of monitoring climate extreme events, mainly due to lack of in situ observations. Major strides have been made in terms of development and real-time availability of remote sensing-based EOs; however, access to those data sets and their applications for informed decision-making is limited. The EWX is a web service that aims both to fill that important existing gap and to facilitate application of EOs for decision-making to support mitigating the most adverse impacts of climate extreme events and climate adaptation.
Here we provide a comprehensive overview of the EWX, which includes:
1. Descriptions of several regional to global EOs that allow for near-real-time monitoring of agro-climatologial (climate, hydrologic, and agricultural) conditions
2. Illustration of some of the important features of the EWX, allowing for ready access to EOs in the form of gridded maps and spatially averaged time series graphs
3. Illustration of real-world examples of how EWX and its different features can be used to access and analyze EOs to monitor climate extreme events and facilitate long-term climate change and variability analysis. The illustrated examples include monitoring of both drought events and flood events. The examples also include the application of RCMRD's version of EWX specifically for the region of eastern and southern Africa.
Additionally, it is important to emphasize that, in addition to tools such as EWX, capacity-building training is needed to further enhance the application of EOs for decision-making. For example, in addition to the EWX implementation at RCMRD, through the SERVIR AST project, four training courses on the EWX and its applications were provided throughout the region. These four training courses involved 70+ technical professionals from regional, national, climate, meteorological, hydrological, and environmental agencies, as well as representatives from basin-scale water management agencies. These training courses facilitated several applications of the EWX for supporting informed decision-making in the region; for example, RCMRD, Tanzania Ministry of Agriculture's Food Security division, SADC's Climate Service Center, and Zambia Meteorological Department have utilized the EWX for regional support (Shukla et al., 2020b).
Finally, although the focus of this manuscript has been on the SSA region, several of the EOs available through the EWX are at least quasi-global (between 50 deg north to south), and hence, the EWX is applicable to supporting decision-making in other climatically vulnerable regions of the globe, such as the regions that SERVIR—the National Aeronautics and Space Administration (NASA) and United States Agency for International Development (USAID)-funded initiative—focuses on. Implementation of the EWX in these regions would further increase access to EOs and expand their application in empowering decision-making in order to mitigate the impacts of climate extremes and support climate adaptation. Furthermore, in order to facilitate EWX's application for EO access, in future we also plan to provide an user manual and hope to describe access and analysis of forecasts (weather to seasonal scale) using EWX in a future manuscript.
Data Availability Statement
Publicly available datasets were analyzed in this study. This data can be found at: https://earlywarning.usgs.gov/fews/ewx/index.html.
Author Contributions
SS wrote the first draft of the manuscript and prepare all the figures. ML, MA, MB, GH, JR, and CF reviewed and edited the manuscript. ML and MA contributed to development of Figure 1. ML, MA, MB, and JR contributed to development of EWX. JR, GH, and CF serve as investigators on miscellaneous funds that support development of EWX. All authors contributed to the article and approved the submitted version.
Conflict of Interest
The authors declare that the research was conducted in the absence of any commercial or financial relationships that could be construed as a potential conflict of interest.
Acknowledgments
The authors would like to thank Mr. Patrick Kabatha from the Geospatial Information Technology team at the RCMRD for providing usage analytics data for RCMRD's EWX, the USGS internal reviewer, Shahriar Pervez, KBR contractor to the USGS EROS, for his helpful comments and suggestions on this manuscript and the Climate Hazards Center's technical writer, Juliet Way-Henthorne, for providing professional editing. The authors acknowledge support of the United States Agency for International Development (USAID) cooperative agreement no. 72DFFP19CA00001, the USGS cooperative agreement #G14AC00042, the USGS Drivers of Drought program, and the Defense Advanced Research Projects Agency (DARPA) World Modelers Program under Army Research Office (ARO) prime contract no. W911NF-18-1-0018. Any opinions, findings, and conclusions or recommendations expressed in this material are those of the author(s) and do not necessarily reflect the position or the policy of DARPA and ARO, and no such official endorsement by either should be inferred.
References
Archer, E. R. M., Landman, W. A., Tadross, M. A., Malherbe, J., Weepener, H., Maluleke, P., et al. (2017). Understanding the evolution of the 2014–2016 summer rainfall seasons in southern Africa: key lessons. Clim. Risk Manag. 16, 22–28. doi: 10.1016/j.crm.2017.03.006
Arsenault, K. R., Shukla, S., Hazra, A., Getirana, A., McNally, A., Kumar, S. V., et al. (2020). The NASA hydrological forecast system for food and water security applications. Bull. Amer. Meteor. Soc. 101, E1007–E1025. doi: 10.1175/BAMS-D-18-0264.1
Ashouri, H., Hsu, K.-L., Sorooshian, S., Braithwaite, D. K., Knapp, K. R., Cecil, L. D., et al. (2015). PERSIANN-CDR: daily precipitation climate data record from multisatellite observations for hydrological and climate studies. Bull. Am. Meteorol. Soc. 96, 69–83. doi: 10.1175/BAMS-D-13-00068.1
Begue, A., Vintrou, E., Saad, A., and Hiernaux, P. (2014). Differences between cropland and rangeland MODIS phenology (start-of-season) in mali. Int. J. Appl. Earth Obs. Geoinformation 31, 167–170. doi: 10.1016/j.jag.2014.03.024
Brown, M. E., Escobar, V., Moran, S., Entekhabi, D., O'Neill, P. E., Njoku, E. G., et al. (2013). NASA's soil moisture active passive (SMAP) mission and opportunities for applications users. Bull. Am. Meteorol. Soc. 94, 1125–1128. doi: 10.1175/BAMS-D-11-00049.1
Campbell, B. M., Vermeulen, S. J., Aggarwal, P. K., Corner-Dolloff, C., Girvetz, E., Loboguerrero, A. M., et al. (2016). Reducing risks to food security from climate change. Glob. Food Secur. 11, 34–43. doi: 10.1016/j.gfs.2016.06.002
Das, N. N., Entekhabi, D., Dunbar, R. S., Colliander, A., Chen, F., Crow, W., et al. (2018). The SMAP mission combined active-passive soil moisture product at 9 km and 3 km spatial resolutions. Remote Sens. Environ. 211, 204–217. doi: 10.1016/j.rse.2018.04.011
Dinku, T., Funk, C., Peterson, P., Maidment, R., Tadesse, T., Gadain, H., et al. (2018). Validation of the CHIRPS satellite rainfall estimates over eastern Africa. Q. J. R. Meteorol. Soc. 144, 292–312. doi: 10.1002/qj.3244
Donlon, C., Berruti, B., Buongiorno, A., Ferreira, M. H., Féménias, P., Frerick, J., et al. (2012). The global monitoring for environment and security (GMES) sentinel-3 mission. Remote Sens. Environ. 120, 37–57. doi: 10.1016/j.rse.2011.07.024
Dorigo, W., Wagner, W., Albergel, C., Albrecht, F., Balsamo, G., Brocca, L., et al. (2017). ESA CCI soil moisture for improved earth system understanding: state-of-the art and future directions. Remote Sens. Environ. 203, 185–215. doi: 10.1016/j.rse.2017.07.001
Drusch, M., Del Bello, U., Carlier, S., Colin, O., Fernandez, V., Gascon, F., et al. (2012). Sentinel-2: ESA's optical high-resolution mission for GMES operational services. Remote Sens. Environ. 120, 25–36. doi: 10.1016/j.rse.2011.11.026
Falkenmark, M. (2013). Growing water scarcity in agriculture: future challenge to global water security. Philos. Trans. R. Soc. Math. Phys. Eng. Sci. 371:20120410. doi: 10.1098/rsta.2012.0410
FAO (2016). Damage and Losses Due to Weather and Climate-Related Disasters in Agricultural Sectors : FAO in Emergencies. Available online at: http://www.fao.org/emergencies/resources/documents/resources-detail/en/c/1106756/ (accessed May 21, 2020).
FEWS NET (2020). Southern Africa - Key Message Update: Mon, 2020-04-27 | Famine Early Warning Systems Network. Available online at: https://fews.net/southern-africa/key-message-update/april-2020 (accessed June 28, 2020).
Funk, C., and Budde, M. E. (2009). Phenologically-tuned MODIS NDVI-based production anomaly estimates for Zimbabwe. Remote Sens. Environ. 113, 115–125. doi: 10.1016/j.rse.2008.08.015
Funk, C., Davenport, F., Harrison, L., Magadzire, T., Galu, G., Artan, G. A., et al. (2018). Anthropogenic enhancement of moderate-to-strong el niño events likely contributed to drought and poor harvests in southern Africa during 2016. Bull. Am. Meteorol. Soc. 99, S91–S96. doi: 10.1175/BAMS-D-17-0112.1
Funk, C., Peterson, P., Landsfeld, M., Pedreros, D., Verdin, J., Shukla, S., et al. (2015a). The climate hazards infrared precipitation with stations—a new environmental record for monitoring extremes. Sci. Data 2, 1–21. doi: 10.1038/sdata.2015.66
Funk, C., Shukla, S., Mamadou, W., Rowland, J., Hoell, A., McNally, A., et al. (2019). Recognizing the famine early warning systems network (FEWS NET): over 30 years of drought early warning science advances and partnerships promoting global food security. Bull. Am. Meteorol. Soc. 100, 1011–1027. doi: 10.1175/BAMS-D-17-0233.1
Funk, C., Verdin, A., Michaelsen, J., Peterson, P., Pedreros, D., and Husak, G. (2015b). A global satellite-assisted precipitation climatology. Earth Syst. Sci. Data 7, 275–287. doi: 10.5194/essd-7-275-2015
Gelaro, R., McCarty, W., Suárez, M. J., Todling, R., Molod, A., Takacs, L., et al. (2017). The modern-era retrospective analysis for research and applications, version 2 (MERRA-2). J. Clim. 30, 5419–5454. doi: 10.1175/JCLI-D-16-0758.1
Gore, M., Abiodun, B. J., and Kucharski, F. (2020). Understanding the influence of ENSO patterns on drought over southern Africa using SPEEDY. Clim. Dyn. 54, 307–327. doi: 10.1007/s00382-019-05002-w
Hamill, T. M., Whitaker, J. S., and Mullen, S. L. (2006). Reforecasts: an important dataset for improving weather predictions. Bull. Am. Meteorol. Soc. 87, 33–46. doi: 10.1175/BAMS-87-1-33
Hersbach, H., and Dee, D. (2016). ERA5 reanalysis is in production. ECMWF. Available online at: https://www.ecmwf.int/en/newsletter/147/news/era5-reanalysis-production (accessed July 3, 2020).
Huffman, G. J., Adler, R. F., Bolvin, D. T., and Nelkin, E. J. (2010). “The TRMM multi-satellite precipitation analysis (TMPA),” in Satellite Rainfall Applications for Surface Hydrology, eds M. Gebremichael and F. Hossain (Springer: Netherlands), 3–22. doi: 10.1007/978-90-481-2915-7_1
Jenkerson, C. B., Maiersperger, T., and Schmidt, G. (2010). eMODIS: A User-Friendly Data Source. Geological Survey, U. S. Available online at: http://pubs.er.usgs.gov/publication/ofr20101055 (accessed September 17, 2019).
Jiang, C., Guan, K., Pan, M., Ryu, Y., Peng, B., and Wang, S. (2020). BESS-STAIR: a framework to estimate daily, 30 m, and all-weather crop evapotranspiration using multi-source satellite data for the US corn belt. Hydrol. Earth Syst. Sci. 24, 1251–1273. doi: 10.5194/hess-24-1251-2020
Karnieli, A., Agam, N., Pinker, R. T., Anderson, M., Imhoff, M. L., Gutman, G. G., et al. (2010). Use of NDVI and land surface temperature for drought assessment: merits and limitations. J. Clim. 23, 618–633. doi: 10.1175/2009JCLI2900.1
Kirtman, B. P., Min, D., Infanti, J. M., Kinter, J. L. III, Paolino, D. A., Zhang, Q., et al. (2013). The North American multimodel ensemble: phase-1 seasonal-to-interannual prediction; phase-2 toward developing intraseasonal prediction. Bull. Am. Meteorol. Soc. 95, 585–601. doi: 10.1175/BAMS-D-12-00050.1
Manatsa, D., Mushore, T., and Lenouo, A. (2017). Improved predictability of droughts over southern Africa using the standardized precipitation evapotranspiration index and ENSO. Theor. Appl. Climatol. 127, 259–274. doi: 10.1007/s00704-015-1632-6
Meque, A., and Abiodun, B. J. (2015). Simulating the link between ENSO and summer drought in Southern Africa using regional climate models. Clim. Dyn. 44, 1881–1900. doi: 10.1007/s00382-014-2143-3
Milly, P. C. D., Betancourt, J., Falkenmark, M., Hirsch, R. M., Kundzewicz, Z. W., Lettenmaier, D. P., et al. (2008). Stationarity is dead: whither water management? Science 319, 573–574. doi: 10.1126/science.1151915
Molteni, F., Buizza, R., Palmer, T. N., and Petroliagis, T. (1996). The ECMWF ensemble prediction system: methodology and validation. Q. J. R. Meteorol. Soc. 122, 73–119. doi: 10.1002/qj.49712252905
Pegion, K., Kirtman, B. P., Becker, E., Collins, D. C., LaJoie, E., Burgman, R., et al. (2019). The Subseasonal experiment (SubX): a multimodel subseasonal prediction experiment. Bull. Am. Meteorol. Soc. 100, 2043–2060. doi: 10.1175/BAMS-D-18-0270.1
Pomposi, C., Funk, C., Shukla, S., Harrison, L., and Magadzire, T. (2018). Distinguishing southern Africa precipitation response by strength of El Niño events and implications for decision-making. Environ. Res. Lett. 3:074015. doi: 10.1088/1748-9326/aacc4c
Pricope, N. G., Husak, G., Lopez-Carr, D., Funk, C., and Michaelsen, J. (2013). The climate-population nexus in the east African horn: emerging degradation trends in rangeland and pastoral livelihood zones. Glob. Environ. Change 23, 1525–1541. doi: 10.1016/j.gloenvcha.2013.10.002
Reason, C., and Jagadheesha, D. (2005). A model investigation of recent ENSO impacts over southern Africa. Meteorol. Atmos. Phys. 89, 181–205. doi: 10.1007/s00703-005-0128-9
Rodell, M., Famiglietti, J. S., Wiese, D. N., Reager, J. T., Beaudoing, H. K., Landerer, F. W., et al. (2018). Emerging trends in global freshwater availability. Nature 557, 651–659. doi: 10.1038/s41586-018-0123-1
SADC (2016). SADC Regional Vulnerability Assessment and Analysis Synthesis Report 2016, State of Food Insecurity and Vulnerability in the Southern African Development Community, Compiled from the National Vulnerability Assessment Committee (NVAC) Reports Presented at the Regional Vulnerability Assessment and Analysis (RVAA) Annual Dissemination Forum on 6-10 June 2016 in Pretoria, Republic of South Africa.
Saha, S., Moorthi, S., Pan, H.-L., Wu, X., Wang, J., Nadiga, S., et al. (2010). The NCEP climate forecast system reanalysis. Bull. Am. Meteorol. Soc. 91, 1015–1058. doi: 10.1175/2010BAMS3001.1
Schmidhuber, J., and Tubiello, F. N. (2007). Global food security under climate change. Proc. Natl. Acad. Sci. U.S.A. 104, 19703–19708. doi: 10.1073/pnas.0701976104
Senay, G. B., Kagone, S., and Velpuri, N. M. (2020). Operational global actual evapotranspiration: development, evaluation, and dissemination. Sensors 20:1915. doi: 10.3390/s20071915
Shukla, S., Arsenault, K., Hazra, A., Peters-Lidard, C., Davenport, F., Magadzire, T., et al. (2020a). Improving early warning of drought-driven food insecurity in southern Africa using operational hydrological monitoring and forecasting products. Nat. Hazards Earth Syst. Sci. 20, 1187–1201. doi: 10.5194/nhess-20-1187-2020
Shukla, S., Macharia, D., Husak, G., Landsfeld, M., Nakalembe, C., Blakeley, S., et al. (2020b). Enhancing access and usage of earth observations in environmental decision-making in Eastern and Southern Africa through capacity building. Front. Sustain. Food Syst. Land Livelihoods Food Secur.
Skofronick-Jackson, G., Peterson, W. A., Berg, W., Kidd, C., Stocker, E. F., Kirschbaum, D. B., et al. (2017). The global precipitation measurement (GPM) mission for science and society. Bull. Am. Meteorol. Soc. 98, 1679–1695. doi: 10.1175/BAMS-D-15-00306.1
Szantoi, Z., and Strobl, P. (2019). Copernicus sentinel-2 calibration and validation. Eur. J. Remote Sens. 52, 253–255. doi: 10.1080/22797254.2019.1582840
Tapley, B. D., Bettadpur, S., Ries, J. C., Thompson, P. F., and Watkins, M. M. (2004). GRACE measurements of mass variability in the earth system. Science 305, 503–505. doi: 10.1126/science.1099192
Torres, R., Snoeij, P., Geudtner, D., Bibby, D., Davidson, M., Attema, E., et al. (2012). GMES sentinel-1 mission. Remote Sens. Environ. 120, 9–24. doi: 10.1016/j.rse.2011.05.028
UNOCHA (2020). Kenya: floods flash update no. 1 (7 May 2020)—Kenya. ReliefWeb. Available online at: https://reliefweb.int/report/kenya/kenya-floods-flash-update-no-1-7-may-2020 (accessed June 28, 2020).
Vrieling, A., de Beurs, K. M., and Brown, M. E. (2008). “Recent trends in agricultural production of Africa based on AVHRR NDVI time series,” in Remote Sensing for Agriculture, Ecosystems, and Hydrology X, Vol. 7104 (Cardiff: International Society for Optics and Photonics), 71040R. doi: 10.1117/12.799824
Vrieling, A., de Beurs, K. M., and Brown, M. E. (2011). Variability of African farming systems from phenological analysis of NDVI time series. Clim. Change 109, 455–477. doi: 10.1007/s10584-011-0049-1
Wan, Z. (2014). New refinements and validation of the collection-6 MODIS land-surface temperature/emissivity product. Remote Sens. Environ. 140, 36–45. doi: 10.1016/j.rse.2013.08.027
Wheeler, T., and von Braun, J. (2013). Climate change impacts on global food security. Science 341, 508–513. doi: 10.1126/science.1239402
Wulder, M. A., and Coops, N. C. (2014). Satellites: make earth observations open access. Nat. News 513:30. doi: 10.1038/513030a
Keywords: earth observation, food security, water security, web service, drought, climate services, remote sensing
Citation: Shukla S, Landsfeld M, Anthony M, Budde M, Husak GJ, Rowland J and Funk C (2021) Enhancing the Application of Earth Observations for Improved Environmental Decision-Making Using the Early Warning eXplorer (EWX). Front. Clim. 2:583509. doi: 10.3389/fclim.2020.583509
Received: 15 July 2020; Accepted: 16 December 2020;
Published: 09 February 2021.
Edited by:
Africa Ixmucane Flores-Anderson, University of Alabama in Huntsville, United StatesReviewed by:
Johnna Maria Infanti, National Oceanic and Atmospheric Administration (NOAA), United StatesLilian Wangui Ndungu, Regional Centre for Mapping of Resources for Development, Kenya
Copyright © 2021 Shukla, Landsfeld, Anthony, Budde, Husak, Rowland and Funk. This is an open-access article distributed under the terms of the Creative Commons Attribution License (CC BY). The use, distribution or reproduction in other forums is permitted, provided the original author(s) and the copyright owner(s) are credited and that the original publication in this journal is cited, in accordance with accepted academic practice. No use, distribution or reproduction is permitted which does not comply with these terms.
*Correspondence: Shraddhanand Shukla, sshukla@ucsb.edu