Radiomics Analysis of Magnetic Resonance Imaging Facilitates the Identification of Preclinical Alzheimer’s Disease: An Exploratory Study
 Tao-Ran Li
 Yue Wu4†
  Juan-Juan Jiang
 Jie-Hui Jiang
 Ying Han
- 1Department of Neurology, Xuanwu Hospital of Capital Medical University, Beijing, China
- 2Center of Alzheimer’s Disease, Beijing Institute for Brain Disorders, Beijing, China
- 3National Clinical Research Center for Geriatric Disorders, Beijing, China
- 4Key Laboratory of Specialty Fiber Optics and Optical Access Networks, Joint International Research Laboratory of Specialty Fiber Optics and Advanced Communication, School of Information and Communication Engineering, Shanghai University, Shanghai, China
- 5Turku PET Centre and Turku University Hospital, Turku, Finland
Diagnosing Alzheimer’s disease (AD) in the preclinical stage offers opportunities for early intervention; however, there is currently a lack of convenient biomarkers to facilitate the diagnosis. Using radiomics analysis, we aimed to determine whether the features extracted from multiparametric magnetic resonance imaging (MRI) can be used as potential biomarkers. This study was part of the Sino Longitudinal Study on Cognitive Decline project (NCT03370744), a prospective cohort study. All participants were cognitively healthy at baseline. Cohort 1 (n = 183) was divided into individuals with preclinical AD (n = 78) and controls (n = 105) using amyloid-positron emission tomography, and this cohort was used as the training dataset (80%) and validation dataset (the remaining 20%); cohort 2 (n = 51) was selected retrospectively and divided into “converters” and “nonconverters” according to individuals’ future cognitive status, and this cohort was used as a separate test dataset; cohort three included 37 converters (13 from the Alzheimer’s Disease Neuroimaging Initiative) and was used as another test set for independent longitudinal research. We extracted radiomics features from multiparametric MRI scans from each participant, using t-tests, autocorrelation tests, and three independent selection algorithms. We then established two classification models (support vector machine [SVM] and random forest [RF]) to verify the efficiency of the retained features. Five-fold cross-validation and 100 repetitions were carried out for the above process. Furthermore, the acquired stable high-frequency features were tested in cohort three by paired two-sample t-tests and survival analyses to identify whether their levels changed with cognitive decline and impact conversion time. The SVM and RF models both showed excellent classification efficiency, with an average accuracy of 89.7–95.9% and 87.1–90.8% in the validation set and 81.9–89.1% and 83.2–83.7% in the test set, respectively. Three stable high-frequency features were identified, all based on the structural MRI modality: the large zone high-gray-level emphasis feature of the right posterior cingulate gyrus, the variance feature of the left superior parietal gyrus, and the coarseness feature of the left posterior cingulate gyrus; their levels were correlated with amyloid-β deposition and predicted future cognitive decline (areas under the curve 0.649–0.761). In addition, levels of the variance feature at baseline decreased with cognitive decline and could affect the conversion time (p < 0.05). In conclusion, this exploratory study shows that the radiomics features of multiparametric MRI scans could represent potential biomarkers of preclinical AD.
Introduction
Alzheimer’s disease (AD) is an evolving medical challenge that represents the largest unmet medical need because of its epidemiology and irreversible as well as incurable nature (Long and Holtzman, 2019; Jia et al., 2020). A series of disappointing large-scale clinical trials in symptomatic patients have resulted in clinical consensus that efforts should move forward to the early stages of the disease (Sperling et al., 2011b; Golde et al., 2018). According to the latest National Institute on Ageing–Alzheimer’s Association (NIA-AA) diagnostic framework, cognitively healthy individuals with brain amyloid-β (Aβ) deposition have already entered the irreversible Alzheimer’s continuum (Jack et al., 2018) and have a higher risk of developing cognitive and functional decline (Papp et al., 2017; Insel et al., 2018). These individuals can be defined as preclinical AD patients. The accurate ultra-early diagnosis of the preclinical stage of AD exactly provides a window of opportunity for intervention and is thus of great clinical importance and being the first imperative.
As Aβ deposition is the criterion standard for the diagnosis of preclinical AD, its detection has become a crucial issue. Currently, the internationally recognized state-of-the-art biopsy assessment for brain Aβ depends on amyloid positron emission tomography (PET) imaging and cerebrospinal fluid analysis (Jack et al., 2018); however, their popularization has been limited by cost and the invasiveness of the procedure (Li T. R. et al., 2019). Hence, there is an urgent need for a convenient and inexpensive diagnostic technique. Magnetic resonance imaging (MRI) has been widely used in the clinical evaluation of neurodegeneration and has been incorporated into the AD diagnostic framework (Jack et al., 2018); comparatively, functional MRI (fMRI) and diffusion tensor imaging (DTI) are essentially limited to scientific research. Considerable research progress has been made in the discrimination of mild cognitive impairment (MCI) and dementia through the use of these different imaging modalities (Promteangtrong et al., 2015), which have shown promise in the identification of preclinical AD; however, there is currently a lack of diagnostic biomarkers.
Radiomics, a method of high-dimensional minable data analysis, can quantitatively examine a large set of phenotypic features and has previously been successfully applied to the evaluation of multiparametric MRI (MPMRI) and PET as imaging biomarkers in AD (Rathore et al., 2017; Zhou et al., 2018; Li Y. et al., 2019). Many studies have shown changes in the volumetric and morphometric indices of specific brain regions, including the hippocampus, thalamus, callosum, and cingulate gyrus, in the prophase of cognitive decline (Baron et al., 2001; Thomann et al., 2006; Balthazar et al., 2009; Pedro et al., 2012; Guo et al., 2014). Recent studies of texture analysis have suggested that abnormalities of textural features occur early (Sørensen et al., 2016; Feng F. et al., 2018; Lee et al., 2020) and can also distinguish between healthy controls, AD-MCI, and AD–dementia patients based on cortical, subcortical, or whole-brain analysis (de Oliveira et al., 2011; Li et al., 2014; Chaddad and Niazi, 2018; Chaddad et al., 2018; Feng F. et al., 2018; Feng Q. et al., 2018; Luk et al., 2018; Kun et al., 2020), and their accuracy in predicting the transition from MCI to dementia is higher than that of volume reduction (Sørensen et al., 2016; Luk et al., 2018; Lee et al., 2020). Relative to controls, both AD-MCI and AD–dementia patients showed widespread changes in multiple indices of DTI (Alves et al., 2012; Gyebnár et al., 2018). These findings highlight the potential use of MPMRI radiomics analysis as a measure of neurodegenerative processes in AD, which may contain unique information about changes at the microscopic level that can occur before changes at the macroscopic level, such as atrophy. However, to the best of our knowledge, no such studies focusing on preclinical AD have been previously reported. Deep learning is another effective classification method, but it requires a large number of image datasets, and clinicians cannot obtain interpretable features as imaging biomarkers (Yamanakkanavar et al., 2020); thus, we did not utilize this methodology.
With this study, we aimed to (a) explore novel imaging biomarkers based on radiomics analysis of MPMRI [structural MRI (sMRI), fMRI, and DTI]; and (b) employ classification models to discriminate preclinical AD based on radiomics features.
Materials and Methods
Study Design
The comprehensive workflow is shown in Figure 1, including establishment of the cohorts (A), preprocessing of images (B), extraction and selection of radiomics features (C), model establishment, classification experiments, correlation analysis (D), and longitudinal studies of typical features (E).
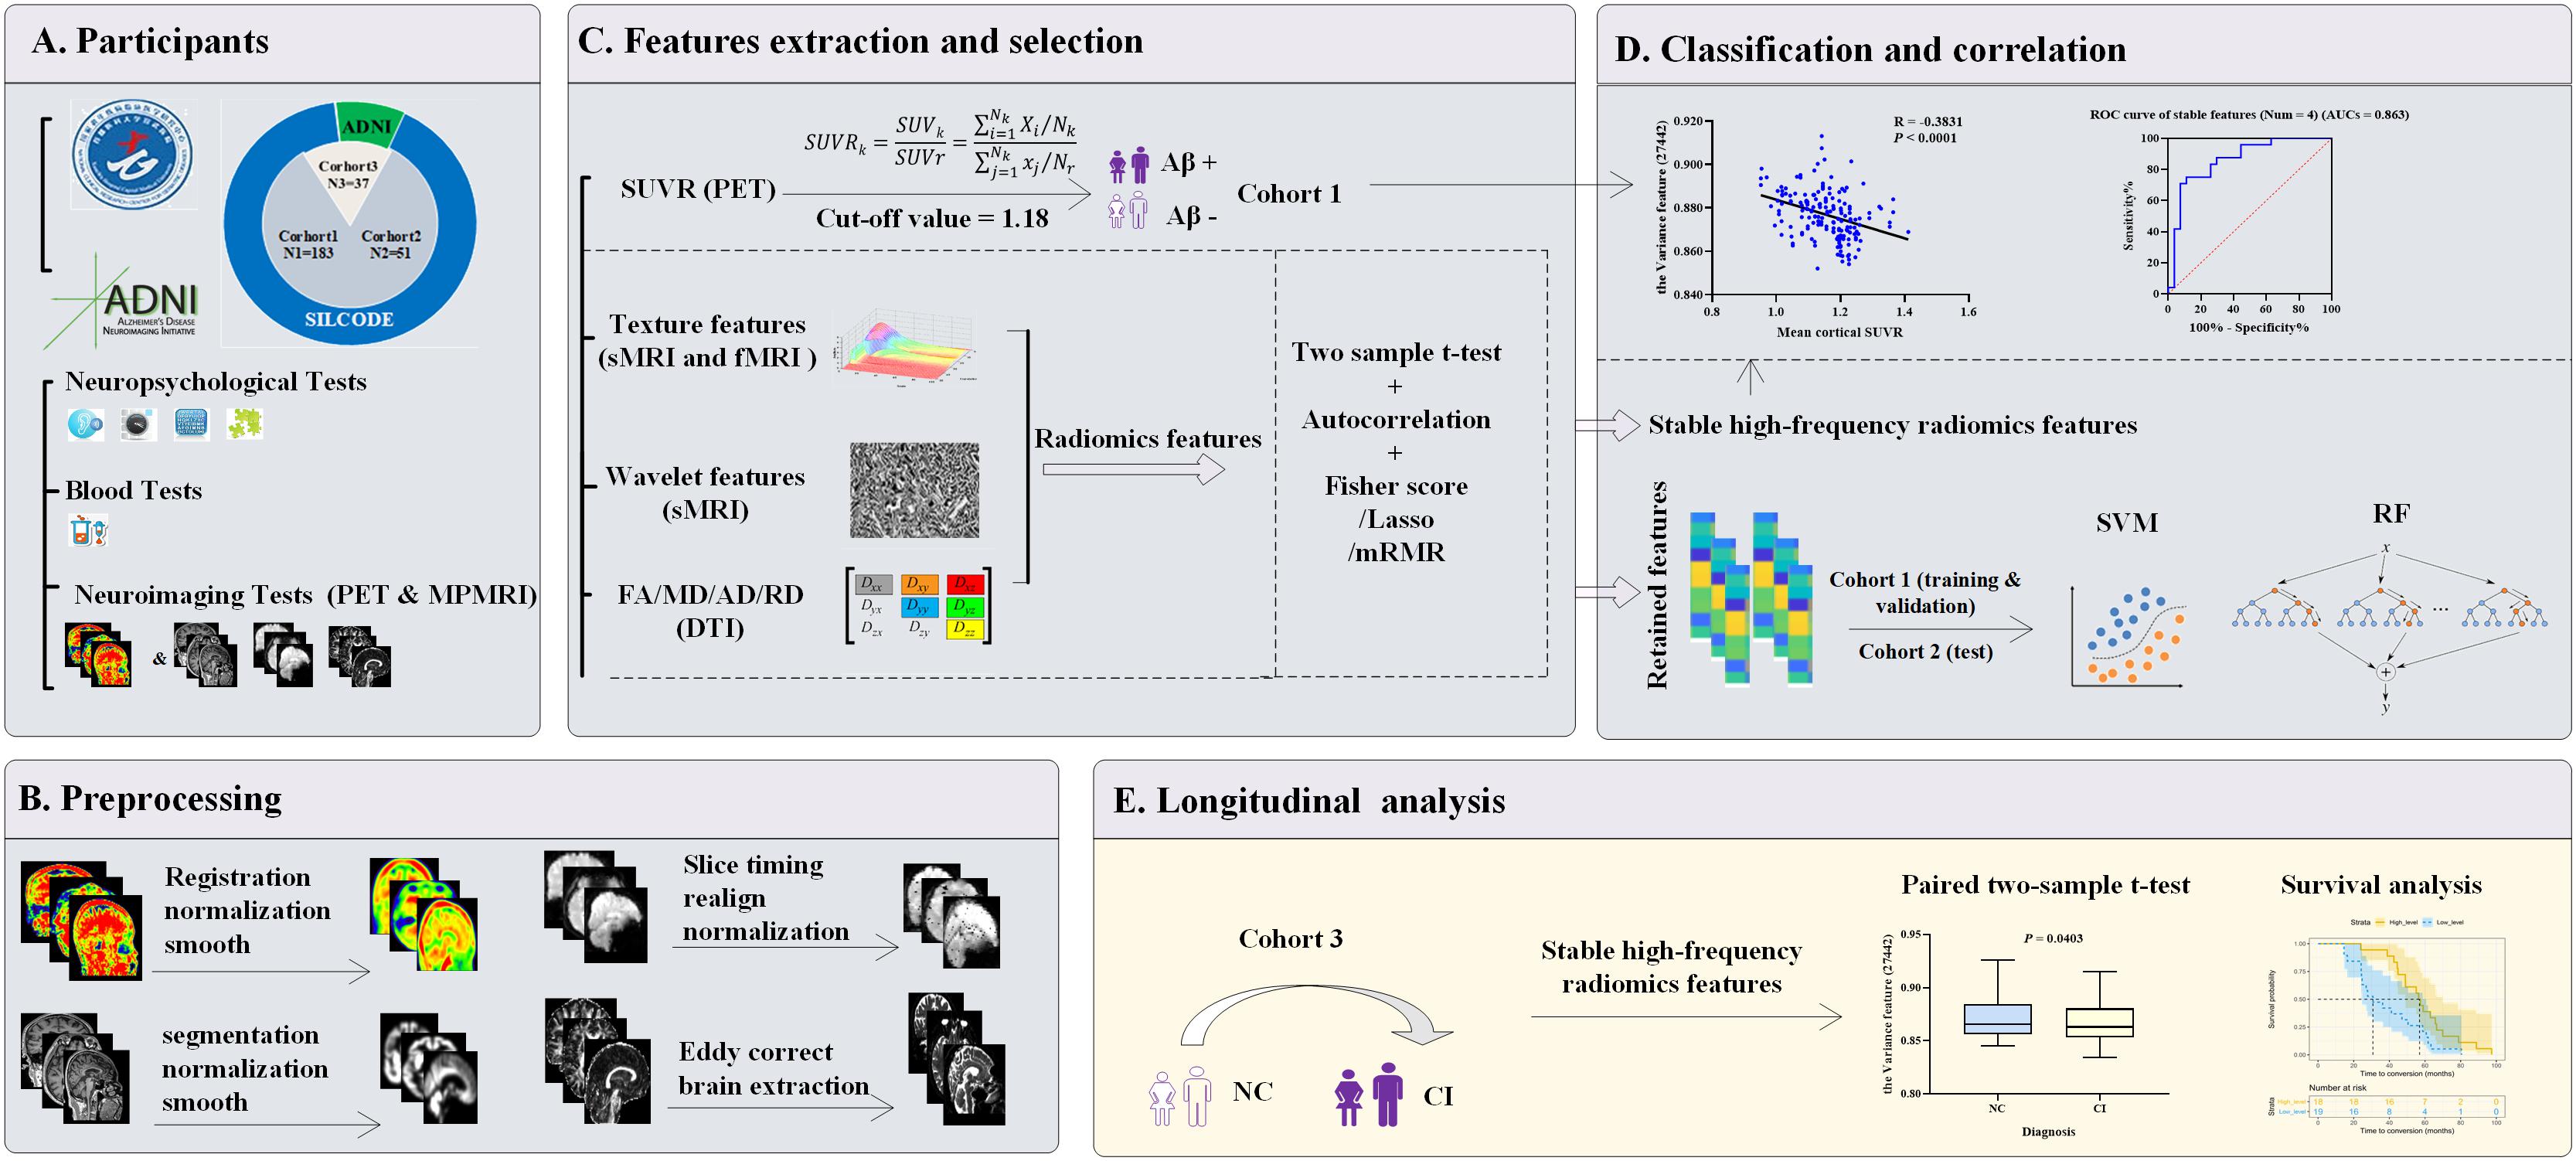
Figure 1. Workflow diagram. (A) Three cohorts were enrolled. Cohort 1 (n = 183) and cohort 2 (n = 51) were both from the SILCODE project and divided qualitatively by Aβ status or future cognitive outcomes, respectively. Cohort 3 (n = 37) included 24 “converters” from SILCODE and 13 from the ADNI. All participants were cognitively healthy at baseline and were evaluated in a standardized protocol. (B) Preprocessing of amyloid PET and MPMRI was performed for each modality. (C) Radiomics features were extracted from each modality, and a novel method characterized by the combination of function perturbations (t-test, autocorrelation test, and three independent algorithms) and sample perturbations (five-fold cross-validation and 100 repetitions) was performed to select features from the training dataset (80% of cohort 1). (D) Retained features were incorporated into classification models and verified in the validation (the remaining 20% of cohort 1) and test dataset (cohort 2), respectively. Furthermore, during the process of selection, stable high-frequency features were identified that were undisturbed by perturbations and correlated with the SUVR values, which played a good role in predicting prospective cognitive decline (cohort 2). (E) Levels of stable high-frequency features were tested to determine whether they change with cognitive decline or impact the conversion time. ADNI, Alzheimer’s Disease Neuroimaging Initiative; MRI, magnetic resonance imaging; sMRI, structural MRI; fMRI, functional MRI; DTI, diffusion tensor imaging; MPMRI, multiparameter MRI; PET, positron emission tomography; FA, fractional anisotropy; MD, mean diffusivity; AD, axial diffusivity; RD, radial diffusivity; SUVR, standard uptake value ratio; Aβ, amyloid β; Lasso, least absolute shrinkage and selection operator; mRMR, max-relevance and min-redundancy; SVM, support vector machine; RF, random forest; ROC, receiver operating characteristic; AUCs, areas under curve; NC, normal control; CI, cognitive impairment.
Participants
The study was part of the Sino Longitudinal Study on Cognitive Decline (SILCODE), an ongoing prospective cohort study (ClinicalTrials.gov identifier: NCT03370744; the protocol can be accessed at ClinicalTrials.gov) (Li X. et al., 2019), which centers on Xuanwu Hospital in cooperation with an alliance of 94 hospitals from 50 cities in China. The SILCODE project is a constellation of interconnected substudies, and one of its aims is to assess the diagnostic application of imaging in different stages of the cognitive continuum. Therefore, baseline standardized clinical evaluation and MPMRI were offered to all participants, resulting in the enrollment of 1,594 individuals with different diagnoses and ranging from being cognitively unimpaired to a confirmed diagnosis of dementia. In this study, we established three cohorts from the database and the Alzheimer’s Disease Neuroimaging Initiative (ADNI,1) with high selectivity. In cohort 1, 183 cognitively healthy participants with amyloid-PET imaging were recruited between July 2016 and November 2018 sequentially, all from the SILCODE project (Supplementary Figure 1A). In cohort 2, 51 participants were included; they participated in the SILCODE project between December 2009 and December 2015, were selected retrospectively, and were interviewed every 10–15 months until the end of 2019, with 24 later experiencing cognitive decline and 27 remaining healthy (Supplementary Figure 1B). In cohort 3, the 24 “converters” from cohort 2 and an additional 13 individuals from ADNI were included; they all underwent MPMRI examinations at baseline and also when cognitive deterioration was first identified. The entry criteria for healthy individuals have been described previously (Chen et al., 2019; Li X. et al., 2019). The diagnosis of dementia was based on the guidelines of the NIA-AA workgroups (McKhann et al., 2011), and of MCI was based on Petersen’s criteria (before 2016) (Petersen, 2004) or a neuropsychological method (after 2016) (Bondi et al., 2014).
Participants in cohort 1 underwent a dynamic scan with Florbetapir F-18 (AV45). The whole brain voxel-wise standardized uptake value ratio (SUVR) was normalized to the whole cerebellum, representing the mean cortical SUVR. For the dichotomy, amyloid-PET positivity (that is, participants who in the preclinical stage of the Alzheimer’s continuum) was defined a priori with the established cutoff of >1.18 (Fakhry-Darian et al., 2019). The results for each participant were confirmed by two senior radiologists who were blinded to any clinical information and made positive or negative judgments. If the judgment was inconsistent, a third radiologist was consulted to arbitrate in the dispute.
Informed consent was obtained from all participants. Further details regarding the rigorous evaluation of our participants are presented in Supplementary Figure 1 and Material.
Imaging Acquisition and Preprocessing
The MRI data of participants from SILCODE project were acquired using a 3.0-T MRI scanner (Magnetom Sonata; Siemens Healthineers AG, Erlangen, Germany) before 2016, or an integrated simultaneous 3.0-T time-of-flight PET/MR (SIGNA; GE Healthcare, Chicago, IL, United States) after that time point. Before undergoing imaging, subjects were instructed to keep their eyes closed but not fall asleep, relax their minds, and move as little as possible during imaging. Foam pads and headphones were used to minimize head movement and scanner noise. The sMRI was obtained with a magnetization prepared rapid gradient echo sequence (Siemens/GE): repetition time (TR) = 1,900 ms/6.9 ms, echo time (TE) = 2.2 ms/2.98 ms, slice number = 176/192; fMRI was obtained with a single-shot gradient-echo echo planar imaging (EPI) sequence (Siemens/GE): TR = 2,000 ms/2,000 ms, TE = 40 ms/30 ms, slice number = 28/28; and a single-shot spin-echo diffusion-weighted EPI sequence was used for the DTI data (Siemens/GE): TR = 11,000 ms/16,500 ms, TE = 98 ms/95.6 ms, slice number = 60/75. The detailed protocols can be found in the Supplementary Material.
The images of the ADNI participants were downloaded from the ADNI database. Detailed information regarding the acquisition protocol is publicly available on the LONI website2.
The standardized preprocessing of amyloid PET and MPMRI has been described in previous studies (Hassan et al., 2016; Li X. et al., 2019; Tian et al., 2019). The original DICOM data were converted to the NIfTI file format by using DCM2NII3. We then processed the MPMRI and amyloid-PET imaging data separately for each participant. For sMRI, the images were normalized and showed a spatial resolution of 91-mm × 109-mm × 91-mm with a 2-mm × 2-mm × 2-mm voxel size after being segmented into gray matter, white matter, and cerebrospinal fluid tissues. We then smoothed them using an isotropic Gaussian smoothing kernel with a full width at half maximum of 4 mm × 4 mm × 4 mm. For fMRI, the first 10 time-point images were discarded for magnetization balance. After that, the remaining 230 time-point images were corrected and aligned to the first time-point image to correct for head movements. The resulting motion-corrected volumes were coregistered to the anatomical T1-weighted images and normalized to the Montreal Neurological Institute template, resampling to a 3-mm cube voxel resolution. For DTI, we employed the Eddy Correct tool to correct the head motion and eddy current distortions (Wang et al., 2016; Tang et al., 2017) and used the brain extraction tool to remove the nonbrain tissues of the B0 image and create the brain mask (Smith, 2002). We then adopted the DTIFIT tool to fit the diffusion tensor at each voxel and produced four parameter maps encompassing fractional anisotropy, mean diffusivity, axial diffusivity, and radial diffusivity (Basser et al., 1994). For amyloid PET, the structural images were individually registered to the averaged PET images. We then performed segmentation of all the coregistered structural images, spatially normalizing the PET images to the Montreal Neurological Institute standard space by using the forward parameters (estimated during the segmentation), and smoothed the images with an 8-mm full width at half maximum Gaussian kernel.
The sMRI and fMRI images were preprocessed using the Data Processing Assistant for resting-state fMRI (DPASF;4) implemented in MATLAB R2018a (MathWorks, Natick, MA, United States) (Chao-Gan and Yu-Feng, 2010). DTI was performed using the pipeline for analyzing brain diffusion images (PANDA) implemented based on the FMRIB Software Library (Smith et al., 2004); amyloid-PET data were obtained using the Statistical Parametric Mapping (SPM12;5) implemented in MATLAB.
Feature Extraction
Feature extraction was performed for each modality separately. For sMRI, 43 texture features and 172 wavelet features of each region of interest (ROI; 116 in total, based on the AAL template) were extracted. For fMRI, 43 texture features of each ROI were extracted. For DTI, we calculated the white matter tracts and viewed the fractional anisotropy, mean diffusivity, axial diffusivity, and radial diffusivity as features. All extracted features were adjusted before selection using linear regression to control for the impact of age, gender, and education.
Feature extraction of the sMRI and fMRI data was performed using the Texture Toolbox from radiomics tools developed by Vallières et al. (2015)6 based on MATLAB; for DTI, the procedure was carried out using the PANDA (Smith et al., 2004; Cui et al., 2013). Further details are described in the Supplementary Table 1 and Material.
Feature Dimensionality Reduction and Selection
This step was achieved using MATLAB. More specifically, we performed a five-fold cross-validation on the dataset of cohort 1; that is, the data were randomly divided into a training set (80%) and a validation set (the remaining 20%). In the training set, three steps including t-tests, autocorrelation tests, and three independent algorithms [Fisher score, least absolute shrinkage and selection operator (Lasso), and max-relevance and min-redundancy (mRMR)] were adopted to filter the redundant and meaningless features. The remaining features were retained and incorporated into classification models. Importantly, we repeated the above steps 100 times. More details can be found in the Supplementary Material.
In addition, for each type of the above three algorithms, we calculated the number of occurrences of each retained feature, ranging from 0 to 500. The top 10 most frequently appearing features were defined as high-frequency features, and the stable high-frequency features represented the overlaps among the three perturbations.
Classification Experiments
The support vector machine (SVM) and random forest (RF) are both popular and mature machine learning algorithms with a solid theoretical basis (Uddin et al., 2019). Here, these two classification models were established to verify the performance of retained features in the validation (20% of cohort 1) and test set (cohort 2), respectively. The SVM model employed three different kernels: sigmoid, linear, and radial basis. Corresponding to the retained features, there were 500 permutation experiments using the Fisher score, Lasso, or mRMR algorithm. The final accuracy, sensitivity, and specificity results were presented as average values ± standard deviation (SD) for each model.
In addition, receiver operating characteristic (ROC) analyses were performed to evaluate the ability of each stable high-frequency feature in predicting prospective cognitive decline of participants in the test set, and the areas under curve (AUCs) were calculated. The analysis was performed using SPSS 13.0 software (SPSS Inc., Chicago, IL, United States). Further details are provided in the Supplementary Material.
Longitudinal Analyses
As an independent longitudinal research study, this aspect of the study aimed to further clarify the role of the stable high-frequency features identified from the training dataset (80% of cohort 1) in another separate test dataset, that is, cohort 3. The feature extraction was identical to that mentioned above. In order to test whether the levels of stable high-frequency features changed with cognitive decline, we performed comparisons at two different time points of cognitive stages and verified whether these features affected the conversion time of individuals using survival analyses.
Statistical Analysis
The demographic data of participants are summarized as numbers (%) or mean ± SD for categorical and continuous variables, respectively. The between-group comparisons were performed using the χ2 test for categorical variables or the two-sample t-test for continuous variables (two-tailed). A p < 0.05 was considered statistically significant.
In the process of dimensionality reduction, the two-sample t-test was two-tailed and considered significant when p < 0.05; for the autocorrelation test, we calculated the Pearson correlation coefficients between features and considered the paired features to have a high correlation when values in the pairwise correlation were greater than 0.8. Furthermore, in order to better understand the association between radiomics features and iconic pathological changes in AD, we created Pearson correlations to evaluate the relationship between stable high-frequency features and mean cortical SUVR values and acquired the results after adjusting for age, gender, education, and Montreal Cognitive Assessment (MoCA) scores.
In the longitudinal analyses, we mapped out the changing trajectory of each stable high-frequency feature at the individual level and performed paired two-sample t-tests at the group level (two-tailed, p < 0.05). In the survival analyses, individuals of cohort 3 were divided into two parts, the high-level group (n = 18) and low-level group (n = 19), according to the median level of each stable high-frequency feature. Subsequently, cumulative probabilities of clinical conversion by the two groups were displayed according to the Kaplan–Meier method, and the survival curves were compared between groups in a univariate analysis using the log-rank test.
These above analyses were performed in SPSS or MATLAB.
Results
Participants
In cohort 1,183 healthy participants were included. Their clinical and MPMRI examinations were almost continuous, and amyloid PET was performed within 3 months of the MPMRI scan. Eventually, 78 amyloid-positive and 105 negative participants were identified. Compared to the negative individuals, individuals who were positive were older (p = 0.039) and had a higher AV45 SUVR (p < 0.0001), but there were no statistical differences in the other clinical data collected (Table 1).
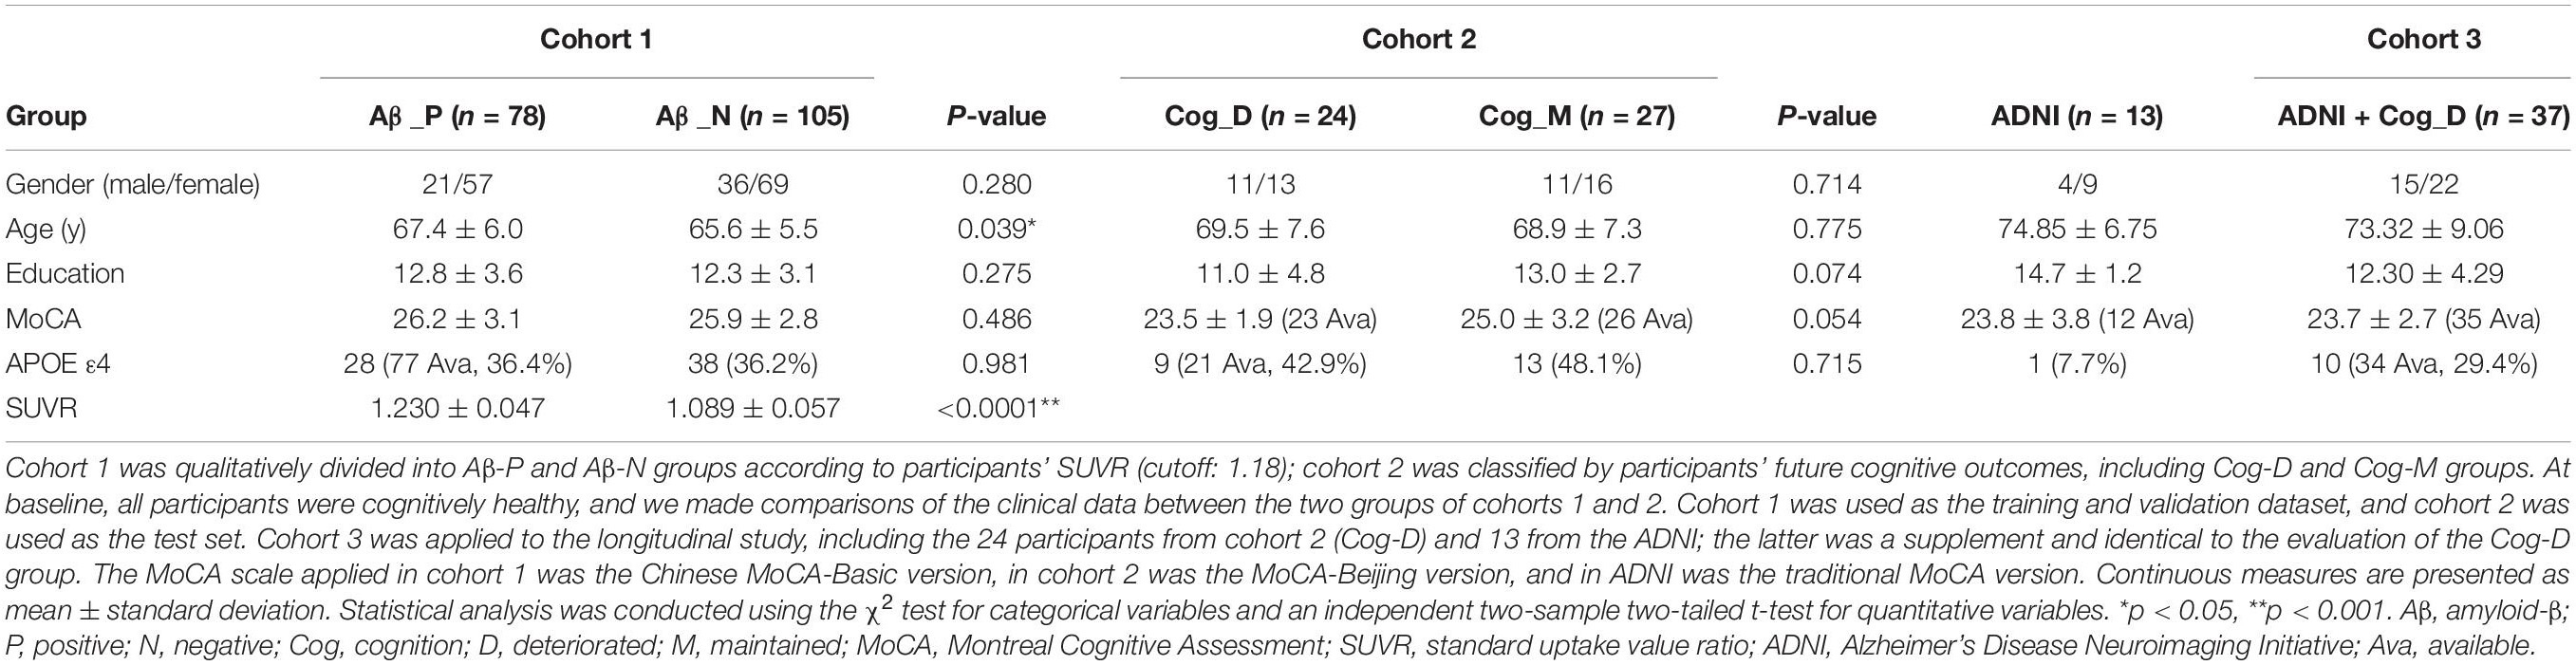
Table 1. Clinical characteristics of participants.
In cohort 2, an additional 51 healthy participants were dichotomized according to their future cognitive outcomes. They were interviewed every 10–15 months, and we found the cognition of 24 of these participants deteriorated after an average of 41.2 months [interquartile range (IQR), 24.5–52.7], with 23 progressing to MCI and one to dementia. The others remained healthy after at least three follow-up visits (54.8 months; IQR, 48.9–58.9). As shown in Table 1, there were no differences between the two groups.
Cohort 3 included the 24 converters from cohort 2 as well as 13 from ADNI. Their average score on the MoCA scale dropped from 23.7 ± 2.7 at baseline to 20.5 ± 3.8 at the follow-up time point. The average conversion time of ADNI participants was 62.1 months (IQR, 55.1–66.5), compared to 48.1 months (IQR, 27.8–61.7) across the whole group. The individuals from ADNI were used as an additional supplement, with 12 progressing from cognitively healthy individuals to MCI and one to dementia. Other data are shown in Table 1.
Radiomics Features Selection
For each participant in the three cohorts, 30,128 features were extracted, including 24,940 features from sMRI, 4,988 from fMRI, and 200 from DTI. To avoid overfitting, these features were screened before being included in the classification models. In the training set, 9,000–11,000 features were retained after the two-sample t-tests (p < 0.05) and 2,200–2,500 types of uncorrelated features were reserved after the autocorrelation tests. The remaining features were further filtered by three independent selection algorithms. More specifically, we retained the top 50 ranked features using the Fisher score test, 50–70 features using the Lasso method, and the top 50 ranked features after the mRMR test.
Generally, the retained features were consistent in repeated experiments. As shown in Table 2, there were 10 high-frequency features of each composite function disturbance; notably, they were all based on the sMRI modality. For the features selected from the disturbance containing the Fisher score test, the frequency was 420–500 times, mainly originating from the posterior cingulate (left, 3/10; right, 3/10). For the features selected from Lasso, the frequency was 383–468, and no specific regions were identified. Regarding the features selected from mRMR, the frequency was 320–495, also mainly from the posterior cingulate (left, 4/10; right, 2/10).
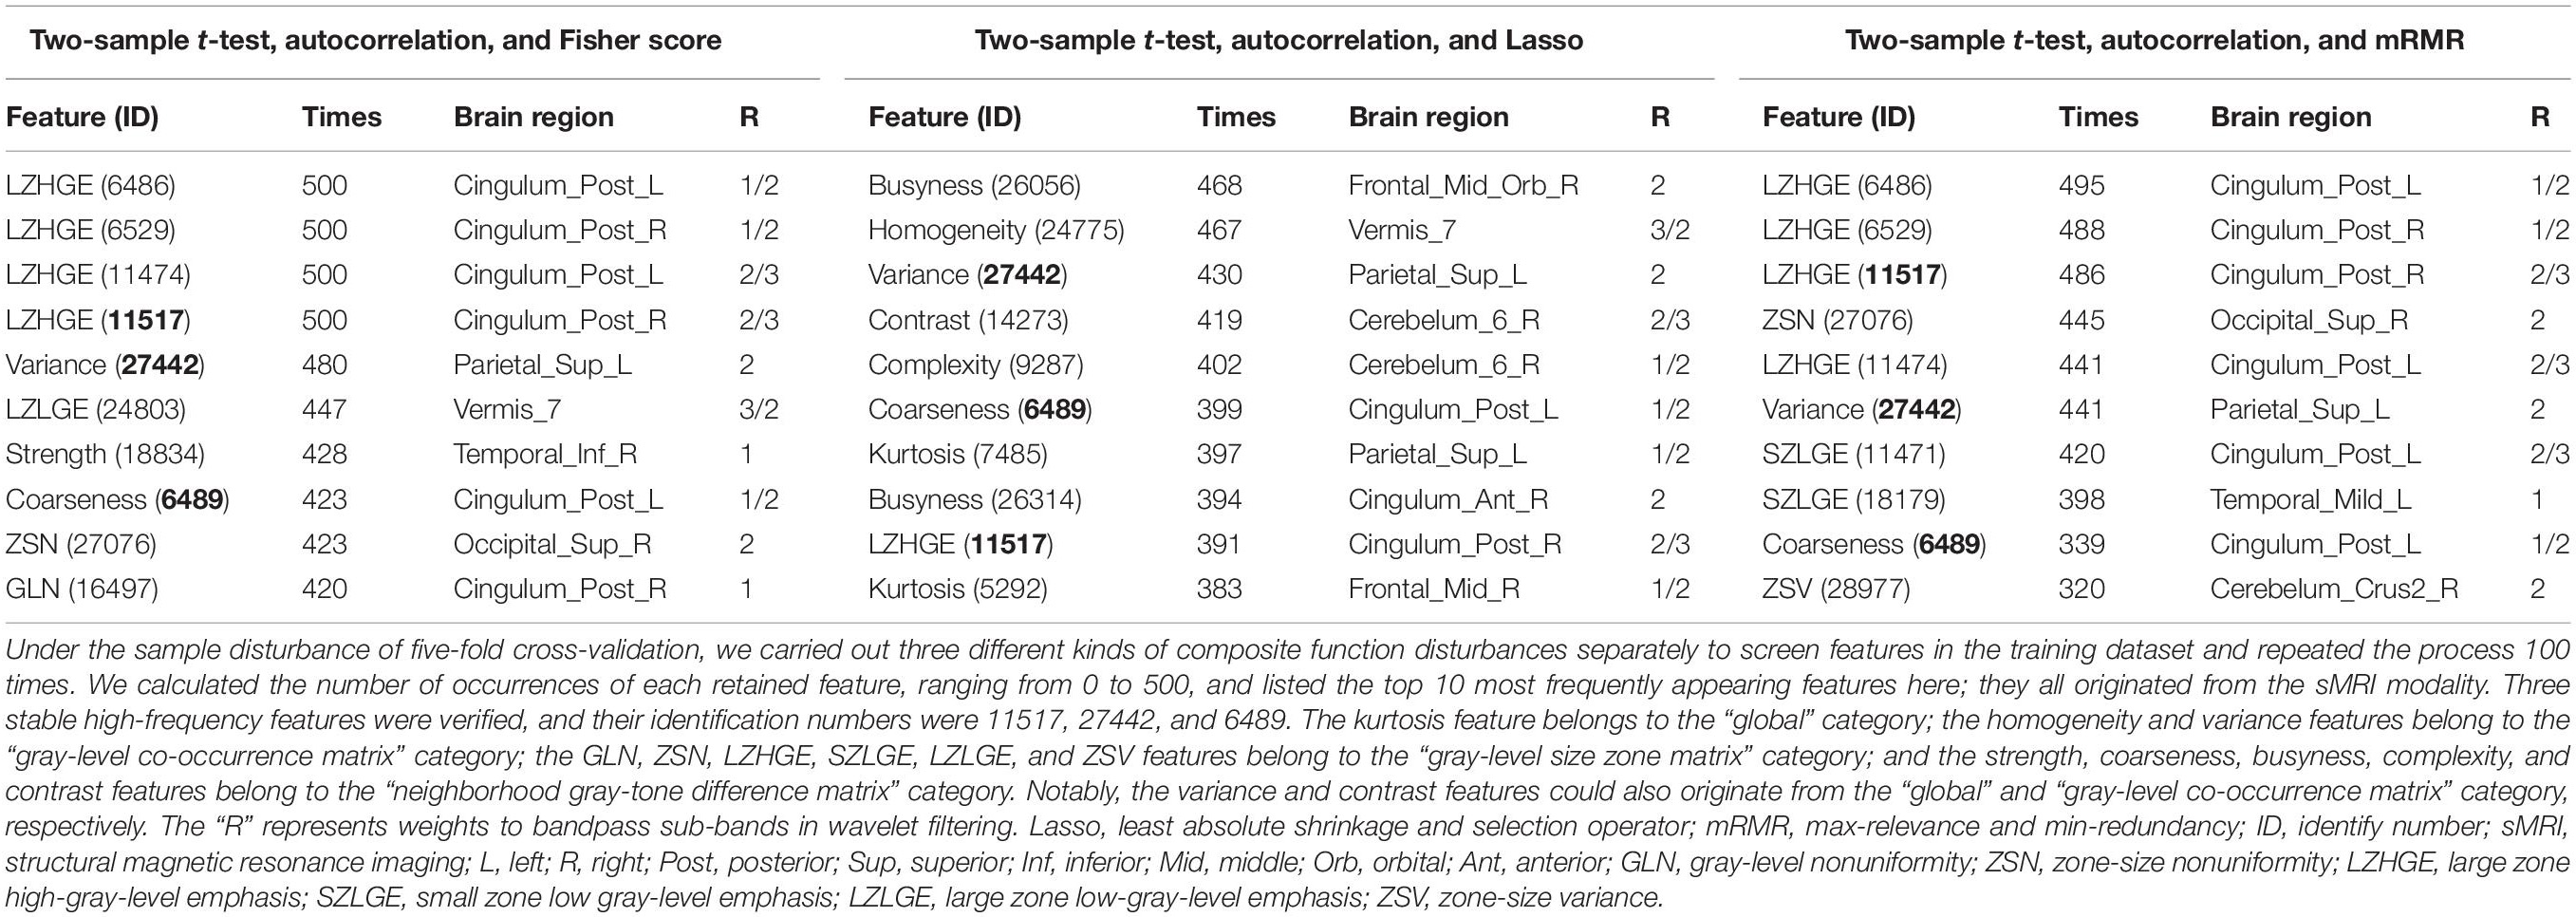
Table 2. The high-frequency features selected by cross-validation with different methods.
Three stable high-frequency features were identified during the process as follows: the large zone high-gray-level emphasis (LZHGE) feature of the right posterior cingulate gyrus on sMRI (ID: 11517; 459 times on average), the variance feature of the left superior parietal gyrus on sMRI (ID: 27442; 450 times on average), and the coarseness feature of the left posterior cingulate gyrus on sMRI (ID: 6489; 387 times on average). They were undisturbed by the combined disturbances and may be of great importance in the preclinical stage of AD. Additionally, among features and the number of occurrences greater than 300, another two were also identified as overlaps: the LZHGE feature of the left posterior cingulate gyrus on sMRI (ID: 6486; 458 times on average) and the zone-size variance feature of right cerebellum-crus2 on sMRI (ID: 28977; 319 times on average).
Other retained features that occurred more than 300 times and the meanings of stable high-frequency features are described in Supplementary Table 2 and Material.
Classification Performance
We introduced two types of models to determine whether the retained features were compatible for classification analysis. Table 3 presents the classifier performance results in terms of accuracy, sensitivity, and specificity. As shown, the SVM model (radial basis kernel) showed excellent classification efficiency, with an average accuracy of up to 90.2–95.9% (sensitivity, 85.9–92.8%; specificity, 93.7–98.3%) in the validation set and 84.5–88.9% (sensitivity, 79.8–82.9%; specificity, 86.0–96.7%) in the test set. Similar results were obtained in the RF model (Table 3) or the SVM models with the other two kernels (Supplementary Table 3). In contrast, the average accuracy of pure clinical data–based models in diagnosing preclinical AD reached only random-level accuracy at 55.9–56.0% (details are presented in the Supplementary Table 4 and Material).

Table 3. Classification performance of the SVM model (radial basis kernel) and RF model.
We further verified the classification efficiency of stable high-frequency features on the test set and found that their individual AUCs ranged from 0.649 to 0.761, and when we combined them, the predictive ability improved (AUCs = 0.839; Figures 2A–D). In addition, feature 6486 also had a good classification effect (AUCs = 0.739) and improved the AUCs to 0.863 when combined with the three stable features (Supplementary Figure 2). In contrast, the performance of feature 28977 was too poor to create an ROC curve. These results indicate that radiomics analysis is a reliable feature extraction method in the preclinical stage of AD and provides promising imaging biomarkers for identifying cognitively healthy individuals that go on to experience future cognitive decline.
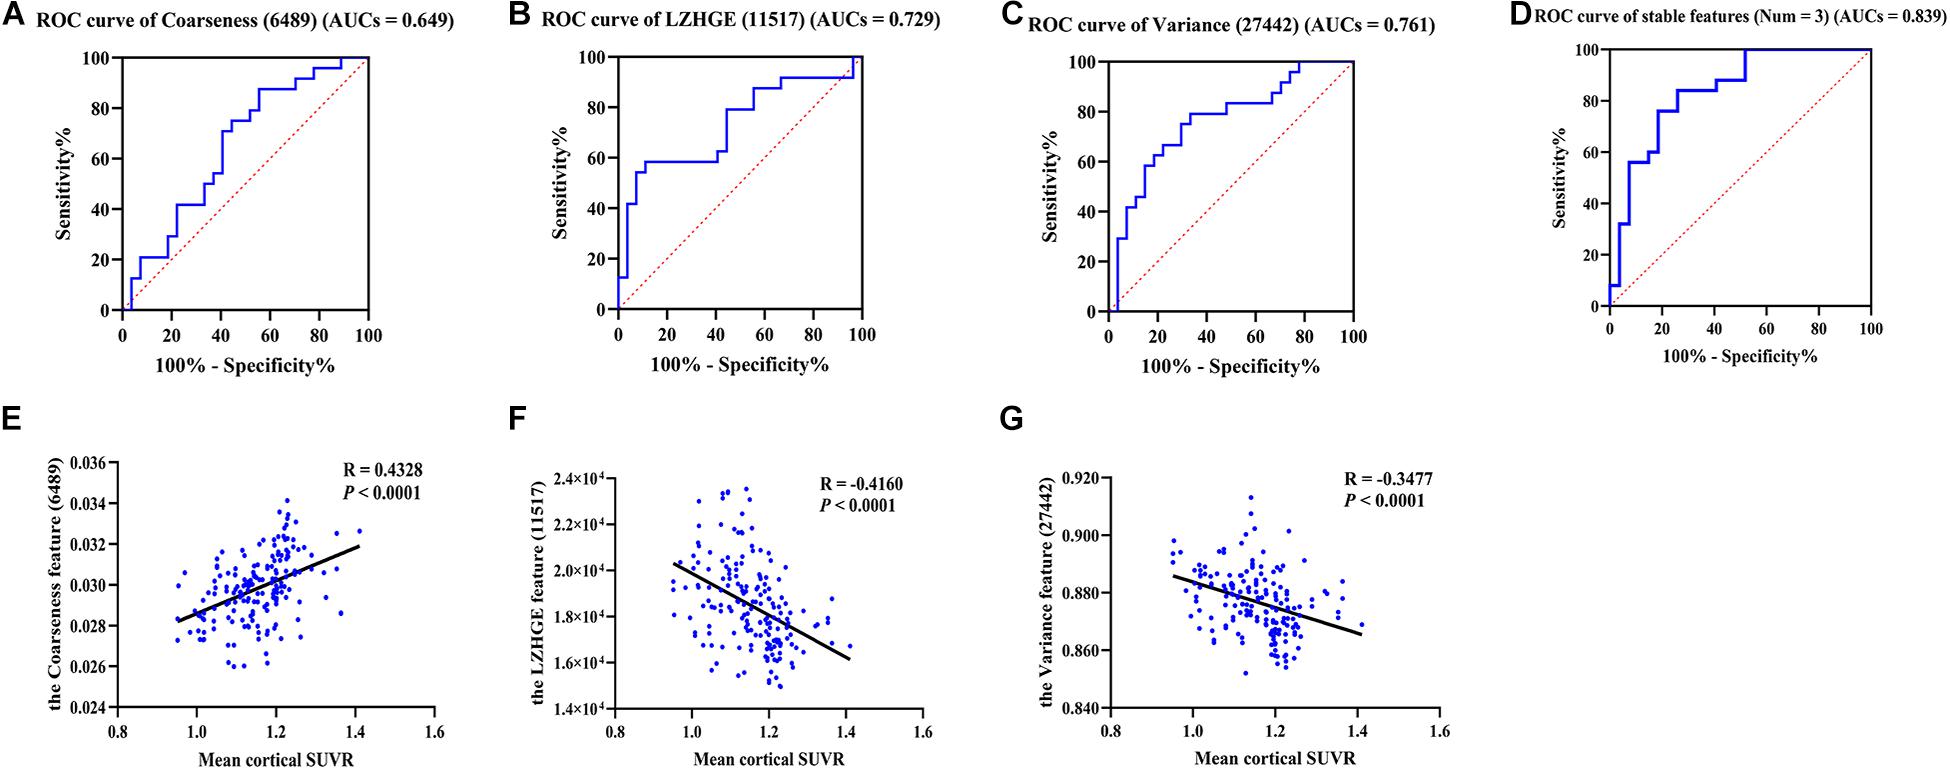
Figure 2. The ROC curves of stable high-frequency features and correlation analysis. (A–D) Show the ROC curves of stable high-frequency features in the test dataset; they all have high discriminating power. In detail, the 6489 feature AUCs = 0.649 (A), 11517 feature AUCs = 0.729 (B), and the 27442 feature AUCs = 0.761 (C). The value increased to 0.839 when combined (D). E–G show the correlations between the levels of these features and the mean cortical SUVR values in participants of cohort 1. The features were the coarseness feature of the left posterior cingulate gyrus on sMRI (ID: 6489; A,E), the LZHGE feature of the right posterior cingulate gyrus on sMRI (ID: 11517; B,F) and the variance feature of the left superior parietal gyrus on sMRI (ID: 27442; C,G). LZHGE, large zone high-gray-level emphasis; SUVR, standardized uptake value ratio; ROC, receiver operating characteristic; AUCs, areas under curve; sMRI, structural magnetic resonance imaging; Num, number.
Correlation Analysis
In order to further understand the association between radiomics features and pathological changes in AD, we performed a correlation analysis between stable high-frequency features and mean cortical SUVR values on amyloid PET and found that they were highly correlated. In detail, feature 6489 levels were positively correlated with SUVR values (r = 0.433, p < 0.0001, Figure 2E), whereas the feature 11517 and 27442 levels were both inversely correlated with SUVR values (r = -0.416, p < 0.0001, Figure 2F; r = -0.348, p < 0.0001, Figure 2G). Similar results were found for feature 6486 (r = -0.400, p < 0.0001, Supplementary Figure 2). The correlation results did not change after adjusting for age, gender, education, and MoCA score (Supplementary Figure 3). Our findings revealed high correlations between the levels of these features and Aβ deposition, suggesting that radiomics features based on MPMRI may reflect pathological changes in the brain and can be used for the diagnosis of AD.
Longitudinal Analyses
In this study, 37 participants from cohort 3 were followed up until cognitive impairment was identified. First, we detected the longitudinal changes of each stable high-frequency feature. As shown, features 6,489 and 11,517 did not show isotropic changes in the two cognitive stages at the individual level (Figures 3A,B); correspondingly, there were also no statistical differences between the two paired groups (Figures 3D,E). Similar results were obtained for feature 6486 (Supplementary Figures 4A,B). Although some individuals had a heterogeneous change pattern of feature 27442 (Figure 3C), its levels in the cognitive impairment stage were still lower than those in the cognitively healthy stage (p = 0.0403; Figure 3F). Second, we performed survival analyses of these features. In detail, the median baseline levels of features 6489, 11,517, and 27,442 were 0.0297356, 17228.308, and 0.865647, respectively; Figures 3G–I show the probability of cognitive impairment by levels of features > and ≤ these cutoffs. Notably, in the comparison between paired groups, only grouping by feature 27,442 was meaningful (log rank p = 0.015). The result of feature 6,486 was also unsatisfactory when grouped by the median level of 48.967 (log-rank p = 0.442; Supplementary Figure 4C). These results indicated that the levels of feature 27,442 decreased with cognitive decline, and the deterioration occurred earlier when the baseline level was less than 0.865647. However, considering the limited sample size, the value is for reference only, and it is more accurate to state that the baseline level can affect the conversion time.
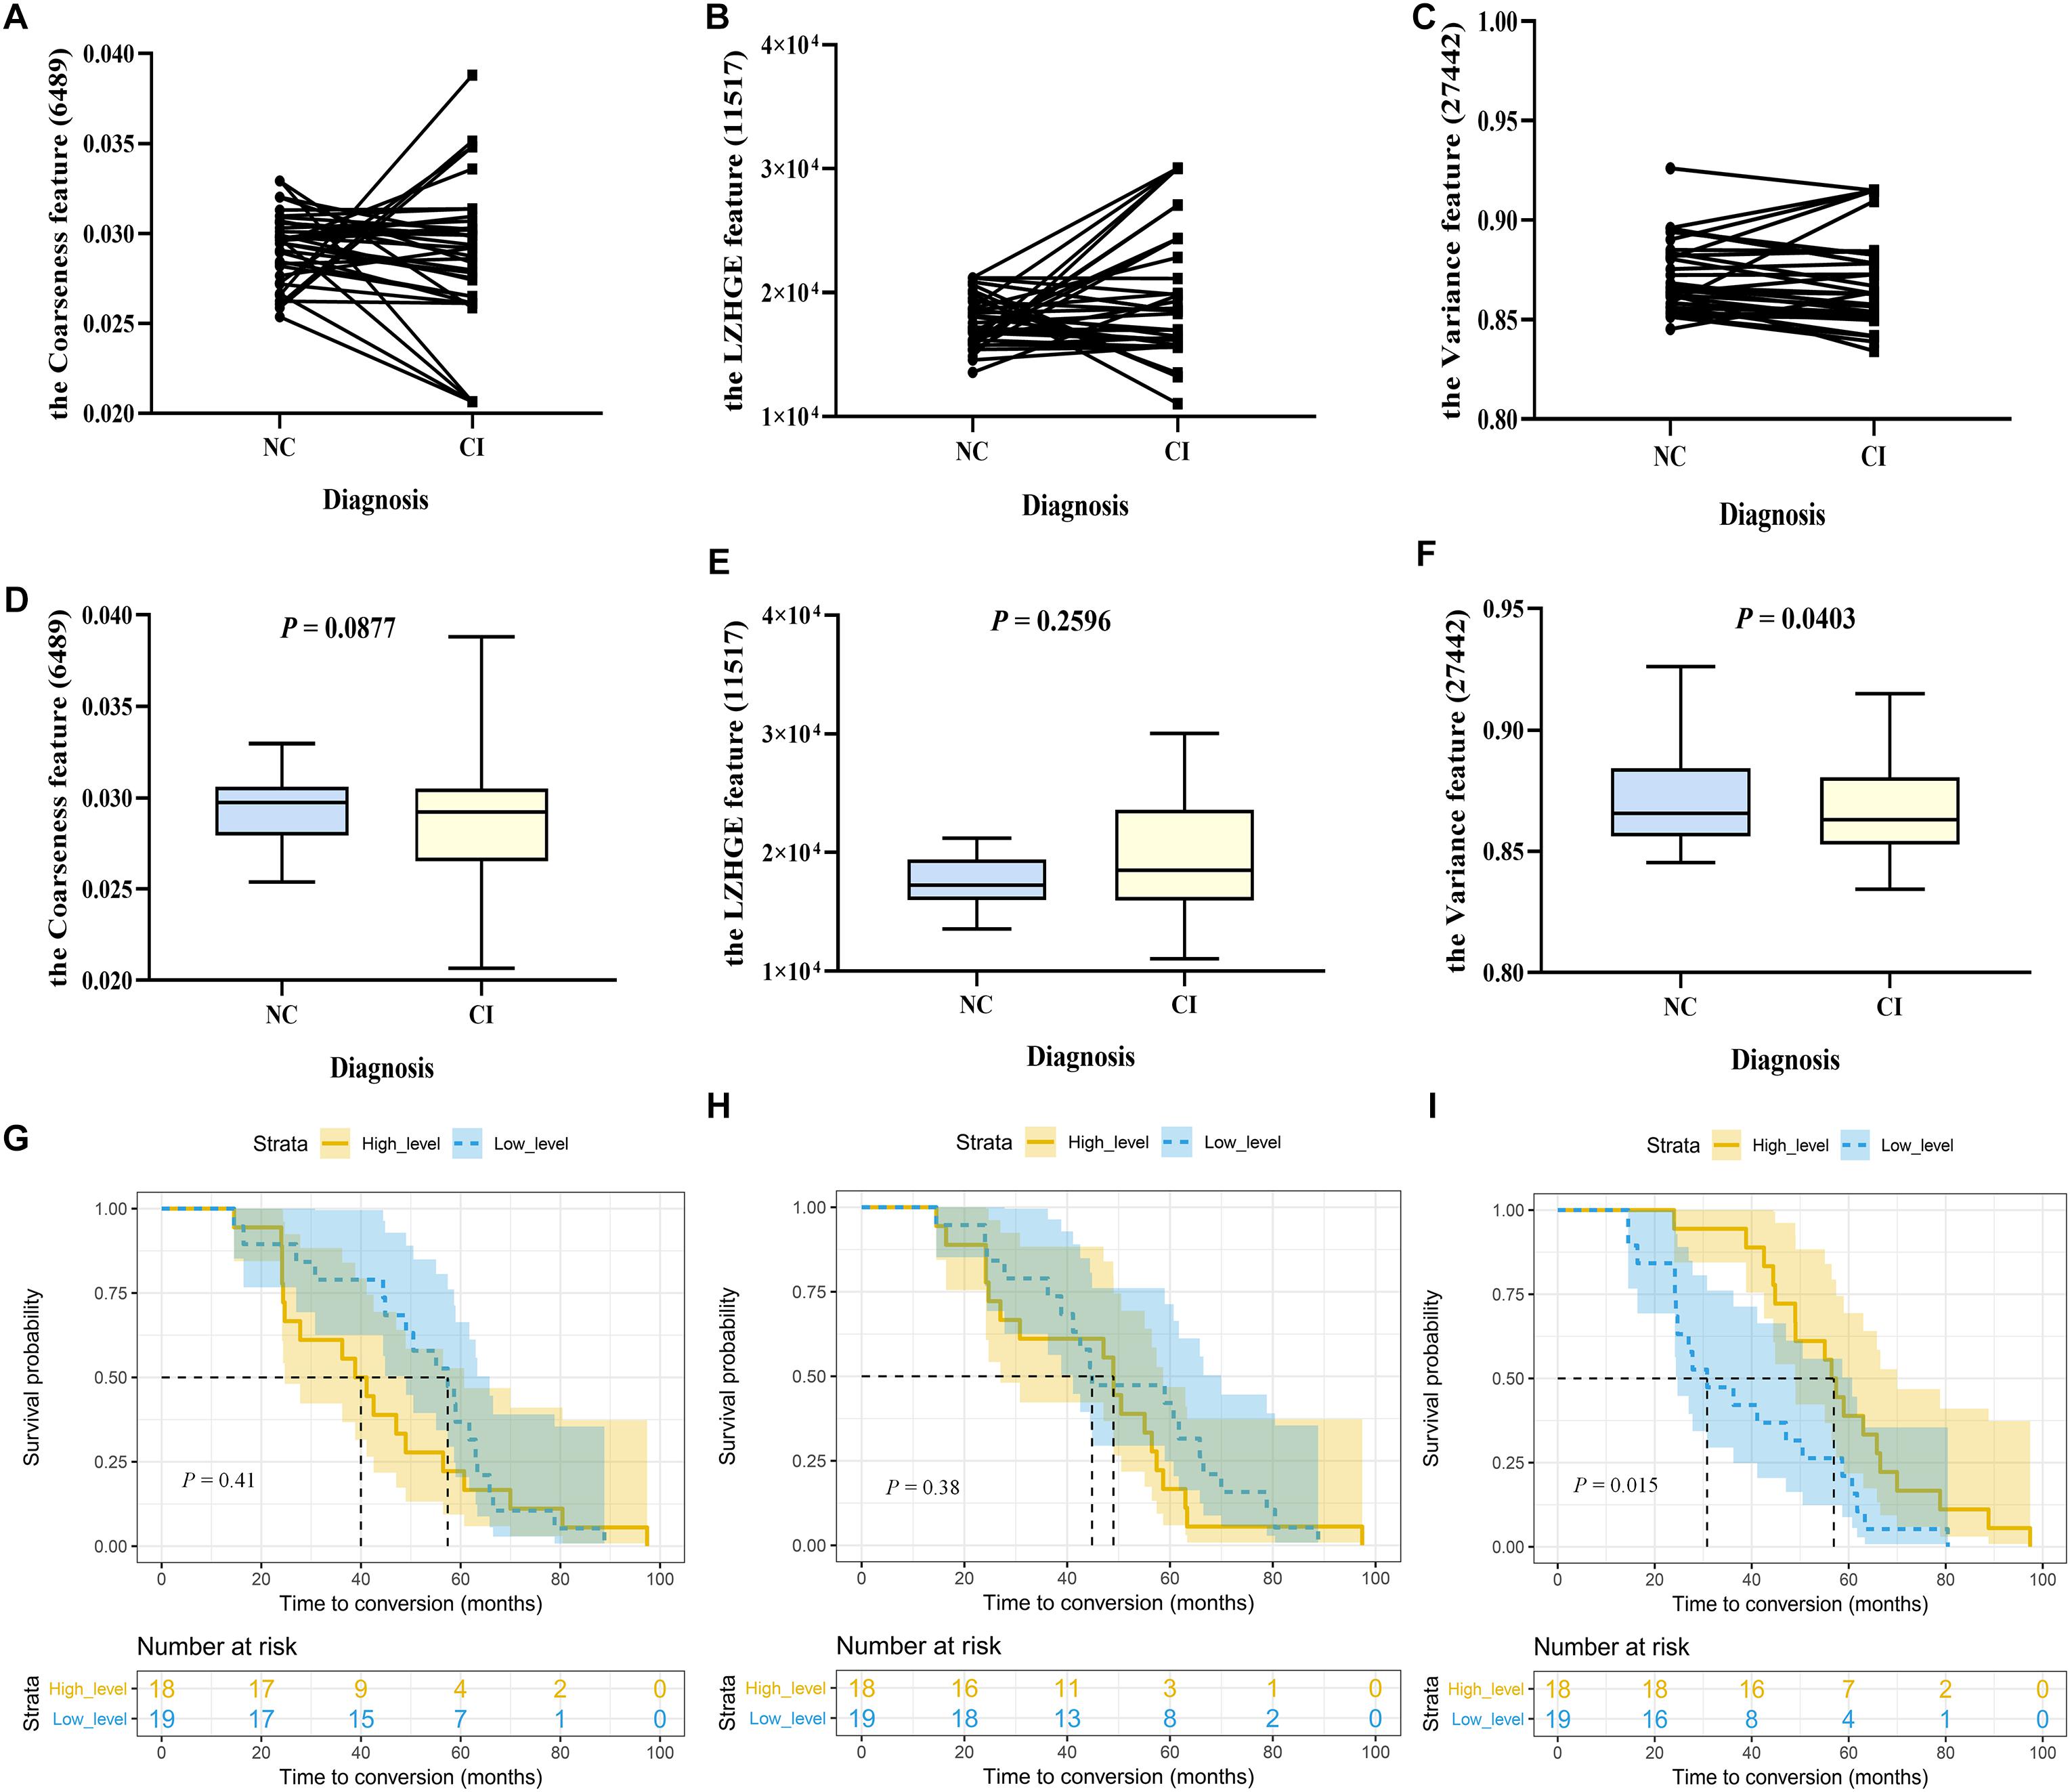
Figure 3. The longitudinal changes and survival analyses of stable high-frequency features. In Study 2, 37 participants were included. Their cognition was normal at baseline and impaired during follow-up, with two progressing to dementia and 35 to mild cognitive impairment. We compared the levels of each stable high-frequency feature between the two time points. (A–C) Show the changing trajectory at the individual level; (D–F) are at the group level, with paired two-sample t-tests (two-tailed, p < 0.05). Furthermore, these individuals were stratified into high-level (n = 18) and low-level group (n = 19) groups by the baseline median level of each stable high-frequency feature. (G–I) Show Kaplan–Meier curves demonstrating the cumulative probabilities of conversion of the two groups (shaded area represents the 95% confidence interval); differences are displayed by log-rank tests (p < 0.05). Only feature 27,442 was different at the two time points (p = 0.0403), and its low-level group had a shorter conversion time than the high-level group (p = 0.015). The features were the coarseness feature of the left posterior cingulate gyrus on sMRI (ID: 6489; A, D, G), the LZHGE feature of the right posterior cingulate gyrus on sMRI (ID: 11517; B, E, H), and the variance feature of the left superior parietal gyrus on sMRI (ID: 27442; C, F, I). NC, normal control; CI, cognitive impairment; sMRI, structural magnetic resonance imaging; LZHGE, large zone high-gray-level emphasis.
Discussion
Using cross-validations with widely used machine learning techniques, this study demonstrated that radiomics features appear to be robust imaging biomarkers of preclinical AD. The real pathophysiological process of AD is thought to begin several decades before symptom onset and is generally followed by a rigid progress pattern, such as Aβ accumulation-neurofibrillary tangles-neuronal damage; neurons are already damaged to some extent when cognitive impairment begins (Li T. R. et al., 2019; Long and Holtzman, 2019). Radiomics analysis can extract high-dimensional features of MPMRI and may identify imaging patterns in the preclinical stages that cannot be recognized by human readers; however, there is a paucity of published literature assessing the radiomics features of individuals in the preclinical stage of AD and those who go on to develop future cognitive decline. In this ongoing prospective cohort study, we adopted a novel composite method to select features from the training dataset, established classification models, and verified them in the validation and test sets. We found that both models could distinguish whether individuals were in the preclinical stage of AD or whether their cognition will decline in the future, with an accuracy of more than 80%. In addition, three stable high-frequency features were identified, which were independent of perturbations, correlated with Aβ deposition, and classified the test set accurately (AUCs 0.649–0.761). In the independent longitudinal analyses, we further verified that levels of the feature 27,442 (variance feature of the left superior parietal gyrus on sMRI) decreased with cognitive decline and affected individuals’ conversion time. Together, these data showed that radiomics features of MPMRI could be important imaging biomarkers for identifying patients with preclinical AD.
Our previous studies confirmed that cognitively normal individuals at high risk of developing AD already appeared to have altered brain functional networks (fMRI), white matter networks (DTI), or some refined areas (sMRI) (Li et al., 2016; Shu et al., 2018; Yan et al., 2018; Zhao et al., 2019), suggesting that there may be more unmined MPMRI data in the preclinical stage of AD. As expected, the pure clinical data–based classification models were meaningless at this stage, and the traditional volumetric and functional indices were also not sensitive enough (details are presented in the Supplementary Table 5 and Material). Although it is generally believed that radiomics analysis is more sensitive, current studies are still limited to the symptomatic stages of the disease (Alves et al., 2012; Chaddad and Niazi, 2018; Feng F. et al., 2018; Kun et al., 2020; Lee et al., 2020). Chaddad et al. found that the features derived from a single subcortical region produced AUCs up to 80% for identifying AD–dementia in healthy individuals and reached 91.5% when combined with all regions (Chaddad and Niazi, 2018). By using hippocampal features, researchers can distinguish AD–dementia with an accuracy of 86.7 and 70.5% of MCI (Feng F. et al., 2018). Identical conclusions were obtained in a recent large-scale multicenter study where the hippocampal features served as robust biomarkers for clinical identification of AD–dementia/MCI and further predicted whether MCI patients would convert to dementia (Kun et al., 2020). In contrast, the deep learning method can indeed acquire slightly better diagnostic capabilities in the Alzheimer’s continuum (Jo et al., 2019; Yamanakkanavar et al., 2020); however, it is difficult to explain the clinical correlations between these deep features and AD itself, and notably, Li et al. (2017) have proved that the performance in identifying dementia from controls using radiomics is comparable to deep learning (91.4 and 93.9%, respectively). Here, in distinguishing preclinical AD patients or clinical converters, the accuracy of our models reached 81.9–95.9%, even higher than when distinguishing symptomatic patients from controls. We believe that several reasons may account for this. First, compared with extracting features solely on sMRI, we utilized MPMRI. Second, instead of selecting regions based on prior knowledge, we adopted template segmentation and extracted features. Third, among the 30,128 features, we used an innovative selection method to improve robustness. Four, we diagnosed individuals based on Aβ profile and not purely on clinical data, significantly reducing the heterogeneity of participants. Moreover, the use of different types of models further verified the reliability of our findings.
The Aβ deposition associated with neuronal degeneration may have resulted in subtle alterations in MRI signal intensity; therefore, we speculate that radiomics features could reflect changes at the microscopic level during the early pathological stages, which occur before changes at the macroscopic level. In addition to the computer-aided classification, three stable high-frequency features that were not affected by function perturbations (three different algorithms) and sample perturbations (five-fold cross validation and 100 repetitions) were identified during the selection process: the LZHGE feature of the right posterior cingulate gyrus, the variance feature of the left superior parietal gyrus, and the coarseness feature of the left posterior cingulate gyrus (all on the sMRI modality). Importantly, the earliest accumulation of Aβ deposition is also in the superior parietal gyrus and posterior cingulate (Long and Holtzman, 2019). More specifically, in symptomatic AD patients, previous autopsy findings and amyloid-PET studies have suggested that the parietal lobe and posterior cingulum are vulnerable to Aβ invasion during the early stages of AD (Thal et al., 2002; Cho et al., 2018). In cognitively normal individuals, the annual increase in Aβ also localizes to these two regions (Sojkova et al., 2011). From other perspectives, Aβ deposition is associated particularly with cortical atrophy of the superior parietal gyrus (Becker et al., 2011; Weston et al., 2016) and the rate-limiting enzyme of Aβ production is also significantly elevated in this area (Coulson et al., 2010). These developments prove the accuracy of the identified anatomical locations and support our findings that these features were correlated with SUVR values and played a good role in predicting future cognitive decline (AUCs 0.649, 0.729, and 0.761, respectively; 0.839 when combined) and thus probably represent the imaging biomarkers of preclinical AD. Interestingly, we found that retained features only came from the sMRI modality, which is probably in part due to the relatively small number of fMRI and DTI features utilized in our study. Additionally, a recent study concluded that DTI parameters are not useful for the identification of preclinical AD (Teipel et al., 2019). To the best of our knowledge, this is the first time that texture analysis of fMRI has been applied to the field of AD (Hassan et al., 2016). Uncertainty still exists, and the significance of DTI and fMRI radiomics features cannot be completely ruled out in this exploratory study.
In the longitudinal analyses, we found that the variance feature of the left superior parietal gyrus on sMRI decreased with cognitive impairment, suggesting that it may be of great importance in the whole cognitive continuum and not just in the preclinical stage. This feature is extracted from the gray-level co-occurrence matrix category and is an indicator of dispersion of the unit values around the mean. With cognitive decline, the cortical accumulation of Aβ will increase continuously to a certain extent (Long and Holtzman, 2019) and may result in alterations in signal intensity, with subtle changes captured by the radiomics analysis of sMRI. Next, we conducted survival analyses to compare the conversion time between groups within cohort 3. The median value was chosen subjectively for grouping; coincidently, we found that the variance feature can affect the conversion time, further suggesting its predictive effects on clinical outcome.
Our study had some limitations. First, the small sample number limited the statistical power of our data. We tried to overcome this issue by enrolling participants from other subcenters and the ADNI, but the requirement of amyloid PET, long-term follow-up, or MPMRI data greatly limited the quantity of potential participants. Moreover, the performance of our models may differ when using different imaging protocols. Second, considering there is no standard definition of “unstable preclinical AD”, we referred to the 36 months of “unstable MCI” and required the nonconverters to remain cognitively stable for at least three follow-up visits. The average conversion time of converters was 41.2 months, which needs to be verified. Third, other anatomical regions, such as the anterior cingulate, are also susceptible to Aβ attack (Thal et al., 2002; Cho et al., 2018). However, we did not find any stable features in these regions; some high-frequency features came from regions that are not or are weakly related to AD, such as the cerebellum, and it is difficult to associate these regions with clinical significance. Fourth, in cohort 3, most of the patients were limited to the MCI stage and few to the dementia stage at the follow-up time point; thus, it is not clear whether features were related to the degree of cognitive deterioration. Fifth, the positive result of Study two was not significant (p = 0.0403), and the feature levels of some individuals increased disparately, which was probably due to the heterogeneity of MCI and the relatively older age of the ADNI participants. Sixth, age may cause differences in our results because of its impact on Aβ and atrophy. Seventh, the positive rate of amyloid PET (42.6%) was higher than that reported in previous studies (10–30% mostly) (Chételat et al., 2013), partly because of the exclusion of some negative individuals (Supplementary Figure 1A) and the existence of individuals with subjective cognitive decline, itself a high-risk state for developing AD (Jessen et al., 2020). This bias may increase uncertainty. Eighth, different guidelines have inconsistent definitions of preclinical AD (Dubois et al., 2007, 2010, 2014; Sperling et al., 2011a; Jack et al., 2018). The latest NIA-AA 2018 definition requires additional evidence of tau deposition in patients with preclinical AD (Jack et al., 2018), but the tau status of participants was not clear in our study. Considering these limitations, multicenter collaboration to include more participants is needed in the future.
In conclusion, radiomics analysis of MPMRI is expected to become a new evaluation method for Aβ deposition and future cognitive decline in cognitively healthy individuals, which would be of great importance in diagnosing preclinical AD and targeting ultra-early secondary prevention clinical trials. Additionally, we have proposed a novel feature extraction paradigm and preservation method for feature subsets, solving the problem of instability and nonrepeatability for future studies.
Data Availability Statement
The datasets used and/or analysed during the current study are available from the corresponding authors on reasonable request.
Ethics Statement
The study was approved by the Medical Ethics Committee of Xuanwu Hospital of Capital Medical University and was carried out in accordance with the Declaration of Helsinki. We confirm that we have read the Journal’s position on issues involved in ethical publication and affirm that this report is consistent with those guidelines. All subjects gave written informed consents and written consent to permit publication of clinical details.
Author Contributions
YH and T-RL provided the data. J-HJ designed the study. T-RL and YW assembled and analyzed the data, consulted literatures, and drafted the manuscript. J-JJ drawn the Figure 1. HL and C-LH polished the manuscript. YH and J-HJ critically revised the manuscript for important intellectual content. All authors read and approved the final manuscript.
Funding
This work was supported by grants from the National Key Research and Development Program of China (2016YFC1306300 and 2018YFC1312001), the National Natural Science Foundation of China (61633018 and 82020108013), and the 111 Project (D20031).
Conflict of Interest
The authors declare that the research was conducted in the absence of any commercial or financial relationships that could be construed as a potential conflict of interest.
Acknowledgments
Data collection and sharing for this study was funded by the Sino Longitudinal Study on Cognitive Decline (SILCODE) project in China and the Alzheimer’s Disease Neuroimaging Initiative (ADNI; National Institutes of Health Grant U19 AG024904), the authors wish to thank all the individuals who participated in the study and every staff member behind both projects. This manuscript has been released as a pre-print at Research Square (doi: https://doi.org/10.21203/rs.3.rs-49621/v1) (Li et al., 2020).
Supplementary Material
The Supplementary Material for this article can be found online at: https://www.frontiersin.org/articles/10.3389/fcell.2020.605734/full#supplementary-material
Footnotes
- ^ www.loni.ucla.edu/ADNI
- ^ https://ida.loni.usc.edu/login.jsp
- ^ https://people.cas.sc.edu/rorden/mricron/dcm2nii.html
- ^ http://www.rfmri.org/DPARSF
- ^ https://www.fil.ion.ucl.ac.uk/spm/software/spm12
- ^ https://github.com/mvallieres/radiomics
References
Alves, G. S., O’Dwyer, L., Jurcoane, A., Oertel-Knöchel, V., Knöchel, C., Prvulovic, D., et al. (2012). Different patterns of white matter degeneration using multiple diffusion indices and volumetric data in mild cognitive impairment and Alzheimer patients. PLoS One 7:e52859. doi: 10.1371/journal.pone.0052859
Balthazar, M. L., Yasuda, C. L., Pereira, F. R., Pedro, T., Damasceno, B. P., and Cendes, F. (2009). Differences in grey and white matter atrophy in amnestic mild cognitive impairment and mild Alzheimer’s disease. Eur. J. Neurol. 16, 468–474. doi: 10.1111/j.1468-1331.2008.02408.x
Baron, J. C., Chételat, G., Desgranges, B., Perchey, G., Landeau, B., de la Sayette, V., et al. (2001). In vivo mapping of gray matter loss with voxel-based morphometry in mild Alzheimer’s disease. Neuroimage 14, 298–309. doi: 10.1006/nimg.2001.0848
Basser, P. J., Mattiello, J., and LeBihan, D. (1994). MR diffusion tensor spectroscopy and imaging. Biophys. J. 66, 259–267. doi: 10.1016/S0006-3495(94)80775-1
Becker, J. A., Hedden, T., Carmasin, J., Maye, J., Rentz, D. M., Putcha, D., et al. (2011). Amyloid-β associated cortical thinning in clinically normal elderly. Ann. Neurol. 69, 1032–1042. doi: 10.1002/ana.22333
Bondi, M. W., Edmonds, E. C., Jak, A. J., Clark, L. R., Delano-Wood, L., McDonald, C. R., et al. (2014). Neuropsychological criteria for mild cognitive impairment improves diagnostic precision, biomarker associations, and progression rates. J. Alzheimers Dis. 42, 275–289. doi: 10.3233/JAD-140276
Chaddad, A., Desrosiers, C., and Niazi, T. (2018). Deep radiomic analysis of MRI related to Alzheimer’s Disease. IEEE Access 6, 58213–58221.
Chaddad, A., and Niazi, T. (2018). “Radiomics analysis of subcortical brain regions related to Alzheimer disease,” in Preceding of the 2018 IEEE Life Sciences Conference (LSC), Montreal, QC.
Chao-Gan, Y., and Yu-Feng, Z. (2010). DPARSF: a MATLAB toolbox for “Pipeline” data analysis of resting-state fMRI. Front. Syst. Neurosci. 4:13. doi: 10.3389/fnsys.2010.00013
Chen, G., Yang, K., Du, W., Hu, X., and Han, Y. (2019). Clinical characteristics in subjective cognitive decline with and without worry: baseline investigation of the SILCODE study. J. Alzheimers Dis. 72, 443–454. doi: 10.3233/JAD-190501
Chételat, G., La Joie, R., Villain, N., Perrotin, A., de La Sayette, V., Eustache, F., et al. (2013). Amyloid imaging in cognitively normal individuals, at-risk populations and preclinical Alzheimer’s disease. Neuroimage Clin. 2, 356–365. doi: 10.1016/j.nicl.2013.02.006
Cho, H., Lee, H. S., Choi, J. Y., Lee, J. H., Ryu, Y. H., Lee, M. S., et al. (2018). Predicted sequence of cortical tau and amyloid-β deposition in Alzheimer disease spectrum. Neurobiol. Aging 68, 76–84. doi: 10.1016/j.neurobiolaging.2018.04.007
Coulson, D. T., Beyer, N., Quinn, J. G., Brockbank, S., Hellemans, J., Irvine, G. B., et al. (2010). BACE1 mRNA expression in Alzheimer’s disease postmortem brain tissue. J. Alzheimers Dis. 22, 1111–1122. doi: 10.3233/JAD-2010-101254
Cui, Z., Zhong, S., Xu, P., He, Y., and Gong, G. (2013). PANDA: a pipeline toolbox for analyzing brain diffusion images. Front. Hum. Neurosci. 7:42. doi: 10.3389/fnhum.2013.00042
de Oliveira, M. S., Balthazar, M. L., D’Abreu, A., Yasuda, C. L., Damasceno, B. P., Cendes, F., et al. (2011). MR imaging texture analysis of the corpus callosum and thalamus in amnestic mild cognitive impairment and mild Alzheimer disease. AJNR Am J Neuroradiol. 32, 60–66. doi: 10.3174/ajnr.A2232
Dubois, B., Feldman, H. H., Jacova, C., Cummings, J. L., Dekosky, S. T., Barberger-Gateau, P., et al. (2010). Revising the definition of Alzheimer’s disease: a new lexicon. Lancet Neurol. 9, 1118–1127. doi: 10.1016/S1474-4422(10)70223-4
Dubois, B., Feldman, H. H., Jacova, C., Dekosky, S. T., Barberger-Gateau, P., Cummings, J., et al. (2007). Research criteria for the diagnosis of Alzheimer’s disease: revising the NINCDS-ADRDA criteria. Lancet Neurol. 6, 734–746. doi: 10.1016/S1474-4422(07)70178-3
Dubois, B., Feldman, H. H., Jacova, C., Hampel, H., Molinuevo, J. L., Blennow, K., et al. (2014). Advancing research diagnostic criteria for Alzheimer’s disease: the IWG-2 criteria. Lancet Neurol. 13, 614–629. doi: 10.1016/S1474-4422(14)70090-0
Fakhry-Darian, D., Patel, N. H., Khan, S., Barwick, T., Svensson, W., Khan, S., et al. (2019). Optimisation and usefulness of quantitative analysis of 18F-florbetapir PET. Br. J. Radiol. 92:20181020. doi: 10.1259/bjr.20181020
Feng, F., Wang, P., Zhao, K., Zhou, B., Yao, H., Meng, Q., et al. (2018). Radiomic features of hippocampal subregions in Alzheimer’s Disease and amnestic mild cognitive impairment. Front. Aging Neurosci. 10:290. doi: 10.3389/fnagi.2018.00290
Feng, Q., Chen, Y., Liao, Z., Jiang, H., Mao, D., Wang, M., et al. (2018). Corpus callosum radiomics-based classification model in Alzheimer’s Disease: a case-control study. Front. Neurol. 9:618. doi: 10.3389/fneur.2018.00618
Golde, T. E., DeKosky, S. T., and Galasko, D. (2018). Alzheimer’s disease: the right drug, the right time. Science 362, 1250–1251. doi: 10.1126/science.aau0437
Guo, Y., Zhang, Z., Zhou, B., Wang, P., Yao, H., Yuan, M., et al. (2014). Grey-matter volume as a potential feature for the classification of Alzheimer’s disease and mild cognitive impairment: an exploratory study. Neurosci. Bull. 30, 477–489. doi: 10.1007/s12264-013-1432-x
Gyebnár, G., Szabó, Á, Sirály, E., Fodor, Z., Sákovics, A., Salacz, P., et al. (2018). What can DTI tell about early cognitive impairment? - Differentiation between MCI subtypes and healthy controls by diffusion tensor imaging. Psychiatry Res. Neuroimaging 272, 46–57. doi: 10.1016/j.pscychresns.2017.10.007
Hassan, I., Kotrotsou, A., Bakhtiari, A. S., Thomas, G. A., Weinberg, J. S., Kumar, A. J., et al. (2016). Radiomic texture analysis mapping predicts areas of true functional MRI activity. Sci. Rep. 6:25295. doi: 10.1038/srep25295
Insel, P. S., Hansson, O., Mackin, R. S., Weiner, M., Mattsson, N., Alzheimer’s Disease, et al. (2018). Amyloid pathology in the progression to mild cognitive impairment. Neurobiol. Aging 64, 76–84. doi: 10.1016/j.neurobiolaging.2017.12.018
Jack, C. R. Jr., Bennett, D. A., Blennow, K., Carrillo, M. C., Dunn, B., Haeberlein, S. B., et al. (2018). NIA-AA research framework: toward a biological definition of Alzheimer’s disease. Alzheimers Dement. 14, 535–562. doi: 10.1016/j.jalz.2018.02.018
Jessen, F., Amariglio, R. E., Buckley, R. F., van der Flier, W. M., Han, Y., Molinuevo, J. L., et al. (2020). The characterisation of subjective cognitive decline. Lancet Neurol. 19, 271–278. doi: 10.1016/S1474-4422(19)30368-0
Jia, L., Quan, M., Fu, Y., Zhao, T., Li, Y., Wei, C., et al. (2020). Dementia in China: epidemiology, clinical management, and research advances. Lancet Neurol. 19, 81–92. doi: 10.1016/S1474-4422(19)30290-X
Jo, T., Nho, K., and Saykin, A. J. (2019). Deep learning in Alzheimer’s Disease: diagnostic classification and prognostic prediction using neuroimaging data. Front. Aging Neurosci. 11:220. doi: 10.3389/fnagi.2019.00220
Kun, Z., Yanhui, D., Ying, H., Yong, F., Aaron, F., Tong, H., et al. (2020). Independent and reproducible hippocampal radiomic biomarkers for multisite Alzheimer’s disease: diagnosis, longitudinal progress and biological basis. ence Bull. 65, 1103–1113.
Lee, S., Lee, H., Kim, K. W., and Alzheimer’s Disease Neuroimaging Initiative (2020). Magnetic resonance imaging texture predicts progression to dementia due to Alzheimer disease earlier than hippocampal volume. J. Psychiatry Neurosci. 45, 7–14. doi: 10.1503/jpn.180171
Li, H., Habes, M., and Yong, F. (2017). Deep ordinal ranking for multi-category diagnosis of alzheimer’s disease using hippocampal MRI data. arXiv [Preprint]. Available online at: https://arxiv.org/abs/1709.01599
Li, S., Yuan, X., Pu, F., Li, D., Fan, Y., Wu, L., et al. (2014). Abnormal changes of multidimensional surface features using multivariate pattern classification in amnestic mild cognitive impairment patients. J. Neurosci. 34, 10541–10553. doi: 10.1523/JNEUROSCI.4356-13.2014
Li, T. R., Wang, X. N., Sheng, C., Li, Y. X., Li, F. Z., Sun, Y., et al. (2019). Extracellular vesicles as an emerging tool for the early detection of Alzheimer’s disease. Mech. Ageing Dev. 184:111175. doi: 10.1016/j.mad.2019.111175
Li, Y., Jiang, J., Lu, J., Jiang, J., Zhang, H., and Zuo, C. (2019). Radiomics: a novel feature extraction method for brain neuron degeneration disease using 18F-FDG PET imaging and its implementation for Alzheimer’s disease and mild cognitive impairment. Ther. Adv. Neurol. Disord. 12:1756286419838682. doi: 10.1177/1756286419838682
Li, X., Wang, X., Su, L., Hu, X., and Han, Y. (2019). Sino longitudinal study on cognitive decline (SILCODE): protocol for a Chinese longitudinal observational study to develop risk prediction models of conversion to mild cognitive impairment in individuals with subjective cognitive decline. BMJ Open 9:e028188. doi: 10.1136/bmjopen-2018-028188
Li, T. R., Wu, Y., Jiang, J. J., Jiang, J. H., and Han, Y. (2020). Radiomics analysis of magnetic resonance imaging helps to identify preclinical Alzheimer’s disease: an exploratory study. Res. Square 12:1756286419838682. doi: 10.21203/rs.3.rs-49621/v1
Li, X. Y., Tang, Z. C., Sun, Y., Tian, J., Liu, Z. Y., and Han, Y. (2016). White matter degeneration in subjective cognitive decline: a diffusion tensor imaging study. Oncotarget 7, 54405–54414. doi: 10.18632/oncotarget.10091
Long, J. M., and Holtzman, D. M. (2019). Alzheimer Disease: an update on pathobiology and treatment strategies. Cell 179, 312–339. doi: 10.1016/j.cell.2019.09.001
Luk, C. C., Ishaque, A., Khan, M., Ta, D., Chenji, S., Yang, Y. H., et al. (2018). Alzheimer’s disease: 3-Dimensional MRI texture for prediction of conversion from mild cognitive impairment. Alzheimers Dement. 10, 755–763. doi: 10.1016/j.dadm.2018.09.002
McKhann, G. M., Knopman, D. S., Chertkow, H., Hyman, B. T., Jack, C. R. Jr., Kawas, C. H., et al. (2011). The diagnosis of dementia due to Alzheimer’s disease: recommendations from the national institute on Aging-Alzheimer’s association workgroups on diagnostic guidelines for Alzheimer’s disease. Alzheimers Dement. 7, 263–269. doi: 10.1016/j.jalz.2011.03.005
Papp, K. V., Rentz, D. M., Mormino, E. C., Schultz, A. P., Amariglio, R. E., Quiroz, Y., et al. (2017). Cued memory decline in biomarker-defined preclinical Alzheimer disease. Neurology 88, 1431–1438. doi: 10.1212/WNL.0000000000003812
Pedro, T., Weiler, M., Yasuda, C. L., D’Abreu, A., Damasceno, B. P., Cendes, F., et al. (2012). Volumetric brain changes in thalamus, corpus callosum and medial temporal structures: mild Alzheimer’s disease compared with amnestic mild cognitive impairment. Dement. Geriatr. Cogn. Disord. 34, 149–155. doi: 10.1159/000342118
Petersen, R. C. (2004). Mild cognitive impairment as a diagnostic entity. J. Intern. Med. 256, 183–194. doi: 10.1111/j.1365-2796.2004.01388.x
Promteangtrong, C., Kolber, M., Ramchandra, P., Moghbel, M., Houshmand, S., Schöll, M., et al. (2015). Multimodality imaging approach in Alzheimer disease. Part I: structural MRI, functional MRI, diffusion tensor imaging and magnetization transfer imaging. Dement. Neuropsychol. 9, 318–329. doi: 10.1590/1980-57642015DN94000318
Rathore, S., Habes, M., Iftikhar, M. A., Shacklett, A., and Davatzikos, C. (2017). A review on neuroimaging-based classification studies and associated feature extraction methods for Alzheimer’s disease and its prodromal stages. Neuroimage 155, 530–548. doi: 10.1016/j.neuroimage.2017.03.057
Shu, N., Wang, X., Bi, Q., Zhao, T., and Han, Y. (2018). Disrupted topologic efficiency of white matter structural connectome in individuals with subjective cognitive decline. Radiology 286, 229–238. doi: 10.1148/radiol.2017162696
Smith, S. M. (2002). Fast robust automated brain extraction. Hum. Brain Mapp. 17, 143–155. doi: 10.1002/hbm.10062
Smith, S. M., Jenkinson, M., Woolrich, M. W., Beckmann, C. F., Behrens, T. E., Johansen-Berg, H., et al. (2004). Advances in functional and structural MR image analysis and implementation as FSL. Neuroimage 23(Suppl. 1), S208–S219. doi: 10.1016/j.neuroimage.2004.07.051
Sojkova, J., Zhou, Y., An, Y., Kraut, M. A., Ferrucci, L., Wong, D. F., et al. (2011). Longitudinal patterns of β-amyloid deposition in nondemented older adults. Arch. Neurol. 68, 644–649. doi: 10.1001/archneurol.2011.77
Sørensen, L., Igel, C., Liv Hansen, N., Osler, M., Lauritzen, M., Rostrup, E., et al. (2016). Early detection of Alzheimer’s disease using MRI hippocampal texture. Hum. Brain Mapp. 37, 1148–1161. doi: 10.1002/hbm.23091
Sperling, R. A., Aisen, P. S., Beckett, L. A., Bennett, D. A., Craft, S., Fagan, A. M., et al. (2011a). Toward defining the preclinical stages of Alzheimer’s disease: recommendations from the National Institute on Aging-Alzheimer’s association workgroups on diagnostic guidelines for Alzheimer’s disease. Alzheimers Dement. 7, 280–292. doi: 10.1016/j.jalz.2011.03.003
Sperling, R. A., Jack, C. R. Jr., and Aisen, P. S. (2011b). Testing the right target and right drug at the right stage. Sci. Transl. Med. 3:111cm33. doi: 10.1126/scitranslmed.3002609
Tang, Z., Liu, Z., Li, R., Yang, X., Cui, X., Wang, S., et al. (2017). Identifying the white matter impairments among ART-naïve HIV patients: a multivariate pattern analysis of DTI data. Eur. Radiol. 27, 4153–4162. doi: 10.1007/s00330-017-4820-1
Teipel, S. J., Kuper-Smith, J. O., Bartels, C., Brosseron, F., Buchmann, M., Buerger, K., et al. (2019). Multicenter tract-based analysis of microstructural lesions within the Alzheimer’s Disease spectrum: association with amyloid pathology and diagnostic usefulness. J. Alzheimers Dis. 72, 455–465. doi: 10.3233/JAD-190446
Thal, D. R., Rüb, U., Orantes, M., and Braak, H. (2002). Phases of A beta-deposition in the human brain and its relevance for the development of AD. Neurology 58, 1791–1800. doi: 10.1212/wnl.58.12.1791
Thomann, P. A., Wustenberg, T., Pantel, J., Essig, M., and Schroder, J. (2006). Structural changes of the corpus callosum in mild cognitive impairment and Alzheimer’s disease. Dement. Geriatr. Cogn. Disord. 21, 215–220. doi: 10.1159/000090971
Tian, Y., Liu, Z., Tang, Z., Li, M., Lou, X., Dong, E., et al. (2019). Radiomics analysis of DTI data to assess vision outcome after intravenous methylprednisolone therapy in neuromyelitis optic neuritis. J. Magn. Reson. Imaging 49, 1365–1373. doi: 10.1002/jmri.26326
Uddin, S., Khan, A., Hossain, M. E., and Moni, M. A. (2019). Comparing different supervised machine learning algorithms for disease prediction. BMC Med. Inform. Decis. Mak. 19:281. doi: 10.1186/s12911-019-1004-8
Vallières, M., Freeman, C. R., Skamene, S. R., and El Naqa, I. (2015). A radiomics model from joint FDG-PET and MRI texture features for the prediction of lung metastases in soft-tissue sarcomas of the extremities. Phys. Med. Biol. 60, 5471–5496. doi: 10.1088/0031-9155/60/14/5471
Wang, B., Liu, Z., Liu, J., Tang, Z., Li, H., and Tian, J. (2016). Gray and white matter alterations in early HIV-infected patients: combined voxel-based morphometry and tract-based spatial statistics. J. Magn. Reson. Imaging 43, 1474–1483. doi: 10.1002/jmri.25100
Weston, P. S., Nicholas, J. M., Lehmann, M., Ryan, N. S., Liang, Y., Macpherson, K., et al. (2016). Presymptomatic cortical thinning in familial Alzheimer disease: a longitudinal MRI study. Neurology 87, 2050–2057. doi: 10.1212/WNL.0000000000003322
Yamanakkanavar, N., Choi, J. Y., and Lee, B. (2020). MRI segmentation and classification of human brain using deep learning for diagnosis of alzheimer’s disease: a survey. Sensors 20:3243. doi: 10.3390/s20113243
Yan, T., Wang, W., Yang, L., Chen, K., Chen, R., and Han, Y. (2018). Rich club disturbances of the human connectome from subjective cognitive decline to Alzheimer’s disease. Theranostics 8, 3237–3255. doi: 10.7150/thno.23772
Zhao, W., Wang, X., Yin, C., He, M., Li, S., and Han, Y. (2019). Trajectories of the hippocampal subfields atrophy in the Alzheimer’s Disease: a structural imaging study. Front. Neuroinform. 13:13. doi: 10.3389/fninf.2019.00013
Keywords: Alzheimer’s disease, preclinical AD, radiomics, MRI, multiparametric MRI, features, imaging biomarker, cross-validation
Citation: Li T-R, Wu Y, Jiang J-J, Lin H, Han C-L, Jiang J-H and Han Y (2020) Radiomics Analysis of Magnetic Resonance Imaging Facilitates the Identification of Preclinical Alzheimer’s Disease: An Exploratory Study. Front. Cell Dev. Biol. 8:605734. doi: 10.3389/fcell.2020.605734
Received: 13 September 2020; Accepted: 09 November 2020;
Published: 03 December 2020.
Edited by:
Chencheng Zhang, Shanghai Jiao Tong University, ChinaReviewed by:
Feng Bai, Nanjing Drum Tower Hospital, ChinaI-Shiang Tzeng, Chinese Culture University, Taiwan
Copyright © 2020 Li, Wu, Jiang, Lin, Han, Jiang and Han. This is an open-access article distributed under the terms of the Creative Commons Attribution License (CC BY). The use, distribution or reproduction in other forums is permitted, provided the original author(s) and the copyright owner(s) are credited and that the original publication in this journal is cited, in accordance with accepted academic practice. No use, distribution or reproduction is permitted which does not comply with these terms.
*Correspondence: Jie-Hui Jiang, jiangjiehui@shu.edu.cn; Ying Han, hanying@xwh.ccmu.edu.cn
†These authors have contributed equally to this work