
Fuzzy VIKOR approach to identify COVID-19 vulnerability region to control third wave in Assam, India
Abstract
These days, the appraisal of the COVID-19 vulnerability has become a difficult errand for the whole world. The COVID-19 administration dynamic issue frequently includes numerous elective arrangements clashing standards. In this paper, we present a multi-criteria decision-making (MCDM) procedure based on the fuzzy VIKOR method to survey the COVID-19 vulnerability in the state of Assam, India. The trapezoidal fuzzy number is utilized to evaluate the rating of the loads for the set-up models. We have observed environment, social, and Medical factors after observing the spread of COVID-19. To study and to have comments, a committee of five experts has been formed from a different region of Assam to observe and comment to identify Coronavirus’s weakest factors. For a better survey, we have divided the state into four areas namely Rural Area, Urban Area, Market Area in Rural Area, and Market Area in Urban Area. The current research looked at how the fuzzy VIKOR selects provinces for urgent adaptation needs differently than a traditional MCDM technique.
1Introduction
The novel Coronavirus, designated 2019-nCoV, infected a few people in Wuhan, China in December 2019, and since then, the outbreak has spread to over 200 countries a worldwide. This has driven the World Health Organization (WHO) to proclaim it as worldwide general wellbeing crisis. Legislatures of the countries influenced by this pandemic are going around defining arrangements and giving assets to deal with this scourge. Gauging the disease rate for a country can go about as a colossal resource in arranging and detailing approaches for such countries. While no model can precisely figure out the pace of contamination and mortality, endeavours have been made to consider and examine the qualities and weaknesses of numerous examinations and models introduced with respect to the COVID-19. Though the gauge models utilized by the wellbeing office or the Government of India were not unveiled, we can proceed with existing models in isolated distributions. Every one of these models adopted various strategies and procedures to anticipate future rates.
There has been a bounty of accessible numerical procedures to foresee the disease rate for the as of now continuous COVID-19 emergency. In past exploration [1], analysts assessed the presence of a larger part of these procedures and closed with two models which can be utilized for additional reasons for assessing the number of cases influenced by the COVID as these models gave the best forecasts. These two models, exponential bend fitting and least square fitted model can be utilized for the present moment and long haul estimating individually. The tale of the Coronavirus rose in Wuhan wet market, China in December 2019, and the virus had gradually spread across China and to numerous different nations via people traveling to and from China. Since the rise of this infection in December 2019, the number of tainted cases from China brought into different nations is on the ascent, and the epidemiologic picture is changing consistently [2]. In [35], authors studied a predictive analytics model for COVID-19 pandemic using artificial neural networks. Also, in [36], authors studied the impact of COVID-19 pandemic on the Turkish civil aviation industry.
We assessed the vulnerability of COVID-19 in the Assam provinces with the fuzzy VIKOR (FV). The current research looked at how the fuzzy VIKOR selects provinces for urgent adaptation needs differently than a traditional MCDM technique. We used the fuzzy VIKOR because it is a compromise option that takes into account both group utility and opponent regret. Compensation between these two criteria is especially important for province vulnerability assessments, as vulnerability rankings are frequently translated into rankings for prioritizing adaptation needs. Given the considerable effects of COVID-19, the adaption prioritizing across provinces should also evaluate overall pleasure and remorse over choosing the wrong provinces (alternatives).
1.1Purpose of the study
The primary purpose of the study is to identify the COVID-19 vulnerability region to control third or further waves in Assam, India. Also, the research aims to throw light on the awareness of COVID-19 like symptoms, environment effect, social distance, etc. criteria in Assam. Considering all of these points, the authors reviewed some important points with the real case of Assam, India. For better the study and to control the further wave of COVID-19 in Assam, the following research questions have been raised:
1) Possible spread of COVID-19 in Rainy Day, Cold Day, and Sunny Day.
2) Maintaining Social Distance in Assam.
3) Lately, Quarantine lockdown in Assam.
4) Lately, declaration of emergency.
5) Lately, restriction on internal border restriction reduced the ability to move freely.
6) Lack of restrictions on nonessential government service.
7) Lack of restrictions on mass gathering.
8) Not follow the curfew.
9) Not maintaining Health Monitoring.
10) Lack of health testing.
11) Lack of quarantine of patients and those suspected of infection.
12) Government policies that affect the country’s resources (Especially materials Health-Workers).
13) Due to the lack of fewer Medical workers (Medical staff).
1.2Motivation
We assessed the vulnerability of COVID-19 in the Assam provinces with the fuzzy VIKOR. The present study focused on how the fuzzy VIKOR makes different selections of provinces for urgent adaptation needs compared with a conventional MCDM approach. We employed the fuzzy VIKOR because the VIKOR provides a compromise solution, considering both group utility and the regret of an opponent. Such compensation between these two factors is particularly critical for the vulnerability assessment of provinces, as the vulnerability rankings are often translated to the rankings for prioritizing the provinces’ adaptation needs. Additionally, the adaptation prioritization among provinces should consider the overall satisfaction and regret of the selection of wrong provinces (alternatives), given the significant effects of COVID-19. This study contributes by using fuzzy mathematics and VIKOR multi-criteria decision making (MCDM) technique to demonstrate how different criteria’s/information related to COVID-19 providers could be ranked on several established criteria. Fuzzy VIKOR appears as powerful tool in allowing multiple expert opinions in the same model. The major contributions of the study are
1) The COVID-19 Vulnerability Region in Assam is identified to control the third or further wave of COVID-19 with the proposed model.
2) Different criteria (or possible ways) for the spread of COVID-19 are identified and arranged ranking-wise.
3) In the end, the advantages, comparative analysis, and limitations of the proposed study are discussed, to prove the effectiveness and novelty of the study.
2Materials and methods
2.1About VIKOR strategy
VIKOR strategy was created for multi-standards optimization of complex frameworks. It decides the trade-off positioning list, the trade-off arrangement, and the weight dependability span for inclination soundness of the trade-off arrangement acquired with the underlying (given) loads. VIKOR centres on positioning and choosing from a lot of options within the sight of clashing measures. Opricovic et al. [9] considered two MCDM strategies, VIKOR Method (VM) and TOPSIS Method (TM) which are looked at, zeroing in on demonstrating the accumulating capacity and normalization, to uncover and to analyse the procedural premise of these two MCDM techniques. VM strategy presents the positioning list dependent on the specific proportion of “closeness” to the ideal arrangement by utilizing direct standardization. Opricovic [10] studied civil engineering systems by multi-criteria optimization method. Liou et al. [8] used VM to analyses the management level of Taiwan’s domestic carriers and to identify the gaps between what aircraft deliver and what consumers seek, while Sanayei et al. [13] used VM to position providers in a flexible chain framework. Later, many authors used the application of fuzzy VICKOR and fuzzy MCDM [11, 12, 14–30, 37–42] in different fields of science and technology. Garg et al. [31] studied VIKOR methods for complex q-rung orthopair fuzzy sets and their applications. In [32], authors have presented an algorithm for T-spherical fuzzy multi-attribute decision making based on improved interactive aggregation operators.
2.2Data set preparation
We’ll start by discussing some relevant issues in Assam so that readers can get a sense of the state’s demographics. Assam is a North-Eastern Indian state. Assam had a population of 31.2 million people in 2011, according to Indian Census data. According to data from Unique Identification India, Assam’s predicted population is 35.6 million as of May 31, 2020. The state’s entire area is 78,438 square kilometers, with a population density of 397 people per square kilometer. Worldometers.info [3] can efficiently provide daily information on India’s total complete number for COVID-19. This source, on the other hand, shows the relevant information about Assam starting on August 16th, rather than from the beginning. We had to resort to the accompanying in order to obtain Assam-related information from the very beginning. From 31st March 2020, the day on which the first COVID-19 case was detected in Assam, through 19th August 2020, daily information is available on the COVID-19 Pandemic in Assam portal [4].
This portal’s data was not updated after August 19. So, we needed to depend on the data made accessible online by the Assam COVID-19 Dashboard, Govt. of Assam [5] to get the data we required. In any case, information for each current day is only accessible in this article. To obtain prior information, it was necessary to regularly monitor changes, which we did, and we now have the relevant information up to the present day. Day-by-day information is available on Worldometers.info [6] beginning August 16 in any case, as previously mentioned. It is realized that patients with comorbidities should play it safe to abstain from getting contaminated with the SARS CoV-2 as they have the most noticeably terrible anticipation (see for instance [7]). The number of deaths due to SARS CoV-2 in Assam has been determined, but it does not include the deaths of individuals (with comorbidities) who died after recovering from the COVID-19 infection. Undoubtedly this may really have been the followed standards somewhere else likewise the world over. As a result, estimates based on typical epidemiological models will be invalid.
In this article, we will introduce data obtained consistently from the passage Assam COVID-19 Dashboard, Govt. of Assam, from March onwards. This information corresponds to the Worldometers.info data from March onwards. In light of the way that the Assam Government Portal is refreshed each day, we are entranced to give information from March to October.
2.3Sampling and collecting data
The data collecting process was conducted online through WhatsApp, Gmail, Facebook platforms. Because this is a new study in the context of Assam, the questionnaire was surveyed in two phases: The first phase, the research survey on five experts to assess the understandable and logical level of the questionnaire. After collecting opinions, appropriate contextual adjustments were made and then conducted in the second phase. Phase 2, the data for affected by COVID-19 was officially collected from 31st March 2020 to 15th March 2021. The online survey was conducted over two months, from July to August 2021. The questionnaire was constructed by observing different criteria as discussed in the introduction section.
From the data (Table 1) it is seen that on 12th August 2020, the state also reported 4,593 COVID-19 positive cases, the highest single-day spike. From Table 1, it may be observed that there has been a steady increase in the number of cases over the months till the spurt of the Second Wave of the virus whose effect can be seen in the jump in the number of cases in the week between 20th April and 27th April where there is a significant increase of about 14,350 cases in a week.
Table 1
COVID-19 cases from March 2020 to April 2021 in Assam
| Dates | COVID-19 cases | Dates | COVID-19 cases |
| 31st March 2020 | 01 (First Case) | 01st September 2020 | 111724 |
| 01st April 2020 | 13 | 05th September 2020 | 123922 |
| 30th April 2020 | 42 | 10th September 2020 | 135805 |
| 05th May 2020 | 44 | 16th September 2020 | 148969 |
| 07th May 2020 | 53 | 19th September 2020 | 155453 |
| 14th May 2020 | 86 | 21st September 2020 | 159320 |
| 25th May 2020 | 548 | 02nd October 2020 | 183812 |
| 27th May 2020 | 783 | 06th October 2020 | 188902 |
| 31st May 2020 | 1361 | 19th October 2020 | 201404 |
| 01st June 2020 | 1485 | 27th October 2020 | 204171 |
| 05th June 2020 | 2243 | 1st November 2020 | 206514 |
| 10th June 2020 | 3285 | 8th November 2020 | 208786 |
| 18th June 2020 | 4904 | 23rd November 2020 | 211679 |
| 25th June 2020 | 6646 | 3rd December 2020 | 213168 |
| 30th June 2020 | 8407 | 13th December 2020 | 214654 |
| 1st July 2020 | 8955 | 23rd December 2020 | 215677 |
| 5th July 2020 | 11001 | 31st December 2020 | 216208 |
| 10th July 2020 | 15536 | 3rd January 2021 | 216304 |
| 15th July 2020 | 19754 | 1st February 2021 | 217154 |
| 25th July 2020 | 31086 | 10th February 2021 | 217267 |
| 31st July 2020 | 40269 | 16th February 2021 | 217309 |
| 01st August 2020 | 41726 | 6th March 2021 | 217649 |
| 05th August 2020 | 50445 | 15th March 2021 | 217797 |
| 10th August 2020 | 61737 | 29th March 2021 | 218310 |
| 15th August 2020 | 75558 | 1st April 2021 | 218470 |
| 19th August 2020 | 84317 | 20th April 2021 | 226326 |
| 25th August 2020 | 94592 | 27th April 2021 | 240676 |
| 31st August 2020 | 109040 |
3Proposed work
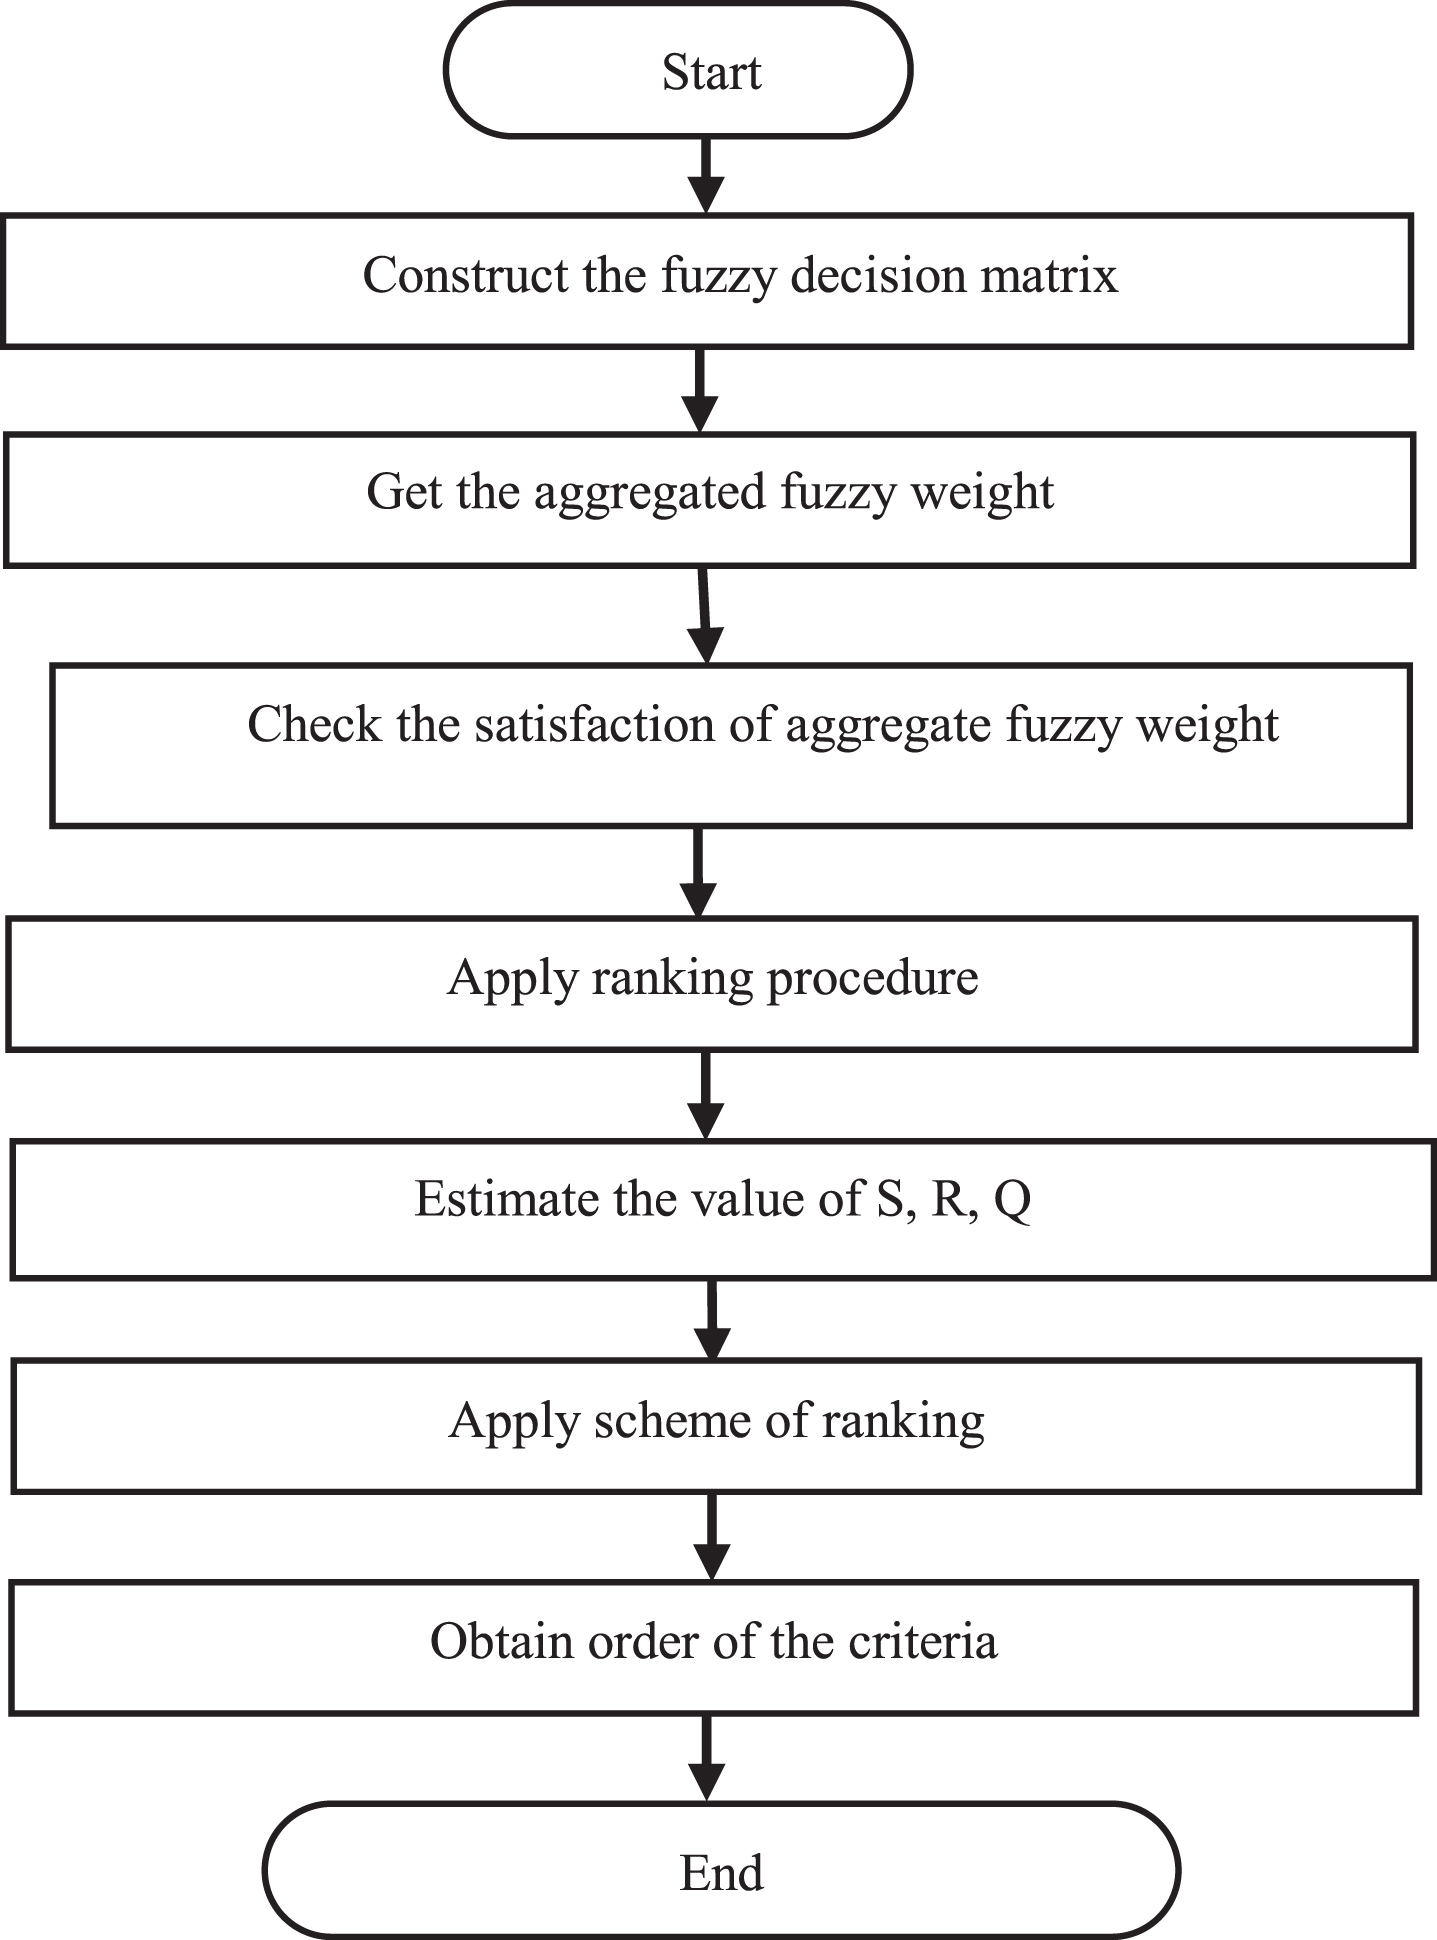
In this section, we are going to use the extended version of the Fuzzy VIKOR (FV) Method. It is focused on finding the best alternatives and compromise solutions to conflict criterion problems are determined. The steps in the FV process are as follows:
Step 1: Create the weight vector and fuzzy decision matrix.
Step 2: Orchestrating the dynamic gathering and describing a lot of pertinent ascribes. Idea plan determination requires recognizable proof of choice models, and afterward assessment scales are set up to rank the ideas.
Step 3: Aggregate the decisions makers’ (experts’) opinions to construct a fuzzy decision matrix and get aggregated fuzzy weights of criteria.
Step 4: Assume that the nth expert’s fuzzy rating and weight are χpqr = (χpqr1, χpqr2, χpqr3, χpqr4), and ωqr = (ωqr1, ωqr2, ωqr3, ωqr4). As a result, the aggregated fuzzy rating χpq of alternatives for each criterion can be determined as
The total fuzzy weight ωq of each criterion can be determined as follows:
ωq=(ωq1, ωq2, ωq3, ωq4), where ωq1=min(ωqr1), ωq2=1/r∑ωqr2, ωq3 = 1/r∑ωqr3, ωq4=max (ωqr4).
Step 5: Each criterion’s fuzzy weights are transformed to crisp values, and the fuzzy decision matrix is defuzzified.
Step 6: All criterion’s best
Step 7: Calculated the values of
Now we have values of
Step 8: To rank the alternatives, sort them
Step 9: Propose a compromise solution based on the alternative
The proposed framework of the research can be shown in the flowchart given in Fig. 1.
Fig. 1
Flowchart of the proposed study.
4Result and discussion
In Table 1, we looked into the COVID-19 outbreak in Assam, India. We observed that the spread pattern is exponential, with no signs of a reduction in the near future. As a result, predicting the peak of the pandemic in Assam is still impossible. The COVID-19 condition in this Indian state between March 2020 and April 2021 might be described as quite concerning. Even if the situation in India as a whole change, it’s possible that the spread in Assam will continue to increase rapidly.
Table 2
Linguistic variable table for each criterion
| Linguistic Variable | Fuzzy Number |
| Very High (ϱ) | (.8,.9, 1, 1) |
| High (χ) | (.7,.8,.8,.9) |
| Medium High (ω) | (.5,.6,.7,.8) |
| Medium (ψ) | (.4,.5,.5,.6) |
| Medium Low (ɛ) | (.2,.3,.4,.5) |
| Low (μ) | (.1,.2,.2,.3) |
| Very Low (τ) | (0, 0,.1,.2) |
The steps of rating of COVID-19 vulnerability region can be defined as follows:
Step 1: By observing the spread of COVID-19, we have observed three alternatives namely Environment factors, social factors, and Medical factors. So as to locate the most weakness (vulnerability) options, a specialist board of trustees of five experts,
1
2
3
4
Step 2: Orchestrating the dynamic gathering and describing a lot of pertinent ascribes. Idea plan determination requires recognizable proof of choice models, and afterward assessment scales are set up so as to rank the ideas. These rules must be characterized by the corporate techniques.
A committee of five experts
• Rainy Day (
• Cold Day <25°C (
• Sunny Day >30°C(
• Not maintaining Social Distance (
• Lately Quarantine lockdown (
• Lately declaration of emergency (
• Lately restriction on internal border restriction reducing the ability to move freely (
• Lack of restrictions of nonessential government service (
• Lack of restrictions of mass gathering (
• Not follow the curfew (
• Not maintaining Health Monitoring (
• Lack of health testing (
• Lack of quarantine of patients and those suspected of infection (
• Government policies that affect the country’s resources (especially materials Health Workers) (
• Due to lack of fewer Medical workers (Medical staff) (
Step 3: We define the appropriate etymological factors for model significance weights and fuzzy ratings for choices concerning each measure, and then these semantic factors can be presented as trapezoidal fuzzy numbers. Five experts utilized the phonetic weighting factors to survey the significance of the models. Experts have controlled the significant loads of the measurements, which are shown in Table 3. Table 4 shows the experts’ evaluations of the four idea plans (for four sub basins) using various metrics.
Table 3
Weight of criteria provided by experts
| Experts /criteria |
|
|
|
|
|
|
|
|
|
|
|
|
|
|
|
|
| χ | χ | χ | ϱ | χ | χ | χ | χ | ϱ | χ | χ | ω | ϱ | ω | ω |
|
| χ | τ | χ | ϱ | τ | τ | τ | τ | ϱ | τ | ω | ψ | τ | ψ | ϱ |
|
| ψ | χ | ψ | ϱ | ψ | μ | ψ | ψ | χ | ψ | μ | μ | ψ | ψ | μ |
|
| τ | τ | τ | ϱ | τ | τ | ψ | ϱ | ϱ | ϱ | ϱ | ϱ | ψ | ϱ | ψ |
|
| μ | μ | ω | ϱ | χ | ϱ | χ | χ | χ | χ | ϱ | ϱ | χ | χ | ψ |
Table 4
Appraisals of sub-basins provided by experts
| Decision makers | Alternatives |
|
|
|
|
|
|
|
|
|
|
|
|
|
|
|
|
|
| χ | χ | χ | ϱ | χ | χ | χ | χ | ϱ | χ | χ | ω | ϱ | ω | ω |
|
| ψ | ψ | ɛ | χ | χ | μ | ϱ | χ | χ | χ | χ | χ | ϱ | χ | χ | |
|
| χ | χ | χ | ϱ | χ | χ | ϱ | ϱ | ϱ | ω | ϱ | ω | ϱ | ω | χ | |
|
| ψ | ψ | ɛ | ϱ | χ | μ | χ | χ | χ | μ | ϱ | χ | ϱ | χ | χ | |
|
|
| χ | τ | χ | ϱ | τ | τ | τ | τ | ϱ | τ | ω | ψ | τ | ψ | ϱ |
|
| ω | τ | ω | ϱ | τ | μ | μ | τ | ϱ | τ | ω | ψ | τ | ψ | ϱ | |
|
| χ | τ | χ | ϱ | τ | τ | τ | τ | ϱ | μ | ω | ψ | τ | ψ | ϱ | |
|
| χ | τ | χ | ϱ | τ | μ | μ | τ | ϱ | ψ | ω | ψ | τ | ψ | ϱ | |
|
|
| ψ | χ | ψ | ϱ | ψ | μ | ψ | ψ | χ | ψ | μ | μ | ψ | ψ | μ |
|
| ψ | χ | ψ | ϱ | ψ | τ | ω | ψ | ϱ | ω | ψ | ψ | ψ | ψ | μ | |
|
| ψ | χ | ψ | ϱ | ψ | μ | ψ | ψ | χ | ω | μ | μ | ψ | ψ | μ | |
|
| ψ | χ | ψ | ϱ | ψ | τ | ω | ψ | ϱ | ω | ψ | ψ | ψ | ψ | μ | |
|
|
| τ | τ | τ | ϱ | τ | τ | ψ | ϱ | ϱ | ϱ | ϱ | ϱ | ψ | ϱ | ψ |
|
| τ | τ | τ | ϱ | τ | μ | ω | ϱ | ϱ | χ | ϱ | ϱ | χ | ϱ | ψ | |
|
| τ | τ | τ | ϱ | τ | τ | ψ | ϱ | ϱ | ϱ | ϱ | ϱ | ψ | ϱ | ψ | |
|
| τ | τ | τ | ϱ | τ | μ | ω | ϱ | ϱ | χ | ϱ | ϱ | χ | ϱ | ψ | |
|
|
| μ | μ | ω | ϱ | χ | ϱ | χ | χ | χ | χ | ϱ | ϱ | χ | χ | ψ |
|
| μ | μ | ω | ϱ | χ | χ | ω | χ | ϱ | ω | ϱ | ϱ | χ | χ | χ | |
|
| μ | μ | ω | ϱ | χ | ϱ | χ | χ | χ | ω | ϱ | ϱ | χ | χ | ψ | |
|
| μ | μ | ω | ϱ | χ | χ | ω | χ | ϱ | χ | ϱ | ϱ | χ | χ | χ |
Table 5
Aggregated fuzzy weights
| Weight |
|
|
|
| |
|
| (0,.46,.54,.90) | (0,.46,.48,.90) | (0,.36,.40,.80) | (0,.46,.48,.90) | (0,.40,.42,.90) |
|
| (0,.36,.40,.90) | (0,.36,.40,.90) | (0,.30,.34,.90) | (0,.36,.40,.90) | (0,.30,.34,.90) |
|
| (0,.54,.58,.90) | (0,.54,.58,.90) | (0,.40,.48,.80) | (0,.54,.58,.90) | (0,.44,.50,.90) |
|
| (.80,.90, 1, 1) | (.80,.90, 1, 1) | (.70,.88,.96, 1) | (.80,.90, 1, 1) | (.80,.90, 1, 1) |
|
| (0,.42,.46,.90) | (0,.42,.82,.90) | (0,.42,.46,.90) | (0,.42,.46,.90) | (0,.42,.46,.90) |
|
| (0,.38,.44, 1) | (0,.38,.44, 1) | (0,.28,.30, 1) | (0,.38,.44, 1) | (0,.28,.30, 1) |
|
| (0,.52,.54,.90) | (0,.52,.54,.90) | (0,.56,.62,.90) | (0,.56,.62,.90) | (0,.56,.62,.90) |
|
| (0,.60,.64, 1) | (0,.60,.64, 1) | (0,.60,.64, 1) | (0,.62,.68, 1) | (0,.60,.64, 1) |
|
| (.70,.86,.92, 1) | (.70,.86,.92, 1) | (.70,.88,.96, 1) | (.70,.86,.92, 1) | (.70,.88,.96, 1) |
|
| (0,.60,.64, 1) | (0,.60,.64, 1) | (0,.56,.62, 1) | (0,.58,.66, 1) | (0,.58,.60, 1) |
|
| (.10,.68,.74, 1) | (.10,.68,.74, 1) | (.40,.74,.80, 1) | (.10,.70,.78, 1) | (.40,.76,.84, 1) |
|
| (.10,.62,.68, 1) | (.10,.62,.68, 1) | (.40,.72,.76, 1) | (.10,.62,.68, 1) | (.40,.72,.76, 1) |
|
| (0,.54,.58, 1) | (0,.54,.58, 1) | (0,.60,.64, 1) | (0,.54,.58, 1) | (0,.62,.68, 1) |
|
| (.40,.66,.70, 1) | (.40,.66,.70, 1) | (.40,.70,.72, 1) | (.40,.66,.70, 1) | (.40,.70,.72, 1) |
|
| (.10,.54,.58, 1) | (.10,.54,.58, 1) | (.10,.64,.66, 1) | (.10,.58,.60, 1) | (.10,.64,.66, 1) |
Step 4: Assume that the nth expert’s fuzzy rating and weight are χpqr = (χpqr1, χpqr2, χpqr3, χpqr4), and ωqr = (ωqr1, ωqr2, ωqr3, ωqr4). As a result, the aggregated fuzzy rating χpq of alternatives for each criterion can be determined as in Table 6.
Table 6
Weight of each criterion
|
|
|
|
|
|
|
|
|
|
|
|
|
|
|
| |
| Weight | .48 | .41 | .51 | .93 | .45 | .46 | .49 | .56 | .87 | .56 | .63 | .60 | .53 | .69 | .56 |
|
| .46 | .42 | .51 | .93 | .54 | .46 | .49 | .56 | .87 | .56 | .63 | .60 | .53 | .69 | .56 |
|
| .39 | .39 | .42 | .89 | .45 | .40 | .52 | .56 | .89 | .55 | .67 | .72 | .56 | .71 | .60 |
|
| .46 | .42 | .51 | .93 | .45 | .46 | .52 | .58 | .87 | .56 | .65 | .60 | .53 | .69 | .57 |
|
| .43 | .39 | .46 | .93 | .45 | .40 | .52 | .56 | .89 | .55 | .75 | .72 | .58 | .71 | .60 |
Step 5: Each criterion’s fuzzy weights are transformed to crisp values, and the fuzzy decision matrix is defuzzified, shown as Table 6.
Step 6: All criterions’ best
Table 7
Best and worst values
|
|
|
|
|
|
|
|
|
|
|
|
|
|
|
| |
|
| .46 | .415 | .505 | .925 | .535 | .455 | .52 | .575 | .885 | .56 | .75 | .72 | .575 | .705 | .60 |
|
| .39 | .385 | .42 | .885 | .445 | .395 | .49 | .56 | .87 | .545 | .63 | .60 | .53 | .69 | .555 |
Step 7: The values of
Table 8
|
|
|
|
| |
|
| 4.92 | 4.94 | 4.05 | 2.9 |
|
| .87 | .92 | .9 | .56 |
|
| .92 | 1 | .7 | 0 |
Step 8: Table 9 shows the ranking of the Alternatives.
Table 9
Alternatives are ranked in ascending order by
| Rank | 1 | 2 | 3 | 4 |
|
|
|
|
|
|
|
|
|
|
|
|
|
|
|
|
|
|
Step 9: Table 10 shows the ranking of the alternatives.
Table 10
Criteria wise ranking of four alternatives
| Ordering of Alternatives from high to low | |||||
| 1. |
|
|
|
|
|
| 2. |
|
|
|
|
|
| 3. |
|
|
|
|
|
| 4. |
|
|
|
|
|
| 5. |
|
| A4 |
|
|
| 6. |
|
|
| A4 |
|
| 7. |
|
|
|
|
|
| 8. |
|
|
|
|
|
| 9. |
|
|
|
|
|
| 10. |
|
|
|
|
|
| 11. |
|
|
|
|
|
| 12. |
|
|
|
|
|
| 13. |
|
|
|
|
|
| 14. |
|
|
|
|
|
| 15. |
|
|
|
|
|
5Sensitivity analysis
In this study, sensitivity analysis evaluates the ranking of alternatives associated with various criteria. The main study of the paper is to find out the impact of different criteria in their respective rankings in different sectors like a rural area, urban area, a market area in a rural area, and market area in an urban area of Assam. Table 10 shows criteria wise ranking of vulnerability of four alternatives discussed in this study. The result shows that the alternative
Table 11
Ranking of criteria weights
| 1. |
|
| 2. |
|
| 3. |
|
| 4. |
|
| 5. |
|
| 6. |
|
| 7. |
|
| 8. |
|
| 9. |
|
| 10. |
|
| 11. |
|
| 12. |
|
| 13. |
|
| 14. |
|
| 15. |
|
5.1Comparison
In [33], the authors used fuzzy logic approach to study prevention from COVID-19 in India. According to the study, the virus remains in the human body for 14 days. Also, they suggested if somebody travels history from the infected area then she/he has to undergo quarantine for 14 days. Also, in the study mainly observation of symptoms of COVID-19 is focused.
In our study, many different angles are observed including travel history and symptoms of the patients by applying the Fuzzy VIKOR method In Assam. Also, the present study tells of the ranking of the different criteria. This indicates persons alert or careful to people about the prevention of COVID-19.
In [34], different treatment options for COVID-19 using fuzzy PROMETHEE and VIKOR methods are discussed. According to the study overall, there is no globally approved specific antiviral drug available for COVID-19. All drug options come from the experience of treating SARS, MERS, or other new influenza viruses. Active symptomatic support is the key to treatment.
In our study, we have used the Fuzzy VIKOR method to analyze the importance of not maintaining Health Monitoring, Lack of health testing, Lack of quarantine of patients and those suspected of infection, Government policies that affect the country’s resources (especially materials Health Workers), Due to lack of less Medical workers (Medical stuff). Also, these criteria are arranged in systematic systems.
5.2Advantages of the studies
Our approach has several advantages over the existing multivariate regression approach as follows:
1) This study shows the approach of Fuzzy VIKOR to analyze the approach to Identify COVID-19 Vulnerability Region in Assam, India to control the third wave or further wave of COVID-19.
2) The Fuzzy VIKOR can identify the significant factors or different criteria of Vulnerability Region in Assam intention through relative weights based on experts’ opinions.
3) The benefits of this research will accrue knowledge about the COVID-19 Vulnerability Region in Assam. Further, this study will show the ranking wise of each criteria Rainy Day, Cold Day, Sunny Day, Not maintaining Social Distance, Lately Quarantine lockdown, Lately declaration of emergency, Lately restriction on internal border restriction reducing the ability to move freely, Lack of restrictions of nonessential government service, Lack of restrictions of mass gathering, Not follow the curfew, Not maintaining Health Monitoring, Lack of health testing, Lack of quarantine of patients and those of suspected of infection, Government policies that effects the country’s resources (especially materials Health Workers) and Due to lack of less Medical workers (Medical stuff). Understanding these factors would enable the government to optimize its intervention strategies and accelerate the massive important steps to overcome against COVID-19 and can take the good initiative to control third wave or further wave of COVID-19.
6Conclusion
In this investigation, we evaluated the COVID-19 weakness in the Assam locale with Fuzzy VIKOR. We characterized the COVID-19 weakness as a component of environmental factors, social factors, and medical elements, and we profiled the critical pointers for weakness with the Expert’s decision. Fuzzy VIKOR technique is a useful apparatus in multi standards dynamic bargained arrangement which got, could be acknowledged by the experts since it gives the greatest gathering utility (represented by the minimum value of S) of the larger part, and at least the individual lament (represented by the minimum value of R) of the adversary. In this examination, we proposed an altered Fuzzy VIKOR that was upheld by the OWA administrator and decided loads of rules. As per the last score, the option
There are some limitations to the study as well. First, because the laboratory selection problem’s decision-makers developed a team decision matrix, aggregation operations were not presented in real-life applications. Second, the study yielded positive results when additional experts were included. We’ve gathered five specialists on this case. The main limitation of the study is that selection of the criteria related to COVID-19 is challengeable.
For future research suggestions, we would like to propose different MCDM based on fuzzy and Neutrosophic sense to study the impact of COVID-19 in a different community of Assam by taking different criteria of the area. Because it is observed that some community has less influence than other community. For example, tribal people of Assam who live exclusively in rural areas or forest areas are less affected.
Acknowledgment
The authors would like to express sincere thanks and gratitude to experts for giving valuable suggestions for betterment of the manuscript. Also, the author (Harish Garg) is grateful to DST-FIST grant SR/FST/MS-1/2017/13 for providing technical support.
Supplementary material
[1] The supplementary material is available in the electronic version of this article: https://dx.doi.org/10.3233/JIFS-213279.
References
[1] | Gola A. , Arya R.K. Animesh , and Dugh R ., Reviewof Forecasting Models for Coronavirus (COVID-19) Pandemic in India during Country wise Lockdown, medRxiv preprint doi: 10.1101/2020.08.03.20167254. |
[2] | Huang C. , Wang Y. , Li X. , et al. Clinical features of patients infected with 2019 novel coronavirus in Wuhan, China, Lancet 395: ((2020) ), 497–506. DOI: 10.1016/S0140-6736. |
[3] | Total Worldometers.info. Total corona virus cases in India, Pub-lishing Date: September 16, (2020) . Place of Publication: Dover, Delaware, U.S.A. |
[4] | COVID-19 Pandemic in Assam, en.m.wikipedia.org. |
[5] | Assam COVID-19 Dashboard, COVID-19 Advisory, Government of Assam, covid19.assam.gov.in. |
[6] | Baruah H.K. The Uncertain COVID-19 Spread Pattern in India: A Statistical Analysis of the Current Situation, Journal of Mathematics and Informatics, Article in Press, Published online on September 16, (2020) . medRxiv preprint doi: https://doi.org/10.1101/2020.08.30.20184598 posted September 2, 2020. |
[7] | Sanyaolu A. , Okorie C. , Marinkovic A. , et al., Comorbidity and its impact on patients with COVID-19, SN Comp. Clin. Med. 2: , ((2020) ), 1069–1076. https://doi.org/10.1007/s42399-020-00363-4. |
[8] | Liou J.J.H. , et al., A modified VIKOR multiple-criteria decision method for improving domestic airlines service quality, J. Air Trans Manag 17: (2) ((2010) ), 57–61. |
[9] | Opricovic S. and Tzeng G.H. , Compromise solution by MCDM methods: a comparative analysis of VIKOR and TOPSIS, Eur J Oper Res 156: ((2004) ), 445–455. |
[10] | Opricovic S. , Multicriteria optimization of civil engineering systems, Faculty of Civil Engineering, Belgrade, (1998) . |
[11] | Ren J. , Yusuf Y.Y. , Burns N.D. , Organizational competitiveness: identifying the critical agile attributes using principal component analysis, 16th International Conference on Production Research, ID 0588, 29 July 3–August 2001, Prague, Czech Republic, (2001) . |
[12] | Saaty T.L. , The analytical hierarchy process, McGraw-Hill, New York, (1981) . |
[13] | Sanayei A. , et al., Group decision making process for supplier selection with VIKOR under fuzzy environment, Expert Syst. Appl. 37: ((2010) ), 24–30. |
[14] | Torlak G. , Sevkli M. , Sanal M. and Zaim S. , Analyzing business competition by using fuzzy TOPSIS method: an example of Turkish domestic airline industry, Expert Syst. Appl. 38: (4) ((2011) ) 3396–3406. |
[15] | Opricovic S. , Fuzzy VIKOR with an application to water resources planning, Expert Syst. Appl. 38: (10) ((2011) ), 12983–12990. |
[16] | Zadeh L.A. , Yager R. , Ovchinnokov S. , Tong R. , Nguyen H. (Eds.), Fuzzy Sets and Applications: Selected Papers, Wiley, New York, (1987) . |
[17] | Sayadi M.K. , Heydari M. and Shahanaghi K. , Extension of VIKOR method for decision making problem with interval numbers, Appl. Math. Model. 33: (5) ((2009) ), 2257–2262. |
[18] | Roy B. and Vincke P. , Multicriteria analysis: survey and new directions, Eur. J. Oper. Res. 8: (3) ((1981) ), 207–218. |
[19] | Chung E.S. and Lee K.S. , Identification of spatial ranking of hydrological vulnerability using multi-criteria decisionmaking techniques: case study of Korea, Water Resour. Manage. 23: (12) ((2009) ), 2395–2416. |
[20] | Qin X.S. , Huang G.H. , Chakma A. , Nie X.H. and Lin Q.G. , A MCDM-based expert system for climate-change impact assessment and adaptation planning – a case study for the Georgia Basin, Canada, Expert Syst. Appl. 34: (3) ((2008) ), 2164–2179. |
[21] | Afshar A. , Marino M.A. and Saadatpour M. , Fuzzy TOPSIS multi-criteria decision analysis applied to Karun reservoirs system, Water Resour. Manage. 25: (2) ((2011) ), 545–563. |
[22] | Zeng S. , Chen S.M. and Fan K.Y. , Interval-valued intuitionistic fuzzy multiple attribute decision making based on nonlinear programming methodology and TOPSIS method, Information Sciences 506: ((2020) ), 424–442. |
[23] | Zeng S. , Chen S.M. and Kuo L.W. , Multiattribute decision making based on novel score function of intuitionistic fuzzy values and modified VIKOR method, Information Sciences 488: ((2019) ), 76–92. |
[24] | Wang P. and Liu P. , Some Maclaurin symmetric mean aggregation operators based on Schweizer Sklar operations for intuitionistic fuzzy numbers and their application to decision making, Journal of Intelligent & Fuzzy Systems 36: (4) ((2019) ), 3801–3824. |
[25] | Garg H. , A new generalized Pythagorean fuzzy information aggregation using Einstein operations and its application to decision making, International Journal of Intelligent Systems 31: (9) ((2016) ), 886–920. |
[26] | Wei G. and Lu M. , Pythagorean fuzzy power aggregation operators in multiple attribute decision making, International Journal of Intelligent Systems 33: (1) ((2018) ), 169–186. |
[27] | Yang Z. and Chang J. , Interval-valued Pythagorean normal fuzzy information aggregation operators for multi-attribute decision making, IEEE Access 8: ((2020) ), 51295–51314. |
[28] | Zeng S. , Mu Z. and Baležentis T. , A novel aggregation method for Pythagorean fuzzy multiple attribute group decision making, International Journal of Intelligent Systems 33: (3) ((2018) ), 573–585. |
[29] | Zeng S. , Peng X. , Baležentis T. ,Prioritization of low-carbon suppliers based on Pythagorean fuzzy group decision making with self-confidence level, Economic Research-Ekonomska Istraživanja 32: (1) ((2019) ), 1073–1087. |
[30] | Zeng S. , Pythagorean fuzzy multiattribute group decision making with probabilistic information and OWA approach, International Journal of Intelligent Systems 32: (11) ((2017) ), 1136–1150. |
[31] | Garg H. , Gwak J. , Mahmood T. and Ali Z. , Power aggregation operators and VIKOR methods for complex q-rung orthopair fuzzy sets and their applications, Mathematics 8: (4) ((2020) ), 538. |
[32] | Garg H. , Munir M. , Ullah K. , Mahmood T. and Jan N. , Algorithm for T-spherical fuzzy multi-attribute decision making based on improved interactive aggregation operators, Symmetry 10: (12) ((2018) ), 670. |
[33] | Ahamad M.K. , Bharti A.K. , Prevention from COVID-19 in India: Fuzzy Logic Approach, International Conference on Advance Computing and Innovative Technologies in Engineering ((2021) ), 421–426, doi: 10.1109/ICACITE51222.2021.9404575. |
[34] | Yildirim F.S. , Sayan M. , Sanlidag T. , Uzun B. , Ozsahin D.U. , Ozsahin I. , Comparative evaluation of the treatment of COVID-19 with multicriteria decision-making techniques. Journal of Healthcare Engineering ((2021) ). |
[35] | Kuvvetli Y. , Devecib M. , Paksoyc T. and Garg H. , A predictive analytics model for COVID-19 pandemic using artificial neural networks, Decision Analytics Journal 1: ((2021) ), 100007. |
[36] | Deveci M. , Çiftçi M.E ., Akyurt İZ ., Gonzalez E.D.S.E ., Impact of COVID-19 pandemic on the Turkish civil aviation industry, Sustainable Operations and Computers 3: ((2022) ), 93–102. |
[37] | Deveci M. , Öner S.C. , Ciftci M.E. , Özcan E. and Pamucar D. , Interval type-2 hesitant fuzzy Entropy-based WASPAS approach for aircraft type selection, Applied Soft Computing 114: ((2022) ), 108076. |
[38] | Akyurt İ.Z. , Pamucar D. , Deveci M. , Kalan O. , Kuvvetli Y. , AFlight Base Selection for Flight Academy Using a Rough MACBETH and RAFSI Based Decision-Making Analysis, IEEE Transactions on Engineering Management ((2021) ), 1–16. |
[39] | Deveci M. , Cali U. and Pamucar D. , Evaluation of criteria for site selection of solar photovoltaic (PV) projects using fuzzy logarithmic additive estimation of weight coefficients, Energy Reports 7: ((2021) ), 8805–8824. |
[40] | Simic V. , Gokasar I. , Deveci M. , Isik M. , Fermatean Fuzzy Group Decision-Making Based CODAS Approach for Taxation of Public Transit Investments, IEEE Transactions on Engineering Management ((2021) ), doi: 10.1109/TEM.2021.3109038. |
[41] | Sun Q. , Wu J. , Chiclana F. , Fujita H. , Herrera-Viedma E. , A dynamic feedback mechanism with attitudinal consensus threshold for minimum adjustment cost in group decision making, IEEE Transactions on Fuzzy Systems ((2021) ), DOI: 10.1109/TFUZZ.2021.3057705. |
[42] | Wu J. , Wang S. , Chiclana F. , Herrera-Viedma E. , Two-fold personalized feedback mechanism for social network consensus by uninorm interval trust propagation, IEEE Transactions on Cybernetics ((2021) ), DOI: 10.1109/TCYB.2021.3076420. |

