
Search in the Periphery for Potential Inflammatory Biomarkers of Dementia with Lewy Bodies and Alzheimer’s Disease
Abstract
Background:
Neuroinflammation, with altered peripheral proinflammatory cytokine production, plays a major role in the pathogenesis of neurodegenerative diseases, such as Alzheimer’s disease (AD), while the role of inflammation in dementia with Lewy bodies (DLB) is less known and the results of different studies are often in disagreement.
Objective:
The present study aimed to investigate the levels of TNFα and IL-6 in serum and supernatants, and the related DNA methylation in patients affected by DLB and AD compared to healthy controls (HCs), to clarify the role of epigenetic mechanisms of DNA promoter methylation on of pro-inflammatory cytokines overproduction.
Methods:
Twenty-one patients with DLB and fourteen with AD were frequency-matched for age and sex with eleven HCs. Clinical evaluation, TNFα and IL-6 gene methylation status, cytokine gene expression levels and production in serum and peripheral blood mononuclear cell (PBMC) supernatants were performed.
Results:
In AD and DLB patients, higher serum levels of IL-6 and TNFα were detected than in HCs. Differences in LPS-stimulated versus spontaneous PBMCs were observed between DLB, AD, and HC in the levels of TNFα (p = 0.027) and IL-6 (p < 0.001). Higher levels were also revealed for sIL-6R in DLB (p < 0.001) and AD (p < 0.001) in comparison with HC.DNA hypomethylation in IL-6 and TNFα CpG promoter sites was detected for DLB and AD patients compared to the corresponding site in HCs.
Conclusions:
Our preliminary study documented increased levels of IL-6 and TNFα in DLB and AD patients to HCs. This overproduction can be due to epigenetic mechanisms regarding the hypomethylation of DNA promoters.
INTRODUCTION
Over the last few years, an extensive interaction between the central nervous system (CNS) and peripheral immune system has largely been documented [1], and dysfunction of immune function may lead to damage in CNS. Persistent systemic inflammation coming from the periphery can drive neurodegenerative disorders and cognitive impairment. Peripheral and CNS immune systems communicate extensively through chemical messengers such as cytokines. Indeed, epidemiological studies found higher blood levels of proinflammatory cytokines, cytokine receptors, and other inflammatory markers that seem to communicate with the CNS through neural and humoral pathways, such as afferent vagus nerve signaling, transcytosis of cytokines through blood vessel walls into circumventricular organs, or receptor-mediated transcytosis across the blood–brain barrier (BBB) [2]. In the CNS, proinflammatory cytokines promote the activation of microglia and astrocytes, inducing their proinflammatory phenotype. Several studies have shown that peripheral inflammation is associated with microglial cell activation and increased expression of inflammatory cytokines that perpetuate the inflammatory cycle, activating additional microglia, promoting their proliferation, and further releasing inflammatory factors [3–5]. Therefore, in response to endogenous and exogenous agents, CNS cells produce different cytokines that can lead to the well-known process of neuroinflammation. Eventually, for a continuous release of neuroinflammatory mediators, this systemic inflammatory pathway can contribute to neurodegenerative processes.
Previous studies showed that the sustained presence of systemic inflammatory mediators adversely influences cognitive functioning leading to neurodegeneration such as Alzheimer’s disease (AD) or Lewy body disease (LBD), including Parkinson’s disease (PD) and dementia with Lewy bodies (DLB) [6–10].
In AD patients, several studies detected an association between serum levels of proinflammatory cytokines and the severity of cognitive decline as well as between elevated levels of tumor necrosis factor (TNF)α and interleukin-6 (IL-6) and an increased frequency of neuropsychiatric symptoms [6, 11, 12]. Additionally, the elevated cytokine levels in plasma and cerebrospinal fluid (CSF) of AD patients and the upregulation of cytokine mRNA levels in postmortem brain samples suggest that central and peripheral immune activation may be related and implicated in the pathogenesis of neurodegenerative diseases [13–15].
Previous studies reported an increased blood concentration of several proinflammatory cytokines in patients with DLB, PD and PD with dementia (PDD), which seems to predict more severe disease progression [16–18]. Only a few studies have investigated cytokine levels in both CSF and blood samples of patients with DLB, and controversial results were found when compared to healthy controls (HC) [19–21].
Therefore, the variability of all these results has not yet allowed us to clarify whether systemic inflammation plays a key role in the pathogenesis of dementia.
Measurements of cytokine levels in serum/plasma may not satisfactorily reflect peripheral blood cell cytokine production and balances, while the evaluation of stimulated cytokines mRNA expression and production in ex vivo peripheral blood cell could mirror inflammatory mechanisms in a more specific condition and may help to explore the new diagnostic or therapeutic targets. Lipopolysaccharide (LPS) is the most abundant component within the cell wall of Gram-negative bacteria. It can stimulate the release of inflammatory cytokines in various cell types, leading to an inflammatory response and is used to demonstrate neuroinflammation related with neurodegeneration [22].
In the pathogenesis of inflammatory diseases, a critical mechanism in the regulation of cytokine production is represented by epigenetic variability. One principal epigenetic mechanism is DNA methylation in the promoter region, which plays a role in mediating gene expression, with more methylation of promoters associating with low or null gene transcription [23]. Methylation generally occurs rapidly and can be detected early at disease onset, which may represent a precocious indicator of disease. More specifically, alterations in DNA methylation have been shown to modulate the brain transcriptome, potentially contributing to neurodegeneration [24]. In fact, differences in blood methylation of clinically diagnosed patients suggested that clinical variation in DLB may be reflected in the blood epigenome [25]. The literature has also reported that by evaluating epigenetic markers in peripheral blood, differences in DNA methylation were detected in patients with AD compared to HCs, indicating that a biosignature of DNA methylation could be useful for the diagnosis of AD [26]. Considering specifically the link between neuroinflammation and DLB or AD, a number of abnormal methylation patterns have been observed in various genes, such as inflammatory factors (e.g., TNFα and interleukins), that trigger neuroinflammation and may contribute to the development of such disease states [27, 28].
The suggestion that peripheral immune cells may mirror human microglia originates from studies demonstrating comparable dysfunctions in the brain and periphery; therefore, the accessibility and non-invasiveness of sampling peripheral blood make the use of peripheral blood mononuclear cells (PBMCs) a very attractive option to monitor neuroinflammation in individuals with dementia [29, 30].
Thus, the aim of the present study was to investigate the systemic levels of the proinflammatory cytokines TNFα and IL-6 and DNA methylation in the PBMCs of patients with DLB and AD compared to HCs to improve the understanding of these neurodegenerative diseases and investigate the potential importance of these peripheral factors as diagnostic biomarkers.
METHODS
Study participants
Twenty-one patients with a diagnosis of probable DLB according to clinical criteria [31] and fourteen patients with AD [32], frequency matched for sex, age, education, disease duration, and cognitive status, were consecutively recruited from the Dementia Center of the Neurology Unit, “G. d’Annunzio” University of Chieti-Pescara. These two disease groups were compared to eleven HCs, frequency matched for age and gender and recruited among the patients’ caregivers.
Clinical diagnosis of probable DLB was made according to revised diagnostic criteria [33] and for comparison, probable AD was based on the National Institute on Aging and the Alzheimer’s Association (NIA-AA) and the European Federation of Neurological Societies/European Neurological Society (ENS-EFNS) criteria [33, 34]. All selected patients were evaluated for neurological and internal diseases (i.e., hypertension and diabetes mellitus). Laboratory analyses excluded secondary cognitive disorders, and patients with ascertained neurological diseases other than DLB and psychiatric diseases were excluded. All selected patients underwent neurological examination, neuropsychological tests (Montreal Cognitive Assessment, MoCA) and magnetic resonance imaging (MRI), for morphological brain assessment and to exclude the presence of brain tumors or of major cortical atrophy. The standard of reference was final diagnosis of DLB/AD, defined retrospectively by a multidisciplinary team including experienced dementia specialists, neuropsychologists, radiologists, and nuclear medicine physicians of University of Chieti-Pescara, after a clinical follow-up of a minimum of 12 months after the first neurological evaluation. The final clinical diagnosis was also based on the biomarkers available for each patient. Electroencephalogram (EEG) was also recorded in all subjects and spectral analysis was performed by expert neurophysiologist to evaluate the presence of a DLB typical pattern [33, 35].
In all patients enrolled, clinical assessment, including cognitive and neuropsychiatric profiles, was also evaluated. Cognitive impairment was assessed by MoCA [36]. The Clinical Dementia Rating (CDR) scale was also calculated in each participant with cognitive decline [37]. In DLB patients, the presence of fluctuating cognition (CF) was assessed by the Clinician Assessment of fluctuation (CAF) questionnaire [38], the presence of REM sleep behavior disorder (RBD) by the Mayo Questionnaire [39], parkinsonism was investigated by the Unified Parkinson’s Disease Rating Scale (UPDRS) score (part III) [40], and the presence of visual hallucinations (VH) by the Neuropsychiatric Inventory (NPI) [41].
The study was conducted according to the Declaration of Helsinki and subsequent revisions and approved by the local Ethics Committee (RF2018). All the participants or their caregivers signed an informed consent before participating in the study.
Blood samples and cell cultures
Blood samples were collected in the morning between 08 : 00 and 10.00 a.m. Tubes were kept at room temperature (RT) and transported to the laboratory for processing within 1 h from collection.
Serum was collected by blood centrifugation at 1600 rpm for 10 min and frozen at –80°C. PBMCs from each subject were separated from heparinized whole blood by the standard density-gradient centrifugation procedure.
Briefly, 10 mL of blood/saline (1 : 2 v/v) was layered over 5 mL of Ficoll-Paque (GE Healthcare, Merck KGaA, Darmstadt, Germany) and centrifuged at 1600 rpm for 40 min at RT. Cells were harvested from the interface, washed twice with PBS, and resuspended in RPMI 1640 medium (Merck KGaA, Darmstadt, Germany) supplemented with 10% fetal bovine serum (FBS) (Euroclone, MI, Italy), 4 mM L-glutamine, 50 U/ml penicillin, and 50 mg/L streptomycin (all purchased from Sigma–Aldrich, Darmstadt, Germany). Cells were seeded at a concentration of 2 x 10⁶ in 5 mL polypropylene culture tubes (BD Falcontrademark, Two Oak Park Bedford, MA, USA) and grown in an incubator for 24 h in the presence or absence of 10μg/mL of bacterial lipopolysaccharide (LPS; Merck KGaA, Darmstadt, Germany). After this time, the tubes were centrifuged to collect supernatant that was stored at –80°C for later analysis of spontaneous cytokine production.
LPS dosage and incubation time were selected based on previous studies from our laboratory and other groups for the ability to induce the maximal stimulation of the PBMC release of proinflammatory cytokines. All tissue culture reagents were screened before use and found to be negative for endotoxin (<10 pg/ml; Associates of Cape Cod, Inc., Woods Hole, MA, USA) and mycoplasma contamination (General-probe II; General-probe Inc., San Diego, CA, USA). More than 98% of PBMCs were viable, as determined by trypan blue dye exclusion at the beginning of the culture, and more than 90% were viable before supernatants were collected.
Cytokine assays
IL-6 and TNFα concentrations in serum and PBMC culture supernatants were evaluated by enzyme-linked immunosorbent assays (ELISAs) using commercially available kits for IL-6 and TNFα (Cusabio, Houston, TX, USA). All samples were analyzed in duplicate at the same time. Briefly, a monoclonal antibody specific for IL-6 or TNFα was precoated onto a microtiter plate. Standards and samples were pipetted into the wells; thus, IL-6 or TNFα in the sample was bound by the immobilized antibody. After washing away any unbound substance, an enzyme-linked polyclonal antibody specific was added to the wells. After washing, a substrate solution was added to the wells, and color developed in proportion to the amount of IL-6 or TNFα bound in the initial step. The color development was stopped after 30 minutes, and the intensity of the color was measured at 450 nm. The lower detection limit of the IL-6 and TNFα assay was <7.8 pg/mL with an intra-assay precision <8% and inter-assay precision <10%.
DNA isolation and pyrosequencing
Genomic DNA was extracted from blood samples using the Nucleospin Tissue kit (Macherey-Nagel, Milan, Italy). The quantity and quality of DNA were assessed by Qubit 2.0 (Invitrogen, Monza, Italy). DNA was bisulfite-converted by the EpiTect Plus DNA Bisulfite Kit (Qiagen, Hilden, Germany), converting unmethylated cytosines to uracils, and stored at –20°C until use. PCR amplification of the IL-6 and TNFα promoters was performed using 2× PyroMark PCR Master Mix and 10× CoralLoad Concentrate (Qiagen, Hilden, Germany), 0.2μM of each primer, 1μL of bisulfite-converted DNA and nuclease-free water to a final volume of 25μL. The sequences of primers used for DNA methylation analysis are shown in Table 1. The PCR conditions were as follows: 95°C for 15 min, 45 cycles at 94°C for 30 s, 56°C (IL-6) and 57°C (TNFα) for 30 s, 72°C for 30 s, and a final extension at 72°C for 10 min. In order to evaluate the methylation status of specific CpG sites, of major interest, located in the promoters of IL-6 and TNFα genes in a single experimental approach, the pyrosequencing reaction plates were loaded on a PyroMark Q96ID (Qiagen, Hilden, Germany), and CpG methylation analysis was conducted by PyroMark CpG software (Qiagen, Hilden, Germany). A triplicate was generated for each PCR. Methylation for each amplicon was calculated as the median methylation status of each analysed CpG. Two CpGs were evaluated on the IL-6 promoter, and four CpGs were evaluated on the TNFα gene promoter.
Table 1
DNA methylation PCR and pyrosequencing primer sequences
| Name of target gene | IL-6 | TNFα |
| Forward PCR primer | 5’-[Biotin]-TATTTTAGTTTTGAGAA AGGAGGTG-3′ | 5’-[Biotin]-TGAGGGGTATTTTTGATGTTTGT-3′ |
| Reverse PCR Primer | 5′-CAATACTCTAAAACCCAACAA AAAC-3′ | 5′-CCAACAACT ACCTTTATATATCCC-3′ |
| Sequencing Primer | 5′-TCCTAATACAAACAACCCC-3′ | 5′-ATAAACCCTACACCTTCTAT-3′ |
| Sequence to Analyze | CRACCACACRCAAAAACAAAAAAAAC | CTCA/GATTTCTTCTCCATCA/GCA/ GAAAACA/GAAAATTT |
Statistical analysis
Descriptive analysis was carried out using the mean and standard deviation (SD) for quantitative variables, while frequencies and percentages were used to describe the qualitative variables. The normality of the distribution was tested by the Shapiro–Wilk test. To evaluate differences between groups (DLB, AD, and HC) in quantitative variables, one-way ANOVA or Student’s t test for unpaired data, when appropriate, was assessed. Pearson’s chi-squared test was applied for univariate comparisons in categorical data. The Tukey test correction for posthoc comparisons tests was applied. Spearman’s rho correlation coefficient, with listwise deletion, was calculated to compare the relationship of the continuous parameters. Statistical significance was set at the level of ≤0.05. All analyses were performed using the R environment (version 4.1).
RESULTS
Demographic characteristics
Demographic and clinical characteristics are reported in Table 2. No significant differences were found for age, gender, and education level among groups, as per the inclusion criteria. No difference was observed in disease duration between DLB and AD subjects. As expected, mean MoCA scores were lower in DLB and AD patients than in HCs.
Table 2
Demographic and clinical characteristics of the experimental groups
| Groups | DLB | AD | HC | p |
| (n = 21) | (n = 14) | (n = 11) | ||
| Demographics | ||||
| Sex (Female), n (%) | 61.9% | 57.9% | 60.0% | 0.961a |
| Age (y), mean (SD) | 78.81 (5.95) | 73.71 (6.82) | 76.2 (4.32) | 0.052b |
| Education (y), mean (SD) | 7.81 (4.90) | 6.64 (3.17) | 7.80 (3.08) | 0.595b |
| Clinical features | ||||
| Disease duration (y), mean (SD) | 5.48 (3.59) | 5.28 (4.25) | / | 0.882c |
| MoCA, mean (SD) | 13.33 (4.63) | 12.14 (3.13) | 28.7 (1.34) | <0.001b |
| UPDRS III, mean (SD) | 26.86 (13.19) | 2.36 (4.89) | / | <0.001c |
| CDR, mean (SD) | 1.16 (0.43) | 1.17(0.46) | / | 0.948c |
| Cognitive fluctuation, n (%) | 61.9% | 7.1% | / | 0.004a |
| RBD, n (%) | 80.9% | 21.4% | / | 0.002a |
| VH, n (%) | 71.4% | 21.4% | / | 0.011a |
DLB, dementia with Lewy bodies; AD, Alzheimer’s disease; HC, healthy controls F, female; M, male; MOCA, Montreal Cognitive Assessment; CDR, Clinical Dementia Rating; UPDRS, Unified Parkinson’s Disease Rating Scale; RBD, REM sleep behavior disorder; VH, visual hallucinations; SD, standard deviation. p value obtained bya Pearson chi-squared test; bone-way ANOVA test; cStudent’s t test for unpaired data.
In DLB patients, the clinical evaluation showed that the median UPDRS-III score was 23 (IQR 14–37); 19 patients presented parkinsonism (90.48%); 13 showed FC (61.90%); 16 presented VH (76.19%); and 18 had RBD (85.71%).
Serum levels of cytokines
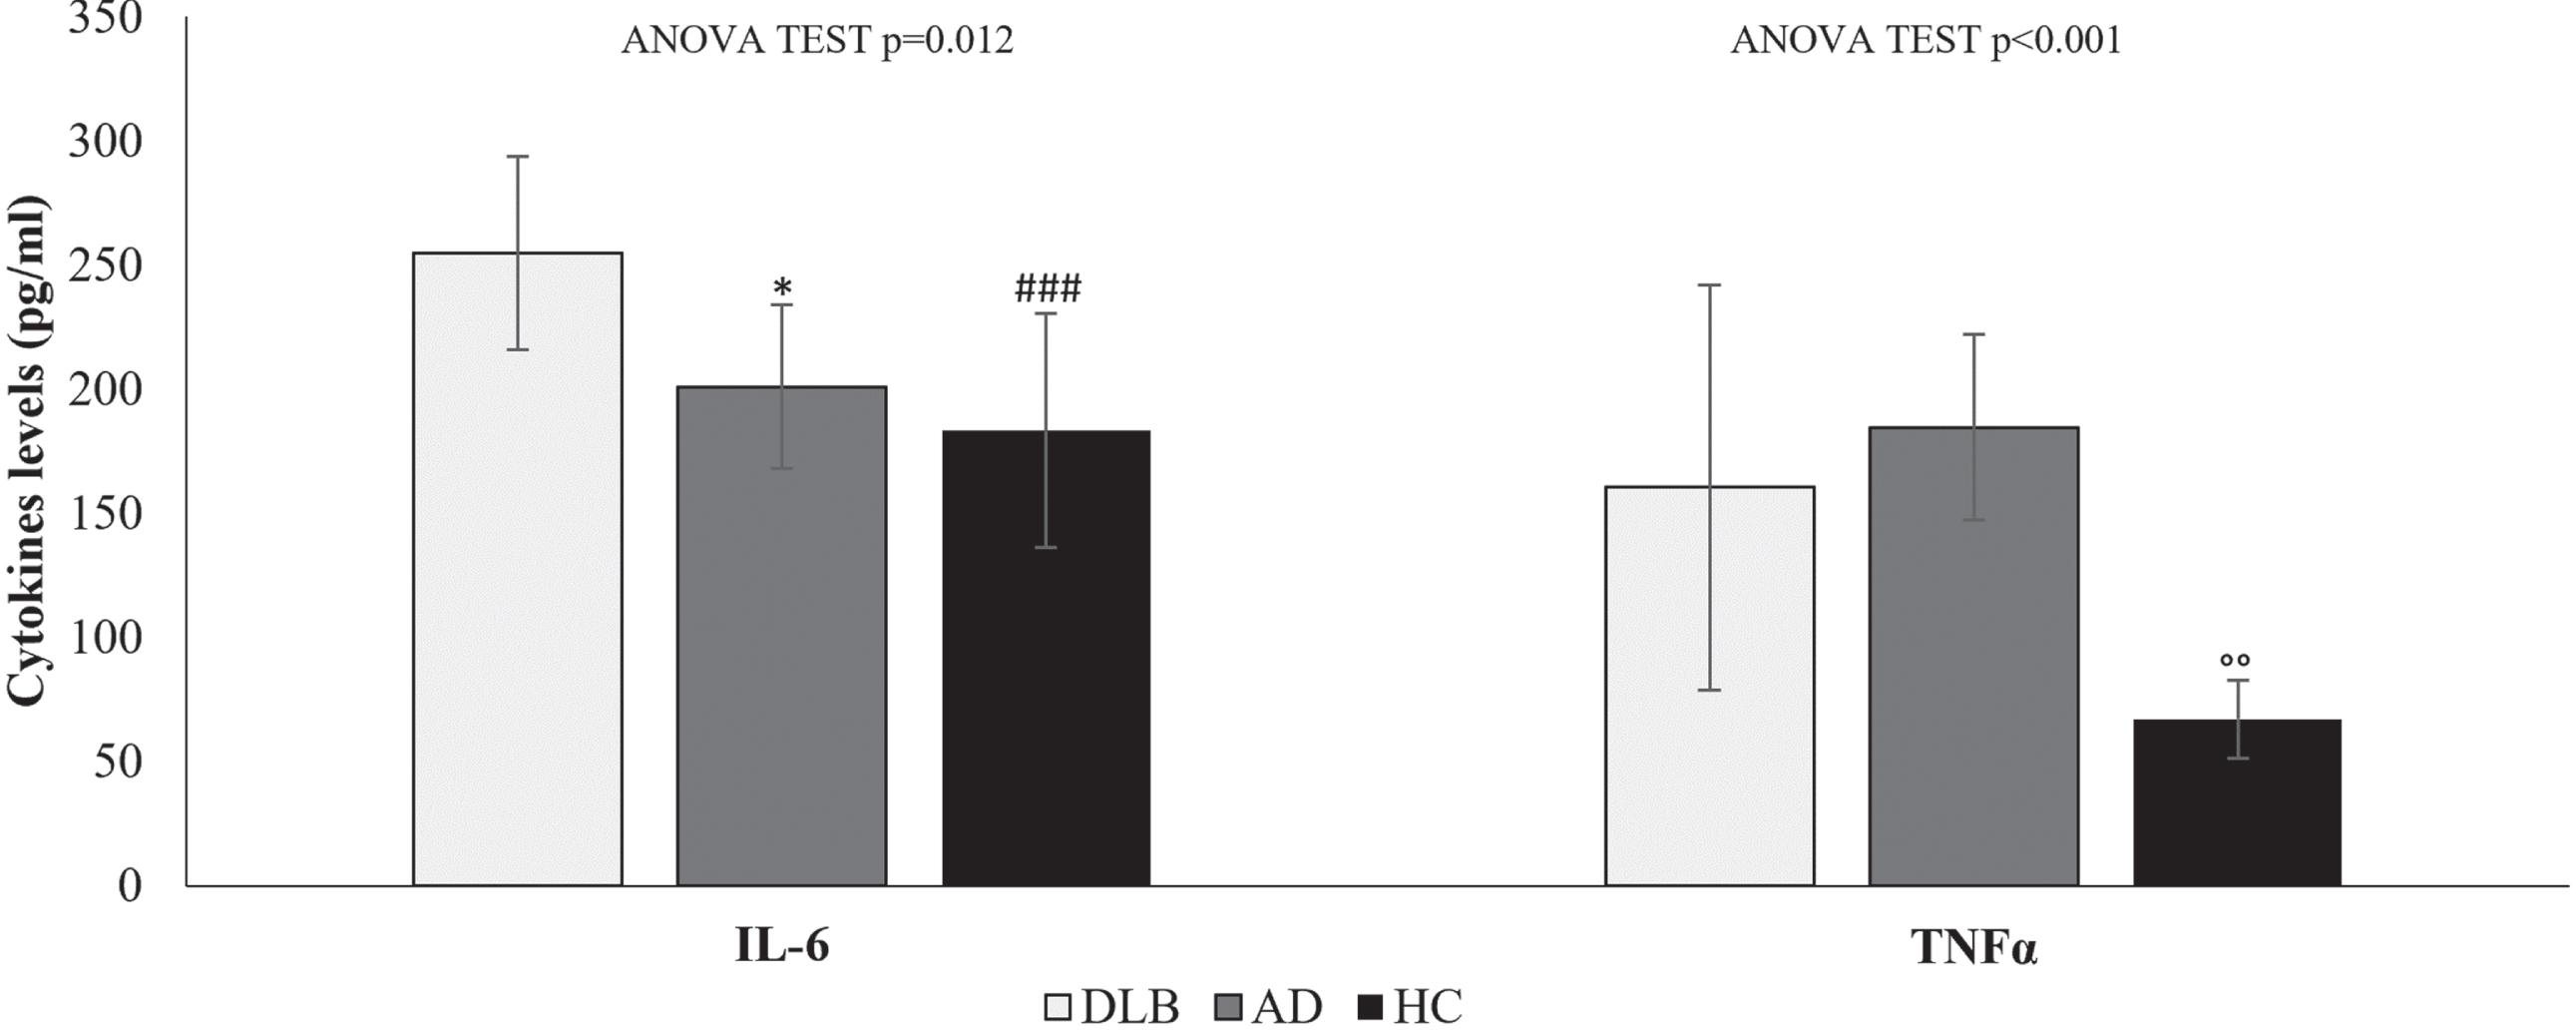
Serum levels of IL-6 and TNFα evaluated in DLB and AD patients were significantly different from those in HCs (one-way ANOVA test p = 0.012 and p < 0.001, respectively). As reported in Fig. 1, significantly higher levels of IL-6 were detected in DLB patients than in AD patients (mean difference = 34.1 pg/ml; p = 0.049) and in HCs (mean difference = 50.5 pg/ml; p = 0.006). Furthermore, differences were detected for TNFα with significant variation in AD serum compared to HC (mean difference = 24.2 pg/ml; p = 0.018). Overall, in all groups, IL-6 levels were higher than TNFα. Since serum IL-6 and TNFα levels represent the sum of all sources and are affected by the rate of clearance, it is uncertain whether these different levels were due to variable gene regulation profiles and flexible secretion by immune cells, non-immune cells, or both or to the rate of clearance.
Fig. 1
Cytokine levels in the serum of HC, AD and DLB patients. Data are expressed as the mean and standard deviation of biological data. Statistical differences calculated by post hoc Tukey test for IL-6: *p < 0.05 DLB versus AD; # # #p < 0.001 DLB versus HC. Statistical differences for TNFα ∘∘p < 0.01 AD versus HC.
Cytokine production from PBMCs
In attempting to identify the source of elevated serum cytokine levels, we isolated PBMCs from each subject and analyzed the levels of cytokines released before and after in vitro culture stimulation with LPS. To better underline the differences in IL-6 and TNFα release, Fig. 2 shows the ratio referring to the PBMC supernatant levels in the presence of LPS and in the absence of LPS.
Fig. 2
IL-6 and TNFα release ratio of cytokine levels in the supernatant of PBMCs from DLB, AD, and HC samples cultured in the presence or absence of 10μg/mL LPS. Data are expressed as the mean and standard deviation. Statistical differences calculated by posthoc Tukey test for IL-6: ***p < 0.001 DLB versus AD; # # #p < 0.001 DLB versus HC. Statistical differences for TNFα ∘∘p < 0.01 AD versus HC.
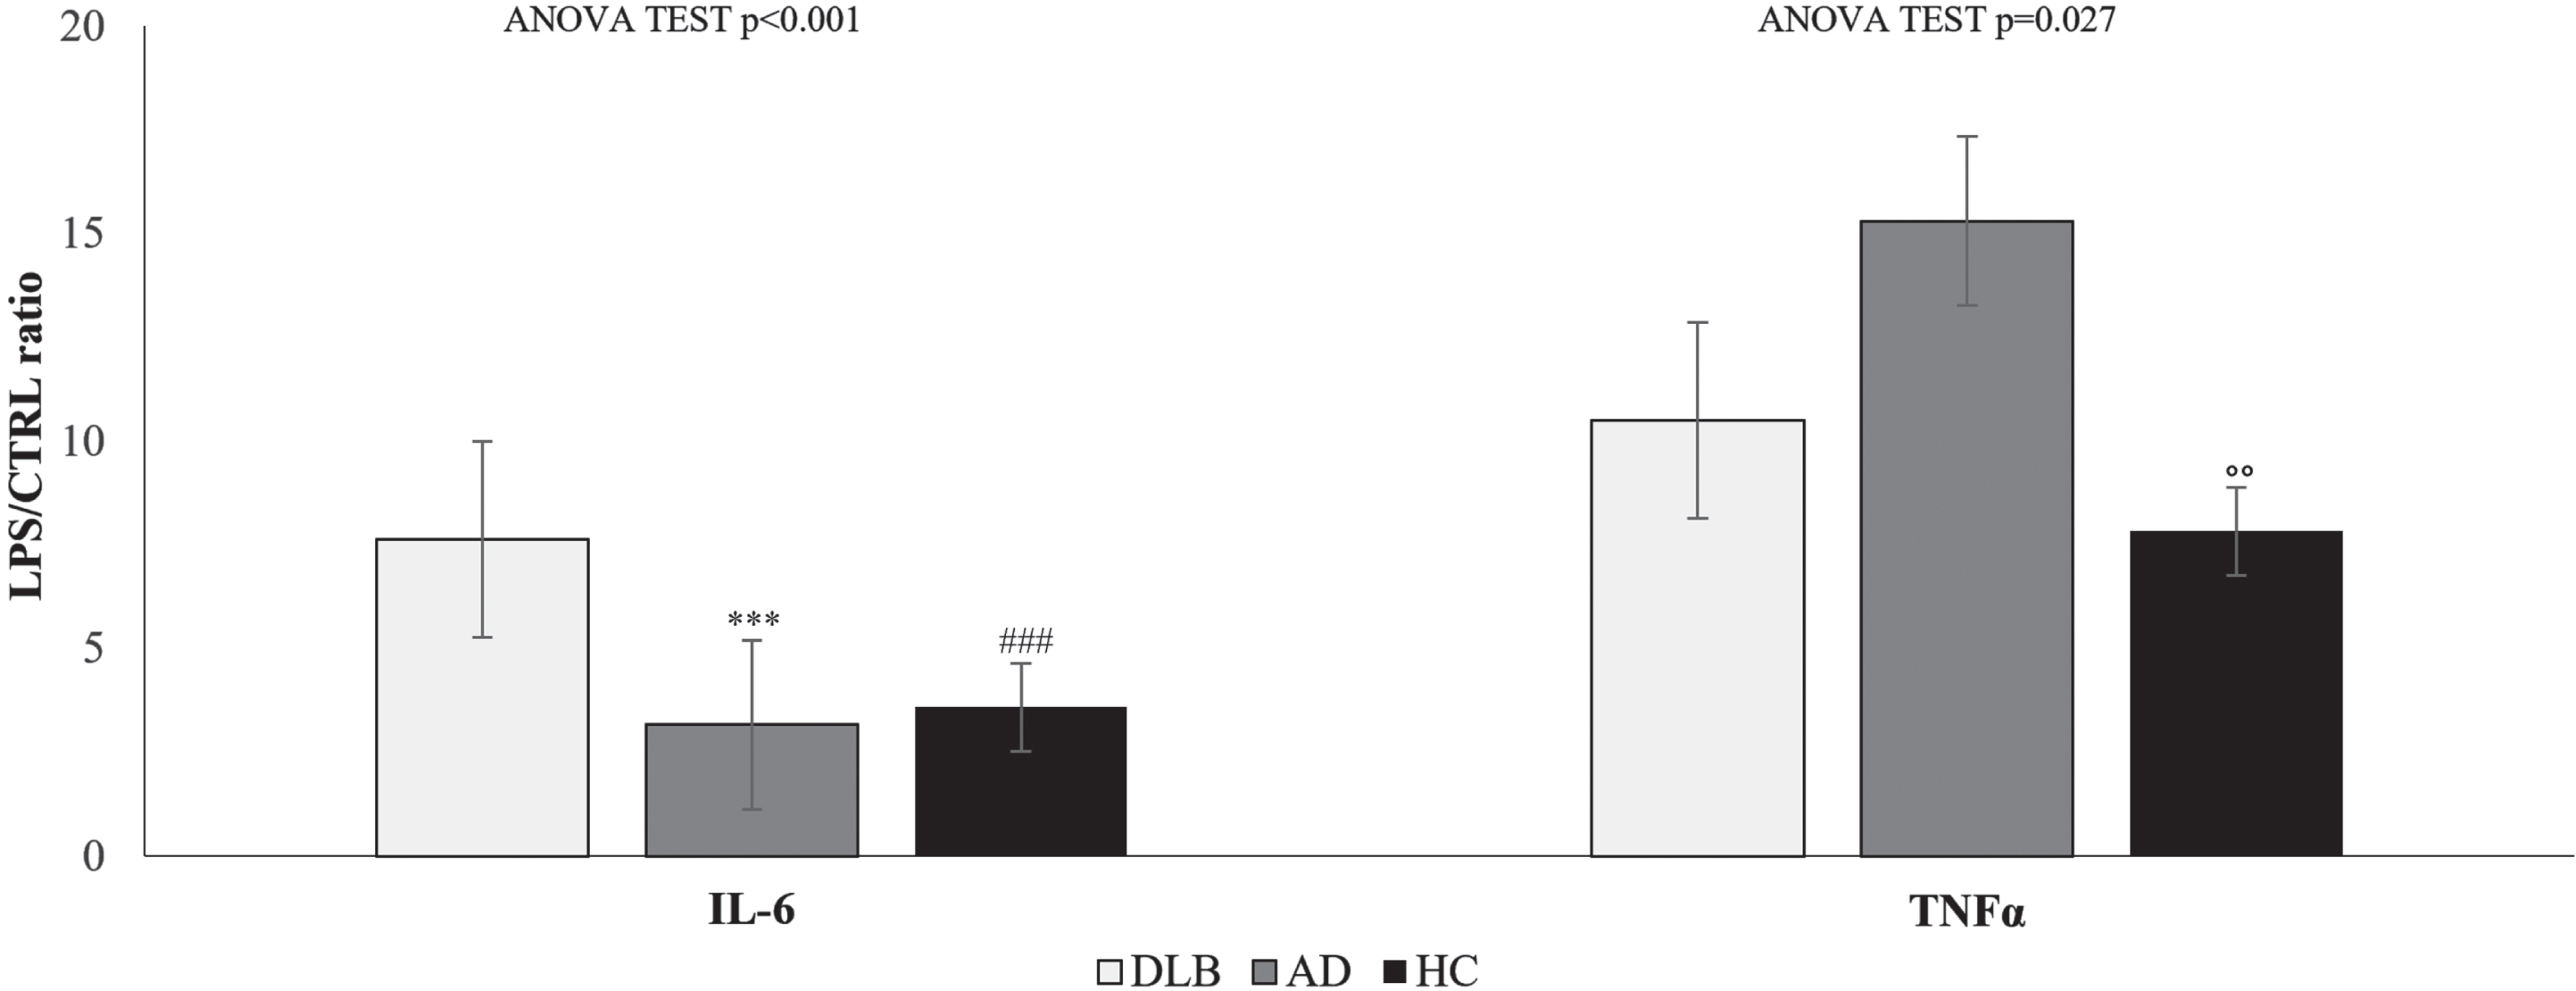
Significant differences in TNFα and IL-6 release ratio were observed between DLB, AD, and HC (one-way ANOVA test p < 0.001 and p = 0.027, respectively).
The mean TNFα release ratio was 10.5 (±5.3) for DLB, 15.3 (±9.3) for AD and 7.8 (±1.2) for HC, while for IL-6, the mean rase ratio was 7.6 (±2.4) for DLB, 3.2 (±2.9) for AD and 3.6 (±1.1) for HC. Differences were found between AD and HC for TNFα release ratio (mean difference = 7.5; p = 0.010) and between DLB and AD (mean difference = 4.5; p < 0.001) and HC (mean difference = 4.0; p < 0.001).
The IL-6 levels depend on the balance between IL-6 production and elimination, and the main elimination pathway may be receptor-mediated. Thus, the spontaneous (CTRL) and LPS-induced levels of soluble IL-6 receptor (sIL-6R) were also evaluated. Table 3 shows that higher levels of sIL-6R were detected in DLB and AD, in accordance with previously observed higher IL-6 levels. In all groups, the spontaneous release of sIL-6R was significantly different, while in LPS-stimulated cells, no differences were observed between AD and DLB, which both showed LPS-stimulated sIL-6R release higher than that in HC (Table 3).
Table 3
Levels of sIL-6R in spontaneous and LPS-treated PBMCs
| DLB | AD | HC | One-Way | Mean difference (Tukey post hoc p) | |||
| ANOVA p | DLB versus AD | DLB versus HC | AD versus HC | ||||
| sIL-6R CTRL | 569.0 (±80.1) | 506.9 (±70.4) | 401.1 (±54.2) | 0.001 | 62.0 (0.044) | 168.0 (0.001) | 106.0 (0.003) |
| sIL-6R LPS | 542.4 (±136.6) | 491.4 (±154.6) | 156.4 (±17.3) | 0.001 | 51.5 (0.479) | 387.0 (0.001) | 335.0 (0.001) |
Data are expressed as the mean and standard deviation (SD).
To evaluate the relationship between sIL-6R and IL-6, we calculated the sIL-6R/IL-6 ratio. The data reported in Table 4 underline significant differences in spontaneous DLB versus AD and HC and in LPS-stimulated PBMCs of DLB and AD versus HC. The data convey that sIL-6R has a potential role in the regulation of both local and systemic IL-6-mediated events.
Table 4
RATIO of sIL-6R and IL-6 in spontaneous and LPS-treated PBMCs
| DLB | AD | HC | One-Way | Mean difference (Tukey post hoc p) | |||
| ANOVA p | DLB versus AD | DLB versus HC | AD versus HC | ||||
| sIL-6R/IL6 RATIO CTRL | 33.8 (±6.1) | 12.3 (±8.5) | 8.8 (±1.2) | 0.001 | 21.5 (0.001) | 25.0 (0.001) | 3.5 (0.388) |
| sIL-6R/IL6 RATIO LPS | 4.5 (±1.3) | 4.8 (±3.6) | 1.0 (±0.3) | 0.001 | –0.3 (0.920) | 3.4 (0.001) | 3.7 (0.001) |
Data are expressed as the mean and standard deviation (SD).
IL-6 and TNFα promoter methylation status
Pyrosequencing, performed to investigate the methylation status of TNFα and IL-6 in DLB, AD, and HC, showed an alteration in the methylation pattern for all CpG sites involved. Raw methylation % data for both DLB and AD patients were stratified in two groups compared to the mean methylation % of analyzed controls, which provided the threshold values for each patient group, prior to the statistical analysis to decrease the tendentially high standard deviation observed between the target samples. Pyrograms of selected DLB and AD patients, as well as corresponding controls (HC), are depicted in Supplementary Figure 1.
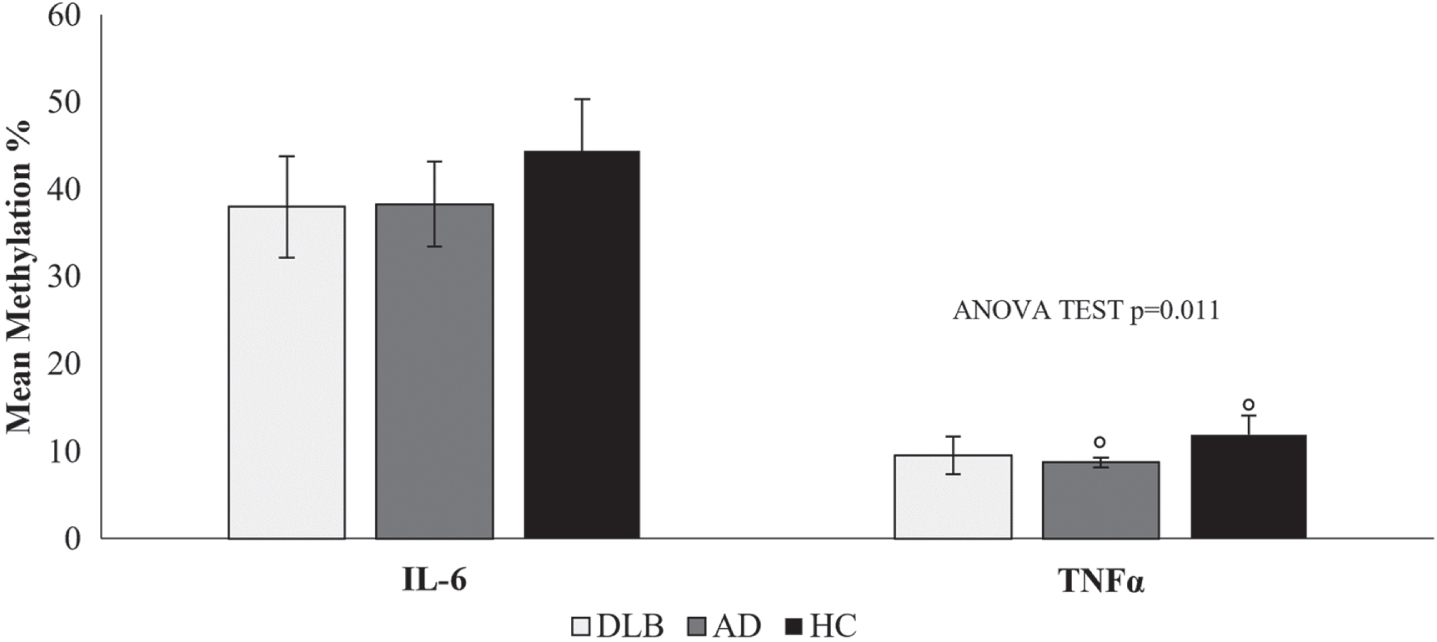
Specifically, hypomethylation was detected for IL-6 in 17 DLB (38.0%) and 6 AD (38.3%) patients compared to the mean methylation percentage of corresponding controls (44.4%). Regarding TNFα, 12 DLB (9.5%) and 5 AD patients (8.7%) exhibited hypomethylation of the studied CpG islands at the promoter level when confronted with the HC group (11.9%), with significant differences (p < 0.05) (Fig. 3).
Fig. 3
Mean methylation percentage of the IL-6 and TNFα gene promoters in blood samples of DLB and AD patients compared to HC. Statistical significance was calculated by post hoc Tukey’s test for multiple comparisons at °p < 0.05.
Gene methylation was measured at 2 CpGs for IL-6 and at 4 CpGs for TNFα (Table 5), indicating the diverse contribution of the different sites of methylation to cytokine production levels.
Table 5
IL-6 and TNFα DNA methylation levels in DLB, AD and HC samples
| Variable | DLB | AD | HC | One-way | Mean difference (Tukey post hoc p) | ||
| ANOVA p | DLB versus AD | DLB versus HC | AD versus HC | ||||
| IL-6 | |||||||
| CpG1(%) | 39.3 (±6.4) | 42.1 (±3.5) | 45.9 (±4.3) | 0.038 | –2.7 (0.509) | –6.5 (0.035) | –3.7 (0.424) |
| CpG2(%) | 36.6 (±5.9) | 34.5 (±7.5) | 42.9 (±8.2) | 0.170 | 2.1(0.777) | –6.3 (0.121) | –8.4 (0.074) |
| TNFα | |||||||
| CpG1(%) | 4.3 (±0.9) | 3.6 (±1.3) | 6.1 (±2.4) | 0.158 | 0.7 (0.706) | –1.8 (0.056) | –2.6 (0.042) |
| CpG2(%) | 7.4 (±1.6) | 6.9 (±1.5) | 10.0 (±2.3) | 0.063 | 0.6 (0.846) | –2.6 (0.021) | –3.2 (0.032) |
| CpG3(%) | 10.2 (±2.4) | 8.8 (±1.3) | 12.2 (±2.5) | 0.041 | 1.5 (0.527) | –2.0 (0.193) | –3.4 (0.067) |
| CpG5(%) | 16.3 (±5.0) | 15.7 (±1.7) | 19.3 (±2.3) | 0.041 | 0.6 (0.962) | –3.0 (0.273) | –3.6 (0.335) |
Data are expressed as the mean methylation percentage and standard deviation (SD). Mean differences were evaluated by post hoc Tukey’s test.
Although no significant differences were observed in the mean methylation levels for IL-6, Table 5 shows that the methylation level at CpG1 of IL-6 was significantly lower in DLB patients than in HCs (p = 0.035), while no significant differences were observed for CpG2 methylation. TNFα CpG site methylation was significantly lower in DLB and AD samples than in HC samples.
Indeed, correlation analysis shows that IL-6 CpG1 methylation is significantly correlated with sIL-6R levels (sIL-6R rho: –0.551, p = 0.022) in spontaneous PBMCs from DLB patients. While not significant negative correlations were also observed in spontaneous and LPS-stimulated PBMCs of DLB patients, for IL-6 levels and sIL-6R CpG1-2 and IL-6 CpG1-2.
Moreover, the methylation of CpG sites for TNFα also reported an association with TNFα production.
In detail, positive correlation in spontaneous PBMCs from DLB patients (CpG2 versus TNFα rho: 0.024, p = 0.94; CpG3 versus TNFα rho: 0.108, p = 0.73; CpG4 versus TNFα rho: 0.235, p = 0.46) were observed.
While negative correlation in LPS-stimulated PBMCs from DLB patients were detected for CpG1 versus TNFα rho: –0.642, p = 0.025; CpG2 versus TNFα rho: –0.378, p = 0.225; CpG3 versus TNFα rho: –0.734, p = 0.007; CpG4 versus TNFα rho: –0.605, p = 0.037.
No significant correlations were observed for IL-6 and TNFα CpG sites in the AD and HC groups. Thus, we observed that the IL-6 and TNFα production levels is differently correlate to the levels of methylation for IL-6 and TNFα CpG sites only in DLB patients. A major role of methylation was observed in the regulation of TNFα production.
DISCUSSION
Our results show that higher levels of proinflammatory cytokines, such as TNFα and IL-6, are observed in individuals with AD and DLB than in HCs. As suggested by several studies [42–44], neuroinflammation is characterized by altered production of circulating inflammatory cytokines from chronically stimulated innate and adaptive immune cells. We hypothesized that serum levels of TNFα and IL-6 would correlate with DNA methylation levels in blood leukocytes. To investigate this, we examined the methylation patterns of IL-6 and TNFα at the promoter level in peripheral blood cells from DLB, AD and HC samples and the ability of PBMCs to release IL-6 and TNFα. Hypomethylation was documented in all CpG promoters related to the TNFα and IL-6 genes. Although the subcellular mechanism that mediates the relationship between circulating cytokines and leukocyte function has not been fully elucidated, a possible mechanism capable of modulating this relationship is the epigenetic regulation of gene expression through DNA methylation. To date, no studies examining the effects of circulating cytokines on DNA methylation patterns, and vice-versa, have been conducted in peripheral blood cells of DLB and AD patients. Thus, these findings could support the existence of an underlying epigenetic mechanism in terms of DNA methylation, considering the previously detected upregulation of the expression of these genes.
Methylation is an alternative mechanism regulating cytokine production, and previous studies have shown that TNFα and IL-6 expression is associated with the hypomethylation of their gene promoters [45–48]. Hypomethylation of the gene promoter of TNFα was reported in the substantia nigra of PD patients, possibly contributing to an alteration of the inflammatory phenotype of microglia and the subsequent development of the disease [27, 49]. Lower methylation levels of TNFα at the promoter level, potentially associated with neurodegeneration, were also detected in cortex samples of AD patients compared to controls [50].
Regarding interleukins, IL-6 is modulated by DNA methylation in different chronic and degenerative diseases. Therefore, hypomethylation of this interleukin was evidenced in the cortex of late-onset AD patients compared to controls, indicating that neuroinflammation could be linked and mediated by epigenetic modifications [51]. Lower methylation levels of interleukins at the promoter region were also associated with triggering neuronal damage and neuroinflammation in PD models and could be considered as possible influencing factors in DLB [52].
In our study, we investigated whether IL-6 and TNFα methylation in a peripheral cell are associated with AD and DLB. We found that individuals with DLB had a significantly lower methylation at TNFα CpG2 site and IL-6 CpG1 compared to HC, while individual with AD had a significantly lower methylation at TNFα CpG1 and 2 site, with respect to HC. Epigenetic differences, especially the level of TNFα methylation can suggest a worsened risk of DLB and AD disease with the low methylation level of TNFα promoter. Our data underlining that methylation of distinct CpG sites in IL-6 and TNFα may contribute differently to the control of the expression and production of these cytokines. Increased production of cytokines was documented in the brains of individuals with AD and DLB [53, 54]. Previous evidence has shown that proinflammatory cytokines, such as IL-6 and TNFα, may contribute to the overproduction of pathogenic amyloid-β proteins or the spreading of α-synuclein aggregation in these patients [53, 54]. Few studies have assessed inflammation in patients with DLB, analyzing levels of IL-6 in CSF or plasma with controversial results [21, 55–57]. The cytokine IL-6 was found to be significantly altered in the hippocampus of PD and DLB brains, mediating BBB disruption through the activation of the JAK-STAT signaling pathway. Recently, plasma levels of IL-6 were correlated with cognitive performance and volumes of the hypothalamus and hippocampus in AD patients. Neutralization of IL-6 in the brains of AD mouse models improved memory deficits and reduced circulating IL-6 levels, supporting the key role of IL-6 in the correlation between brain/peripheral inflammation, neurodegeneration, and cognitive performance [58].
IL-6 is a pleiotropic cytokine able to orchestrate both pro- and anti-inflammatory processes. Binding of IL-6 to membrane-bound IL-6R induces anti-inflammatory classic signaling, whereas binding of IL-6 to sIL-6R induces trans-signaling regulating pro-inflammatory reactions. Thus, the ratio of IL-6 and sIL-6R was important for the evaluation of inflammatory signaling activation. Currently, the serum levels of sIL-6R penetrating the BBB or whether sIL-6R concentrations in the brain and periphery are correlated are not known. Elevated sIL-6R levels have been observed in our DLB and AD patients, suggesting that its production is involved in the disease response. Hence, sIL-6R has the capability to modulate both local and systemic IL-6-mediated events and together play an important role in neurodegenerative clinical conditions.
However, the central overexpression of IL-6 leads to an upregulation of TNFα and microglial cell activation [59]. TNFα can be produced by different cells, mainly T and myeloid cells. In response to LPS, the rapid production of TNFα protein is dependent on transcriptional effects, regulation of message splicing or turnover, and regulation of translation [60]. In addition to IL-6, TNFα primarily mediates the acute phase of the inflammatory response and is a mediator of neuroinflammation leading to neurodegeneration [61, 62]. Indeed, TNFα plays an important role in the modification of the nigrostriatal pathway and promotes apoptosis of dopaminergic neurons [63].
Considering our previous study showing that the expression of TNFα was significantly higher in AD than in DLB and that the expression of IL-6, although not statistically significant, was higher in the PBMCs of DLB patients [30], in the present study, we confirmed that peripheral inflammation occurs differently in DLB and AD patients. The serum IL-6 concentration was higher in DLB, whereas AD patients showed higher serum TNFα concentrations. The different release of both IL-6 and TNFα in response to LPS from PBMCs supports the hypothesis that PBMCs may serve as an easily collectible biological tool to test inflammatory markers, which could help in the differential diagnosis of dementia and possibly for progression disease monitoring [64].
The limitations of our study are mainly related to the sample size. Significant associations between peripheral inflammation and specific clinical features have not been evaluated. This is a preliminary study, and although the results of this study must be viewed with caution, our observations are encouraging and may lay the groundwork for more suitably powered studies. Further longitudinal analyses are needed to evaluate peripheral inflammation in dementia from prodromal to advanced stages.
Conclusions
In conclusion, this preliminary study demonstrated alterations in serum levels of IL-6 and TNFα, as well as promoter hypomethylation in PBMCs, in patients affected by AD and DLB. Our results could support the hypothesis of a strict interconnection between the brain and peripheral inflammation and suggest the potential existence of an epigenetic mechanism involved in the production of proinflammatory cytokines related to neurodegeneration. This study could increase the insight into biological pathways leading to the onset of dementia, supporting the use of PBMC analysis as a peripheral and noninvasive diagnostic marker. Of note, in the future, the inhibition of inflammatory cytokines could be considered an innovative and potential therapeutic strategy to reduce the risk of neurodegenerative diseases.
AUTHOR CONTRIBUTIONS
Erica Costantini (Conceptualization; Methodology; Writing – original draft); Claudia Carrarini (acquisition of the clinical data); Dario Calisi (acquisition of the biological sample and clinical data); Matteo De Rosa (acquisition of the biological sample and clinical data); Marianna Simone (acquisition of the biological sample); Adolfo Di Crosta (acquisition of the clinical data); Rocco Palumbo (acquisition of the clinical data); Alessia Cipollone (acquisition of the clinical data); Lisa Aielli (Methodology); Maria De Laurentis (acquisition of the clinical data); Lucilla Colarusso (acquisition of the clinical data); Andrea Pilotto (acquisition of the clinical data); Alessandro Padovani (Writing – review & editing); Fani Konstantinidou (Methodology); Valentina Gatta (Methodology; Supervision; Writing – review & editing); Liborio Stuppia (Writing – review & editing); Francesco Cipollone (Writing – review & editing; acquisition of the clinical data); Marta Di Nicola (Data curation; Formal analysis; Writing – original draft); Marcella Reale (Conceptualization; Data curation; Investigation; Methodology; Writing – original draft); Laura Bonanni (Conceptualization; Supervision; Writing – original draft).
ACKNOWLEDGMENTS
The authors have no acknowledgments to report.
FUNDING
This work was supported by Italian Ministry of Health. Ricerca Finalizzata RF-2018-12366209.
CONFLICT OF INTEREST
The authors have no conflict of interest to report.
DATA AVAILABILITY
Anonymized dataset analyses in this study are available from the corresponding author upon reasonable request.
SUPPLEMENTARY MATERIAL
[1] The supplementary material is available in the electronic version of this article:https://dx.doi.org/10.3233/JAD-231471.
REFERENCES
[1] | Skaper SD , Facci L , Zusso M , Giusti P ((2018) ) An inflammation-centric view of neurological disease: Beyond the neuron. Front Cell Neurosci 12: , 72. |
[2] | Blatteis CM ((2000) ) The afferent signalling of fever. J Physiol 526: , 470–470. |
[3] | Süβ P , Lana AJ , Schlachetzki JC ((2021) ) Chronic peripheral inflammation: A possible contributor to neurodegenerative diseases. Neural Regen Res 16: , 1711. |
[4] | García-Domínguez I , Veselá K , García-Revilla J , Carrillo-Jiménez A , Roca-Ceballos MA , Santiago M , de Pablos RM , Venero JL ((2018) ) Peripheral inflammation enhances microglia response and nigral dopaminergic cell death in an MPTP model of Parkinson’s disease. Front Cell Neurosci 12: , 398. |
[5] | Dionisio-Santos DA , Olschowka JA , O’Banion MK ((2019) ) Exploiting microglial and peripheral immune cell crosstalk to treat Alzheimer’s disease. J Neuroinflammation 16: , 74. |
[6] | Holmes C , Cunningham C , Zotova E , Woolford J , Dean C , Kerr Su , Culliford D , Perry V ((2009) ) Systemic inflammation and disease progression in Alzheimer disease. Neurology 73: , 768–774. |
[7] | Glass CK , Saijo K , Winner B , Marchetto MC , Gage FH ((2010) ) Mechanisms underlying inflammation in neurodegeneration. Cell 140: , 918–934. |
[8] | Matejuk A , Vandenbark AA , Offner H ((2021) ) Cross-talk of the CNS with immune cells and functions in health and disease. Front Neurol 12: , 672455. |
[9] | Ransohoff RM , Schafer D , Vincent A , Blachere NE , Bar-Or A ((2015) ) Neuroinflammation: Ways in which the immune system affects the brain. Neurotherapeutics 12: , 896–909. |
[10] | Williams GP , Schonhoff AM , Sette A , Lindestam Arlehamn CS ((2022) ) Central and peripheral inflammation: Connecting the immune responses of Parkinson’s disease. J Parkinsons Dis 12: (s1), S129–S136. |
[11] | Holmes C , Cunningham C , Zotova E , Culliford D , Perry V ((2011) ) Proinflammatory cytokines, sickness behavior, and Alzheimer disease. Neurology 77: , 212–218. |
[12] | Sala G , Galimberti G , Canevari C , Raggi ME , Isella V , Facheris M , Appollonio I , Ferrarese C ((2003) ) Peripheral cytokine release in Alzheimer patients: Correlation with disease severity. Neurobiol Aging 24: , 909–914. |
[13] | Sun Y-X , Minthon L , Wallmark A , Warkentin S , Blennow K , Janciauskiene S ((2003) ) Inflammatory markers in matched plasma and cerebrospinal fluid from patients with Alzheimer’s disease. Dement Geriatr Cogn Disord 16: , 136–144. |
[14] | Blennow K , Hampel H , Weiner M , Zetterberg H ((2010) ) Cerebrospinal fluid and plasma biomarkers in Alzheimer disease. Nat Rev Neurol 6: , 131–144. |
[15] | Choi C , Jeong J-H , Jang JS , Choi K , Lee J , Kwon J , Choi K-G , Lee J-S , Kang SW ((2008) ) Multiplex analysis of cytokines in the serum and cerebrospinal fluid of patients with Alzheimer’s disease by color-coded bead technology. J Clin Neurol 4: , 84–88. |
[16] | Williams-Gray CH , Wijeyekoon R , Yarnall AJ , Lawson RA , Breen DP , Evans JR , Cummins GA , Duncan GW , Khoo TK , Burn DJ ((2016) ) Serum immune markers and disease progression in an incident Parkinson’s disease cohort (ICICLE-PD). Mov Disord 31: , 995–1003. |
[17] | Qin X-Y , Zhang S-P , Cao C , Loh YP , Cheng Y ((2016) ) Aberrations in peripheral inflammatory cytokine levels in Parkinson disease: A systematic review and meta-analysis. JAMA Neurol 73: , 1316–1324. |
[18] | King E , Thomas A ((2017) ) Systemic inflammation in Lewy body diseases. Alzheimer Dis Assoc Disord 31: , 346–356. |
[19] | Wennström M , Hall S , Nägga K , Londos E , Minthon L , Hansson O ((2015) ) Cerebrospinal fluid levels of IL-6 are decreased and correlate with cognitive status in DLB patients. Alzheimers Res Ther 7: , 63. |
[20] | Clough Z , Jeyapaul P , Zotova E , Holmes C ((2015) ) Proinflammatory cytokines and the clinical features of dementia with Lewy bodies. Alzheimer Dis Assoc Disord 29: , 97–99. |
[21] | King E , O’Brien JT , Donaghy P , Morris C , Barnett N , Olsen K , Martin-Ruiz C , Taylor J-P , Thomas AJ ((2018) ) Peripheral inflammation in prodromal Alzheimer’s and Lewy body dementias. J Neurol Neurosurg Psychiatry 89: , 339–345. |
[22] | Batista CRA , Gomes GF , Candelario-Jalil E , Fiebich BL , de Oliveira ACP ((2019) ) Lipopolysaccharide-induced neuroinflammation as a bridge to understand neurodegeneration. Int J Mol Sci 20: , 2293. |
[23] | Suzuki MM , Bird A ((2008) ) DNA methylation landscapes: Provocative insights from epigenomics. Nat Rev Genet 9: , 465–476. |
[24] | Rasmi Y , Shokati A , Hassan A , Aziz SG-G , Bastani S , Jalali L , Moradi F , Alipour S ((2022) ) The role of DNA methylation in progression of neurological disorders and neurodegenerative diseases as well as the prospect of using DNA methylation inhibitors as therapeutic agents for such disorders. IBRO Neurosci Rep 14: , 28–37. |
[25] | Nasamran CA , Sachan ANS , Mott J , Kuras YI , Scherzer CR , Study HB , Ricciardelli E , Jepsen K , Edland SD , Fisch KM ((2021) ) Differential blood DNA methylation across Lewy body dementias. Alzheimers Dement 13: , e12156. |
[26] | Vasanthakumar A , Davis JW , Idler K , Waring JF , Asque E , Riley-Gillis B , Grosskurth S , Srivastava G , Kim S , Nho K ((2020) ) Harnessing peripheral DNA methylation differences in the Alzheimer’s Disease Neuroimaging Initiative (ADNI) to reveal novel biomarkers of disease. Clin Epigenetics 12: , 84. |
[27] | Rasheed M , Liang J , Wang C , Deng Y , Chen Z ((2021) ) Epigenetic regulation of neuroinflammation in Parkinson’s disease. Int J Mol Sci 22: , 4956. |
[28] | Si Z-Z , Zou C-J , Mei X , Li X-F , Luo H , Shen Y , Hu J , Li X-X , Wu L , Liu Y ((2023) ) Targeting neuroinflammation in Alzheimer’s disease: From mechanisms to clinical applications. Neural Regen Res 18: , 708. |
[29] | Reale M , Costantini E ((2021) ) Cholinergic modulation of the immune system in neuroinflammatory diseases. Diseases 9: , 29. |
[30] | Costantini E , Carrarini C , Borrelli P , De Rosa M , Calisi D , Consoli S , D’Ardes D , Cipollone F , Di Nicola M , Onofrj M ((2023) ) Different peripheral expression patterns of the nicotinic acetylcholine receptor in dementia with Lewy bodies and Alzheimer’s disease. Immun Ageing 20: , 3. |
[31] | Halliday G , Lewis S , Aarsland D , Attems J , Ballard CG , Boeve BF , Dickson D ((2017) ) Diagnosis and management of dementia with Lewy bodies. Neurology 89: , 88–100. |
[32] | McKhann GM , Knopman DS , Chertkow H , Hyman BT , Jack CRJr , Kawas CH , Klunk WE , Koroshetz WJ , Manly JJ , Mayeux R ((2011) ) The diagnosis of dementia due to Alzheimer’s disease: Recommendations from the National Institute on Aging-Alzheimer’s Association workgroups on diagnostic guidelines for Alzheimer’s disease. Alzheimers Dement 7: , 263–269. |
[33] | McKeith IG , Boeve BF , Dickson DW , Halliday G , Taylor JP , Weintraub D , Aarsland D , Galvin J , Attems J , Ballard CG , Bayston A , Beach TG , Blanc F , Bohnen N , Bonanni L , Bras J , Brundin P , Burn D , Chen-Plotkin A , Duda JE , El-Agnaf O , Feldman H , Ferman TJ , Ffytche D , Fujishiro H , Galasko D , Goldman JG , Gomperts SN , Graff-Radford NR , Honig LS , Iranzo A , Kantarci K , Kaufer D , Kukull W , Lee VMY , Leverenz JB , Lewis S , Lippa C , Lunde A , Masellis M , Masliah E , McLean P , Mollenhauer B , Montine TJ , Moreno E , Mori E , Murray M , O’Brien JT , Orimo S , Postuma RB , Ramaswamy S , Ross OA , Salmon DP , Singleton A , Taylor A , Thomas A , Tiraboschi P , Toledo JB , Trojanowski JQ , Tsuang D , Walker Z , Yamada M , Kosaka K. Diagnosis and management of dementia with Lewy bodies: Fourth consensus report of the DLB Consortium ((2017) ) Diagnosis and management of dementia with Lewy bodies: Fourth consensus report of the DLB consortium. Neurology 89: , 88–100. |
[34] | Sorbi S , Hort J , Erkinjuntti T , Fladby T , Gainotti G , Gurvit H , Nacmias B , Pasquier F , Popescu BO , Rektorova I , Religa D , Rusina R , Rossor M , Schmidt R , Stefanova E , Warren JD , Scheltens P ;EFNS Scientist Panel on Dementia and Cognitive Neurology ((2012) ) EFNS-ENS guidelines on the diagnosis and management of disorders associated with dementia. Eur J Neurol 19: 1159–1179. |
[35] | Bonanni L , Thomas A , Tiraboschi P , Perfetti B , Varanese S , Onofrj M. ((2008) ) EEG comparisons in early Alzheimer’s disease, dementia with Lewy bodies and Parkinson’s disease with dementia patients with a 2-year follow-up. Brain 131(Pt 3): , 690–705. |
[36] | Nasreddine ZS , Phillips NA , Bédirian V , Charbonneau S , Whitehead V , Collin I , Cummings JL , Chertkow H ((2005) ) The Montreal Cognitive Assessment, MoCA: A brief screening tool for mild cognitive impairment. J Am Geriatr Soc 53: , 695–699. |
[37] | Morris JC ((1993) ) The Clinical Dementia Rating (CDR): Current version and scoring rules. Neurology 43: 2412–2414. |
[38] | Walker M , Ayre G , Cummings J , Wesnes K , McKeith I , O’brien J , Ballard C ((2000) ) The clinician assessment of fluctuation and the one day fluctuation assessment scale: Two methods to assess fluctuating confusion in dementia. Br J Psychiatry 177: , 252–256. |
[39] | Boeve BF , Molano JR , Ferman TJ , Lin S-C , Bieniek K , Tippmann-Peikert M , Boot B , St. Louis EK , Knopman DS , Petersen RC ((2013) ) Validation of the Mayo Sleep Questionnaire to screen for REM sleep behavior disorder in a community-based sample. J Clin Sleep Med 9: , 475–480. |
[40] | Goetz CG , Tilley BC , Shaftman SR , Stebbins GT , Fahn S , Martinez-Martin P , Poewe W , Sampaio C , Stern MB , Dodel R ((2008) ) Movement Disorder Society-sponsored revision of the Unified Parkinson’s Disease Rating Scale (MDS-UPDRS): Scale presentation and clinimetric testing results. Mov Disord 23: , 2129–2170. |
[41] | Cummings JL , Mega M , Gray K , Rosenberg-Thompson S , Carusi DA , Gornbein J ((1994) ) The Neuropsychiatric Inventory: Comprehensive assessment of psychopathology in dementia. Neurology 44: , 2308–2308. |
[42] | Jones SA , Horiuchi S , Topley N , Yamamoto N , Fuller GM ((2001) ) The soluble interleukin 6 receptor: Mechanisms of production and implications in disease. FASEB J 15: , 43–58. |
[43] | McCoy MK , Tansey MG ((2008) ) TNF signaling inhibition in the CNS: Implications for normal brain function and neurodegenerative disease. J Neuroinflammation 5: , 45. |
[44] | Burton MD , Sparkman NL , Johnson RW ((2011) ) Inhibition of interleukin-6 trans-signaling in the brain facilitates recovery from lipopolysaccharide-induced sickness behavior. J Neuroinflammation 8: , 54. |
[45] | Hermsdorff H , Mansego M , Campión J , Milagro F , Zulet M , Martínez J ((2013) ) TNF-alpha promoter methylation in peripheral white blood cells: Relationship with circulating TNFα, truncal fat and n-6 PUFA intake in young women. Cytokine 64: , 265–271. |
[46] | Sullivan K , Reddy A , Dietzmann K , Suriano A , Kocieda V , Stewart M , Bhatia M ((2007) ) Epigenetic regulation of tumor necrosis factor alpha. Mol Cell Biol 27: , 5147–5160. |
[47] | Tang B , Zhao R , Sun Y , Zhu Y , Zhong J , Zhao G , Zhu N ((2011) ) Interleukin-6 expression was regulated by epigenetic mechanisms in response to influenza virus infection or dsRNA treatment. Mol Immunol 48: , 1001–1008. |
[48] | Poplutz MK , Wessels I , Rink L , Uciechowski P ((2014) ) Regulation of the Interleukin-6 gene expression during monocytic differentiation of HL-60 cells by chromatin remodeling and methylation. Immunobiol 219: , 619–626. |
[49] | Pieper HC , Evert BO , Kaut O , Riederer PF , Waha A , Wüllner U ((2008) ) Different methylation of the TNF-alpha promoter in cortex and substantia nigra: Implications for selective neuronal vulnerability. Neurobiol Dis 32: , 521–527. |
[50] | Kaut O , Ramirez A , Pieper H , Schmitt I , Jessen F , Wüllner U ((2014) ) DNA methylation of the TNF-α promoter region in peripheral blood monocytes and the cortex of human Alzheimer’s disease patients. Dement Geriatr Cogn Disord 38: , 10–15. |
[51] | Nicolia V , Cavallaro RA , López-González I , Maccarrone M , Scarpa S , Ferrer I , Fuso A ((2017) ) DNA methylation profiles of selected pro-inflammatory cytokines in Alzheimer disease. J Neuropathol Exp Neurol 76: , 27–31. |
[52] | Henry CJ , Huang Y , Wynne AM , Godbout JP ((2009) ) Peripheral lipopolysaccharide (LPS) challenge promotes microglial hyperactivity in aged mice that is associated with exaggerated induction of both pro-inflammatory IL-1β and anti-inflammatory IL-10 cytokines. Brain Behav Immun 23: , 309–317. |
[53] | Imamura K , Hishikawa N , Ono K , Suzuki H , Sawada M , Nagatsu T , Yoshida M , Hashizume Y ((2005) ) Cytokine production of activated microglia and decrease in neurotrophic factors of neurons in the hippocampus of Lewy body disease brains. Acta Neuropathol 109: , 141–150. |
[54] | Leng F , Edison P ((2021) ) Neuroinflammation and microglial activation in Alzheimer disease: Where do we go from here? . Nat Rev Neurol 17: , 157–172. |
[55] | Lindqvist D , Hall S , Surova Y , Nielsen HM , Janelidze S , Brundin L , Hansson O ((2013) ) Cerebrospinal fluid inflammatory markers in Parkinson’s disease–associations with depression, fatigue, and cognitive impairment. Brain Behav Immun 33: , 183–189. |
[56] | Pedersen CC , Ushakova A , Skogseth RE , Alves G , Tysnes O-B , Aarsland D , Lange J , Maple-Grødem J ((2023) ) Inflammatory biomarkers in newly diagnosed patients with Parkinson disease and related neurodegenerative disorders. Neurol Neuroimmunol Neuroinflamm 10: , e200132. |
[57] | Amin J , Boche D , Clough Z , Teeling J , Williams A , Gao Y , Chudley L , Lau L , Smith F , Harris S ((2020) ) Peripheral immunophenotype in dementia with Lewy bodies and Alzheimer’s disease: An observational clinical study. J Neurol Neurosurg Psychiatry 91: , 1219–1226. |
[58] | Lyra e Silva NM , Gonçalves RA , Pascoal TA , Lima-Filho RA , Resende Ed PF , Vieira EL , Teixeira AL , de Souza LC , Peny JA , Fortuna JT ((2021) ) Pro-inflammatory interleukin-6 signaling links cognitive impairments and peripheral metabolic alterations in Alzheimer’s disease. Transl Psychiatry 11: , 251. |
[59] | Gyengesi E , Rangel A , Ullah F , Liang H , Niedermayer G , Asgarov R , Venigalla M , Gunawardena D , Karl T , Münch G ((2019) ) Chronic microglial activation in the GFAP-IL6 mouse contributes to age-dependent cerebellar volume loss and impairment in motor function. Front Neurosci 13: , 303. |
[60] | Dumitru CD , Ceci JD , Tsatsanis C , Kontoyiannis D , Stamatakis K , Lin J-H , Patriotis C , Jenkins NA , Copeland NG , Kollias G ((2000) ) TNF-α induction by LPS is regulated posttranscriptionally via a Tpl2/ERK-dependent pathway. Cell 103: , 1071–1083. |
[61] | Kwon HS , Koh S-H ((2020) ) Neuroinflammation in neurodegenerative disorders: The roles of microglia and astrocytes. Transl Neurodegener 9: , 42. |
[62] | Jayaram S , Krishnamurthy PT ((2021) ) Role of microgliosis, oxidative stress and associated neuroinflammation in the pathogenesis of Parkinson’s disease: The therapeutic role of Nrf2 activators. Neurochem Int 145: , 105014. |
[63] | Amin R , Quispe C , Docea AO , Ydyrys A , Kulbayeva M , Daştan SD , Calina D , Sharifi-Rad J ((2022) ) The role of tumour necrosis factor in neuroinflammation associated with Parkinson’s disease and targeted therapies. Neurochem Int 158: , 105376. |
[64] | Arosio B , D’Addario C , Gussago C , Casati M , Tedone E , Ferri E , Nicolini P , Rossi PD , Maccarrone M , Mari D ((2014) ) Peripheral blood mononuclear cells as a laboratory to study dementia in the elderly. Biomed Res Int 2014: , 169203. |

