
Utility of Machine Learning Approach with Neuropsychological Tests in Predicting Functional Impairment of Alzheimer’s Disease
Abstract
Background:
In assessing the levels of clinical impairment in dementia, a summary index of neuropsychological batteries has been widely used in describing the overall functional status.
Objective:
It remains unexamined how complex patterns of the test performances can be utilized to have specific predictive meaning when the machine learning approach is applied.
Methods:
In this study, the neuropsychological battery (CERAD-K) and assessment of functioning level (Clinical Dementia Rating scale and Instrumental Activities of Daily Living) were administered to 2,642 older adults with no impairment (n = 285), mild cognitive impairment (n = 1,057), and Alzheimer’s disease (n = 1,300). Predictive accuracy on functional impairment level with the linear models of the single total score or multiple subtest scores (Model 1, 2) and support vector regression with low or high complexity (Model 3, 4) were compared across different sample sizes.
Results:
The linear models (Model 1, 2) showed superior performance with relatively smaller sample size, while nonlinear models with low and high complexity (Model 3, 4) showed an improved accuracy with a larger dataset. Unlike linear models, the nonlinear models showed a gradual increase in the predictive accuracy with a larger sample size (n > 500), especially when the model training is allowed to exploit complex patterns of the dataset.
Conclusion:
Our finding suggests that nonlinear models can predict levels of functional impairment with a sufficient dataset. The summary index of the neuropsychological battery can be augmented for specific purposes, especially in estimating the functional status of dementia.
INTRODUCTION
Neuropsychological tests provide useful information in assessing current and future functional abilities in dementia [1, 2]. Accurate assessment of daily functional abilities is crucial in depicting the clinical significance of dementia and distinguishing Alzheimer’s disease (AD) from mild cognitive impairment (MCI) [3]. As biomarkers of dementia became widely available, the ecological validity and real-world utility are becoming more highlighted in the practice of neuropsychological assessment [4, 5]. Although functional disturbances or a loss of independence are defined as a critical boundary in distinguishing the significance of cognitive impairment, a formal model in how multiple neurocognitive functions buttress normal daily functioning has not been clear [6–8]. Due to a weak foundation of formal tools for assessing functional ability, clinical characterization of AD requires further improvement [9].
Levels of functional impairment in dementia generally correspond with overall cognitive test performances. The neuropsychological battery consists of multiple scores of subtests and the scores. The battery typically provides a summary index by summing the individual scores into a composite of the total score. This approach has been widely used in representing one’s global cognitive function, specifically in the neuropsychological battery for dementia assessment [10, 11]. The total scores as a global cognitive function have shown utility in assessing multiple clinical signatures of dementia, including early detection, prognostic trajectory, daily functional disturbances, differential diagnosis, and neurodegeneration [12–16]. Though the diagnosis of dementia can be made based on a deficit in a single cognitive domain, a combination of multiple test scores may provide a more reliable estimate of a cognitive construct than any single measure in characterizing cognitive impairment [17–19].
Despite the utility of the total scores of neuropsychological batteries, a single summary may overly simplify complex features of the test elements. The summarized score typically sums the “no-hold” tests sensitive to the brain pathological changes. However, the construction of a summary score is mostly confirmed based on theoretical analysis rather than an empirical comparison of the multiple possible summary approaches. Thus, each subtest may differ in its metric properties, leading to suboptimal weighting to the total score, and summing the raw scores may fail to reflect the differential importance of each subtest score. Previous studies have shown that a set of subtests can be selectively augmented based on specific clinical purposes [20].
Another issue in the total score method is the use of linear summation. This method summarizes multiple tests by adding each score with predefined weights without additive effects (e.g., interaction effect, higher-order effect). Based on this linear modeling approach, the decrease in a specific subtest will lead to a corresponding change in the total score as a function of the given weight. However, in the levels of clinician’s intuition, the neuropsychological test performances may not always be linearly informative in explaining the real-world impairment [21]. The complex nature of cognitive impairment implies that the nonlinear combination of multiple cognitive tests characterizes a meaningful clinical state. While some tests are interpreted as clinically significant with the presence of a complete task failure, other tests indicate clinical risk with subtle variabilities within the normal range [22]. In some cases, subtests signal cognitive impairment of dementia only when combined with a deficit in other domains [23, 24]. These qualitative patterns that clinicians often read from the neuropsychological test profile may not be fully summarized with the current method of total scoring, and a more fine-tuned summary with profound complexity needs to be developed.
With the goal of personalized medicine, the machine learning approach has prompted the development of clinical and behavioral models with higher complexity [25, 26]. One of the fundamental concepts in machine learning is finding an optimal balance between flexibility and robustness in predicting the target of interest. Machine learning algorithms effectively stretch a model into higher complexity and generate various models that explain a given dataset. In addition, the cross-validating procedure effectively rules out the overfitted models by highlighting the predictability in a novel dataset.
Especially the machine learning approach can explore how complex a model should be in predicting a meaningful dementia outcome and the prerequisites for achieving such predictive performance. If the predictability of the nonlinear model outperforms standard linear summation models, for example, there may be additional higher-order nonlinearity and interaction effects that a high dimensional model can capture but a standard linear model does not [27]. Machine learning, however, may not always provide enhanced utility in the prediction of dementia and there are only few studies that explicitly compared the effect of model complexity [28]. Complex models based on machine learning performed better than classical linear models in some clinical cases [29, 30], whereas several studies showed that using models with higher complexity and nonlinearity did not improve the predictive accuracy in classifying cognitive impairment of dementia [31, 32]. Moreover, most previous studies have focused on whether or not the machine learning algorithms successfully predict the target outcome, rather than evaluating the extent to which high dimensional models show a better predictive performance than classical linear models [33]. Few studies have directly compared how specific algorithms performed better and what it implies with the predictive attributes of behavioral instruments. The lack of rationale for the choice of algorithms may hinder the meaningful discussions of using the machine learning approach in the practice of AD assessment.
Another constraint in utilizing the machine learning approach is the necessity of the large-scale dataset. The advantage of machine learning algorithms generally depends on the sample size. The datasets used for predictive modeling should be sufficiently large for an algorithm to build a model that exploits complex characteristics of clinical outcomes [34, 35]. Thus, machine learning approaches should suggest a rationale for sample size needed in exceeding the performance of the classical statistical model, rather than merely identifying the presence of predictability. This issue has been thoroughly dealt with by the predictive performance across varying sample sizes when constructing complex machine learning models. The predictive power tends to show improvement as the sample size increases, and endpoint saturation of this maximum accuracy reflects the potential utility in using nonlinear models of machine learning. This procedure explores how many data points should be acquired in constructing the most predictive model. In the examples of image classification, using nonlinear models (i.e., kernel support vector machine or neural network) more benefited from the large-scale dataset than linear models (i.e., linear support vector machine, logistic regression) [34]. Machine learning in the clinical assessment of dementia can also benefit from large-scale data [36], but the empirical evidence of the extent to which the larger sample size benefits in utilizing the neuropsychological test remains unknown.
This study will examine how the multiple scores of the neuropsychological battery can be enhanced in predicting the clinical outcome of dementia based on the nonlinear modeling of the large-scale dataset. Clinical rating of functional impairment and survey score of daily activities were used as a clinical outcome of interest that cognitive test attempts to predict. The single total score and multiple subtest scores of the test battery were used as the main predictors. We utilized a support vector machine, a classic algorithm widely used to predict neurological and psychiatric disorders [37, 38]. The predictive utility of the linear and nonlinear model was compared across different sample sizes.
METHODS
Participants
Older adults with or without cognitive impairment were retrospectively recruited from SMG-SNU Boramae Medical Center for Dementia from January 2012 to December 2020. The participants underwent both neuropsychological assessment and structured clinical interview. This study was conducted under the Declaration of Helsinki, and the protocol was approved by the Institutional Review Board of SMG-SNU Boramae Medical Center (IRB No.10-2020-295). The current study included older adults without cognitive impairment (age-associated cognitive decline) or with mild cognitive impairment (MCI) or Alzheimer’s disease (AD) dementia. The clinical diagnosis of the probable or possible AD and MCI was based on the National Institute of Neurological and Communicative Disorders and Stroke and AD and Related Disorders Association (NINCDS-ADRDA) and the core clinical criteria of MCI [39, 40]. Subjects suspected or diagnosed with dementia types other than AD were not included in the analysis, including vascular dementia, Lewy body dementia, frontotemporal lobe dementia, and vascular dementia. In addition, those identified or suspected with significant neurological or psychiatric conditions including stroke, traumatic brain injury, meningioma, hemorrhage, normal pressure hydrocephalus, delirium, intellectual disabilities, psychotic disorders, and mood disorders were also excluded. We confined our predictive analysis within the dementia staging of ‘moderate’ impairment (Clinical Dementia Rating (CDR) sum of box score≤15.5), considering the disproportionate sample size and feasibility of the neuropsychological test [41]. Finally, a total of 2,642 older adults who met the screening criterion were analyzed (Table 1).
Table 1
Descriptive characteristics of the participants
| Mean (SD) / Frequency (proportion) | |
| Age | 75.82 (8.02) |
| Sex (M: F) | 958: 1684 |
| Education (years) | 7.75 (5.08) |
| Diagnosis | |
| Alzheimer’s disease dementia | 1,057 (40.0%) |
| Mild cognitive impairment | 1,300 (49.2%) |
| No cognitive impairment | 285 (10.7%) |
Neuropsychological test
All participants received the Korean version of the Consortium to Establish a Registry for Alzheimer’s Disease neuropsychological battery (CERAD-K) [42]. The battery measures multiple domains of cognitive function and facilitates the diagnosis of MCI and dementia. The battery contains the following subtests as constituents of total score: Verbal fluency (the number of correct animal words; four blocks of 15 s interval), Boston Naming Test, Word List Recall (immediate, delayed), Word List Recognition (subtraction of the number of false positives from the number of true positives), and Constructional Praxis (copy). The CERAD-K total score was calculated as the sum of the raw scores subdomains as previously described [43].
The additional tests that are not summed in the total score of CERAD-K include Trail Making Test A/B (TMT-A and B) and Construction Recall. The TMT measured the total time spent to complete the tasks. The test administration had set the maximum time limit at 360 s (TMT-A) and 300 s (TMT-B) based on administration instruction in CERAD-K [44]. The score was interpolated as the maximum time limit (360 s or 300 s) in the cases when the TMT was aborted or not feasible due to the following reasons: exceeded the time limit, unable to understand the rule, or committed more than five errors.
The primary analysis compared the predictability of a single total score and nine multiple subtests that sum the total score. The additional analysis examined whether the inclusion of three subtests not summed in the total score of CERAD-K (TMT-A/B and Construction Recall) increases predictability.
Functional assessment
The CDR is a semi-structured interview developed to provide a global summary of dementia severity. The CDR is useful for staging and tracking the course of AD progression [45–47]. The global score of CDR describes the presence or extent of overall cognitive impairment. In addition, the score of CDR–sum of boxes (CDR–SOB) is calculated by summing impairment in six domains of daily cognitive categories (memory, orientation, judgment, community affairs, home and hobbies, personal care) [48]. The CDR-SOB provides a more fine-grained measure of functional disturbances (normal: 0, questionable impairment: 0.5–2.5, very mild dementia: 3.0–4.0, mild dementia: 4.5–9.0, moderate dementia: 9.5–15.5) [41]. Even within the same category of a global score or clinical diagnosis, CDR-SOB differentiates the variations of functional ability across six domains of real-world functioning. The trained clinical psychologists administered the structured interview and the ratings. As noted in the administration standard, the decisions of CDR scoring were based on the information gathered in a structured interview rather than neuropsychological test performance.
The Lawton instrumental activities of daily living index (IADL) evaluated the ability to function independently in a list of activities [49]. The index was initially developed to sum the item differentially depending on gender (the housework and food preparation items are additionally summed in women). The current study used five items of Lawton IADL that are commonly applicable to both genders. The IADL items included whether the respondent could perform the following tasks independently or with support: phone use (1–4), buying goods (1–4), taking medicine (1–3), managing money (1–3), transportation use (1–5). The total sum score indicated the levels of functional independence ranging from 5 (fully independent) to 19 (requiring full support or complete inability). The instrument’s reliability and concurrent validity have been confirmed [50]. The IADL was primarily assessed based on the informant report, but the self-report was used only when the patients were able to visit without the accompanying caregiver. The validity of the IADL rating was reviewed by the interviewer whether the item options were misconstrued.
In the analysis, CDR-SOB and IADL were used as prediction target outcomes. Diagnosis of MCI and AD was only considered descriptive and participation selection purposes rather than a target outcome since the main predictors (neuropsychological test information) were explicitly confounded in the diagnostic information. Even in the mildest range of impairment, the diagnostic definition requires the maintenance of independent functioning, but subtle IADL variations have been observed in not-dementia groups [51, 52]. Thus, variations of functional CDR-SOB and IADL were examined across older adults with no impairment, questionable impairment, and very mild to moderate impairment.
Predictive modeling
The test scores of CERAD-K were used as the predictors of CDR-SOB and IADL. All measures were scaled before being introduced in the dataset split. The dataset was randomly divided into a training dataset (2/3 of the data fold) and a testing dataset (1/3 of the data fold) to evaluate the predictive accuracy in novel data. The model fitting was conducted only in the training dataset. The predictive weight estimated in the training dataset was applied in the testing dataset. The accuracy of the predictive model was assessed with the metrics of mean absolute error (MAE) and Pearson’s correlation coefficient (r) between the predicted functional score and observed actual score of CDR-SOB and IADL in the test dataset.
First, we evaluated the maximum accuracy achieved with the largest available sample size. To visualize the precision pattern, the scatter plot of a single prediction loop showed the predicted and actual score (n = 881). We iterated the same procedure ten times and averaged the accuracy metrics to minimize the random effect of disproportionate data splitting. At each iteration, the subset data were randomly sampled.
We then examined the effect of sample size used in building predictive models. To explore the optimal sample size in identifying the specific advantage of the machine learning algorithm, we iterated the same predictive analysis across the specified sample size (100, 200, . . . 2600). The rate at which prediction accuracy improves indicated the learning curve of a model.
Predictive models comparison
The four predictive modeling approaches were evaluated. The models differed in terms of the input predictor, linearity, and hyperparameters of nonlinear complexity (Table 2). In addition, the increasing rate of predictive accuracy and the maximally achieved accuracy were compared across the four models.
Table 2
Characteristics of the predictive models
| Model Training (Hyperparameters) | Predictor(s) | Linearity | Characteristic | |
| Model 1 | Simple linear regression | Total score (n = 1) | Linear | Uniformly weighted sum of subtests |
| Model 2 | Multiple linear regression | Subtest scores (n = 9) | Linear | Differentially weighted sum of subtests |
| Model 3 | Kernel support vector regression (radial basis function, C = 1, ɛ= 0.1) | Subtest scores (n = 9) | Nonlinear | Lower complexity (Low error penalty, low flexibility) |
| Model 4 | Kernel support vector regression (radial basis function, C = 100, ɛ= 0.01) | Subtest scores (n = 9) | Nonlinear | Higher complexity (High error penalty, high flexibility) |
First, the linear models were fitted by ordinary least square regression with the neuropsychological test predictor (s) (Model 1-single total score, Model 2-multiple subtest scores). The two linear models were distinguished in terms of whether the weights of subtest scores are uniformly or differentially estimated in the training dataset. In the prediction with multiple regression (Model 2), coefficients of the subtests were fitted in that best explains the target variable. Thus, the subtest scores more closely associated with the functional outcome are summed with higher weights. The regularization was not applied in the regression since the ratio of sample size-to-predictor was sufficiently large [27].
In the nonlinear regression methods, support vector regression (SVR) with radial basis function (RBF) kernel was used to fit the target variable. Typically, the support vector machine is used to find supporting vectors of a hyperplane that achieves the largest distance between the two discrete groups [53, 54]. In predicting continuous outcomes, SVR likewise works with the algorithm that finds supporting vectors of a hyperplane that best explain the target measure’s real value. Analogous to the soft margin of the largest distance, the regression line is surrounded by a tube, and the data points lying within that tube do not influence the course of a regression line. In the ɛ-sensitive SVR, the regression line surrounded by a tube is fitted under the constraint of the two hyperparameters: Cost (C) and epsilon (ɛ). Hyperparameter C weights the penalty of violating the prediction range beyond the nonlinear tube and determines the softness of the tube margin [55]. In addition, the hyperparameter ɛ optimizes how keen the nonlinear tube should be in explaining the given data [54, 56]. Thus, the SVR model with more flexible and complex features can be generated by increasing the penalty of unexplained datapoint outside the tube (higher C) and decreasing the width of the tube that finds highly curved supporting vectors (lower ɛ). We examined kernel SVR models with relatively lower complexity (Model 3-SVR low) and higher complexity (Model 4-SVR high). The SVR was conducted using the e1071 package in R [57]. The default setting of hyperparameter was applied in Model 3 as suggested in the package. The SVR hyperparameters with higher complexity were set with log scale units similar to the previous study [58]. The gamma parameter was set as a function of sample size (1 / (dimension of training data)).
Predictive weights representing the relative contribution of each subtest were evaluated with coefficients in multiple regression model (Model 2) and feature importance of support vector machine (Model 3, 4). The coefficients and feature importance across subtests were interpreted equally compared as the target measures were scaled. Feature importance was calculated with the dot product of coefficients and supporting vectors. All predictive weights were inversely presented, indicating that the higher weight is associated with a stronger contribution in predicting the functional outcome.
In the supplementary analysis, we first examined whether the predictive performance can be maximally improved when the additional subtests in CERAD-K (i.e., Construction Recall, TMT-A/B) and the demographic information (age, education, sex) are included in the models. The model performance was compared between the original models with nine subtests (formal set of CERAD-K total score), additive models with 12 predictors (TMT-A/B and Construction Recall added), and 14 predictors (demographics of age and education added). The comparison of this additive benefit was assessed in the multiple linear regression (Model 2) and nonlinear SVR with high complexity (Model 4).
In addition, we also applied predictive modeling of Model 4 (SVR-high) to the single predictor of a total score to confirm that the additive benefit of the nonlinear approach is the multiplicative effect of separate subtests rather than nonlinear scaling effects of overall performance. Lastly, we also examined whether the results are consistent when constraining the analysis within the subgroups of diagnosis or gender. Since the subgroups differ in the sample size, the subgroups with larger sample sizes are subsampled to match the other subgroups (i.e., diagnosis subgroup: n = 1,057; Gender subgroup: n = 958).
RESULTS
The stages of clinical impairment rating (CDR-SOB ranges) corresponded with the score of IADL (Table 3). The total score of CERAD-K showed the highest rank-order correlation with the CDR-SOB stages. The subtests representing the cognitive domain of episodic memory and language showed moderately high association with the CDR-SOB.
Table 3
Demographic and neuropsychological test performances across clinical severity level (CDR-SOB). Mean, standard deviation (parenthesis), rank-order correlations (rho) are noted
| Clinical Staging Category | Spearman’s Rank Correlation (rho) with CDR-SOB | ||||
| Normal / Questionable Impairment (n = 1,309) | Very mild (n = 475) | Mild (n = 665) | Moderate (n = 193) | ||
| CDR-SOB range | 0.0–2.5 | 3.0–4.0 | 4.5–9.0 | 9.5–15.0 | |
| CDR global score | 0.49 (0.08) | 0.51 (0.06) | 1.00 (0.17) | 2.01 (0.10) | 0.87 |
| Instrumental Activities of Daily Living (IADL) | 5.63 (1.17) | 7.77 (2.06) | 11.5 (2.77) | 15.8 (2.0) | 0.84 |
| Age | 72.8 (7.5) | 76.6 (7.2) | 79.6 (7.3) | 81.0 (7.1) | 0.41 |
| Education | 9.0 (4.7) | 7.1 (5.1) | 6.5 (5.1) | 5.5 (4.9) | –0.25 |
| CERAD-K Total Score | 58.9 (12.6) | 45.2 (11.6) | 36.2 (11.4) | 23.0 (10.9) | –0.70 |
| Semantic Fluency | 12.5 (4.4) | 9.7 (3.8) | 7.4 (3.5) | 4.3 (3.2) | –0.57 |
| Boston Naming | 10.7 (2.7) | 8.6 (3.1) | 7.3 (3.1) | 2.8 (5.2) | –0.52 |
| Word List Recall-Immediate | 14.7 (4.3) | 11.2 (4.1) | 8.9 (4.0) | 5.2 (3.7) | –0.59 |
| Word List Recall-Delayed | 3.9 (2.2) | 1.8 (1.8) | 1.0 (1.4) | 0.4 (0.8) | –0.62 |
| Word List Recognition | 7.7 (2.4) | 5.4 (3.0) | 3.9 (2.9) | 1.8 (2.4) | –0.59 |
| Construction-Copy | 9.4 (1.8) | 8.5 (2.1) | 7.7 (2.4) | 6.4 (2.7) | –0.39 |
| Construction-Delayed | 4.4 (3.1) | 1.9 (2.3) | 1.1 (1.7) | 0.4 (1.2) | –0.56 |
| Trail Making Test A | 90.8 (69.2) | 147 (107) | 205 (119) | 281 (112) | 0.53 |
| Trail Making Test B | 245 (77.2) | 282 (48.0) | 294 (29.6) | 298 (16.8) | 0.38 |
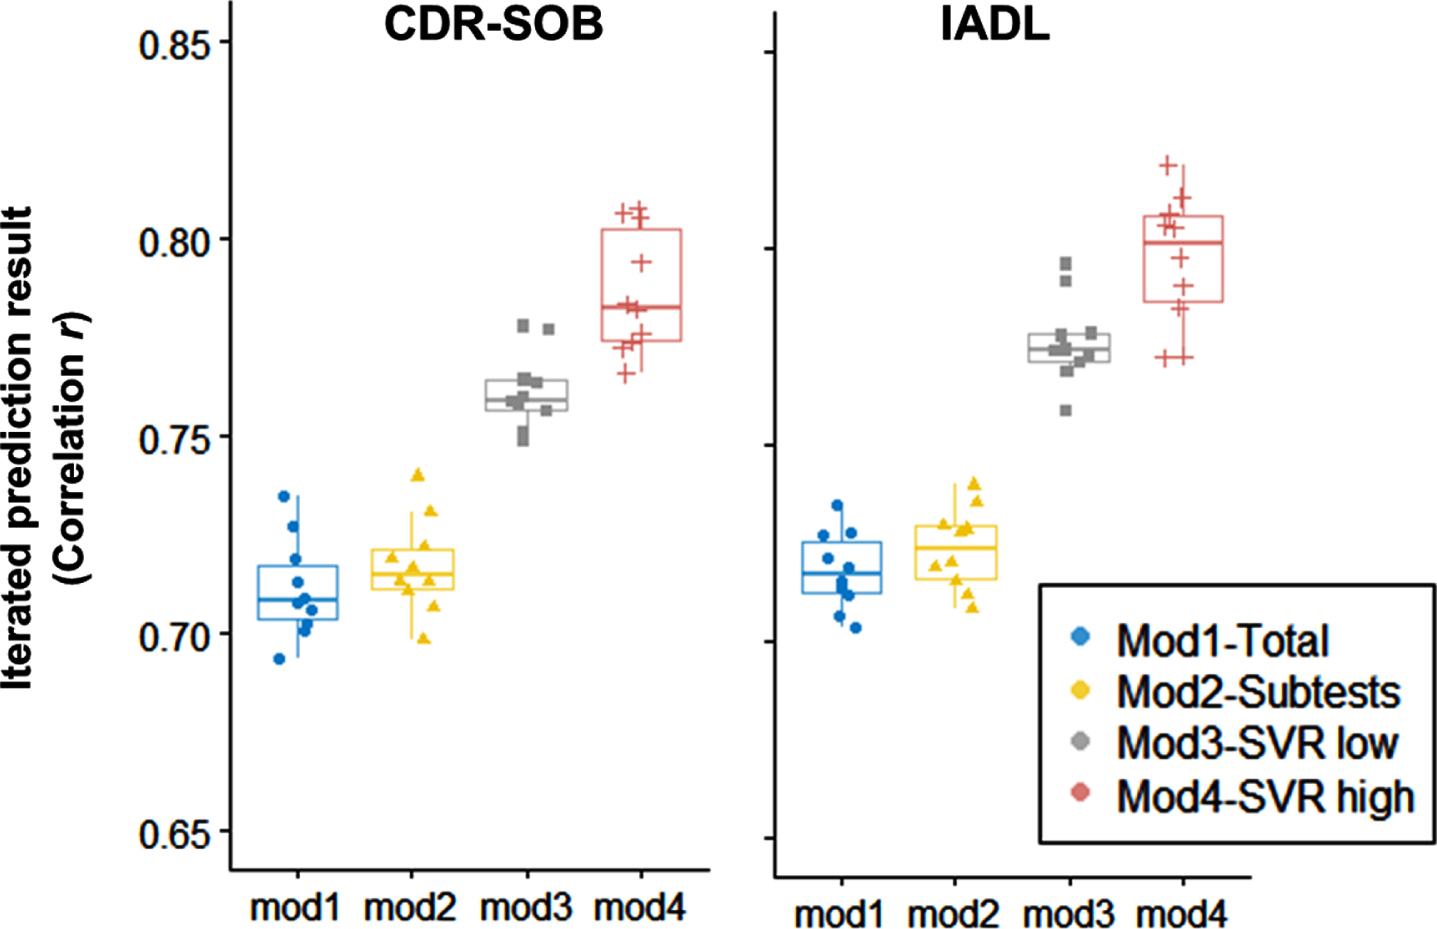
After predictive models are fitted within the training dataset (2/3 of the dataset), the predictive weights were applied in the testing dataset (1/3 of the dataset). In the testing dataset, the accuracy metrics (correlation and MAE) between the predictive score based on neuropsychological performance (NP-predicted score) and the actual measure of the functional outcome (CDR-SOB and IADL) were calculated (Fig. 1). Also, the 10-times iteration of the prediction showed stable variability (Fig. 2). In linear models (Model 2), using the multiple subtest scores added a minimal increase in the predictive correlation compared to the single total score (Model 1). On the contrary, the predictive model using nonlinear models (Model 3, 4) showed higher accuracy than the linear models.
Fig. 1
Prediction scatter plots in the testing dataset (1/3 of the total sample, n = 881). X-axis: Actual score of CDR-SOB and IADL. Y-axis: Predicted scores based on neuropsychological performance (NP-predicted) in the training dataset (2/3 of the total sample). Averages of 10-iterated predictions (correlation coefficient r) are also noted.
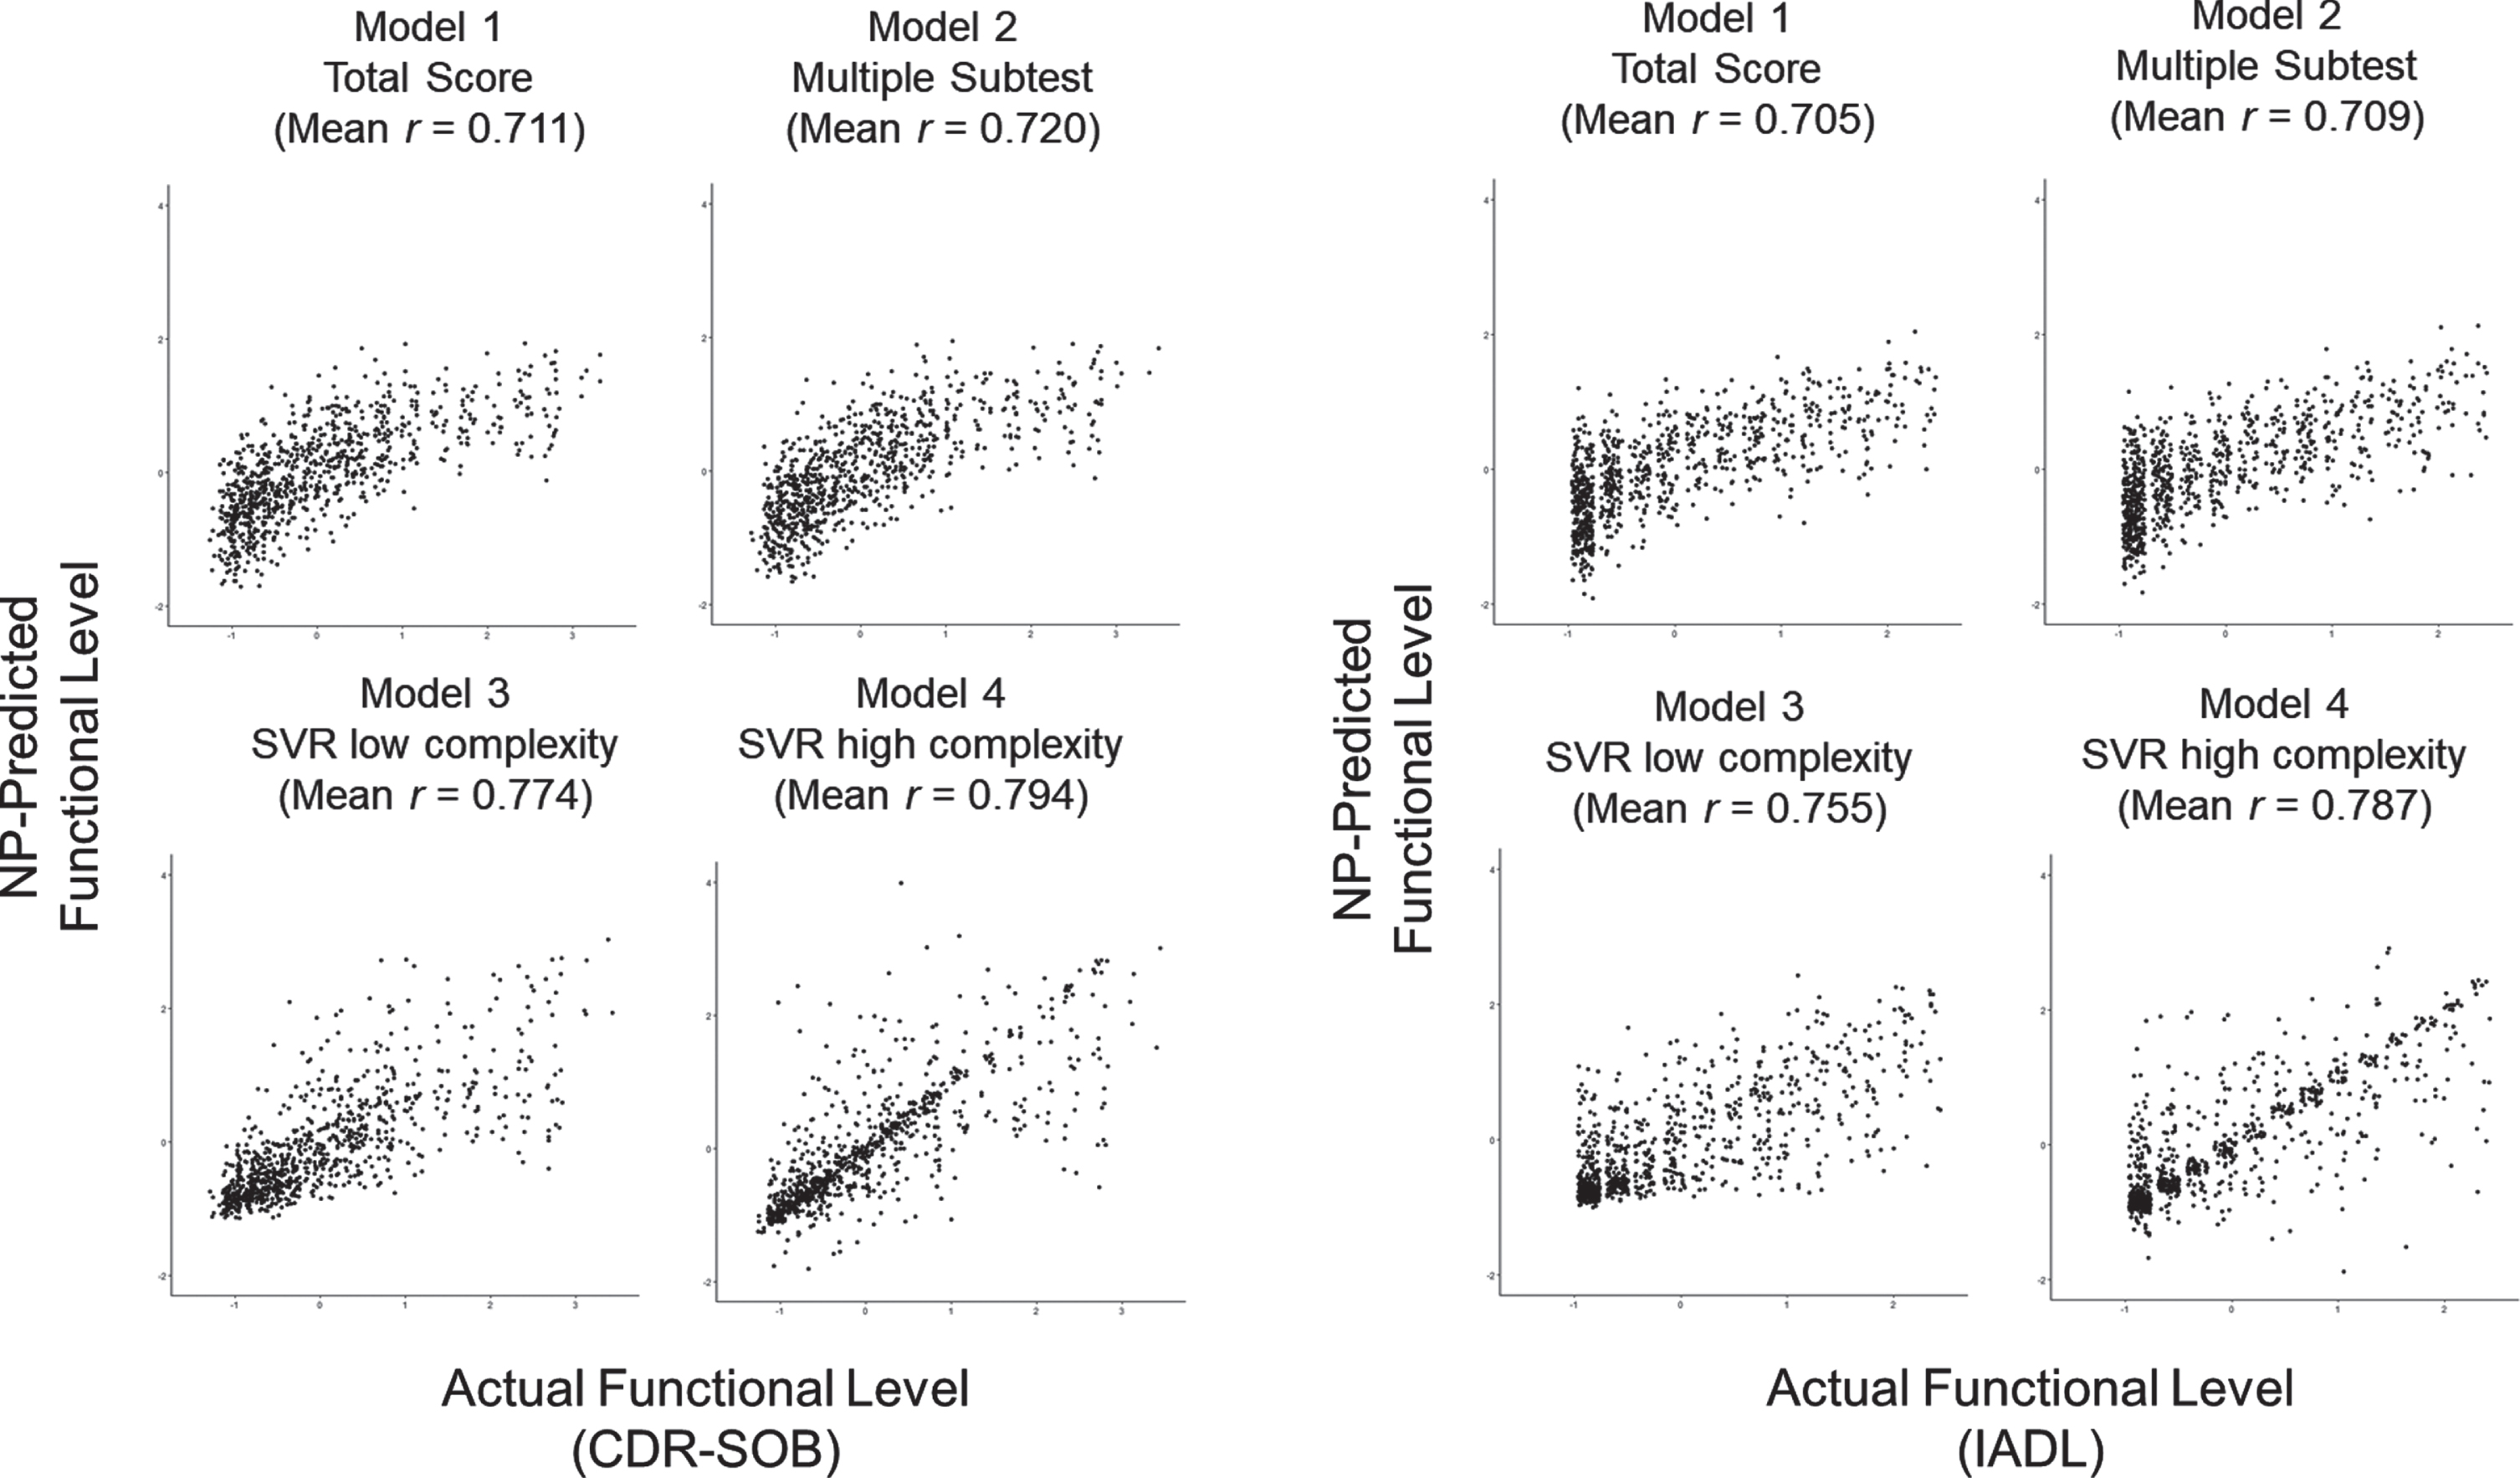
Fig. 2
Iterated prediction accuracy of the neuropsychological test in predicting CDR-SOB and IADL scores (correlation r between predicted score and actual score) (Test set size = 881, 1/3 of the total sample). Each dot indicates iterated prediction (10 times). Model 1: Simple linear regression with the single total score. Model 2: Multiple linear regression with subtests. Model 3: nonlinear support vector regression of low complexity with subtests. Model 4: nonlinear support vector regression of high complexity with subtests.
We also examined specific sample size conditions under which machine learning algorithms provide benefits in utilizing neuropsychological tests. The result showed that linear regression (Model 1, 2) showed lower predictive errors when the sample size was relatively small (n < 200). However, the linear models showed a minimal benefit of adding the sample size, and the accuracy reached the asymptotic maximum at a specific dataset size (n = 500).
Fig. 3
Sample size effects on the predictive accuracy of Clinical severity (CDR-SOB) and Instrumental daily functioning (IADL). Sample size increased from 100 to 2,600 by 100 units.
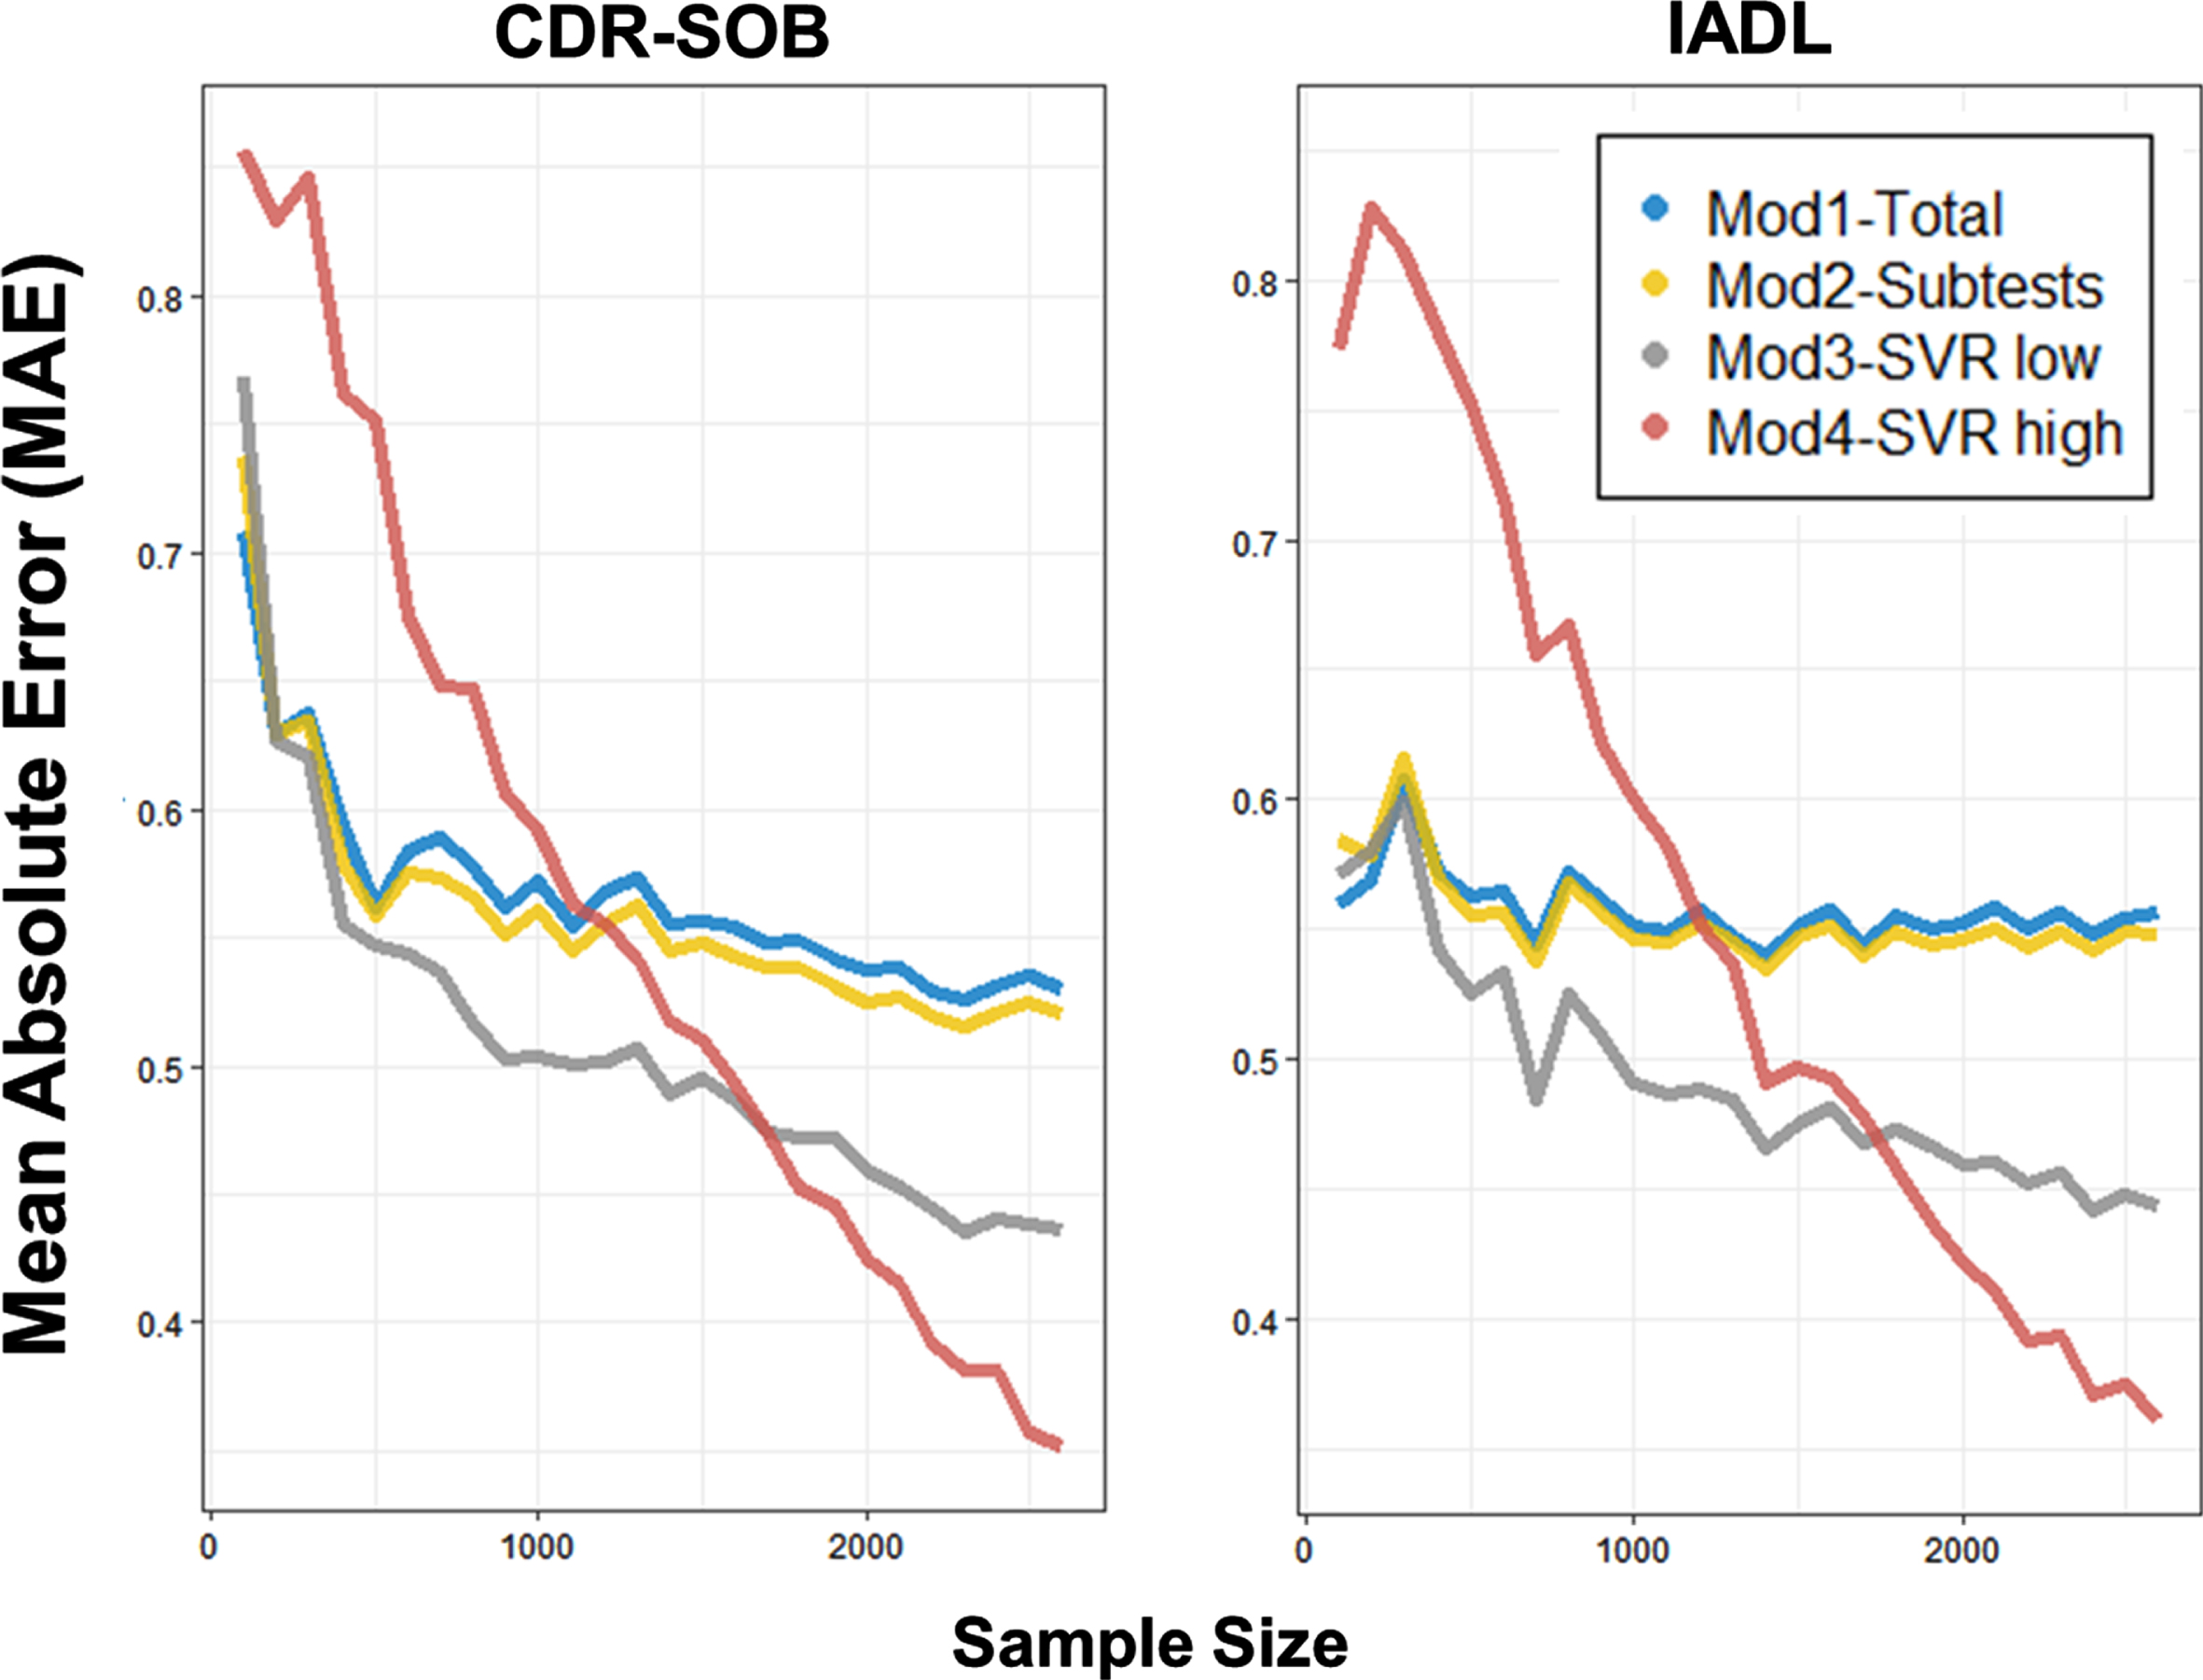
On the other hand, the nonlinear kernel SVR (Model 3, 4) gradually showed enhanced predictive accuracy as the sample size increases. Even until the largest sample size (n = 2,600), the gradual improvement in the predictive accuracy did not reach the maximum level. Moreover, the SVR model with higher complexity (Model 4) showed a steeper improvement, leading to the highest predictive performance with a more extensive sample size (n > 1500). The number of averaged supporting vectors representing the trained data points in determining the regression tube was greater in SVR with higher complexity (Model 4, CDR-SOB: 1,713, IADL: 1,706) than SVR with lower complexity (Model 3, CDR-SOB: 1,447, IADL: 1,357).
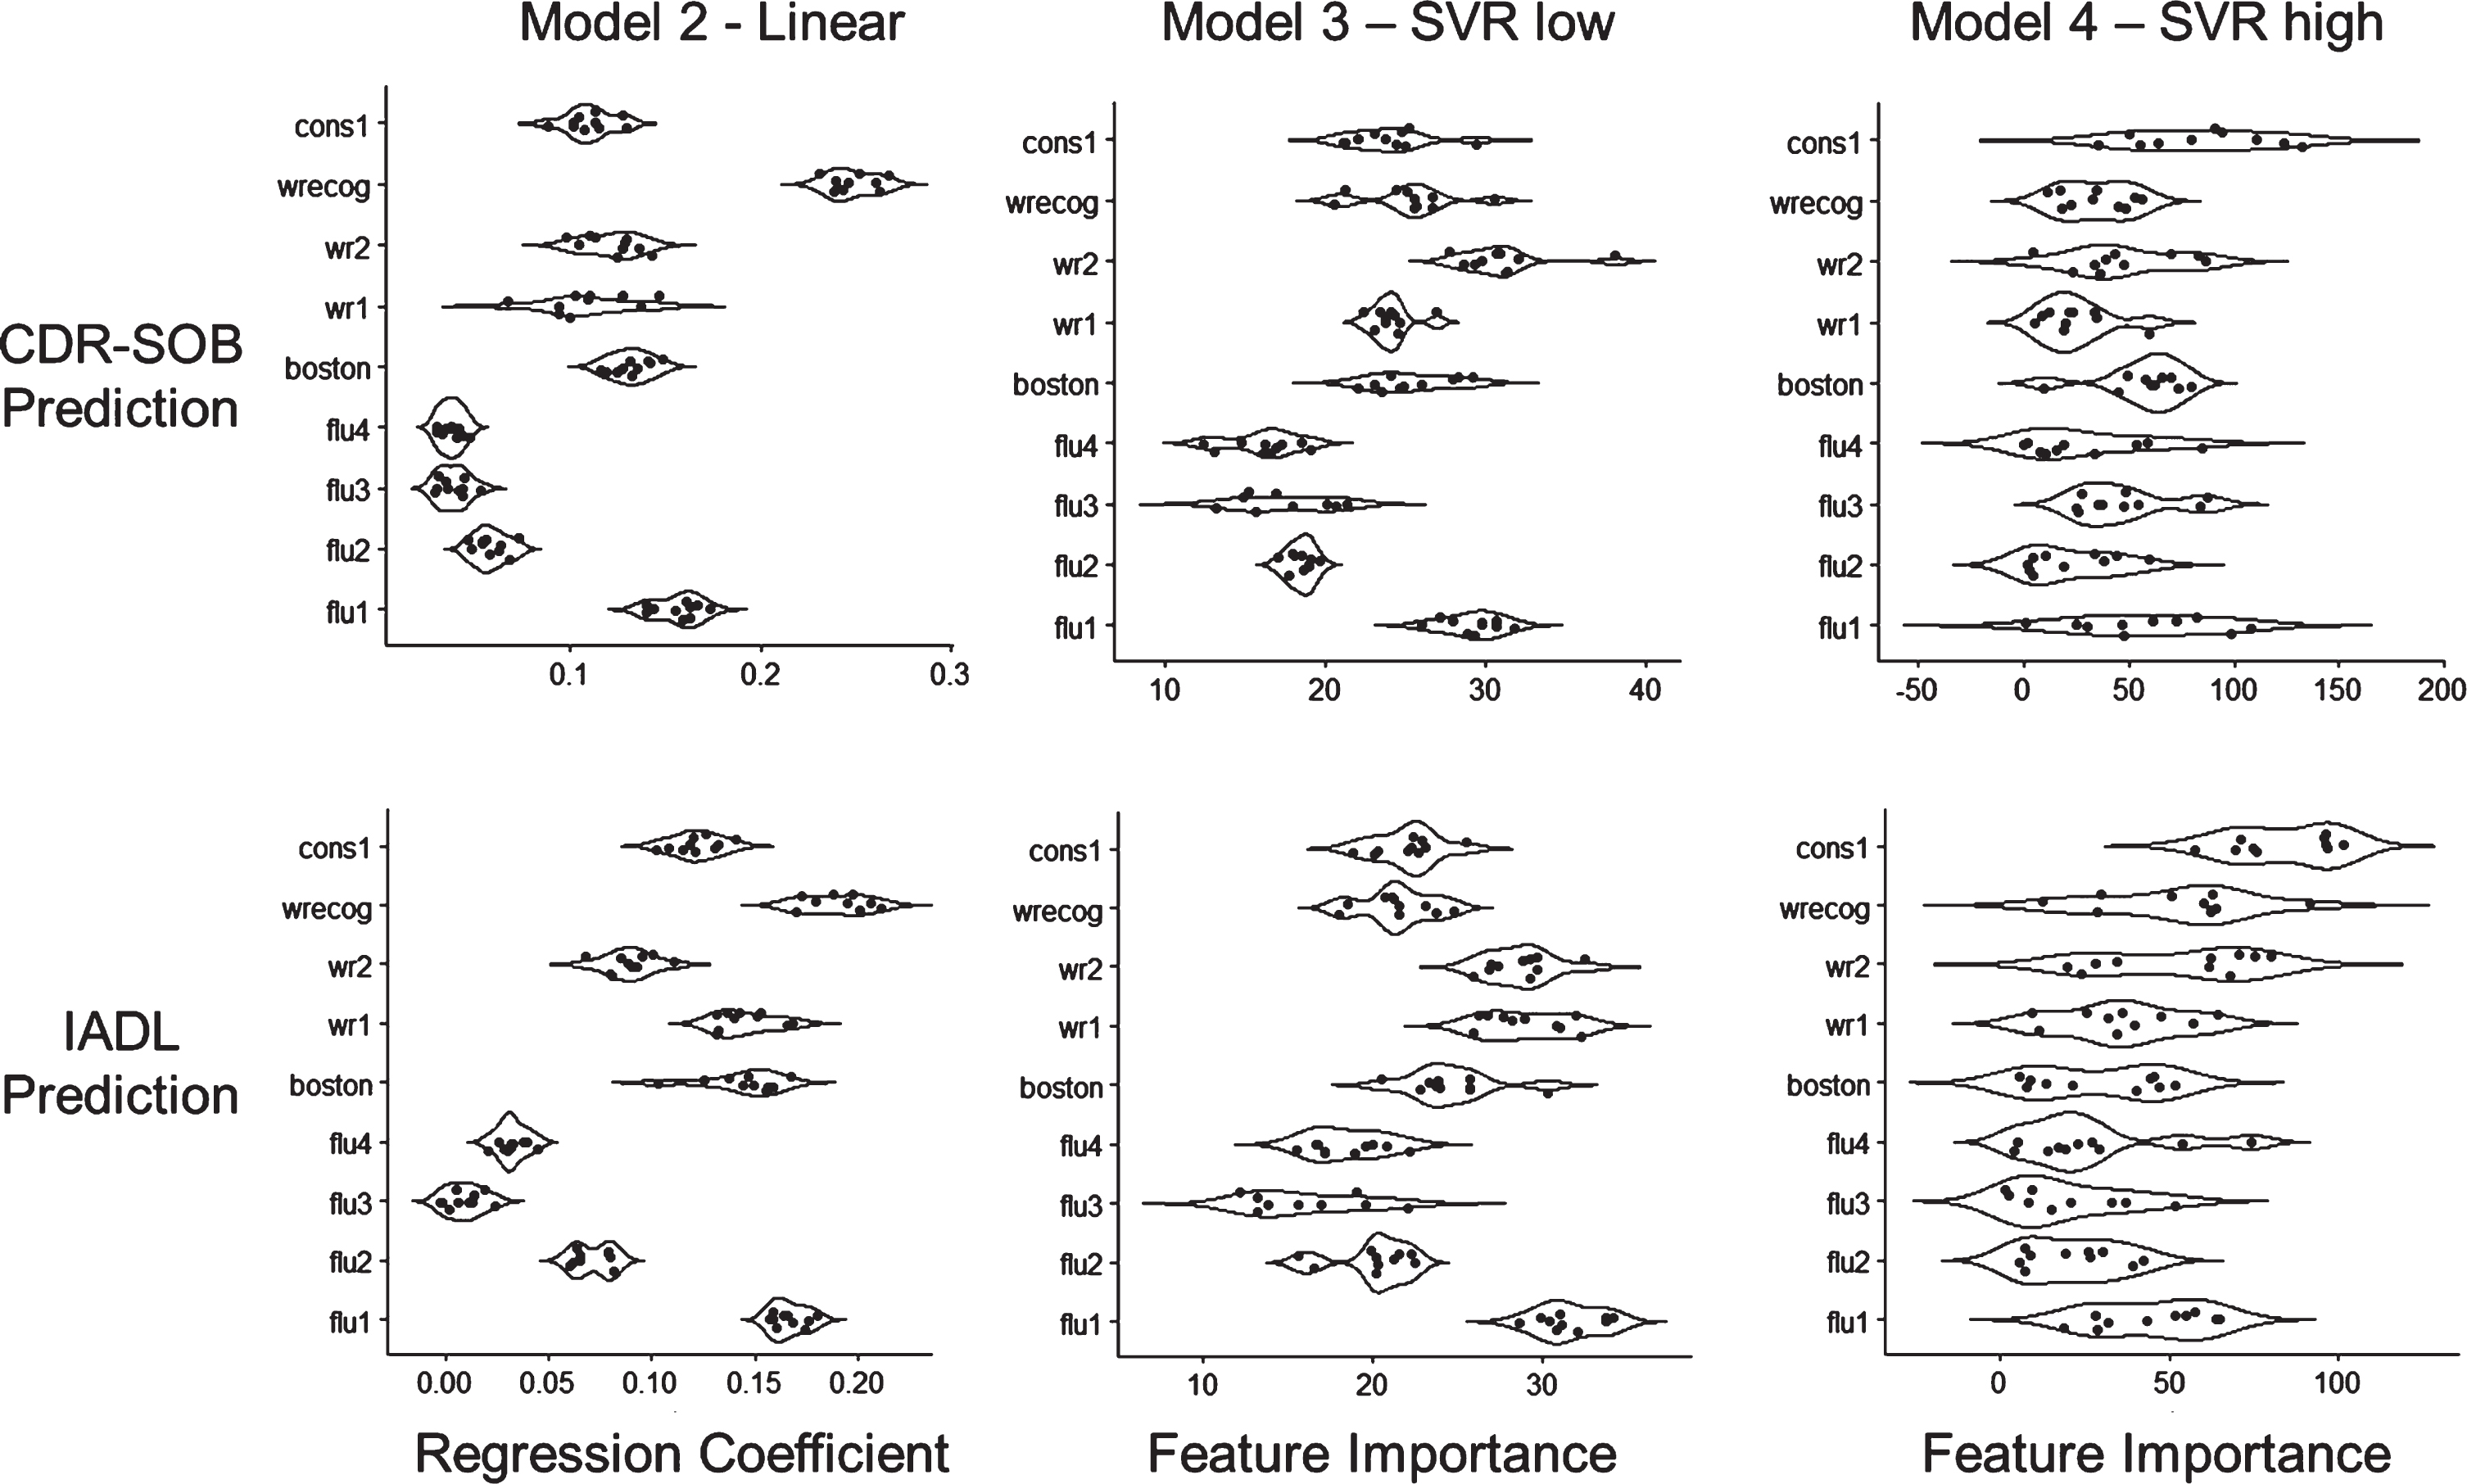
The amount of predictive contribution was assessed with regression coefficients and feature importance of each subtest (Fig. 4). The result showed that the feature importance of Model 3 generally coincided with linear coefficients of Model 2. How-ever, the Word List Recognition and Word List–delayed tests showed an attenuated contribution in Model 3. Moreover, the feature importance in Model 4 was highly variable across iterations, and the salience of the specific feature importance (e.g., Fluency first session, Word List Recognition, Word List Recall delayed) became unclear. On the contrary, the tests with initially weak univariate association with functional level (e.g., Constructional Praxis–copy) showed a considerable improvement in the strength of feature importance.
Fig. 4
Predictive weights of CERAD-K subtests. Each dot represents 10-iterated predictions. Upper: CDR-SOB prediction. Lower: IADL prediction. Left: Multiple regression coefficients (Model 2). Middle: Feature importance of support vector regression with lower complexity (Model 3). Right: Feature importance of support vector regression with higher complexity (Model 4). Flu 1∼4: Animal fluency (4 sections), boston: Boston Naming Test, wr1/2: Word List Recall immediate/delayed, wrecog: Word List Recognition, cons1: Constructional Praxis Copy.
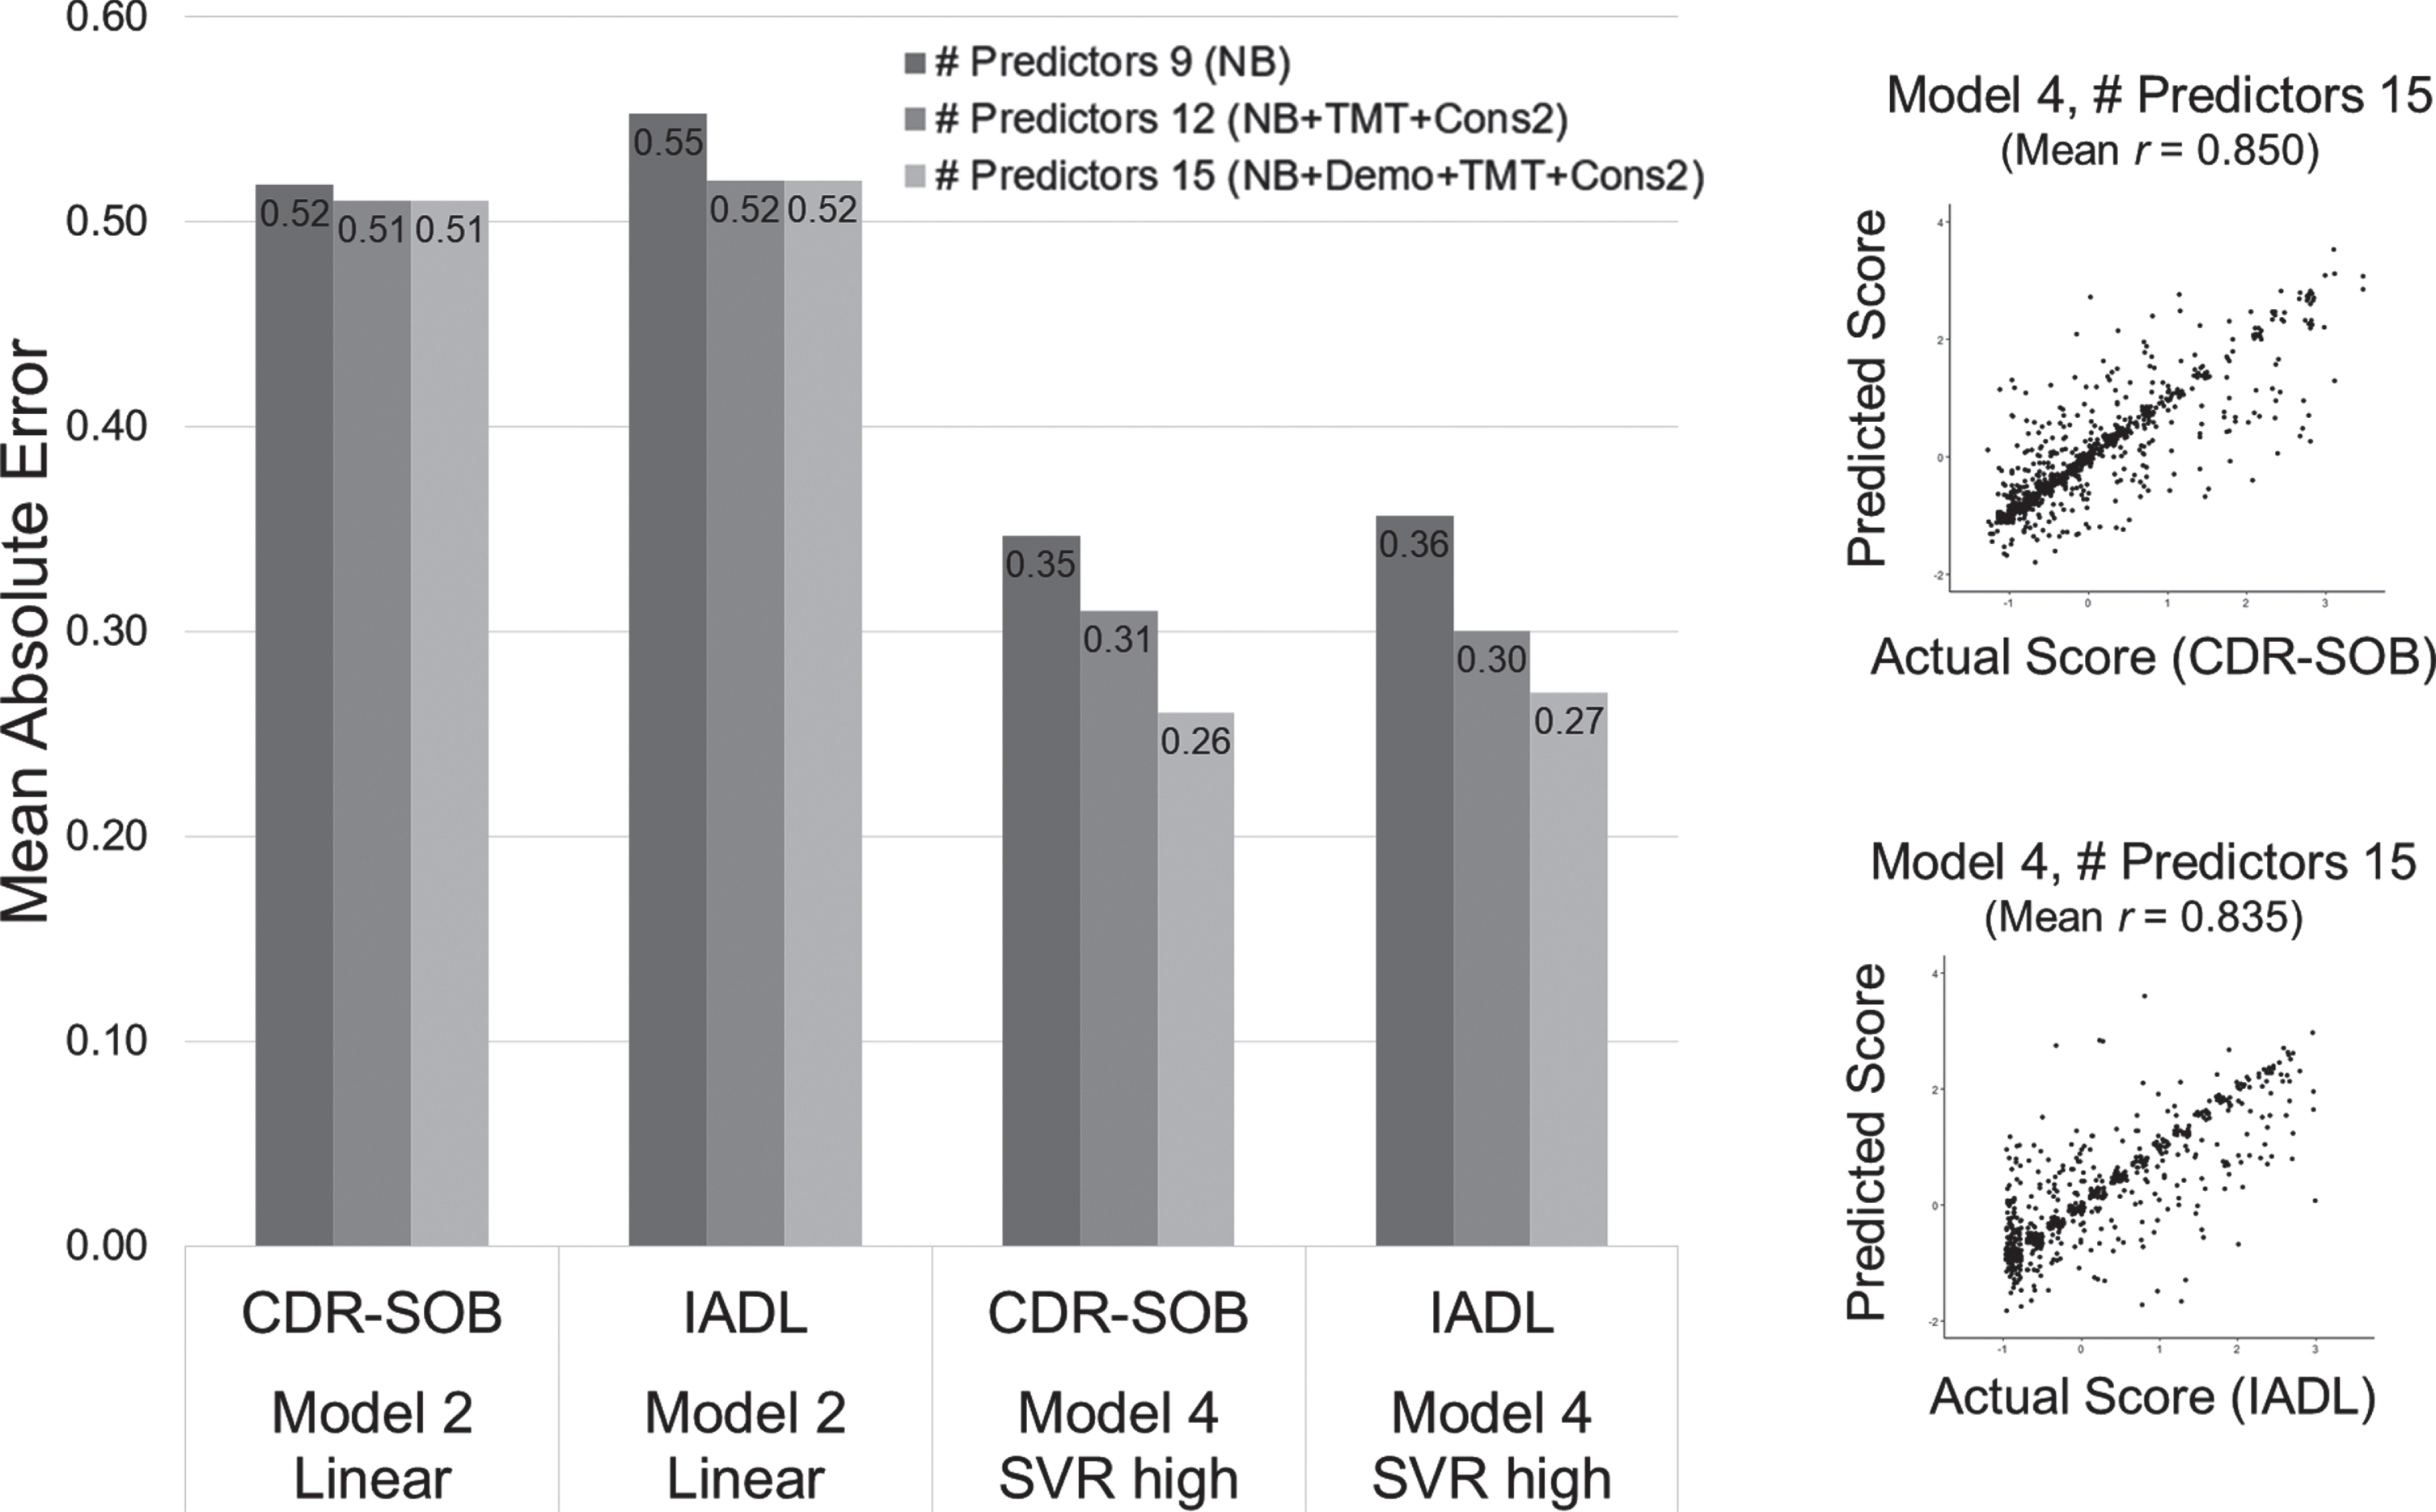
We also evaluated the extent to which other neuropsychological tests (TMT-A/B, Constructional Recall) and demographic information (age, education) add accuracy in predicting functional level. The result showed that adding five of the predictors more improved the predictive accuracy in both linear regression (Model 2 approach) and nonlinear SVR (Model 4 approach) (Fig. 5). Moreover, the improvement of prediction accuracy was greater in the nonlinear model than merely adding the predictors in the linear model, indicating the multiplicative properties in the predictive benefit. TMT-A showed a high contribution in the predictive weights, and the feature importance of the age effect became stronger in the nonlinear model (Supplementary Figure 1).
Fig. 5
Enhanced predictive accuracy when predictors of test scores and demographics are added. The scatter plots represent a single iterated prediction result in Model 4 (SVR-high) with 14 predictors included. NB: Nine subtests of the neuropsychological battery used for CERAD-K total score summation, TMT: Trail Making Test A and B, Cons2: Construction Recall, Demo: Demographic information (age, education, sex).
We also confirmed that the predictive benefit requires subtest combination rather than sole algorithmic complexity. When the CERAD-K total score was modeled with a nonlinear SVR-high (Model 4) algorithm, the predictive accuracy showed only slight improvement (MAE in CDR-SOB = 0.478, IADL = 0.471) compared to the simple linear regression method (MAE in CDR-SOB = 0.535, IADL =0.543). However, the accuracy was still worse than the model with the full nine subtests (Model 4 SVR-high MAE in CDR-SOB = 0.347, IADL = 0.356).
The finding was consistently maintained when the same analysis was conducted within the dementia diagnosis subgroups (MCI or AD group) (Table 4). Likewise, the predictive accuracy minimally differed between gender groups of males (n = 958; MAE in CDR-SOB = 0.29, IADL = 0.30) or females (n = 958, subsampled; MAE in CDR-SOB = 0.31, IADL = 0.32).
Table 4
Prediction accuracy (MAE, Correlation) across predictive models in the subgroup of diagnosis
| MCI (n = 1,057) | AD dementia (n = 1,057, subsampled) | |||||||
| CDR-SOB | IADL | CDR-SOB | IADL | |||||
| MAE | r | MAE | r | MAE | r | MAE | r | |
| Model 1 | ||||||||
| Total Score | 0.77 | 0.26 | 0.67 | 0.26 | 0.65 | 0.57 | 0.65 | 0.56 |
| Model 2 | ||||||||
| Multiple subtests | 0.76 | 0.27 | 0.65 | 0.33 | 0.64 | 0.59 | 0.64 | 0.58 |
| Model 3 | ||||||||
| SVR-Low | 0.67 | 0.42 | 0.53 | 0.46 | 0.54 | 0.66 | 0.57 | 0.63 |
| Model 4 | ||||||||
| SVR-High | 0.46 | 0.59 | 0.39 | 0.62 | 0.39 | 0.72 | 0.41 | 0.69 |
DISCUSSION
The neuropsychological battery provides essential information in assessing the levels of functional impairment of dementia. However, unfavorable sources of information and the idiographic context of lifestyle often hinder valid assessment of one’s real-world functioning. In the current study, we aimed to find translational methods that can aid in interpreting the complex nature of the functional status based on neuropsychological test performance. We examined how the classical summary of neuropsychological battery, namely the total score method, can be improved with the machine learning approach. We first showed that the linear regression models that use a single total score or multiple subtests performed moderately well in predicting functional variabilities of dementia. However, the performance showed a profound improvement when using a nonlinear algorithm that exploits the data pattern with higher complexity. This enhancement was explicitly observed when the dataset was sufficiently large. As the sample size used for training the model increases, the linear models were rapidly saturated with minimal additive benefit. On the contrary, nonlinear models showed a gradual increase in the predictive accuracy until the largest dataset available, especially when using the nonlinear model with higher complexity.
We first confirmed that the total sum score of the neuropsychological battery moderately predicts functional impairment associated with AD dementia. When comparing the two linear models, the combination of multiple subtests of the neuropsychological battery in a linear fashion showed a marginal increase in predictive accuracy, indicating that the current method in summing the subtests as the total score is generally optimal in describing functional outcomes of dementia. However, some scaling biases and prediction errors seem to require more precisions. Each subtest differs in its metric properties, including skewness and floor/ceiling effect across the levels of functioning. Also, the predictive importance may not be uniform across the range of functional abilities. These differences indicate that the linear modeling may not be optimal in finding the predictive test elements in every functional range of dementia, requiring a more flexible model in prediction.
One of the key findings of this study was identifying specific conditions under which machine learning algorithms provide benefits in utilizing neuropsychological tests for functional assessment in dementia. Using the radial basis kernel function of the support vector machine, additive terms with higher-degree or interaction effects may have effectively generated and flexibly fit into the given dataset as a high-dimensional hyperplane. The numerosity of supporting vectors in the fitted SVR model indicates the complex data pattern that the models captured. In contrast to the linear models, applying a nonlinear algorithm (SVR) led to a gradual increase of predictive accuracy as a function of sample size. Moreover, the learning curve did not saturate to a maximum accuracy even with the largest sample size (n = 2,600), suggesting that adding more datasets will further improve the predictability. While some previous studies showed discouraging results in the nonlinear machine learning approach [31, 32], such results may have been due to the lack of sample size. Our findings suggest that a relatively small dataset (n < 500) may be insufficient in exploiting the advantage of complex nonlinear algorithms.
In using the neuropsychological tests to predict the functional outcome of dementia, multiple reasons may explain the benefit of the nonlinear models. The stages of clinical impairment can be reified with the concepts of discrete and ordinal categories (i.e., early or late MCI, preclinical AD), rather than a fine-grained measure of a real entity of human attribute [59, 60]. Thus, if the significance of the cognitive deficit differs across the stages of clinical ordinality, predictive application of linear model may partly fail since they assume uniform predictability of test elements across a long range of clinical severity. Flexible generation of a nonlinear model can be effective in such cases.
One of the practical difficulties in capturing the nonlinear pattern is that the predictive benefit starts to emerge at a relatively larger dataset. Our findings noted that utilizing higher-order nonlinear algorithms requires a great amount of data points, and this difficulty may be related to the signal-to-noise ratio of the predictors. In the previous study, the slowly saturating pattern of the asymptotic learning curve was also observed when predicting other physical properties or discrete image categories [34]. However, the required sample size in the study grew larger in identifying the benefits of nonlinear models, especially as the amount of random noise increases. The noise in the trained dataset minimizes the benefit of nonlinear models, and the linear models may instead perform better when a considerable noise is mixed in the model training. Similar to this previous study, the classical summation of the total score in the current study provided a more reliable and accurate prediction on the functional outcome when the predictive summary score was generated with a relatively smaller sample size (n < 500). On the contrary, the worse performance of nonlinear models with small sample sizes indicates that the model easily overfits uninformative noise. These results suggest that the prerequisite of the benefit is a large-scale dataset that overcomes the confounding noise effect. Although the source of the noise in the neuropsychological test is not identified in the current study, sound data quality based on standardized administration and scoring procedures will be critical in improving the clinical prediction of dementia.
The use of predictive modeling implies further practical applications in the field of clinical assessment [25]. For example, recent attempts showed a promising advancement of using predictive pattern scores of dementia in the multidimensional dataset, such as genetic polymorphisms or brain structural imaging [61, 62]. Likewise, translation from cognitive task performance to real-world functioning requires complex translation. Despite the criticisms on using summary scores and their theoretical basis in neuropsychological assessment [63, 64], the current study showed that multiple cognitive tests could be effectively transformed into a single summary score. Furthermore, the summary approach can be used to serve other purposes of clinical assessment (e.g., differential diagnosis, specific domain of functional outcome) [65]. Varying degrees of one’s functional ability can result from multiple nonlinear combinations of cognitive processes, and clinically meaningful features may not be captured with human-level theories. Based on an optimal combination of the clinical information, some evidence suggests that the machine learning model can outperform the clinician’s predictive expertise in a specific domain of functional outcome [66]. The current study implies that score patterns can be validly augmented with specific purposes and may aid the clinicians’ implicit intuition.
Our study also made use of a machine learning advantage in translating group-level datasets toward personalized indices. In evaluating the utility of neuropsychological test instruments, machine learning provides precision metrics at an individual level, rather than merely rejecting null-hypothesis testing as a group-level difference [25, 38]. Based on the accuracy metrics (i.e., mean absolute error), clinicians can interpret the current study results in how precise or imprecise the summary score will be when assessing a single individual. Our study was able to evaluate the extent to which the classical summary scores and machine learning prediction scores track functioning levels at an individual level.
Consistent with the recent attempts of developing a performance-based assessment of instrumental activities, validating an objective instrument of real-world functioning will be an essential task in translating the use of neuropsychological battery [67]. A valid assessment of the presence and severity of functional ability is crucial in older adults with neuropsychiatric conditions. However, a functional assessment may face practical difficulties when information is gathered under unfavorable informants or patients with low daily motivation. The clinicians should often discern actual ability (i.e., maximum potential ability) from the motivational propensities in daily activities. Also, the significance of the functional difficulties differs across specific informants and may be prone to subjective criteria of the symptom severity. Moreover, the contextual meaning of one’s ‘impairment’ can profoundly vary depending on the social demands (e.g., rural or urban). The current study suggests that the predictive summary score of CDR-SOB and IADL based on neuropsychological test performance would be less affected by confounding factors and may provide ‘expected’ levels of real-world functioning.
Our findings support the utility of using multiple tests in the neuropsychological assessment of dementia. According to the actuarial neuropsychological approaches in MCI diagnosis, applying a multivariate definition of the cognitive impairment led to a more reliable and valid prediction of dementia prognosis and biomarkers [17, 18, 68]. Interestingly, the current study showed that using a single score is insufficient in generating an optimal predictive model. Moreover, the benefit of combining multiple subtests grew larger when exploiting nonlinear patterns of predictors rather than linearly adding the predictors. These findings further support using multiple cognitive tests rather than a single test score as a clinical cutpoint. The multiplicative combination seems to be a critical factor in narrowing the remaining errors that linear methods cannot explain.
Another issue in using neuropsychological scores in dementia assessment is the norm-based decisions. Identifying the deviant deficit based on the expected performance of age and education can sensitively detect subtle inflection in the early stages of cognitive disorders. Accordingly, we observed large variabilities of the total scores, especially within the range of subtle impairment. These participants consisted of highly heterogeneous educational attainment. It is possible that many of the older adults with low education may have maintained the preexisting function while showing significantly low cognitive performances [69, 70]. The lower test specificity in low-educated elderly may have degraded the prediction accuracy, especially in the linear model method [71]. This study found that the additive effect of demographic information was more significant only in the SVR-high complexity model, indicating the predictive role of demographics in an interactive and conditional way. Though the benefits of using norm-adjustment in predicting clinical impairment have been unclear [72–74], utilizing test interpretation that reflects a premorbid functional ability will be crucial in making a theoretically valid distinction between preexisting functional abilities and progressive deterioration [6].
In the subgroup analyses of dementia diagnosis (MCI and AD), the main findings remained consistent. Since the functional assessment measures are strongly associated with the diagnostic criterion of dementia, the predictability could have only reflected diagnostic variation. However, this additional analysis confirmed that the benefits of SVR also held for the variabilities within the same clinical diagnosis of MCI or AD. MCI group showed lower prediction accuracy, possibly due to lower variability of IADL and CDR-SOB, but a meaningful improvement of SVR models was consistently observed. Likewise, the predictive benefit held for both gender groups. Notably, the predictability showed a minimal decrease even with a significant loss sample size of the training dataset in the subgroup analysis. The overall difference in the prediction accuracy was observed, especially in the metric of correlation coefficient (r), while absolute deviance of the prediction (MAE) showed a minimal difference. This difference may be due to the scaling effect between mild levels of impairment (MCI group, low variance, low predictive correlation) and severe range of impairment (high variance, AD group, higher predictive correlation). The correlation metric in predictive modeling has been criticized for being sensitive to the scaling of the data, and a high correlation can exist even when predicted values are discrepant from actual values [26]. The predictability may systematically differ across other clinical stages (e.g., MCI converter versus non-converter, controls versus AD, controls versus MCI) [28] and future study can specify whether the development of predictive models requires a homogeneous training dataset.
When examining the regression coefficients and feature importance, we generally confirmed that subtests of verbal episodic memory, processing speed, category fluency contribute to the prediction of functional impairment [28, 75]. However, it is notable that the variability of feature importance grows flat, and subtests with initially weak weights came to have similarly high contributions. For example, constructional praxis showed minimal predictive contribution in the linear model (Model 2), but SVR identifies the test as a similarly significant predictor (Model 3 and 4). In other words, even though some test remains the most robust predictors (auditory verbal learning test), low-ranking predictors (e.g., visuospatial ability, demographic information) play a role in the higher-order models. Such multiplicative effect implies that the clinical prediction of AD requires combining multiple cognitive domains [17–19], rather than nominating cognitive sign of a single impairment. Moreover, our result warrants caution that a selective set of cognitive domains can only reveal a fraction of the functional outcomes of AD.
Several limitations in the study should be noted. First, the outcome measure used for the prediction target is not the ultimate gold standard in evaluating the predictability of models. The two outcome measures used to train the models can also be influenced by multiple factors of physical illness and socioeconomic constraints that typically concur in older adults. While the administration guideline of CDR explicitly requires not to consider functional disturbances unrelated to cognitive disorders, the confluent nature of one’s real-world functioning may obscure the clear-cut ratings. Moreover, the lifelong division of gender roles in housework blur the boundary between the propensity and ability of daily activities [49]. Neuropsychological test scores are insufficient in accounting for such idiographic social context. The given dataset in the current study is not free from the inherent bias of the prediction target. The results require cautious interpretation in whether the predicted score purely captured the concept of interest. Secondly, we note that the current dataset only confined a specific type of dementia, namely AD. Due to the symptom specificity of AD, the difficulties and functional impairment can differ with other types of neurodegenerative disease or neuropathological conditions. Thus, the specific cognitive domain such as long-term memory function may have been accentuated in the predictive weight. In the future study, modeling various neurocognitive disorders will identify a more generalized theory that explains the association between cognitive test performance and real-world functioning. Lastly, a nonlinear model with high dimensional features is difficult to translate into human-understandable theories. The classic theoretical models typically highlight which of the specific subtest was most sensitive and specific in discriminating a particular clinical condition, but the current study suggests that the true theoretical model of real-world functioning may be much more complex than designed with human inference [76]. Flexible generation of a highly complex model accurately predicted human behavior, but the exact explanatory mechanisms remain in the ‘black box’ models. Further study is needed in decoding how the machine learning model improves predictive accuracy and what specific latent patterns are implied.
ACKNOWLEDGMENTS
This work was supported by Pusan National University Research Grant, 2021. The work was also supported by the Korea Medical Device Development Fund grant funded by the Korea government (the Ministry of Science and ICT, the Ministry of Trade, Industry and Energy, the Ministry of Health & Welfare, the Ministry of Food and Drug Safety) (Project Number: 202015X34).
Authors’ disclosures available online (https://www.j-alz.com/manuscript-disclosures/21-5244r2).
SUPPLEMENTARY MATERIAL
[1] The supplementary material is available in the electronic version of this article: https://dx.doi.org/10.3233/JAD-215244.
REFERENCES
[1] | Fields JA , Ferman TJ , Boeve BF , Smith GE ((2011) ) Neuropsychological assessment of patients with dementing illness. Nat Rev Neurol 7: , 677–687. |
[2] | Ashendorf L , Alosco ML , Bing-canar H , Chapman KR , Martin B , Chaisson CE , Dixon D , Steinberg EG , Tripodis Y , Kowall NW , Stern RA ((2018) ) Clinical utility of select neuropsychological assessment battery tests in predicting functional abilities in dementia. Arch Clin Neuropsychol 33: , 530–540. |
[3] | Petersen RC ((2004) ) Mild cognitive impairment as a diagnostic entity. J Intern Med 256: , 183–194. |
[4] | Bilder RM , Reise SP ((2019) ) Neuropsychological tests of the future: How do we get there from here? . Clin Neuropsychol 33: , 220–245. |
[5] | Donders J ((2020) ) The incremental value of neuropsychological assessment: A critical review. Clin Neuropsychol 34: , 56–87. |
[6] | Royall DR , Palmer RF ((2012) ) Getting past “g”: Testing a new model of dementing processes in persons without dementia. J Neuropsychiatry Clin Neurosci 24: , 37–46. |
[7] | Kwak S , Park SM , Jeon YJ , Ko H , Oh DJ , Lee JY (2021) Multiple cognitive and behavioral factors link association between brain structure and functional impairment of daily instrumental activities in older adults. J Int Neuropsychol Soc, doi: 10.1017/S1355617721000916. |
[8] | Sachdev PS , Blacker D , Blazer DG , Ganguli M , Jeste DV , Paulsen JS , Petersen RC ((2014) ) Classifying neurocognitive disorders: The DSM-5 approach. Nat Rev Neurol 10: , 634–642. |
[9] | Petersen RC , Wiste HJ , Weigand SD , Fields JA , Geda YE , Graff-Radford J , Knopman DS , Kremers WK , Lowe V , Machulda MM , Mielke MM , Stricker NH , Therneau TM , Vemuri P , Jack CR ((2021) ) NIA-AA Alzheimer’s Disease Framework: Clinical characterization of stages. Ann Neurol 89: , 1145–1156. |
[10] | Matteau E , Dupré N , Langlois M , Jean L , Thivierge S , Provencher P , Simard M ((2011) ) Mattis Dementia Rating scale 2: Screening for MCI and dementia. Am J Alzheimers Dis Other Demen 26: , 389–398. |
[11] | Ehrensperger MM , Berres M , Taylor KI , Monsch AU ((2010) ) Early detection of Alzheimers disease with a total score of the German CERAD. J Int Neuropsychol Soc 16: , 910–920. |
[12] | Hallikainen I , Hänninen T , Fraunberg M , Hongisto K , Välimäki T , Hiltunen A , Karppi P , Sivenius J , Soininen H , Koivisto AM ((2013) ) Progression of Alzheimer’s disease during a three-year follow-up usin. The CERAD-NB total score: Kuopio ALSOVA study. Int Psychogeriatr 25: , 1335–1344. |
[13] | Paajanen T , Hänninen T , Aitken A , Hallikainen M , Westman E , Wahlund L-O , Sobow T , Mecocci P , Tsolaki M , Vellas B , Muehlboeck S , Spenger C , Lovestone S , Simmons A , Soininen H ((2013) ) CERAD neuropsychological total scores reflect cortical thinning in prodromal Alzheimer’s disease. Dement Geriatr Cogn Dis Extra 3: , 446–458. |
[14] | Fields JA , Machulda M , Aakre J , Ivnik RJ , Boeve BF , Knopman DS , Petersen RC , Smith GE ((2010) ) Utility of the DRS for predicting problems in day-to-day functioning. Clin Neuropsychol 24: , 1167–1180. |
[15] | Wolfsgruber S , Jessen F , Wiese B , Stein J , Bickel H , Mösch E , Weyerer S , Werle J , Pentzek M , Fuchs A , Köhler M , Bachmann C , Riedel-Heller SG , Scherer M , Maier W , Wagner M ((2014) ) The CERAD neuropsychological assessment battery total score detects and predicts Alzheimer disease dementia with high diagnostic accuracy. Am J Geriatr Psychiatry 22: , 1017–1028. |
[16] | Jahng S , Na DL , Kang Y ((2015) ) Constructing a composite score for the Seoul Neuropsychological Screening Battery-Core. Dement Neurocognitive Disord 14: , 137. |
[17] | Jak AJ , Bondi MW , Delano-Wood L , Wierenga C , Corey-Bloom J , Salmon DP , Delis DC ((2009) ) Quantification of five neuropsychological approaches to defining mild cognitive impairment. Am J Geriatr Psychiatry 17: , 368–375. |
[18] | Bondi MW , Edmonds EC , Jak AJ , Clark LR , Delano-Wood L , McDonald CR , Nation DA , Libon DJ , Au R , Galasko D , Salmon DP ((2014) ) Neuropsychological criteria for mild cognitive impairment improves diagnostic precision, biomarker associations, and progression rates. J Alzheimers Dis 42: , 275–289. |
[19] | Petersen RC , Smith GE , Waring SC , Ivnik RJ , Tangalos EG , Kokmen E ((1999) ) Mild cognitive impairment. Arch Neurol 56: , 303. |
[20] | Raghavan N , Samtani MN , Farnum M , Yang E , Novak G , Grundman M , Narayan V , Dibernardo A ((2013) ) The ADAS-Cog revisited: Novel composite scales based on ADAS-Cog to improve efficiency in MCI and early AD trials. Alzheimers Dement 9: , S21–S31. |
[21] | Miller LS , Rohling ML ((2001) ) A statistical interpretive method for neuropsychological test data. Neuropsychol Rev 11: , 143–169. |
[22] | Thomas KR , Bangen KJ , Weigand AJ , Edmonds EC , Wong CG , Cooper S , Delano-Wood L , Bondi MW ((2020) ) Objective subtle cognitive difficulties predict future amyloid accumulation and neurodegeneration. Neurology 94: , e397–e406. |
[23] | Parks CM , Iosif A-M , Farias S , Reed B , Mungas D , DeCarli C ((2011) ) Executive function mediates effects of white matter hyperintensities on episodic memory. Neuropsychologia 49: , 2817–2824. |
[24] | Chang YL , Jacobson MW , Fennema-Notestine C , Hagler DJ , Jennings RG , Dale AM , McEvoy LK ((2010) ) Level of executive function influences verbal memory in amnestic mild cognitive impairment and predicts prefrontal and posterior cingulate thickness. Cereb Cortex 20: , 1305–1313. |
[25] | Dwyer DB , Falkai P , Koutsouleris N ((2018) ) Machine learning approaches for clinical psychology and psychiatry. Annu Rev Clin Psychol 14: , 91–118. |
[26] | Poldrack RA , Huckins G , Varoquaux G ((2020) ) Establishment of best practices for evidence for prediction: A review. JAMA Psychiatry 77: , 534–540. |
[27] | Yarkoni T , Westfall J ((2017) ) Choosing prediction over explanation in psychology: Lessons from machine learning. Perspect Psychol Sci 12: , 1100–1122. |
[28] | Battista P , Salvatore C , Berlingeri M , Cerasa A , Castiglioni I ((2020) ) Artificial intelligence and neuropsychological measures: The case of Alzheimer’s disease. Neurosci Biobehav Rev 114: , 211–228. |
[29] | Grassi M , Perna G , Caldirola D , Schruers K , Duara R , Loewenstein DA ((2018) ) A clinically-translatable machine learning algorithm for the prediction of Alzheimer’s disease conversion in individuals with mild and premild cognitive impairment. J Alzheimers Dis 61: , 1555–1573. |
[30] | Hatton CM , Paton LW , McMillan D , Cussens J , Gilbody S , Tiffin PA ((2019) ) Predicting persistent depressive symptoms in older adults: A machine learning approach to personalised mental healthcare. J Affect Disord 246: , 857–860. |
[31] | Battista P , Salvatore C , Castiglioni I ((2017) ) Optimizing neuropsychological assessments for cognitive, behavioral, and functional impairment classification: A machine learning study. Behav Neurol 2017: , 1850909. |
[32] | Weakley A , Williams JA , Schmitter-Edgecombe M , Cook DJ ((2015) ) Neuropsychological test selection for cognitive impairment classification: A machine learning approach. J Clin Exp Neuropsychol 37: , 899–916. |
[33] | Shatte ABR , Hutchinson DM , Teague SJ ((2019) ) Machine learning in mental health: A scoping review of methods and applications. Psychol Med 49: , 1426–1448. |
[34] | Schulz MA , Yeo BTT , Vogelstein JT , Mourao-Miranada J , Kather JN , Kording K , Richards B , Bzdok D ((2020) ) Different scaling of linear models and deep learning in UKBiobank brain images versus machine-learning datasets. Nat Commun 11: , 4238. |
[35] | Myszczynska MA , Ojamies PN , Lacoste AMB , Neil D , Saffari A , Mead R , Hautbergue GM , Holbrook JD , Ferraiuolo L ((2020) ) Applications of machine learning to diagnosis and treatment of neurodegenerative diseases. Nat Rev Neurol 16: , 440–456. |
[36] | Miller JB ((2019) ) Big data and biomedical informatics: Preparing for the modernization of clinical neuropsychology. Clin Neuropsychol 33: , 287–304. |
[37] | Orrù G , Pettersson-Yeo W , Marquand AF , Sartori G , Mechelli A ((2012) ) Using Support Vector Machine to identify imaging biomarkersof neurological and psychiatric disease: A critical review. Neurosci Biobehav Rev 36: , 1140–1152. |
[38] | Arbabshirani MR , Plis S , Sui J , Calhoun VD ((2017) ) Single subject prediction of brain disorders in neuroimaging: Promises and pitfalls. Neuroimage 145: , 137–165. |
[39] | McKhann GM , Drachman D , Folstein M , Katzman R , Price D , Stadlan EM ((1984) ) Clinical diagnosis of Alzheimer’s disease: Report of the NINCDS-ADRDA Work Group under the auspices of Department of Health and Human Services Task Force on Alzheimer’s Disease. Neurology 34: , 939–944. |
[40] | Albert MS , DeKosky ST , Dickson D , Dubois B , Feldman HH , Fox NC , Gamst A , Holtzman DM , Jagust WJ , Petersen RC , Snyder PJ , Carrillo MC , Thies B , Phelps CH ((2011) ) The diagnosis of mild cognitive impairment due to Alzheimer’s disease: Recommendations from the National Institute on Aging-Alzheimer’s Association workgroups on diagnostic guidelines for Alzheimer’s disease. Alzheimers Dement 7: , 270–279. |
[41] | O’Bryant SE ((2008) ) Staging dementia using Clinical Dementia Rating scale sum of boxes scores. Arch Neurol 65: , 1091. |
[42] | Lee JH , Lee KU , Lee DY , Kim KW , Jhoo JH , Kim JH , Lee KH , Kim SY , Han SH , Woo JI ((2002) ) Development of the Korean Version of the Consortium to Establish a Registry for Alzheimer’s Disease Assessment Packet (CERAD-K): Clinical and Neuropsychological Assessment Batteries. J Gerontol B Psychol Sci Soc Sci 57: , P47–P53. |
[43] | Chandler MJ , Lacritz LH , Hynan LS , Barnard HD , Allen G , Deschner M , Weiner MF , Cullum CM ((2005) ) A total score for the CERAD neuropsychological battery. Neurology 65: , 102–106. |
[44] | Seo EH , Lee DY , Kim KW , Lee JH , Jhoo JH , Youn JC , Choo IH , Ha J , Woo JI ((2006) ) A normative study of the Trail Making Test in Korean elders. Int J Geriatr Psychiatry 21: , 844–852. |
[45] | Fillenbaum GG , Peterson B , Morris JC ((1996) ) Estimating the validity of the Clinical Dementia Rating scale: The CERAD experience. Aging (Albany NY) 8: , 379–385. |
[46] | Morris JC ((1997) ) Clinical Dementia Rating: A reliable and valid diagnostic and staging measure for dementia of the Alzheimer type. Int Psychogeriatr 9: , 173–176. |
[47] | Morris JC , Ernesto C , Schafer K , Coats M , Leon S , Sano M , Thal LJ , Woodbury P ((1997) ) Clinical dementia rating training and reliability in multicenter studies: The Alzheimer’s Disease Cooperative Study experience. Neurology 48: , 1508–1510. |
[48] | Lynch CA , Walsh C , Blanco A , Moran M , Coen RF , Walsh JB , Lawlor BA ((2005) ) The clinical dementia rating sum of box score in mild dementia. Dement Geriatr Cogn Disord 21: , 40–43. |
[49] | Lawton MP , Brody EM ((1969) ) Assessment of older people: Self-maintaining and instrumental activities of daily living. Gerontologist 9: , 179–186. |
[50] | Kim S , Won J , Cho K ((2005) ) The Validity and Reliability of Korean Version of Lawton IADL Index. J Korean Geriatr Soc 9: , 23–29. |
[51] | Jekel K , Damian M , Wattmo C , Hausner L , Bullock R , Connelly PJ , Dubois B , Eriksdotter M , Ewers M , Graessel E , Kramberger MG , Law E , Mecocci P , Molinuevo JL , Nygård L , Olde-Rikkert MG , Orgogozo JM , Pasquier F , Peres K , Salmon E , Sikkes SA , Sobow T , Spiegel R , Tsolaki M , Winblad B , Frölich L ((2015) ) Mild cognitive impairment and deficits in instrumental activities of daily living: A systematic review. Alzheimers Res Ther 7: , 17. |
[52] | Lindbergh CA , Dishman RK , Miller LS ((2016) ) Functional disability in mild cognitive impairment: A systematic review and meta-analysis. Neuropsychol Rev 26: , 129–159. |
[53] | Hastie T , Tibshirani R , Friedman J (2009) The Elements of Statistical Learning Data. |
[54] | James G , Witten D , Hastie T (2019) Introduction to Statistical Learning with Applications in R. |
[55] | Cortes C , Vapnik V , Saitta L ((1995) ) Support-vector networks. Mach Learn 20: , 273–297. |
[56] | Schölkopf B , Smola A , Bach F ((2005) ) Learning with Kernels: Support vector machines, regularization, optimization, and beyond. IEEE Trans Neural Networks 16: , 781–781. |
[57] | Dimitriadou E , Hornik K , Leisch F , Meyer D , Weingessel A , Leisch MF (2015) Package “e1071.” R Softw Packag avaliable http://cranrprojectorg/web/packages/e1071/. |
[58] | Franke K , Ziegler G , Klöppel S , Gaser C ((2010) ) Estimating the age of healthy subjects from T1-weighted MRI scans using kernel methods: Exploring the influence of various parameters. Neuroimage 50: , 883–892. |
[59] | Borsboom D , Rhemtulla M , Cramer AOJ , van der Maas HLJ , Scheffer M , Dolan CV ((2016) ) Kinds versus continua: A review of psychometric approaches to uncover the structure of psychiatric constructs. Psychol Med 46: , 1567–1579. |
[60] | Gross AL , Sherva R , Mukherjee S , Newhouse S , Kauwe JSK , Munsie LM , Waterston LB , Bennett DA , Jones RN , Green RC , Crane PK ((2014) ) Calibrating longitudinal cognition in Alzheimer’s disease across diverse test batteries and datasets. Neuroepidemiology 43: , 194–205. |
[61] | Baker E , Escott-Price V ((2020) ) Polygenic risk scores in Alzheimer’s disease: Current applications and future directions. Front Digit Heal 2: , 14. |
[62] | Habes M , Janowitz D , Erus G , Toledo JB , Resnick SM , Doshi J , Van Der Auwera S , Wittfeld K , Hegenscheid K , Hosten N , Biffar R , Homuth G , Völzke H , Grabe HJ , Hoffmann W , Davatzikos C ((2016) ) Advanced brain aging: Relationship with epidemiologic and genetic risk factors, and overlap with Alzheimer disease atrophy patterns. Transl Psychiatry 6: , e775–e775. |
[63] | Lezak MD , Howieson D (2012) Neuropsychological assessment (5th ed.). |
[64] | Deary IJ , Cox SR , Ritchie SJ ((2016) ) Getting Spearman off the skyhook: One more in a century (since Thomson, 1916) of Attempts to vanquish g. Psychol Inq 27: , 192–199. |
[65] | Graham SA , Lee EE , Jeste DV , Van Patten R , Twamley EW , Nebeker C , Yamada Y , Kim H-C , Depp CA ((2020) ) Artificial intelligence approaches to predicting and detecting cognitive decline in older adults: A conceptual review. Psychiatry Res 284: , 112732. |
[66] | Koutsouleris N , Kambeitz-Ilankovic L , Ruhrmann S , Rosen M , Ruef A , Dwyer DB , Paolini M , Chisholm K , Kambeitz J , Haidl T , Schmidt A , Gillam J , Schultze-Lutter F , Falkai P , Reiser M , Riecher-Rössler A , Upthegrove R , Hietala J , Salokangas RKR , Pantelis C , Meisenzahl E , Wood SJ , Beque D , Brambilla P , Borgwardt S ((2018) ) Prediction models of functional outcomes for individuals in the clinical high-risk state for psychosis or with recent-onset depression: A multimodal, multisite machine learning analysis. JAMA Psychiatry 75: , 1156–1172. |
[67] | Moore DJ , Palmer BW , Patterson TL , Jeste DV ((2007) ) A review of performance-based measures of functional living skills. J Psychiatr Res 41: , 97–118. |
[68] | Jak AJ , Urban S , McCauley A , Bangen KJ , Delano-Wood L , Corey-Bloom J , Bondi MW ((2009) ) Profile of hippocampal volumes and stroke risk varies by neuropsychological definition of mild cognitive impairment. J Int Neuropsychol Soc 15: , 890–897. |
[69] | Chey J , Na DG , Tae WS , Ryoo JW , Hong SB ((2006) ) Medial temporal lobe volume of nondemented elderly individuals with poor cognitive functions. Neurobiol Aging 27: , 1269–1279. |
[70] | Ardila A , Ostrosky-Solis F , Rosselli M , Gomez C ((2000) ) Age-related cognitive decline during normal aging the complex effect of education. Arch Clin Neuropsychol 15: , 495–513. |
[71] | Heaton RK , Matthews CG , Grant I , Avitable N ((1996) ) Demographic corrections with comprehensive norms: An overzealous attempt or a good start? J Clin Exp Neuropsychol 18: , 449–458. |
[72] | Quaranta D , Gainotti G , Vita MG , Lacidogna G , Scaricamazza E , Piccininni C , Marra C ((2016) ) Are raw scores on memory tests better than age- and education- adjusted scores for predicting progression from amnesic mild cognitive impairment to Alzheimer disease? . Curr Alzheimer Res 13: , 1414–1420. |
[73] | Cullen B , Fahy S , Cunningham CJ , Coen RF , Bruce I , Greene E , Coakley D , Walsh JB , Lawlor BA ((2005) ) Screening for dementia in an Irish community sample using MMSE: A comparison of norm-adjusted versus fixed cut-points. Int J Geriatr Psychiatry 20: , 371–376. |
[74] | Hessler J , Tucha O , Förstl H , Mösch E , Bickel H ((2014) ) Age-correction of test scores reduces the validity of mild cognitive impairment in predicting progression to dementia. PLoS One 9: , e106284. |
[75] | Belleville S , Fouquet C , Hudon C , Zomahoun HTV , Croteau J ((2017) ) Neuropsychological measures that predict progression from mild cognitive impairment to Alzheimer’s type dementia in older adults: A systematic review and meta-analysis. Neuropsychol Rev 27: , 328–353. |
[76] | Peterson JC , Bourgin DD , Agrawal M , Reichman D , Griffiths TL ((2021) ) Using large-scale experiments and machine learning to discover theories of human decision-making. Science 372: , 1209–1214. |

