
Mouse and Human Tau Expression in Different Brain Areas
Abstract
Background:
An increase in tau protein is believed to be necessary for tau aggregation. However, whether this is due to increased expression of the endogenous tau promoter or protein accumulation due to proteostasis failure remains uncertain.
Objective:
To analyze the expression of GFP protein under endogenous tau promoter across different ages and within different brain areas.
Methods:
We have measured direct expression of Mapt gene promotor by western blot and immunofluorescence, by means of a commercial tau knock-out mice generated by integrating GFP-encoding cDNA into exon 1 of the Mapt gene. Besides, we have analyzed the MAPT gene expression in human samples.
Results:
Mapt expression is similar in the cortex, hippocampus, and cerebellum in mice and in human samples although some differences exist between dentate gyrus and CA1 hippocampal areas in mice. Besides, we have analyzed the murine Mapt gene expression during aging (at 2, 6, 12, and 18 moths) and no differences in endogenous tau promoter expression were observed.
Conclusion:
Our results suggest that Mapt promoter activity is similar in the brain areas studied and, therefore, tau accumulation due to aging is likely due to proteostasis failure rather than occurring at the transcriptional level.
INTRODUCTION
Tau is a microtubule-associated protein, especially abundant in the brain [1]. Alterations of tau protein are associated with neurodegenerative pathologies. The main feature of tauopathies related to dementia is the presence of tau aggregates [2–4], promoted by kinases as GSK3, which phosphorylated tau protein [5, 6]. Abnormally hyperphosphorylated tau protein aggregates form the paired helical filaments (PHFs) in Alzheimer’s disease (AD). The association of these PHFs forms the so-called neurofibrillary tangles (NFTs). Tau phosphorylation first appears in the transentorhinal and entorhinal cortices, then it spreads to the hippocampus and, eventually, extends to the neocortex [4]. The monomeric tau protein promotes the assembly and stabilization of microtubules [1]. However, once tau is hyperphosphorylated, it decreases microtubule binding affinity, inhibiting the assembly of microtubules and changing the interaction with plasma membranes. Some of the consequences of these modifications are, among others, the impairment of axonal transport, and differential dendritic and post-synaptic tau distribution [7]. Tau protein must reach a critical concentration to aggregate, as happen in other proteinopathies. Since there are differences in tau protein amount in different brain region [7, 8], it could mean that there is a possible relation between the appearance of a high tau level in a specific brain region and the presence of tau aggregates in that region. However, tau protein levels are an equilibrium amount tau degradation and tau synthesis.
It is a well-established idea that tau protein is increasing with aging [2–4]. However, whether this is due to increased expression of the endogenous tau promoter or protein accumulation due to failure of proteostasis is unknown. To find out if tau aggregation is a consequence of tau protein accumulation, in 2017 Hu and colleges [7] measured total tau protein in rat brains and found that the highest point of tau protein accumulation is around 12 months. Most studies have looked primarily at the tau protein levels using specific antibodies by western blot; however, it has put less interest in detailed analysis at the cellular level of the expression of the Mapt gene. There is available to the scientific community the work developed by Allen Brain Map using mRNA hybridization of specific probes (https://mouse.brain-map.org/experiment/show/80525654). In this work, we have analyzed Mapt gene expression. We have studied the expression of tau directly in TauGFP knock-in/knock-out mice. These mice allowed us to study Mapt gene expression precisely as a function of age, brain region, and cellular component. Furthermore, these mice allowed us to study the expression of tau without post-translational modifications in murine brain, because we have analyzed it by quantifying expression of green fluorescent protein (GFP) under the endogenous tau promoter [9]. We have measured GFP levels in three brain areas: cortex, hippocampus, and cerebellum. In addition, we have measured in human samples tau expression in the same areas, including a new tau isoform (wTau) recently described in human samples [10].
MATERIALS AND METHODS
Animals and tissue processing
B6.129S4(Cg)-Mapttm1(eGFP)Klt/J mice (C57 BL6J background) from The Jackson Laboratory (stock 029219) with two GFP copies (here referred to as TauGFP/GFP) are knockout mice for the microtubule-associated protein tau (MAPT) gene due to insertion of the transgene GFP [11]. TauGFP/+ mice with a single copy of GFP are hemizygous mice for MAPT gene, while the littermate Tau+/+ are the wild-type mice. Mice were housed in a specific pathogen-free colony facility, in accordance and handle following European and local animal care protocols. Male and female mice (2, 6, 12, and 18 months old) were used for all experiments. Animal experiments received the approval of the CBMSO’s (AECC-CBMSO-13/172) and national (PROEX 102.0/21) Ethics Committee. Mice were fully anesthetized by an intraperitoneal injection of pentobarbital (Dolethal, Vetoquinol, 60 mg/mL) and transcardially perfused with 0.9% saline.
Brain samples
All human brain samples from hippocampus and frontal lateral cortex were obtained from Banco de Tejidos (Fundación CIEN, Instituto de Salud Carlos III, Madrid, Spain). Cerebellum samples were kindly provided by Dr. Isidro Ferrer from Bellvitge University Hospital, IDIBELL (Bellvitge Biomedical Research Centre), Barcelona, Spain. Hippocampus (HPC) and frontal lateral cortex (FLC) samples were from control subjects (not AD associated pathology). Due to absence of control subjects from cerebellum, samples on very early stages of the disease (Braak I and II stages of tau-related AD pathology) were used. See Table 1 for a detailed description of each subject and the regions of brain available from each individual. Written informed consent was obtained premortem from all patients.
Table 1
Summary of the samples employed for qPCR
| Group | Sex | Age | FLC | HPC | CBL |
| Control | M | 41 | ✓ | ✓ | |
| Control | F | 58 | ✓ | ✓ | |
| Control | F | 78 | ✓ | ||
| Control | M | 43 | ✓ | ✓ | |
| Control | M | 56 | ✓ | ✓ | |
| Control | M | 49 | ✓ | ✓ | |
| Control | M | 84 | ✓ | ✓ | |
| Control | M | 84 | ✓ | ✓ | |
| Control | M | 78 | ✓ | ✓ | |
| Control | M | 14 | ✓ | ||
| Braak I | M | 70 | ✓ | ||
| Braak I | M | 61 | ✓ | ||
| Braak I | F | 75 | ✓ | ||
| Braak II | M | 86 | ✓ | ||
| Braak II | M | 73 | ✓ |
FLC, frontal lateral cortex; HPC, hippocampus; CBL, cerebellum.
RNA extraction and RT-qPCR
Brain samples were extracted using Qiazol lysis reagent (79306, Qiagen). One stainless steel bead (69989, Qiagen) was introduced in an Eppendorf with a small portion of each brain sample and was homogenized through agitation for 4 min at a frequency of 30/s on a Qiagen Retsch MM300 TissueLyser. All RNA extracts were used by qPCR. Relative expression of TIR12-MAPT was determined by qPCR. cDNA was isolated from previously extracted RNA samples with the PrimeScript 1st strand cDNA Synthesis Kit (6110A, Takara) using oligo dT primer, during 45 min at 42°C, according to manufacturer’s protocols. Gene expression was then determined using quantitative PCR with fast SYBR Green reagent (4385612, Applied Biosystems) on a CFX384 Touch Real-Time PCR Detection System (Bio-Rad). The reaction per well was 10μL and contained: 25 ng of cDNA template per sample, 5μL of the SYBR Green PCR mix, and 1μL per oligonucleotide pair at 5μM (see Table 2). Amplification was carried out for 40 cycles of 1 s at 95°C followed by 20 s at 60°C. Three technical replicates per gene were used. Each primer pair showed a single, sharp peak, thereby indicating that the primers amplified only one specific PCR product. No amplification from the no template control was observed for genes of interest.
Table 2
Detailed information of the oligonucleotides used for qPCR
| Name | Sequence | Target |
| TIR12 Fw | CATAAACCAGGAGGTGGCCAG | Intron-12-retaining MAPT |
| TIR12 Rv | CACCCTACCCCCTTTACCTTTT | |
| MAPT-Fw | GTCGAAGATTGGGTCCCTGG | Total MAPT |
| MAPT-Rv | GACACCACTGGCGACTTGTA | |
| 18S Fw | ATCCATTGGAGGGCAAGTC | Normalizing human genes (18S, GAPDH, tubulin, β-actin) |
| 18S Rv | GCTCCCAAGATCCAACTACG | |
| GAPDH Fw | AGCCACATCGCTCAGACAC | |
| GAPDH Rv | CGCCCAATACGACCAAAT | |
| TubB Fw | CTTTGTGGAATGGATCCCCA | |
| TubB Rv | GACTGCCATCTTGAGGCCA | |
| BACT Fw | CAGGCACCAGGGCGTG | |
| BACT Rv | GTGAGGATGCCTCTCTTGCTCT |
Immunofluorescence
Mice whose samples were employed were fixed with 4% PFA in 0.1 N phosphate buffer (PB) for 24 h at 4°C. They were then washed three times in PB and placed in a 10% sucrose/4% agarose matrix. Sagittal brain sections were obtained on a Leica VT1000 S vibratome (50μm). The sections were subjected to a floating immunolabeling process. For immunofluorescence after performing three washes with PB 0.1 N, the sections were incubated with the following primary antibodies in the blocking solution (1% BSA and 1% Triton X-100 in 0.1 N PB) at 4°C for 24 h: anti-Olig2 (rabbit, 1 : 1000, Millipore); anti-Iba1 (guinea pig, 1 : 1000, Synaptic systems); anti-GFAP (chicken, 1 : 500, Invitrogen); and anti-NeuN (mouse, 1 : 1000, Millipore). Next, five washes were performed with this same blocking solution, and the sections were incubated with the corresponding secondary antibodies conjugated with Alexa fluorophores at 4°C with gentle agitation for 24 h (1 : 1000, Molecular Probes). Finally, three washes were performed with PB and samples were incubated with DAPI diluted 1 : 5000 for 10 min, followed by three additional washes with PB. The sections were placed on slides using FluorSave Images that were taken using a Confocal Spinning Disk SpinSR10 attached to an IX83 inverted microscope (Olympus).
Protein extracts and western blots
Mouse brain tissue preserved at –80°C was homogenized to obtain the extracts in RIPA buffer as described before [9]. Next, the protein concentration of each homogenate was determined by the Bradford method [12], using the BCA test (Thermo Fisher). Finally, the SDS-PAGE buffer used in [9] was added to the protein extracts obtained. The extracts were boiled in a thermoblock at 100°C for 5 min. Thirty micrograms of protein from each sample were loaded in as many wells. The proteins were separated on 10% acrylamide/bisacrylamide gels in the presence of SDS at 120 mV for approximately 1 h. Those present in the gel were transferred to nitrocellulose membranes (Schleicher and Schuell, Keene, NH, USA) at 150 mA for 45 min, using the Bio-Rad Mini-Protean system. Subsequently, the membranes were blocked using 5% milk powder in 0.1% Tween PBS for 1 h. The membranes were then washed twice with 0.1% PBS Tween-20 (v/v) under stirring for 10 min. The membrane was stained with Ponceau dye (Ponceau 0.3% in TCA 3%) to check the transfer efficiency. Finally, they were incubated with the appropriate primary antibody overnight at 4°C: anti-total Tau5 (mouse, 1 : 1000, Calbiochem); anti-GFP (rabbit, 1 : 1000, Invitrogen); and anti-Vinculin (rabbit, 1 : 5000, Abcam) as load control. Protein expression was detected using the secondary antibody (1 : 1000), which were incubated for 1 h at room temperature. After performing three 10-min washes in the wash solution, the immunoreactive proteins were detected using an ECL kit (Enhanced Chemiluminescence Detection System, Amersham).
Statistical analysis
Mean data were analyzed with one-way ANOVA followed by Tukey’s test post hoc analysis or by two tails T-test. Differences between groups were considered significant at *p<0.05, **p<0.01, and ***p<0.001.
RESULTS
Characterization of TauGFP knock-in/knock-out mice
TauGFP knock-in/knock-out mice [11] have an eGFP-coding sequence inserted into the first exon of the microtubule-associated protein tau gene (Mapt), disrupting expression of the gene and generating a cytoplasmic eGFP expression under the endogenous tau promoter (Fig. 1A–C). This model allows us to analyze where tau promoter is expressed at each moment. Thus, we firstly analyzed protein expression in cortex, hippocampus, and cerebellum in TauGFP/GFP, hemizygous (TauGFP/+),and wild type (Tau+/+) mice (Supplementary Figure 1). These experiments demonstrated that the amount of tau protein and eGFP is halved in TauGFP/+ mice compared with Tau+/+ and TauGFP/GFP respectively. This proves that protein levels correlate with the number of tau and GFP gene copies.
Fig. 1
B6.129S4(Cg)-Mapttm1(eGFP)Klt/J Mice (TauGFP/GFP mice). A) Fluorescence loupe image of a brain coronal section in a TauGFP/GFP and Tau+/+ (wild type) mice. B) Gene Mapt schematic with GFP insertion in the first exon and (C) scheme of the resulting protein with the first 31 amino acids of tau protein followed by cytoplasmic eGFP protein that is expressed under the endogenous tau promoter. D) Representative fluorescence confocal microscopy images with different markers of glial cells as Olig2 (oligodendrocytes), Iba1 (microglia), GFAP (astrocytes), and NeuN (neurons) and their colocalization with the endogenous signal in TauGFP/GFP mice. Scale bar 10μm.
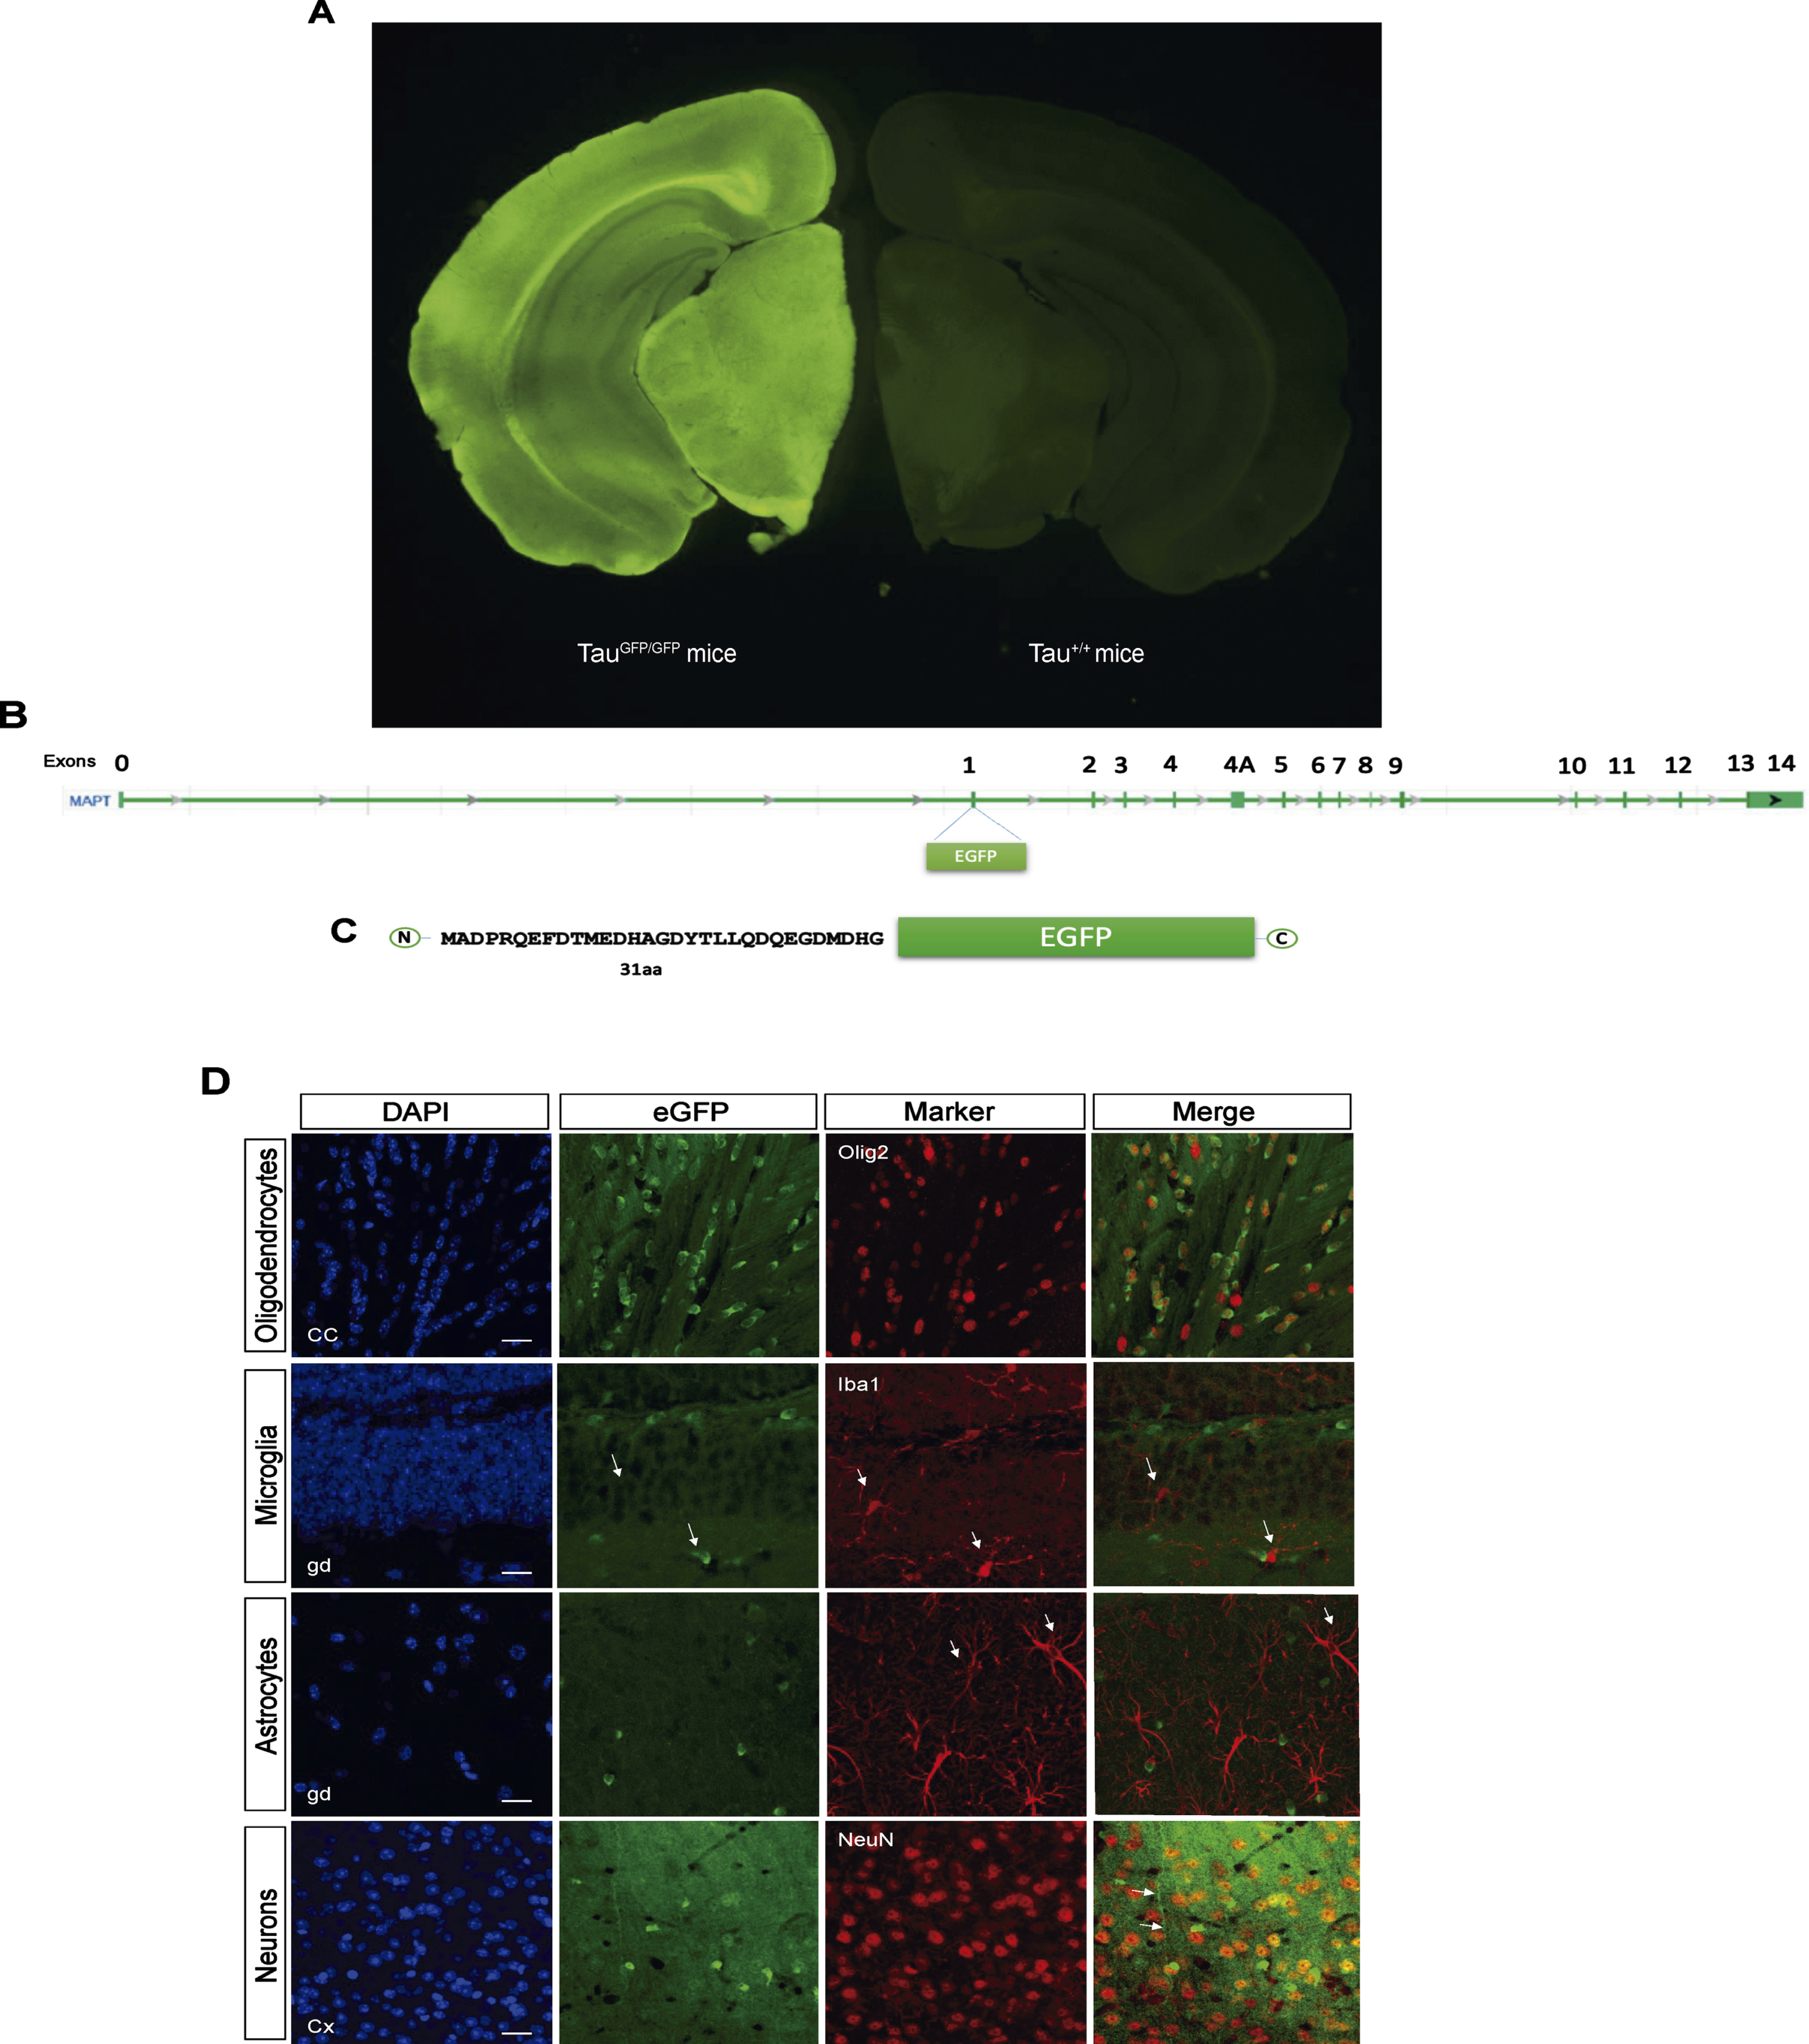
Next, we checked the endogenous expression of tau in different cell types analyzing colocalization of Olig2, NeuN, Iba-1, and GFAP proteins with eGFP. As shown in Fig. 1D, there are endogenous expression in oligodendrocytes and neurons. Nevertheless, there are not endogenous expression of tau in microglia or astrocytes. Interestingly, we can observe that GFP signal in oligodendrocytes is more localized and intense, meanwhile the neuronal signal is diffuse. In the Fig. 1D, it can be observed how the eGFP protein spreads throughout the neuronal cytoplasm, including the axon (arrow in Fig. 1D).
Expression of GFP under endogenous tau promoter during aging in different brain areas
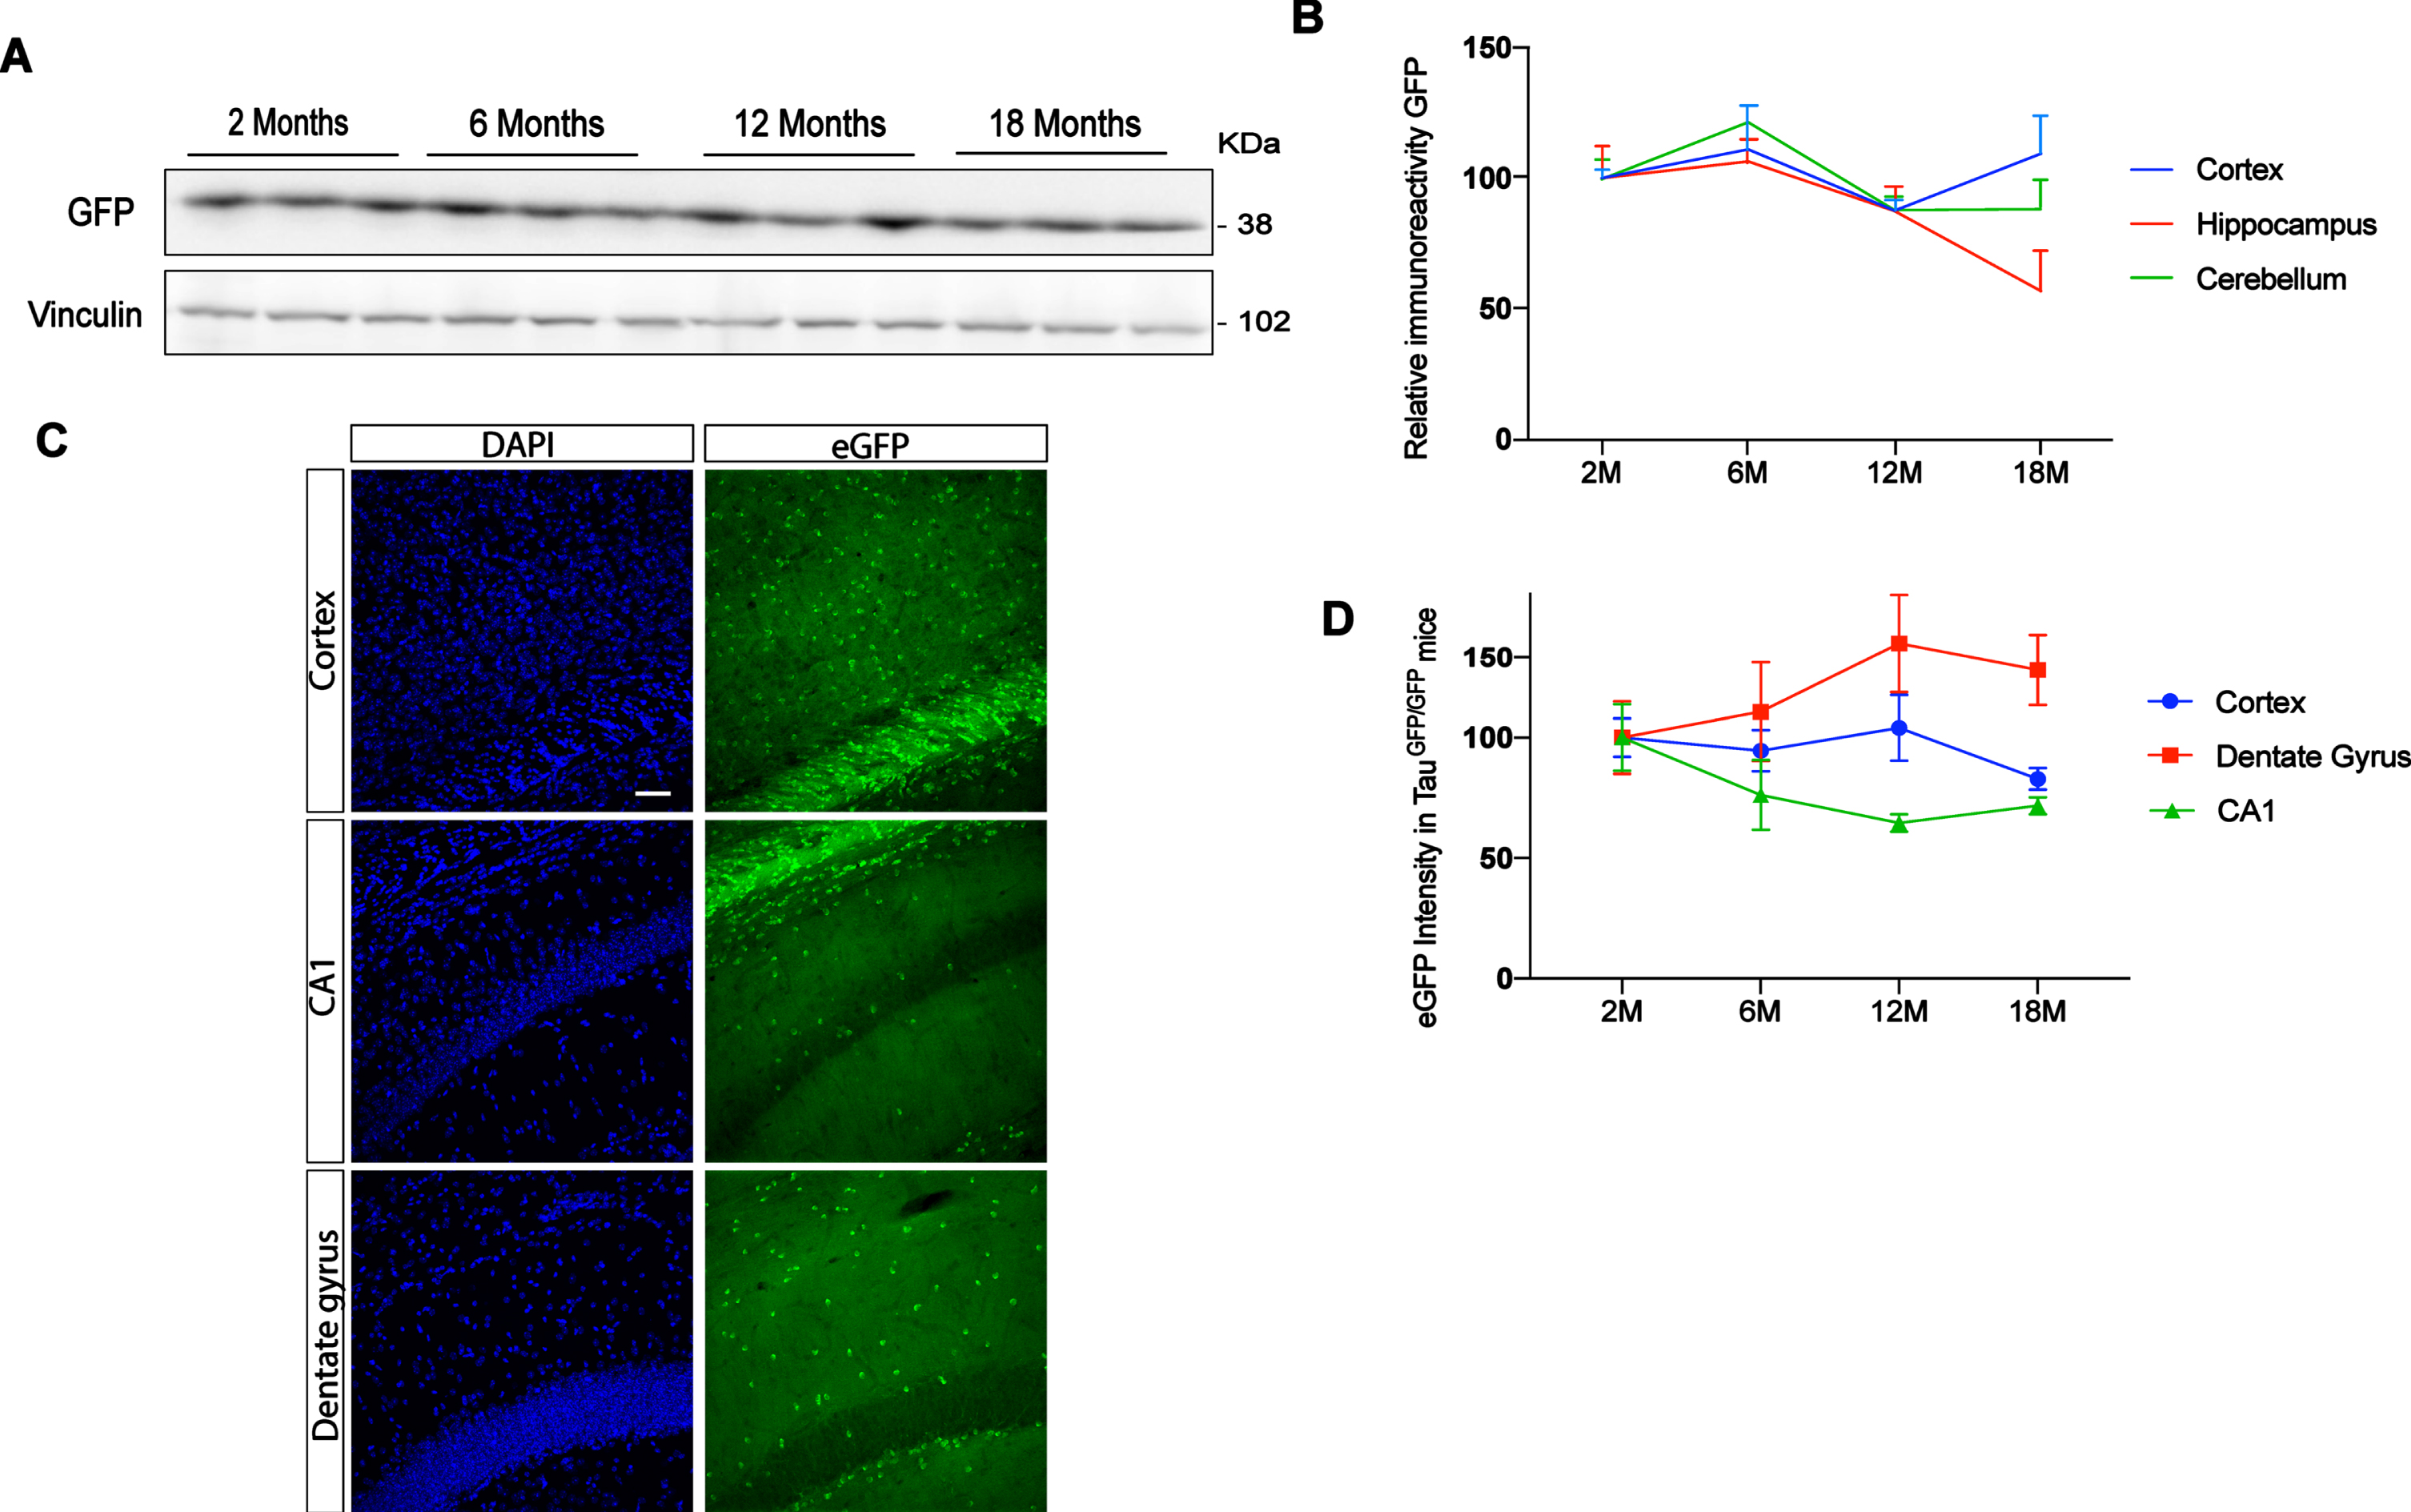
Previous studies have reported differences in tau protein levels in different brain regions [7, 8]. To analyze endogenous tau promotor expression in cortex, hippocampus, and cerebellum, we performed western blot in TauGFP/GFP mice at different ages (2, 6, 12, and 18 months). Figure 2A shows a representative western blot of cortical extracts. Figure 2B shows quantification of eGFP protein present in these brain areas in TauGFP/GFP mice during aging. Expression levels remain constant in all cases suggesting that the endogenous tau promoter in TauGFP/GFP mice do not change with aging in any structure. However, brain samples are complex and western blot does not allow us to analyze gene expression at cellular level. Thus, to analyze in more detail tau promoter expression, we quantified the intensity of eGFP autofluorescence in saggital sections of TauGFP/GFP mice (Fig. 2 C). Thanks to this approach, it has been possible to analyze the dentate gyrus and CA1 separately and not as a whole. Thus, it can be seen that we did not observe significant age-related differences in cortical regions. However, when the hippocampus was analyzed, some differences could be noted. Indeed, a tendency towards increased tau levels with age was observed in the CA1 region while a tendency towards decreased levels was observed in the dentate gyrus. These results suggest that the tau promoter is not expressed at a similar rate in pyramidal and granule neurons.
Fig. 2
Evolution of eGFP protein level in function of aging at 2, 6, 12, and 18 months. A) Representative western blot of cortex at different ages. B) eGFP protein quantification in TauGFP/GFP animals in function of aging in cortex, hippocampus, and cerebellum. C) Representative fluorescence confocal microscopy images in cortex, CA1, and dentate gyrus. The localization of eGFP was determined by direct fluorescence (green) in 12-month-old TauGFP/GFP mice. DAPI staining is shown in blue. Scale bar 20μm. D) eGFP intensity quantification in immunofluorescence sections in cortex and hippocampal region as dentate gyrus and CA1 at 2, 6, 12, and 18 months. To analyze eGFP expression we used 2-month-old mice to normalize the data. Thus, the intensity measured in 2-month-old mice was arbitrarily given a value of 100. The graph shows the mean value±SEM (n = 5–6 per group). No differences were found using two-way ANOVA.
Tau expression in human brain areas
Human MAPT expression by RT-qPCR was analyzed (Fig. 3A) in three different brain regions (hippocampus, cerebellum, and frontal lateral cortex) in control human brains. When analyzing differences between brain regions in non-demented individuals, we found that MAPT expression is consistently maintained on similar levels both across regions, like in mice brain (Fig. 2).
Fig. 3
Differences in expression mRNA of total MAPT and TIR12-MAPT in hippocampus, cerebellum, and frontal lateral cortex. A) Relative expression of total MAPT in human control samples in hippocampus (HPC), cerebellum (CBL), and frontal lateral cortex (FLC) (B) and relative expression of TIR12-MAPT at the same samples. The graphs show the mean value±SEM (n = 3–10). **p = 0.004; ***p = 0.0008) using one-way ANOVA.
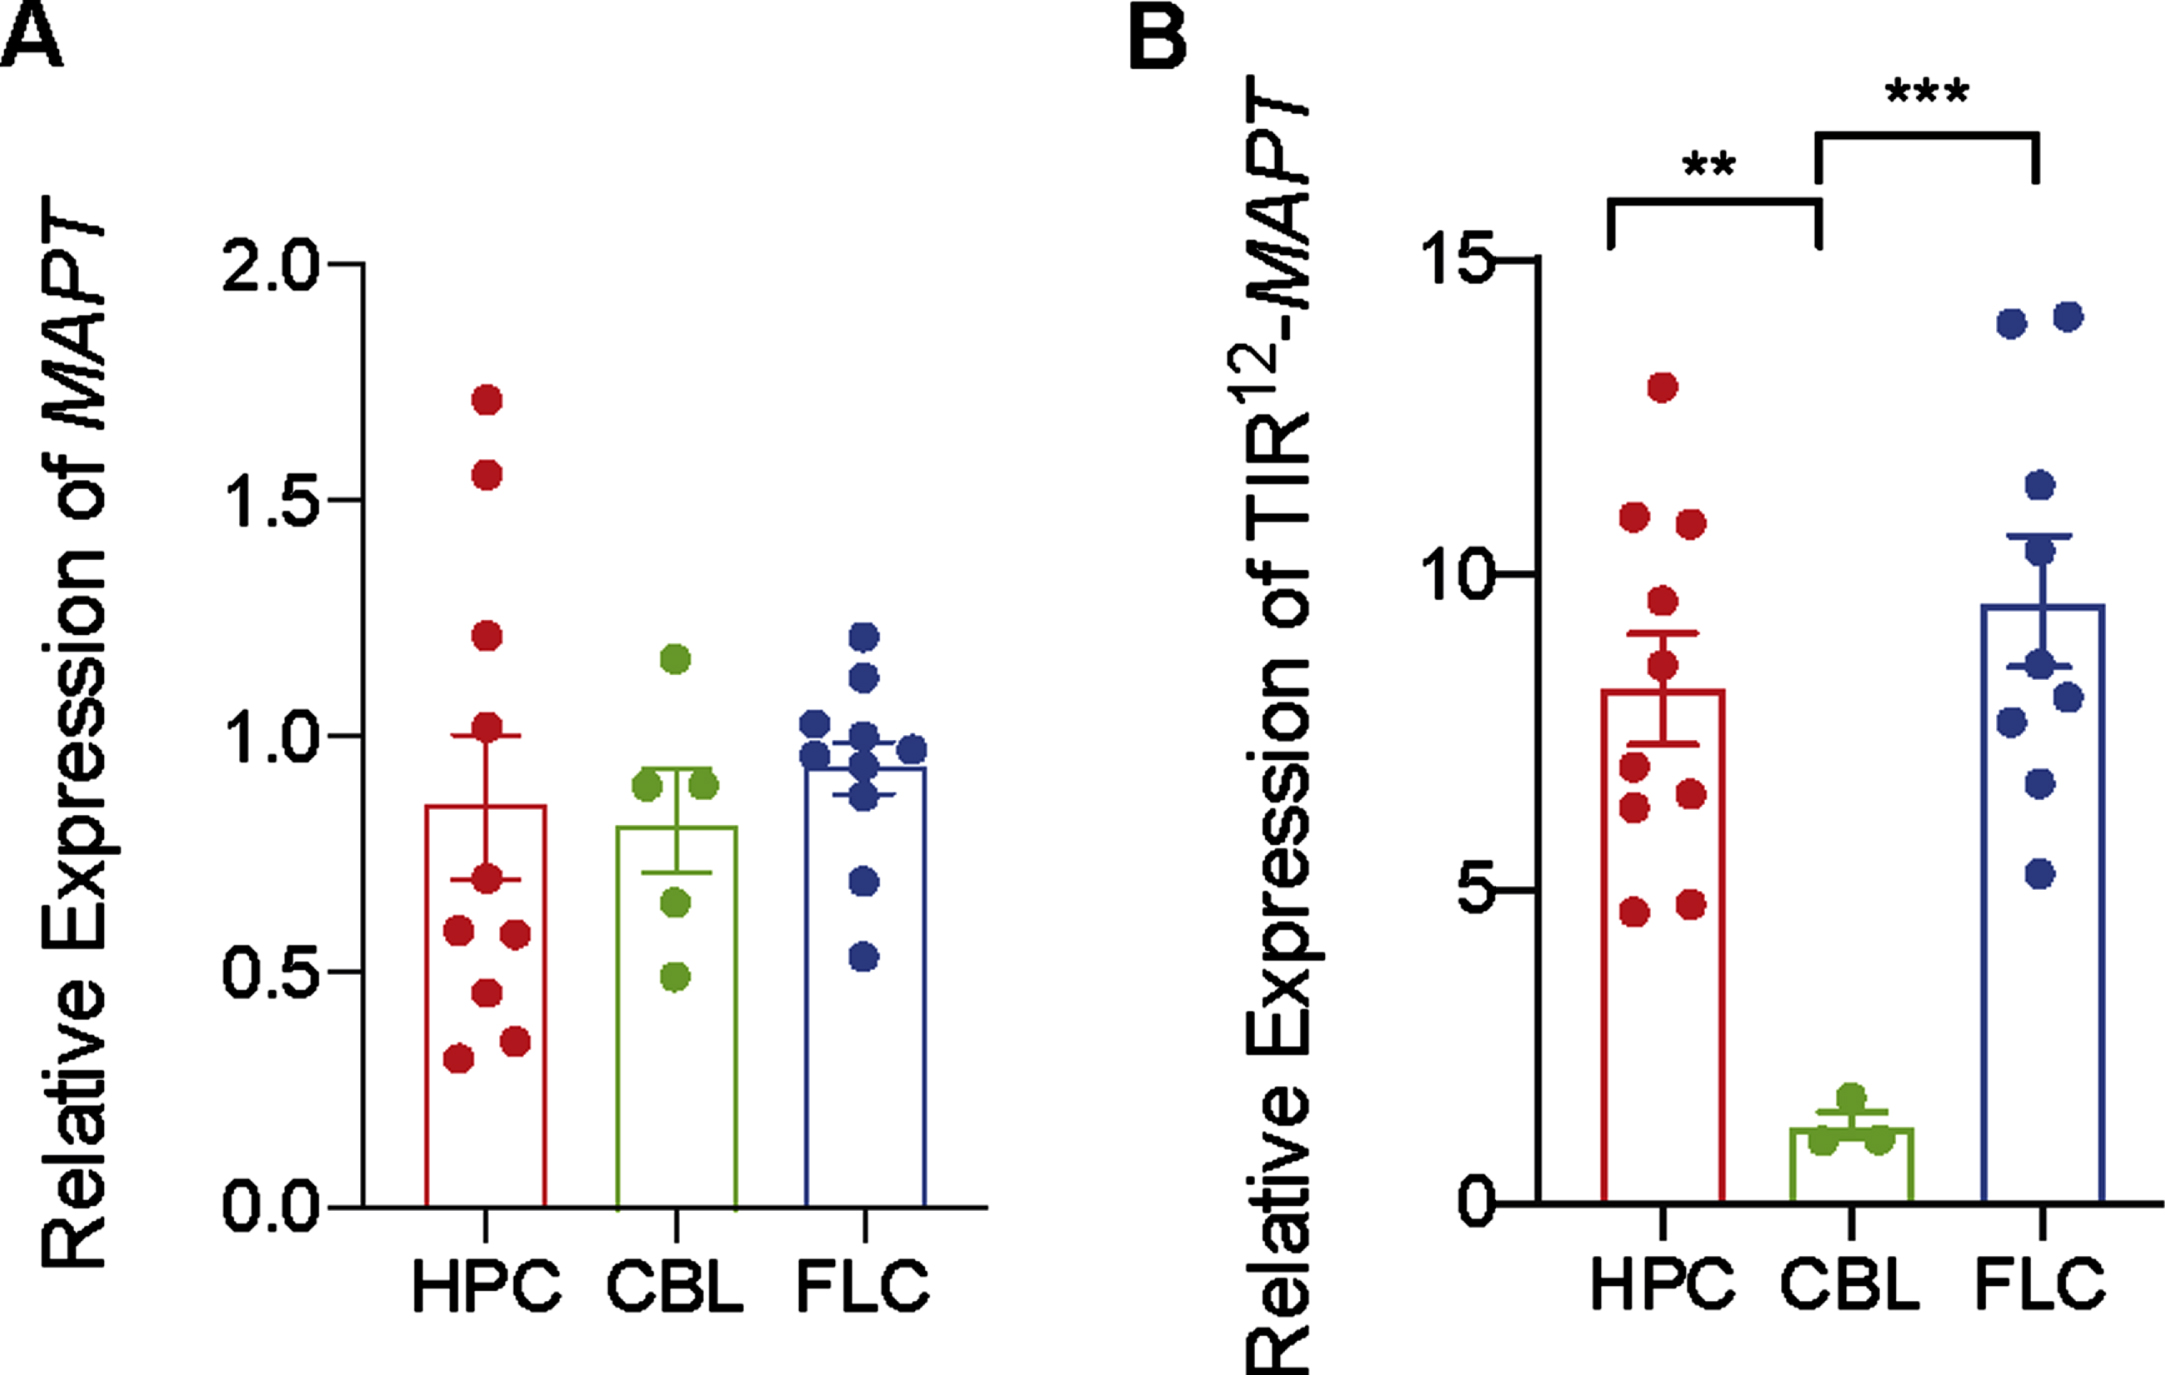
To go one step further, we have measured TIR12-MAPT expression in same samples. TIR12-MAPT has been recently described [10] as a new, human-specific tau isoform, which is generated by intron 12 retention in MAPT. This new tau isoform is able to bind to microtubules and is less prone to aggregate, suggesting a beneficial role in the pathology. As we can see in Fig. 3B, there are significant differences in expression between hippocampal regions, frontal lateral cortex, and cerebellum, being the amount of mRNATIR12 - MAPT lower in cerebellum.
DISCUSSION
The main characteristic of tauopathies is the presence of tau aggregates [2]. Although several factors could be involved in tau polymerization, including post-translational modification of tau protein or external factors [2, 13] which could reduce the critical concentration of tau needed to aggregate in different brain regions; it seems that a critical concentration is needed for tau to aggregate. In this study, using a TauGFP knock-in/knock-out mice, we have studied the Mapt endogenous expression in different brain regions as cortex, hippocampus, and cerebellum during aging.
Attending to western blots of eGFP protein, we found a constant level of endogenous tau promoter activation during aging in all the structures that we analyzed. However, some differences were found in hippocampal subfields using an immunofluorescence approach. Indeed, we observed that the dentate gyrus is the region with most expression of Mapt, compared with CA1. Although there are no significant differences in our results, we notice two interesting findings. First, that CA1, one of the first regions of the brain where tau aggregates appear [4], is the region with less endogenous expression of tau at any age; and second, that both cortex and hippocampus behave the same during aging regarding tau expression, as previously described in rat [14].
Of note, our results demonstrate that the use of the mouse expressing eGFP under endogenous tau promoter to identify the regions for highest transcriptional level of Mapt gene is a specially useful tool that allows to identify the expression of tau gene in other nervous cells in addition to neurons and oligodendrocytes (this research and [15], and in peripheral organs or tissues like kidney [9]).
Results obtained in TauGFP/GFP mice were reproduced in human samples, as mRNA levels for total tau were similar in the hippocampus, cerebellum, and cortex. However, reduced levels of the recently described novel truncated isoform TIR12-MAPT mRNA were found in the cerebellum. Given the potential role of this new tau truncated isoform on a possible AD therapy [10], and taking into account that the cerebellum is not affected in AD [4], more studies will be needed to understand the physiological role of this new tau isoform. However, due to absence of control subjects from cerebellum, samples on very early stages of the disease (Braak I and II stages of tau-related AD pathology) were used in this study and that should be taken into account (Table 1).
To summarize, our results suggest that tau accumulation due to aging is not a problem at the transcriptional level, because the expression is relatively constant at different points during aging and the same can be suggested with respect to different brain areas.
ACKNOWLEDGMENTS
We thank the Confocal Microscopy and Genomic Facilities at CBMSO-CSIC for immunofluorescence and RNA analysis.
FUNDING
Work in the laboratory of JA is funded by grants from the Spanish Ministry of Economy and Competitiveness (PGC-2018-09177-B-100). Work in the laboratory of FH is funded by grants from the Spanish Ministry of Economy and Competitiveness (Ministerio de Economía, Industria y Competitividad, Gobierno de España, PID2020-113204GB-I00) and was co-financed from the Comunidad de Madrid through Structural Funds of the European Union [S2017/BMD-3700 (NEUROMETAB-CM)].
CONFLICT OF INTEREST
George Perry serves as a scientific advisor for and owns equity in Synaptogenix and serves as a scientific advisor for Nervgen. Dr. Perry is also the Editor-in-Chief of this journal but was not involved in the peer-review process nor had access to any information regarding its peer review.
Jesús Avila is an Editorial Board Member of this journal but was not involved in the peer-review process nor had access to any information regarding its peer review.
The remaining authors have no conflict of interest to report.
SUPPLEMENTARY MATERIAL
[1] The supplementary material is available in the electronic version of this article: https://dx.doi.org/10.3233/ADR-220051.
REFERENCES
[1] | Weingarten MD , Lockwood AH , Hwo SY , Kirschner MW ((1975) ) A protein factor essential for microtubule assembly. Proc Natl Acad Sci U S A, 72: , 1858–1862. |
[2] | Avila J , Lucas JJ , Perez M , Hernandez F ((2004) ) Role of tau protein in both physiological and pathological conditions. Physiol Rev 84: , 361–384. |
[3] | Ghetti B , Oblak AL , Boeve BF , Johnson KA , Dickerson BC , Goedert M ((2015) ) Invited review: Frontotemporal dementia caused by microtubule-associated protein tau gene (MAPT) mutations: A chameleon for neuropathology and neuroimaging. Neuropathol Appl Neurobiol 41: , 24–46. |
[4] | Braak H , Braak E ((1991) ) Neuropathological stageing of Alzheimer-related changes. Acta Neuropathol 82: , 239–259. |
[5] | Wegmann S , Biernat J , Mandelkow E ((2021) ) A current view on tau protein phosphorylation in Alzheimer’s disease. Curr Opin Neurobiol 69: , 131–138. |
[6] | Wadhwa P , Jain P , Jadhav HR ((2020) ) Glycogen synthase kinase 3 (GSK3): Its role and inhibitors. Curr Top Med Chem 20: , 1522–1534. |
[7] | Hu W , Wu F , Zhang Y , Gong CX , Iqbal K , Liu F ((2017) ) Expression of tau pathology-related proteins in different brain regions: A molecular basis of tau pathogenesis. Front Aging Neurosci 9: , 311. |
[8] | Santa-Maria I , Hernandez F , Smith MA , Perry G , Avila J , Moreno FJ ((2005) ) Neurotoxic dopamine quinone facilitates the assembly of tau into fibrillar polymers. Mol Cell Biochem 278: , 203–212. |
[9] | Valles-Saiz L , Peinado-Cahuchola R , Avila J , Hernandez F ((2022) ) Microtubule-associated protein tau in murine kidney: Role in podocyte architecture. Cell Mol Life Sci 79: , 97. |
[10] | Garcia-Escudero V , Ruiz-Gabarre D , Gargini R , Perez M , Garcia E , Cuadros R , Hernandez IH , Cabrera JR , Garcia-Escudero R , Lucas JJ , Hernandez F , Avila J ((2021) ) A new non-aggregative splicing isoform of human tau is decreased in Alzheimer’s disease. Acta Neuropathol 142: , 159–177. |
[11] | Tucker KL , Meyer M , Barde YA ((2001) ) Neurotrophins are required for nerve growth during development. Nat Neurosci 4: , 29–37. |
[12] | Bradford MM ((1976) ) A rapid and sensitive method for the quantitation of microgram quantities of protein utilizing the principle of protein-dye binding. Anal Biochem 72: , 248–54. |
[13] | Caillet-Boudin ML , Buee L , Sergeant N , Lefebvre B ((2015) ) Regulation of human MAPT gene expression. Mol Neurodegener 10: , 28. |
[14] | Yu Y , Run X , Liang Z , Li Y , Liu F , Liu Y , Iqbal K , Grundke-Iqbal I , Gong CX ((2009) ) Developmental regulation of tau phosphorylation, tau kinases, and tau phosphatases. J Neurochem 108: , 1480–1494. |
[15] | Villa Gonzalez M , Valles-Saiz L , Hernandez IH , Avila J , Hernandez F , Perez-Alvarez MJ ((2020) ) Focal cerebral ischemia induces changes in oligodendrocytic tau isoforms in the damaged area. Glia 68: , 2471–2485. |

