
Construction of U-Net++ pulmonary nodule intelligent analysis model based on feature weighted aggregation
Abstract
BACKGROUND:
Lung cancer is a malignant tumor originating from the bronchial mucosa or glands of the lung. Early lung cancer patients often have no obvious symptoms, but early detection and treatment have an important clinical significance for prognostic effect. Computed tomography (CT) is one of the important means in the diagnosis of lung cancer. In order to better solve the problem of diagnosis efficiency, and reduce the rate of misdiagnosis and missed diagnosis, computer aided diagnosis are employed in the accurate localization and segmentation of pulmonary nodules through imaging diagnostics, image processing technology, and other clinical means.
OBJECTIVE:
This present study was envisaged to establish an intelligent segmentation model of pulmonary nodules to improve the accuracy of early screening for lung cancer patients.
METHODS:
Compared with the traditional segmentation model of fully convolutional neural network, the U-Net++ algorithm based on feature-weighted integration (WI-U-Net++) effectively utilized the feature weight information, adopted the adaptive weighted method for weighted integration, and performed an intelligent segmentation of the anatomical structure and image details, which was applied in the auxiliary diagnosis of pulmonary nodules in CT images. Standard chest X-ray phantom was selected as CT scanning objects, and 30 spherical and irregular simulated nodules were built into them, respectively. CT images were collected by setting different tube voltage and noise index, and randomly included into the training set, validation set and test set at a ratio of 8:1:1.
RESULTS:
The experimental results showed that the segmentation accuracy of WI-U-Net++ algorithm for spheroid nodules and irregular nodules was 98.75% and 83.47%, respectively, which was better than that of U-Net and U-Net++ algorithm. In the auxiliary diagnosis, the recall rate of the WI-U-Net++ algorithm for spheroid nodules and irregular nodules was 93.47% and 84.52%, respectively. The accuracy of the benign or malignant identification was 80.27%, and the AUC was 0.9342.
CONCLUSION:
U-Net++ algorithm based on feature-weighted integration could improve the segmentation effect of pulmonary nodules. Especially in the case of irregular nodules with malignant signs, the accuracy of clinical diagnosis was significantly improved, and the level of differential diagnosis between benign and malignant was improved.
1.Introduction
Lung cancer is a malignant tumor originating from the bronchial mucosa or glands of the lung. Its clinical symptoms are closely related to the tumor size, type, location, stage, complications and metastasis. Early lung cancer patients often have no obvious symptoms, but early detection and treatment have an important clinical significance for prognostic effect. At present, chest computed tomography (CT) is one of the important means in the diagnosis of lung cancer, and pulmonary nodule screening is often used as a key indicator for the early diagnosis [1]. When the pulmonary nodules are presented as single, well-defined, and possess denser soft tissue shadows with a diameter less than 5 mm, they are mostly benign. Pulmonary nodules with spiculation sign at the edges, adhesion to surrounding tissue, and diameter greater than 6 mm are more likely to be malignant.
With the continuous development of medical imaging technology, CT examination is more and more widely used in lung cancer screening. High resolution CT images not only improve the diagnostic accuracy, but also increase the clinical workload of imaging diagnostic doctors. In order to better solve the problem of diagnosis efficiency, and reduce the rate of misdiagnosis and missed diagnosis, computer aided diagnosis (CAD) are employed in the accurate localization and segmentation of pulmonary nodules through imaging diagnostics, image processing technology, and other clinical means. Further, they analyze the tissue components and morphological characteristics of the lesion area and play an active role in the screening of pulmonary nodules [2]. However, considering the influence of the pulmonary nodule size, morphology, pathology and performance of the CT equipment, traditional image segmentation techniques, such as threshold segmentation, region segmentation, edge segmentation and histogram method, can meet the needs of clinical diagnosis when identifying the region information with regular edges, obvious contrast and relative independence. However, in case of presenting the lesion information with blurred boundaries and poor differentiation, there is a greater chance of misdiagnosis or missed diagnosis by using traditional image segmentation techniques.
In recent years, fully convolutional networks (FCN) have gained extensive attention from researchers and have been gradually applied to the practical research of image processing analysis and intelligent diagnosis [3]. Among them, U-Net is currently the most commonly used artificial intelligence image segmentation algorithm, which has the same Encoder-Decoder structure as FCN. U-Net++ is based on U-Net, which adds a dense structure like convolution layer and integrates the features of the next stage of convolution to balance the efficiency and accuracy of the network [4]. Huang et al. proposed the application of U-Net++ model in CT image segmentation to solve the problem of under-segmentation for infiltrating growth [5]. Gui et al. applied the U-Net++ theory to construct myocardial pathology segmentation model, in order to cope with the difficulties, such as small myocardial pathological images and limited sample size [6]. Sui et al. established a segmentation model for the breast region based on U-Net++ and applied it for intelligent MRI image analysis, achieving a good clinical diagnostic effect [7]. In the present study, the CT images of anthropomorphic chest phantom were taken as the research objects, the U-Net++ network structure was used for feature extraction, and the features of different depth levels were weighted and aggregated to explore the intelligent segmentation methods for different types of pulmonary nodules. Our study can provide a reference for improving the accuracy and the processing efficiency of the clinical pulmonary nodules segmentation.
2.Method
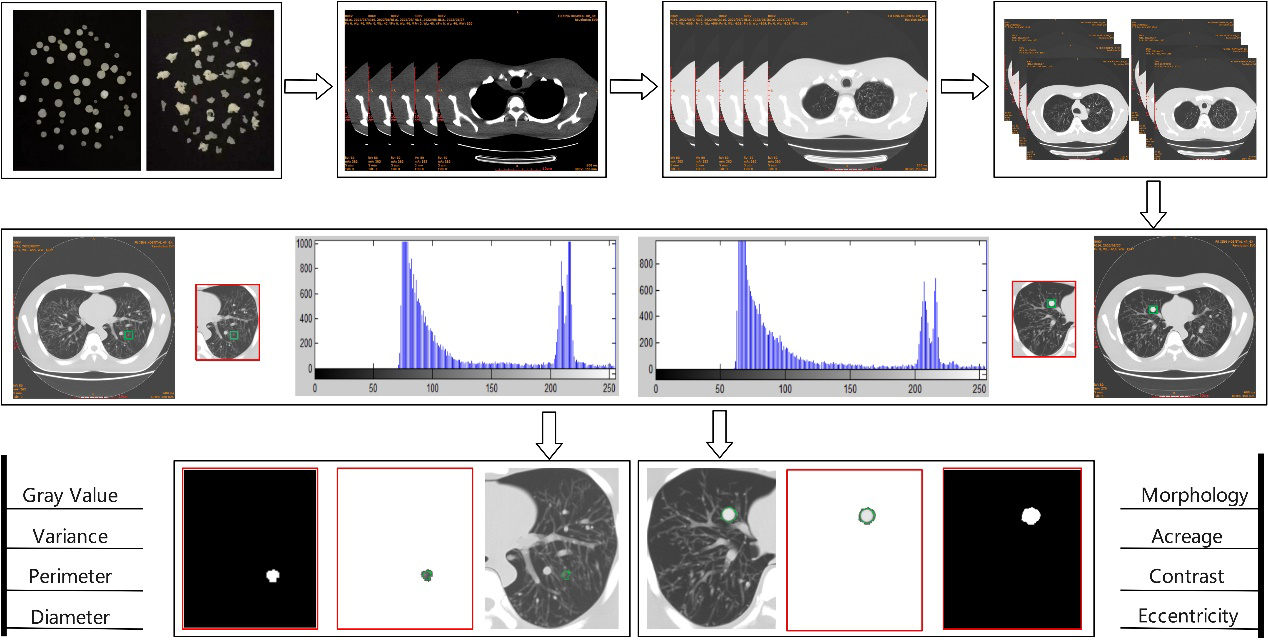
Feature enhancement, extraction and classification are the key points in the early screening of pulmonary nodules and the identification of benign or malignant tumors. In this study, following the standardized process of image-aided diagnosis and referring to the relevant theories of image morphological processing technology, the intelligent analysis model of CT images of pulmonary nodules was divided into three stages: image preprocessing, segmentation and auxiliary diagnosis. The specific analysis path is shown in Fig. 1. Firstly, the simulated nodules for experiment were prepared, CT images were collected, training and test samples were screened, and the contrast and sharpness were enhanced. Subsequently, the training samples were manually labeled, and the combination of feature-weighted integration and U-Net++ algorithm was used to segment the pulmonary nodules. The weighted integration U-Net++ model (WI-U-Net++) was constructed and its reliability was evaluated. Finally, the characteristic information of pulmonary nodules was extracted to observe the accuracy of the auxiliary diagnosis in lung cancer.
Figure 1.
Algorithm flow of intelligent analysis model of pulmonary nodules.
2.1Image preprocessing
2.1.1Preparation of simulated nodules
Simulated nodules were prepared by the drip method. Paraffin wax was used as a substrate, and different proportions of magnesium oxide powder were doped to adjust the CT value, so that the CT value was in the soft tissue density domain (20
2.1.2Image enhancement processing
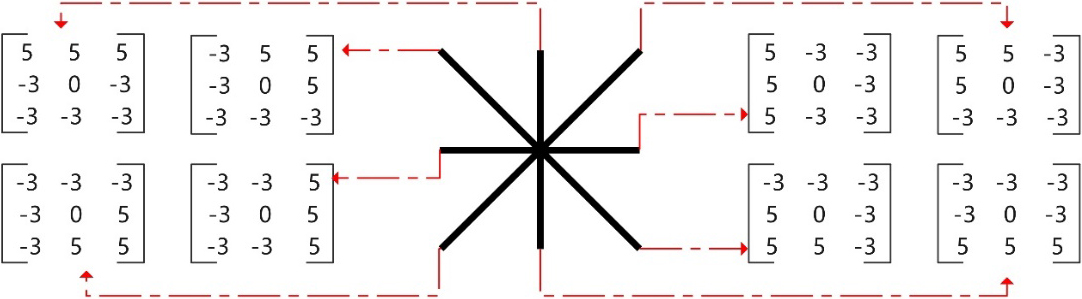
CT images were adjusted to display lung window (WL: -600HU, WW: 1500HU) and DICOM format was converted to TIFF format. The images of the internal pulmonary nodules display layer were included in the study objects and they were numbered according to the type, location and size of nodules. Image enhancement processing included contrast enhancement and edge enhancement. Contrast enhancement adopted Contrast Limited Adaptive Histogram Equalization (CLAHE), which could realize image contrast enhancement, while suppressing the image noise. The edge enhancement adopted the nonlinear edge detector-Kirsch operator, which could find the maximum edge intensity in multiple predetermined directions, that is, different modules were used to carry out the convolution operation on image pixels, and the maximum response value was selected for edge enhancement output [8]. In this study, an 8-module edge enhancement processing model was adopted, as shown in Fig. 2.
Figure 2.
Kirsch operator edge enhancement processing model.
2.2Image segmentation
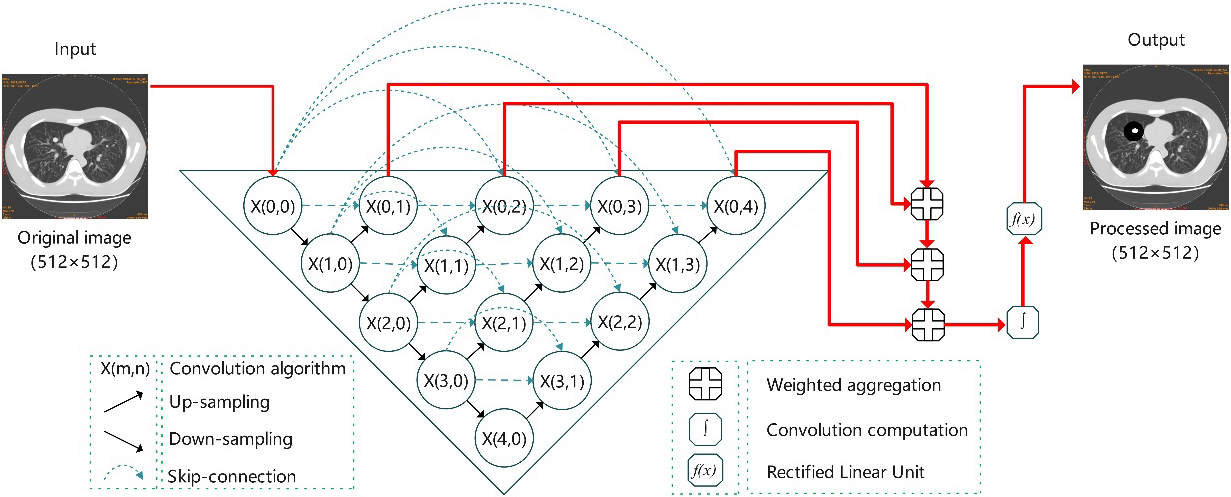
The purpose of image segmentation is to divide the original image into several specific areas, and classify the areas of interest to assist doctors to diagnose the shape and size of the lesion, which is a commonly used intelligent analysis technology in the field of medical image processing. U-Net++ is an improved model based on U-Net. During training, the output of convolutional layers can be added at different depths to realize the full convolutional network of single input and four outputs. Based on the feature-weighted integration algorithm, the U-Net++ segmentation model for pulmonary nodules was constructed in the present study, as shown in Fig. 3. The U-Net++ network extracted the information of different sampling layers. Subsequently, through training and learning, weighted integration and detailed reconstruction of the layered images was carried out to provide an output of segmented images.
Figure 3.
U-Net++ segmentation model based on feature weighted integration.
2.2.1U-Net++ network framework
Due to the geometric irregularity, random location distribution and large size difference of the pulmonary nodules in CT images, not only the deepest feature information was extracted, but also the superficial feature information was integrated in the process of 4 times down-sampling and 4 times up-sampling of the U-Net++ network. As a result, the learning ability of segmentation model was improved and the segmentation positioning of pulmonary nodules was more accurate. Let
(1)
where,
2.2.2Weighted integration
U-Net++ network integrates the feature information of different levels, but these features have different contributions in the prediction label of the model, and the clinical diagnostic information contained in different features is often different. Therefore, the traditional U-Net++ model adopts the average fusion method to limit the further improvement of the accuracy rate of segmentation for pulmonary nodules. Based on the U-Net++ network framework, an adaptive training module was added in this study. When the importance of features at a certain level is higher, the information weight is larger; else, the information weight becomes lower. Based on the different weights, the weighted integration was carried out for the segmentation images with different depths to obtain the weighted segmentation images. In this study, four layers of features were extracted, and the calculation method of image segmentation is shown in Eq. (2):
(2)
where,
2.2.3Detail reconstruction
In the up and down sampling in U-Net++ network, some details of the anatomical structure and lesion information of CT images can be lost. Therefore, in this study, a detail reconstruction module was added based on feature-weighted integration [9]. The original images and the segmented images of each layer were combined in stages, and the convolution layer of ReLU (Rectified Linear Unit) activation function was adopted to effectively transmit the original image information, eliminate the noise that appeared after the enhanced background area, and obtain the segmented images of pulmonary nodules with high quality details [10].
2.3Auxiliary diagnosis
The geometric features, physical features and morphological signs of the pulmonary nodules in CT images are the key factors for the preliminary screening of malignant tumors [11]. The imaging features selected in this study include Gray value, Gray variance, Perimeter, Diameter, Morphology, Area, Contrast and Eccentricity, as shown in Table 1. Among them, the physical features reflect the gray distribution characteristics, uniformity degree and asymmetry degree of the region of interest; the geometric features reflect the pixel distribution pattern, including the roughness of the tissue surface and the degree of shape irregularity. The morphological signs presents the analysis of the specific morphology of pulmonary nodules from the perspective of benign or malignant tumor diagnosis, including spiculation and lobulation sign.
Table 1
Selection of the diagnostic features for pulmonary nodules in CT images
| Category | Feature information |
|---|---|
| Physical features | Calculate gray histogram: mean gray value, gray variance; Measure the contrast |
| Geometric features | Extract the area of pulmonary nodules: Perimeter, Diameter, Area, Eccentricity |
| Morphological signs | Whether there are spiculation sign or lobulation sign of pulmonary nodules |
The spiculation sign and the lobulation sign is the main sign of malignant pulmonary nodules, and in the present study, the irregularity ratio (IR) was used to evaluate the degree of malignancy of pulmonary nodules, as shown in Eq. (3):
(3)
where,
3.Data acquisition
GE Revolution evo CT was used as image acquisition equipment, AW4.7 was used as image processing workstation and PH-2B chest X-ray phantom was used as the examination objects. According to the anatomical location of the phantom, a total of 60 simulated nodes (30 in class A and 30 in Class B) with different CT values and diameters were uniformly placed in each pulmonary lobe and segment. The phantom was placed in the center of the CT scanning bed and positioned horizontally in the mid-axillary line. The scanning range was from the apex pulmonis to the basis pulmonis. The tube voltages were set at 80 kV, 100 kV, 120 kV and 140 kV, respectively, the Noise Index was NI10
Table 2
Comparison of segmentation effects of different algorithms for pulmonary nodules
| Algorithm | Spheroid nodules (A) | Irregular nodules (B) | ||||
|---|---|---|---|---|---|---|
| Segmentation accuracy | False-negative rate | False-positive rate | Segmentation accuracy | False-negative rate | False-positive rate | |
| U-Net | 97.88% | 0.33% | 1.79% | 70.58% | 14.47% | 14.95% |
| U-Net++ | 98.49% | 0.19% | 1.32% | 79.61% | 7.67% | 12.72% |
| WI-U-Net++ | 98.75% | 0.00% | 1.25% | 83.47% | 5.42% | 11.11% |
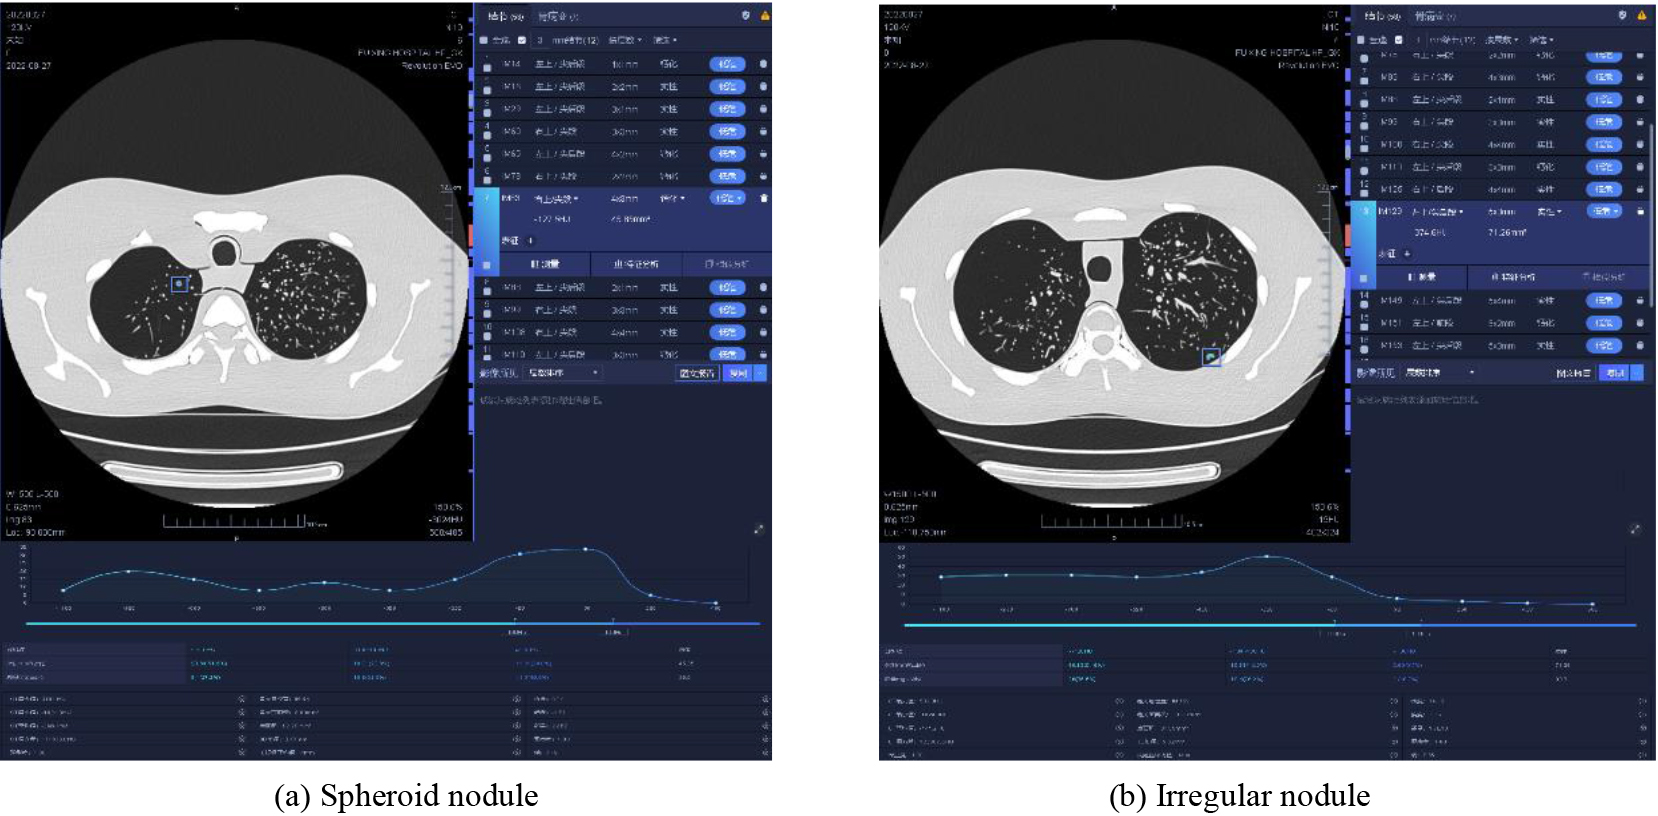
Figure 4.
AI recognition of pulmonary nodules in different types of CT images.
4.Results
4.1Segmentation effect of pulmonary nodules
The experimental results of comparison of U-Net algorithm, U-Net++ algorithm and weighted integration U-Net++ algorithm are shown in Fig. 5. Figure 5a–e show the original images, standard images of the simulated nodules, U-Net segmentation images, U-Net++ segmentation images and weighted integrated U-Net++ segmentation images, respectively. The corresponding value of the image is segmentation accuracy (A), which is the ratio (A1/A2) of the overlapping part of the segmented area and the standard area (A1) to the merging part of the segmented area and the standard area (A2). Among them, the standard image of simulated nodule is marked by senior professional radiologists according to the size and characteristics of the built-in nodule.
Figure 5.
Segmentation effect of different algorithms on pulmonary nodules.
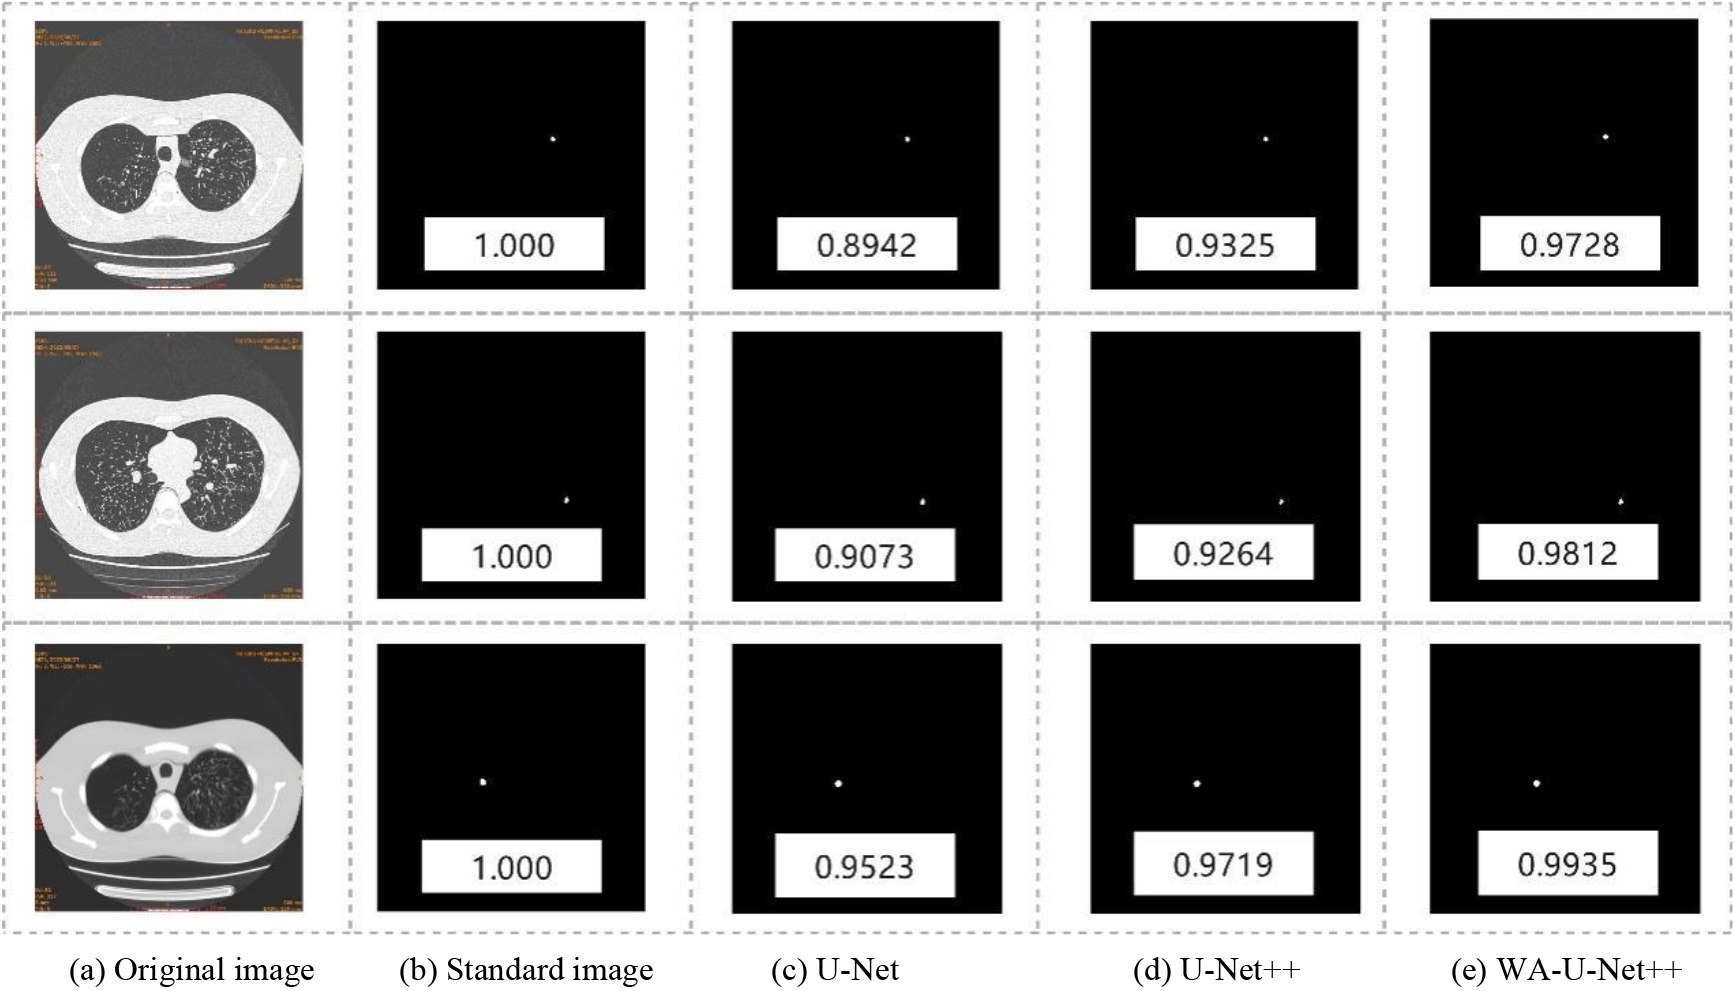
As shown in Fig. 5, the WI-U-Net++ algorithm was found to be more conducive to the segmentation for the details and the fuzzy edge structure of pulmonary nodules. Compared with other methods, its segmentation effect was closer to the standard images of the simulated nodules, effectively avoiding the phenomenon of under-segmentation and over-segmentation, and the segmentation accuracy was significantly improved.
Meanwhile, this study analyzed the effectiveness of the algorithm through the segmentation accuracy, false-negative rate and false-positive rate of different types of nodules, and the results are shown in Table 2. The WI-U-Net++ algorithm exhibited a segmentation accuracy of 98.75%, false-positive rate and false-negative rate of 0.00% and 1.25%, respectively, for spheroid nodules (type A), and a segmentation accuracy of 83.47%, false-positive rate and false-negative rate of 5.42% and 11.11%, respectively, for irregular nodules (type B). These results indicate that WI-U-Net++ algorithm could improve the level of intelligent analysis of pulmonary nodules, especially for the irregular nodules with malignant signs, and its clinical application value is more obvious.
4.2Diagnostic level of pulmonary nodules
The C4.5 decision tree algorithm was used to conduct the model training on the CT image-assisted diagnosis data. The optimized evaluation model was obtained through parameter adjustment, and the test samples were brought into the model to form the diagnosis results. According to the sign criteria of different types of simulated nodules, the accuracy rate of identifying the type as benign or malignant, the recall rate of different types of simulated nodules, and the area under ROC curve (AUC) of test samples were calculated. Meanwhile, the diagnostic level of pulmonary nodules in intelligent segmentation model was evaluated. After parameter adjustment and optimization, when the recall rate of spheroid nodules (type A) was 93.47%, and the recall rate of irregular nodules (type B) was 84.52%, the accuracy rate of the identification of benign or malignant was 80.27%. The model exhibited a good stability and classification effect, and the AUC was 0.9342. It can be seen that the C4.5 decision tree model achieved a good auxiliary diagnosis effect, but in clinical application, the recall rate and accuracy rate should be balanced to avoid reducing the performance of other diagnoses when the performance of a single diagnosis is improved.
5.Conclusion
Lung cancer is one of the most common malignant tumors in clinic, and its CT images show solitary nodules. The texture of benign nodules is relatively uniform, and the grain difference is small, so the images have uniform gray distribution. However the tissue complexity of malignant nodules is high, and the edge structure is irregular. Morphological features are important indicators in imaging diagnosis [12]. With the continuous development of image processing technology, the auxiliary diagnosis software of pulmonary nodules has been applied to a wider extent in the clinic, thereby becoming an important tool in the clinical diagnosis of radiology department. However, the parameters, performance and universality of the software are still different, and the construction of intelligent analysis models for different clinical application purposes has become a research hotspot in this field [13, 14] A major difference in the clinical diagnosis methods and the intelligent analysis model is that the latter only extracts feature information from images, and fails to refer to patient complaints, clinical symptoms, medical history and other information, which is insufficient in analyzing information such as vacuoles and calcification inside nodules. This remains an important research direction to improve the clinical diagnosis value of the machine learning algorithm.
Due to many uncertain factors in the occurrence and development of the pulmonary nodules, CT images can merely display the anatomical structure information within the body layer, but cannot effectively analyze the characteristics of the spatial nodules. In comparison of the segmentation accuracy of the infiltrating pulmonary nodules among U-Net, U-Net++ and other segmentation algorithms in this research field, a significant improvement was observed in the U-Net++ algorithm based on feature weighted aggregation combined with the semantic information corresponding to the features of each layer to improve the definition of the boundary.
In this study, phantom and simulated nodules were used as research objects. The main advantages are as follows: (1) Standard images provide an important reference for the analysis of results, and improve the reliability of the research results. (2) By setting different CT scanning parameters, the phantom can be scanned repeatedly and the obtained image quality is different, which provides enough sample size for the study. (3) The simulated nodules were randomly set according to different shapes, reflecting the diversity of samples and providing sufficient sample size for model training. The results showed that the U-Net++ algorithm based on the feature-weighted integration improved the segmentation effect of pulmonary nodules, especially for irregular nodules with malignant signs. The accuracy of the clinical diagnosis was significantly improved, and the level of diagnosis for benign and malignant differential was improved. We believe that the proposed the U-Net++ algorithm can be an auxiliary diagnostic method with important application value in the intelligent analysis of pulmonary nodules.
In this study, the responses of the auditory system to stimulus of oval and round window were compared with animal experimentation using four Guinea pig. In order to apply the identical vibration stimulus to oval and round window, round window niche was sufficiently drilled out for securing contact area and approaching angle between tip and round window was adjusted with micro-manipulator. After applying the same stimulus with oval and round window, the generated ABR signals were acquired, and the average value of the ABR threshold was compared. And then, the lumped parameter model was proposed that reflects the physical characteristics of the middle-ear and cochlear. In the case of the cochlear, the multi-layered membrane separating scala vestibuli and scala tympani was assumed to be a single membrane. In order to reflect the vibration characteristics of the reverse stimulus, the lumped parameter model was designed in consideration of the helicotrema. The simulated results showed similar to that of animal experiments. The stapes velocity induced to the oval window driving is higher than that in round window driving, and difference of the stapes velocity between oval window and round window increased as frequency increased. As the results of the experiment and simulation, it was confirmed that asymmetrical results were shown according to the stimulus direction. Therefore, the proposed lumped parameter model will be helpful in representing actual biometric characteristics. This model will be useful to understand the cochlear response in round window stimulation.
Conflict of interest
None to report.
References
[1] | Ruparel M, Janes SM. CT screening for lung cancer. Trends in Urology & Men’s Health. (2020) ; 11: (6): 26-28a. |
[2] | Matthew B, Patrick BM, Wasil WA, Mitchell M, Jayson D, Hayit G, Fereidoun A, Shahnaz G, Nazanin Y, Irene DC, Moshe B, Jonathan G. Integration of Chest CT CAD into the Clinical Workflow and Impact on Radiologist Efficiency. Academic Radiology. (2019) ; 26: (5): 626-631. |
[3] | Xu JC, Liu JN, Zhang DZ, Zhou ZJ, Jiang XY, Zhang CP, Chen XJ. Automatic mandible segmentation from CT image using 3D fully convolutional neural network based on DenseASPP and attention gates. International Journal of Computer Assisted Radiology and Surgery. (2021) ; 16: (10): 1-10. |
[4] | Gargari MS, Seyedi Mir H, Alilou M. Segmentation of Retinal Blood Vessels Using U-Net++ Architecture and Disease Prediction. Electronics. (2022) ; 11: (21): 3516-3516. |
[5] | Huang H, Lu RF, Tao JL, Li Y, Zhang JQ. Segmentation of Lung Nodules in CT Images Using Improved U-Net++. ACTA PHOTONICA SINICA. (2021) ; 50: (2): 73-83. |
[6] | Cui HF, Li Y, Jiang L, Wang YF, Xia Y, Zhang YN. Improving myocardial pathology segmentation with U-Net++ and EfficientSeg from multi-sequence cardiac magnetic resonance images. Computers in Biology and Medicine. (2022) ; 151: (Pt A): 106218-106218. |
[7] | Sui D, Huang ZX, Song XW, Zhang Y, Wang YT, Zhang L. Breast Regions Segmentation Based on U-Net++ from DCE-MRI Image Sequences. Journal of Physics: Conference Series. (2021) ; 1748: (4): 042058. |
[8] | Adu K, Yu YB, Cai JY, Mensah PK, Owusu AK. MLAF-CapsNet: Multi-lane atrous feature fusion capsule network with contrast limited adaptive histogram equalization for brain tumor classification from MRI images. Journal of Intelligent & Fuzzy Systems. (2021) ; 41: (2): 3933-3950. |
[9] | Li G, Zhang HX, Linning E, Zhang L, Li Y, Zhao JM. Recognition of honeycomb lung in CT images based on improved MobileNet model. Medical Physics. (2021) ; 48: (8): 4304-4315. |
[10] | Bogoi S, Udrea A. A Lightweight Deep Learning Approach for Liver Segmentation. Mathematics. (2022) ; 11: (1): 95-95. |
[11] | Yin J, Qiu JJ, Qian W, Ji L, Yang D, Jiang JW, Wang JR, Lan L. A radiomics signature to identify malignant and benign liver tumors on plain CT images. Journal of X-ray Science and Technology. (2020) ; 28: (4): 683-694. |
[12] | Liang G, Yu W, Liu SQ, Xie MG, Liu M. The value of radiomics based on dual-energy CT for differentiating benign from malignant solitary pulmonary nodules. BMC Medical Imaging. (2022) ; 22: (1): 95-95. |
[13] | Xia KJ, Yin HS, Jin Y, Qiu S, Zhao HR. Cross-Domain Brain CT Image Smart Segmentation via Shared Hidden Space Transfer FCM Clustering. ACM Transactions on Multimedia Computing Communications and Applications. (2020) ; 16: (2s): 1-21. |
[14] | Sourlos N, Wang JX, Nagaraj Y, Van OP, Vliegenthart R. Possible Bias in Supervised Deep Learning Algorithms for CT Lung Nodule Detection and Classification. Cancers. (2022) ; 14: (16): 3867-3867. |

