
Data cleaning survey and challenges – improving outlier detection algorithm in machine learning
Abstract
Data cleaning, also referred to as data cleansing, constitutes a pivotal phase in data processing subsequent to data collection. Its primary objective is to identify and eliminate incomplete data, duplicates, outdated information, anomalies, missing values, and errors. The influence of data quality on the effectiveness of machine learning (ML) models is widely acknowledged, prompting data scientists to dedicate substantial effort to data cleaning prior to model training. This study accentuates critical facets of data cleaning and the utilization of outlier detection algorithms. Additionally, our investigation encompasses the evaluation of prominent outlier detection algorithms through benchmarking, seeking to identify an efficient algorithm boasting consistent performance. As the culmination of our research, we introduce an innovative algorithm centered on the fusion of Isolation Forest and clustering techniques. By leveraging the strengths of both methods, this proposed algorithm aims to enhance outlier detection outcomes. This work endeavors to elucidate the multifaceted importance of data cleaning, underscored by its symbiotic relationship with ML models. Furthermore, our exploration of outlier detection methodologies aligns with the broader objective of refining data processing and analysis paradigms. Through the convergence of theoretical insights, algorithmic exploration, and innovative proposals, this study contributes to the advancement of data cleaning and outlier detection techniques in the realm of contemporary data-driven environments.
1.Introduction
Data can serve as the driving force behind a successful business or as a source of valuable insights to inform strategic campaigns, product launches, and experiments. In fact, all these endeavors are interconnected by one key element: data. In today’s digital era, we generate vast amounts of data on a daily basis, with companies like Flipkart producing over 2TB of data per day. Simply put, data is a systematic collection of digital information in the form of facts and figures extracted from digital interactions. Therefore, before delving into data cleaning, it is essential to understand the main stages of the data life cycle.
Data ecosystem refers to the programming languages, algorithms, packages, cloud-computing services, and general infrastructure an organization uses to collect, store, analyze, and leverage data. There aren’t two data projects similar; each has its own opportunities, challenges, and potential solutions that affect its path. almost all data projects, nevertheless, follow the same basic life cycle from beginning to end. This life cycle can be divided into eight principal phases: Generation, Collection, Processing, Storage, Management, Analysis, Visualization, and Interpretation. However, in this particular endeavor, our emphasis has been placed on the crucial stage of data cleaning [1].
Collecting data from multiple sources is a crucial step in constructing big data repositories to power applications or performing data analysis to obtain richer insights. However, errors such as missing values, typos, mixed formats, repeated entries, and violations of data integrity rules are common during data gathering and acquisition. According to a poll on the state of data science and machine learning (ML), unclean data is the most significant challenge faced by data professionals [2]. As data science gains popularity, it has become clear that data curation, unification, preparation, and cleaning are essential for unlocking the value of data. A survey of 80 data scientists conducted by CrowdFlower and published in Forbes revealed that three data scientists spend more than 60% of their time cleaning and organizing data, and 57% of them consider it the least enjoyable part of their job. Finding effective and efficient data cleaning methods is challenging and poses theoretical and engineering difficulties. Data cleaning is a critical step in the data analysis process, and it is closely related to data collection because the quality of the data being collected will ultimately determine the level of effort required for data cleaning [3].
Data cleaning is the process of identifying and rectifying corrupt or inaccurate records within a dataset, table, or database. It involves detecting incomplete, erroneous, inaccurate, or irrelevant data, and then modifying, replacing, or deleting the affected data. In essence, data cleaning encompasses all tasks and activities related to identifying and resolving errors in data [4]. The aim of data cleaning is to ensure that a dataset is consistent with other similar data sets within the system. Errors in the data may arise due to mistakes in user input, corruption during transmission or storage, or discrepancies in data definitions across different data stores. Data cleaning is different from data validation in that validation typically involves rejecting data at the time of entry, whereas data cleaning is carried out during data entry rather than after data has been entered in batches [5].
In this paper, we delve into the critical task of data cleaning and outlier detection. The first section underscores the significance of data, outlines the primary stages of the data ecosystem, and elucidates the role of data cleansing within the realms of data science and machine learning. The second section provides an overview of data cleaning, including its process, tasks, and challenges. In the third section, we explore the different types and applications of outlier detection, as well as its role in machine learning and the various types of supervision used. We also classify outlier detection techniques and discuss their advantages and disadvantages. Moving on to the fourth section, we present a detailed analysis of outlier detection algorithms, including a comparative analysis of some major algorithms. We also propose a new algorithm based on clustering and Isolation Forest and explain its implementation. Finally, in the last section, we conduct experiments to validate the performance of Isolation Forest and our proposed algorithm. We provide results and discussions on the efficacy of each method. Through this paper, we aim to provide a comprehensive understanding of data cleaning and outlier detection, as well as a practical solution for improving outlier detection algorithms.
2.Related work
Many research endeavors delve into the realm of data cleaning and outlier detection algorithms, yet our focus rests on selecting the most crucial ones that encapsulate the breadth of research and studies in this domain. The following is a selection of notable articles that contribute to this discourse: E Rahm et al. [6] delve into the intricacies of data cleaning: problems and current approaches, while H Müller et al. [7] provide insights into problems, methods, and challenges in comprehensive data cleansing. The work of Xu et al. [8] sheds light on data cleaning in the process industries, while Chu et al. [9] expound upon data cleaning: overview and emerging challenges. Ridzuan et al. [10] engage in a review on data cleansing methods for big data. Additionally, Xu et al. [4] provide insights into data cleaning tasks, Pahuja et al. [11] present a review on outlier detection for different applications, and Zhang [12] provides a comprehensive survey of advancements in outlier detection. Moreover, Divya et al. [13] delve into methods to detect different types of outliers, Mandhare et al. [14] provide a comparative study of Cluster-Based outlier detection, Distance-Based outlier detection and Density-Based outlier detection techniques, Wang et al. [15] provide an ongoing survey of progress in outlier detection techniques, while Karczmarek et al. [16] explore a Fuzzy c-means-based isolation forest. Lastly, the work of Mensi et al. [17] uncovers Enhanced Anomaly Scores for Isolation Forests. This collective literature covers also emphasizes the integration of clustering methods with other algorithms to achieve optimal results in outlier detection. Furthermore, numerous books extensively delve into the realm of utilizing machine learning for data cleaning and detecting outliers. Notable works that deserve mention include Outliers Analysis, Second Edition authored by Charu et al. [18], the comprehensive work Data Cleaning realized by Ihab et al. [4], and the volume Data Preparation for Machine Learning, which covers data cleaning, feature selection, and data transformations in Python, crafted by Brownlee [5]. These literary works serve as valuable sources that provide substantial emphasis on effectively incorporating machine learning methodologies to address data cleaning and outlier detection challenges.
3.Data cleaning
Processed and organized data may contain duplicates, obsolete information, missing values, or errors. When combining multiple data sources, there are numerous opportunities for data to be duplicated or mislabeled. Inaccurate data can lead to unreliable algorithms and outcomes. Data cleaning is a critical process in data analysis as it ensures that data is free from inaccurate or corrupt information, ultimately improving the overall quality of the data. Data quality issues can arise not only in single data sets, such as files and databases, but also in multiple data sources, such as data warehouses, federated database systems, or global web-based information systems. Consequently, the need for data cleaning has become increasingly important. As the process of data cleaning differs from dataset to dataset, there is no single absolute way to determine the exact steps involved [6,10,19,20].
3.1.Data cleaning process
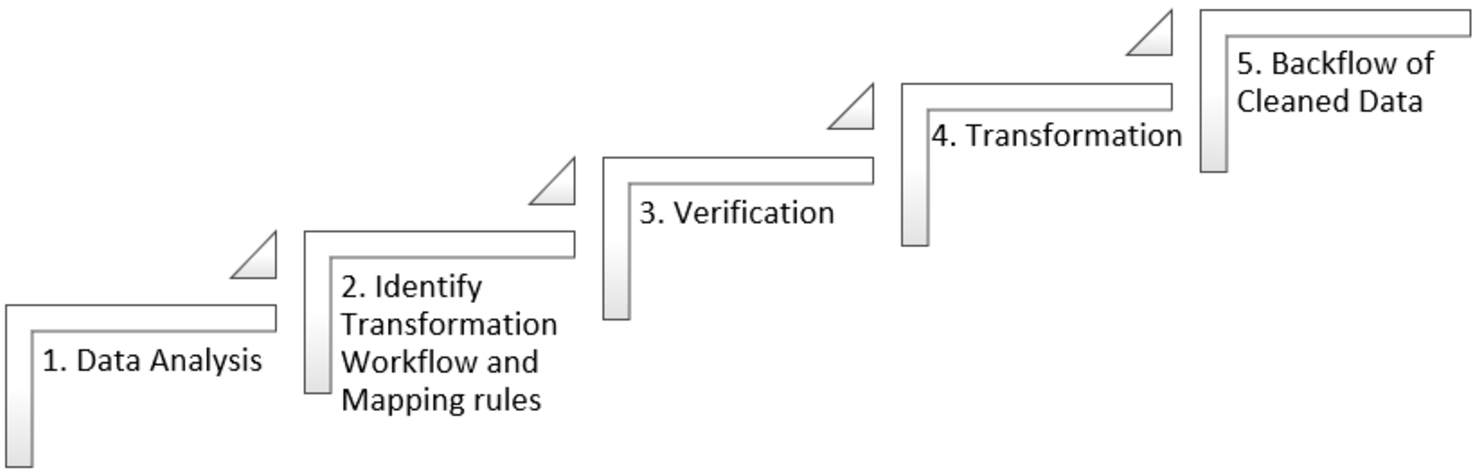
Data cleaning, a pivotal aspect of data preparation, undergoes a systematic process to enhance data quality. This process, guided by Ridzuan and al, comprises distinct stages. First, in the data analysis phase, potential errors, discrepancies, and missing values are identified. Following this, the transformation phase involves crafting workflows and mapping rules to address the detected issues. Subsequently, data verification ensures the effectiveness of the cleaning procedure and the upliftment of data integrity. Transitioning into the transformation phase, the actual cleaning takes place, where issues are resolved, and data is purged of inconsistencies. Ultimately, the backflow phase entails revalidating the cleaned data, assuring its quality for downstream use (Fig. 1). This comprehensive procedure, championed by authors such as Abdelaal and their contemporaries, aims to eradicate errors and inaccuracies, rendering data optimally prepared for subsequent stages of the data life cycle, notwithstanding the intricate challenges encountered. [6,10].
Fig. 1.
Data cleaning process.
3.2.Data cleaning tasks
Data cleaning performs several tasks to finally have useful and ready data to use in the next stage of the data life cycle. Specifically, Chu and al cover four of the most common and important data cleaning tasks, namely, outlier detection, data deduplication, data transformation, and data imputation. Since there is a very large number of work on these tasks. Data cleaning is a key step in various data analytics. many data cleansing tasks target different types of errors [4].
1. Outlier Detection: The term “outlier detection” refers to the identification of values that stand apart from the norm. Although the exact definition of an outlier varies depending on the application, commonly acknowledged explanations, as articulated by Hawkins and al, include “an outlier is an observation which deviates so much from other observations as to arouse suspicions that it was generated by a different mechanism” and “an outlier observation is one that appears to deviate markedly from other members of the sample in which it occurs.” Outlier detection finds utility across various domains of application. It is seamlessly applicable to data, software, and images. Primarily, the techniques of anomaly detection and misuse are employed to filter out erroneous data and generate an accurate dataset [21,22].
2. Data Deduplication, As defined by Chu and al, it is alternatively referred to as duplicate detection, record matching, record linkage, or entity resolution, encompasses the process of identifying tuples within one or more relationships that correspond to the same real-world entity. For instance, a customer might be registered multiple times in a customer database if the customer used various names when purchasing; an item might be appeared many times in an online shopping site; and duplicate records might represent after a data integration project because that record had various representations in original data sources. A data deduplication process usually involves many phases and choices, including designing similarity metrics to evaluate the similarity for a pair of records, training classifiers to determine whether a pair of records are duplicates, clustering all records to obtain clusters of records that represent the same real-world entity, consolidating clusters of records to unique representations, designing blocking or distributed strategies to scale up the deduplication process, and involving humans to decide whether a record pair are duplicates when machines are uncertain [4].
3. Data Imputation, Little and al have elucidated that data imputation pertains to the method of substituting alternative values to fill in for missing data. Most statistical software defaults to rejecting any instance with a missing value, which may add bias or reduce the generalisability of the results. By replacing missing information with an estimated value relying on other available information, imputation maintains all cases. The data set can be analyzed using methods applied for the whole data once all values have been imputed. Scientists have taken on various ideas to clarify missing data, but the bulk of them makes a bias. Data imputation is the process of retaining the majority of the dataset’s data and information by replacing missing data with another value. These methods are used because it would be unsuitable to delete data from a dataset each time. in addition, doing so would minimize the dataset’s amount, raising questions about bias and impairing analysis [23].
4. Data Transformation, After cleaning, the data is transformed into a appropriate format. As outlined by Han and al Data transformation aids to treat the data readily. Data transforming can be simple or complicated relying on the required alterations on the data. Standardizing data, character set transformation, encoding processing, merging or splitting fields,enforce standard patterns or trim long strings, conversion units of measurements into a suitable format, aggregation and consolidation. After completing the data transformation, the data is loaded for processing. Finally, the data analysts and senior management can make logical and beneficial decisions based on the processed data [24].
3.3.Data cleaning challenges
Data cleaning is a complex and challenging task that involves various obstacles that can impact the quality and accuracy of data. Some of the common challenges of data cleaning according to Cai and al include [25]:
1. Time-Consuming Process; duplicate data must be deleted, missing entries must be corrected or added, values that were entered wrongly must be corrected, formatting must be consistent, and other activities that take time must be completed.
2. Overwhelming Amount of Data; applications such as Data Warehouses load massive amounts of data from various sources continuously and further, they carry a notable amount of dirty data. In such a situation, the role of data cleansing becomes both formidable and significant at the same time.
3. Data Formats Lack Consistency; Domain format errors happen when the value for a particular attribute is valid but does not comply with the format of the domain. For instance, a specific database demands first name and surname to be detached with a point but the input is without a point. In this situation, while the input may be true but it does not conform with the domain format.
4. Select the Appropriate Tool or Approach; Data cleaning is much more effective when we chose our approach or tool wisely.
5. Outsourcing the Process is expensive given that data cleaning is complex work, and many businesses think of outsourcing the task to third-party vendors.
6. Scalability; Scaling data cleaning techniques to the huge and speedily growing datasets of the Big Data era will be an important challenge, which may be restricted in some domains including medicine and finance.
7. User Engagement; although various research has been done about involving humans to execute data deduplication, for instance, through active learning, participation of humans in other data cleaning tasks, such as reforming IC violations, and taking user feedback in detecting data quality rules, is yet to be explored, and other challenges.
8. Data Privacy and Security: The cleaning process should ensure that sensitive information is not revealed, and data privacy is maintained. It is challenging to balance data utility with data privacy and security.
4.Outliers detection
As per Liu and al an outlier is an observation that looks different from the rest of that set of data. Term outlier originates from statistics. Informally, an outlier can be explained as every information which occurs to be dissimilar with reverence to the remainder data. Many definitions have been suggested for outliers, such as outlier is defined as outline study. Second definition proposed by Barnett and Lewis that an outlier is an observation that appears to be inconsistent with the rest of that set of data [5]. It is an anomaly in the dataset that may be produced by a range of errors in catching, treating or processing data. They are rare, distinct, or do not fit in some way. For Example, you can visibly see the outlier in this list: [15,23,20,19,29,18,7800,32,17] [26].
Outlier detection, also known as anomaly detection as stated by Wang al, is the process of identifying data points that are significantly different from other data points in a given dataset. An outlier or anomaly is a data point that does not follow the expected pattern or behavior of the rest of the dataset. The detection of outliers can be performed using statistical techniques, machine learning algorithms, or a combination of both [15,26].
4.1.Outliers detection types
As indicated by Divya and al, there are three types of outliers relevant to machine learning models; point outliers, contextual outliers, and collective outliers. Each type differs by how the anomalous data can be observed and what makes the data point stand apart from the rest of the data set. Types are a key consideration for outlier analysis as each has a different pattern to detect [13].
1. Point Outlier: Bansal and al defined Point Outlieris as a single data point that falls outside the range of the rest of the dataset. There may be an evident trend, pattern, or grouping in the dataset, and an outlier as a data point will typically differ from this. Point outliers can usually be attributed to mistakes in input or measurement of the data. For example, an outlier may occur in health data if there is an error in recording a unit of measurement for a patient’s data. Missing a value while recording the information of a patient can also create a marked point outlier within the dataset. This kind of outlier can be relatively straightforward to detect through visual means. Point outliers are visible if the dataset is plotted in two or more dimensions, where the outlier as a data point would sit far apart from the rest of the dataset [27].
2. Contextual Outlier Pahuja and al State contextual Outlier as a data point that is remarkably dissimilar from the rest of the dataset, but only within a particular context. The context of a dataset may vary seasonally or due to broader economic behavior or trends. A contextual outlier will be apparent when the context of the dataset changes. This could be due to economic fluctuations, seasonal weather changes, or variations in customer behavior during essential holidays. For this reason, a contextual outlier may appear like a usual data point in another context [11].
3. Collective Outlier Divya and al explain Collective Outlier as a group of data points that deviates significantly from the trends in the remainder of the dataset. The individual data points in a group outlier may not appear to be contextual or point outliers. It is only when the data points are considered as a collection that anomalous trends are identified. As a result, identifying a set of outliers can be a challenging type of outlier to recognize. Collective outliers are crucial in detecting concept deviation in machine learning. It indicates that a series of data has deviated from the expected behavior within the model. For instance, if a time series plot showing the number of subscribers and unsubscribers to an email marketing list displays daily fluctuations or seasonal trends, a collective outlier could be indicated if the number of subscribed users remains completely stable for many weeks with no variation. Since new users subscribing and individual users unsubscribing are a common occurrence, a stable count would be flagged as an outlier [13].
As per Wang and al Outliers can be categorized into different types, such as vector outliers, sequence outliers, trajectory outliers, and graph outliers, depending on the types of data being analyzed [15].
4.2.Outliers detection applications
Anomaly detection has numerous applications in various fields according to Pahuja, Chandola, Wang, Aggarwal, and al. These applications encompass [11,15,18,28]:
1. Intrusion Detection specifies all of the doubtful patterns that may indicate a system or network attack from someone attempting to compromise a system (hackers). There are different types of intrusion systems based on network, system calls and kind of packets.
2. Fraud Detection is at alarming rate and in consequence becomes a big threaten for the banks and institution using a credit card transactions, Fraud is reported under crime activities that includes mobile phones fraud detection, banks, commercial etc. Outlier is basically used to detect a noisy data that is being presented in the original data.
3. Medical Diagnoses and Public Health, the patient data is to be collected from the various features of patient like height, weight, blood test, patient age. Many methods of outlier detection is applied in medical diagnoses which aids to detect critical diseases at early stage for preventing it to become a severe and life-taking disease. Outlier detection plays a key role in identifiying different kinds of cancers.
4. Image Detection, images can be of any kind, the key aim of outlier detection is to identify an abnormal behavior of the images. Each data is composed of the various features of the image that contained image coordinates, texture, color and brightness.
5. Text Data Detection, many text corpora contain heterogeneous documents, some of which may be anomalous and worth understanding more. The key aim of outlier detection is to handle the dirty data that is presented in the text.
6. Sensor Network is a grouping of specialized transducers with ability of communication which aids to supervise and record conditions like pressure, vibrations, humidity, intensity of sound, level of pollution and concentration of chemicals etc. at various positions. A sensor network have many detection station called sensor node. Each node is less weighted, portable, and very small in size. Fundamentally via the outlier detection techniques faulty sensor networks are identified so that communication level is to be augmented. Reliability in wireless sensor networks is influenced by many causes such us environment condition, using low quality sensors etc. that leads to corrupted data generations by sensor containing missing values.
7. Data Logs and Process Logs often contain a large volume of unstructured and semi-structured data that can be challenging to analyze. Data logs usually capture all interactions and events occurring in a system, while process logs provide a detailed record of the steps taken in a particular process or workflow, which can be useful in identifying errors, inconsistencies, redundancies, or irrelevant information. These issues must be identified and removed to produce clean data.
8. Cyber Security, security and surveillance are crucial considerations. Specifically, ensuring secure logging and log administration for computer networks is of utmost importance, as they enhance authenticity and security intelligence. Additionally, detecting anomalies in surveillance videos is an area of research that is both practical and exciting.
9. The Internet of Things (IoT) involves numerous sensors that continuously monitor environmental conditions and are combined to gather information about a particular area or region for a specific purpose. However, before utilizing this data, it is crucial to ensure its quality, as it may contain outliers that can negatively impact the overall efficiency. Therefore, detecting and identifying these outliers is essential to maintain the integrity and accuracy of the IoT data.
4.3.Outlier detection in machine learning
Outlier Detection in Machine Learning is an essential consideration in the development and deployment of machine learning models and algorithms. Accuracy of data is crucial during the development and training of algorithms, and outlier detection is performed after deployment to ensure the effectiveness of models. Models are generally developed to implement outlier detection for various organizations that depend on huge datasets to function.
The identification of outliers in training datasets is a necessary phase of ensuring higher-quality data. Machine learning algorithms depend on huge arrays of accurate data to learn spot and trends patterns. Machine learning models learn from data to understand the trends and relationships between data points. Concerning supervised machine learning models, a data scientist may detect and delete outliers when preparing and labeling training data. However, for unsupervised machine learning models that categorize unlabelled datasets, outlier detection may need to be performed later in the analysis. This can add extra time and resources to the machine learning process. Outlier detection remains crucial for the ongoing maintenance and surveillance of machine learning models.
Once machine learning models are deployed, they need to be continually monitored to ensure ongoing accuracy. A rise in abnormal data or recurring outliers within predictive models can signal a concept drift. The challenge here is to determine whether an outlier points to a systemic issue with the model. In case it does, the model can be retrained or recalibrated for better efficiency. Apart from training and monitoring, outlier detection often forms a critical component of a machine learning algorithm’s intended use. Algorithms that are trained to classify data or detect trends can also identify anomalies through outlier detection. For instance, machine learning is widely used in finance to identify fraudulent transactions. Through outlier detection methods, the model detects any activity that lies outside the normal account behavior, and this information can be used to freeze the account and escalate the issue for human intervention. There are various supervised and unsupervised outlier detection methods available, including k-nearest neighbors, local outlier factor, isolation forest, and one-class support vector machines. These methods can be used to identify outliers in different types of data and can be tuned for optimal performance [18].
4.4.Types of supervision in outlier detection
Outlier detection can be performed using various methods that differ in the amount of supervision required. Generally, three types of supervision can be identified: supervised, unsupervised, and semisupervised outlier detection [13,28]. These methods utilize different strategies to classify data points as normal or outliers, such as using a training dataset with labeled normal and outlier data, clustering techniques, or assuming the availability of labeled instances for only one class.
1. Supervised Outlier Detection Methods use a training dataset that contains labels for both normal and outlier data objects. When a new test data object is received, it is classified into one of the two classes based on its similarity with the normal data set. If the data object fits with the model, it is classified as normal, otherwise, it is treated as an outlier. The classification is done based on two labels, normal and outlier, and the test data is classified into one of these two categories. Some commonly used supervised outlier detection methods include Support Vector Machines (SVM), Decision Trees, Logistic Regression, Naive Bayes and Random Forests.
2. Unsupervised Outlier Detection Methods do not use any pre-existing labels for the data objects. Instead, the data objects are clustered, and those objects that are far away from each cluster are considered as outliers. When a new test data object is received, clustering is performed, and outliers are detected based on this mechanism. Some commonly used unsupervised outlier detection methods include clustering-based methods (e.g. k-means), density-based methods (e.g. LOF), and distance-based methods (e.g. kNN).
3. Semi-supervised Outlier Detection Methods assume that labeled instances are only available for one class. It is often difficult to collect labels for the other class. Techniques that assume availability of only the outlier instances for training are not very popular. Normal behavior is typically welldefined, and hence it is easier to construct representative models for normal behavior from the training data. Unsupervised outlier detection methods that are commonly used include Self-Training, Co-training, Generative Adversarial Networks (GAN),Semi-Supervised Active Learning for Anomaly Detection(SALAD).
4.5.Taxonomy of outlier detection techniques
Various techniques have been developed to detect outliers, each with its strengths and weaknesses. One way to categorize outlier detection techniques is by the approach they use to identify outliers. This classification includes statistics-based methods, distance-based methods and model-based methods (Fig. 2):
Fig. 2.
Classification of outlier detection techniques.
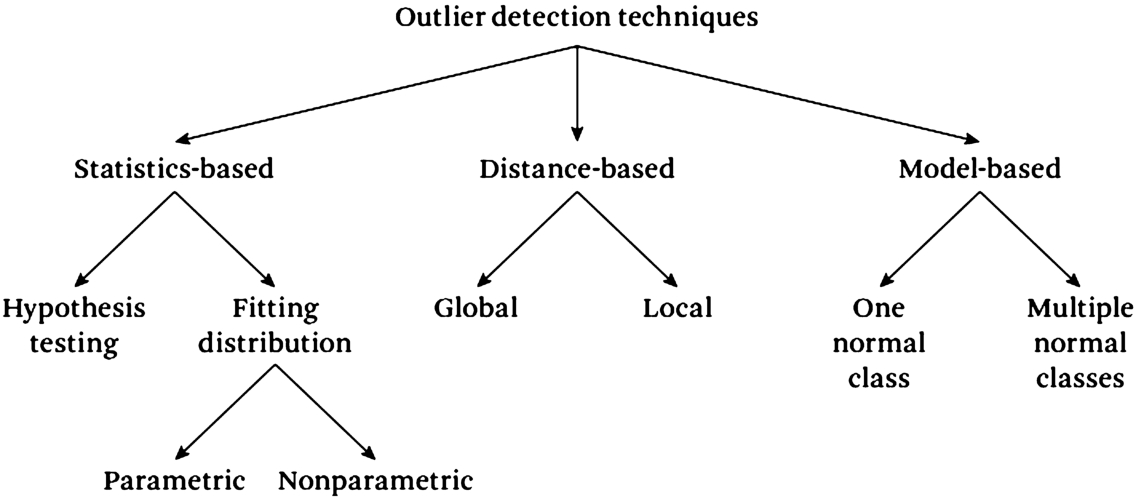
1. Statistics-Based. Assume that the normal behavior of the records (data points) would appear in high probability of a stochastic model while outliers occurs at a low probability regions of a stochastic model, there are two commonly used categories of approaches for statistics-based outlier detection [30]. First one is based on hypothesis testing when they basically calculate a test statistic based on observed data points, which is used to determine whether the null hypothesis (there is no outlier in the dataset) should be rejected. There are many tests such as the Grubbs Test [31] and the Tietjen-Moore Test [32]. The second category of statistics-based outlier detection techniques aims at fitting the distribution or inferring a probability density function (pdf also known as density of a continuous random variable) based on the observed data. Fitting a distribution can be done based on parametric approaches or non-parametric approaches. Parametric approaches for fitting a distribution assume that the data follows an underlying distribution and aim at finding the parameters of the distribution from the observed data. For example, assuming the data follows a normal distribution, parametric approaches would need to learn the mean and variance for the normal distribution. In contrast, non-parametric approaches [33] make no assumption about the distribution that generates the data; instead, they infer the distribution from the data itself.
Statistics based techniques have many advantages such as:
But there is also many disadvantages such as:– If the underlying data follows a specific distribution, then the statistical outlier detection techniques can provide a statistical interpretation for discovered outliers.
– Statistical techniques usually provide a score or a confidence interval for every data point, rather than making a binary decision. The score can be used as additional information while making a decision for a test data point.
– Statistical techniques usually operate in an unsupervised fashion without any need for labeled training data.
– Statistical techniques usually rely on the assumption that the data is generated from a particular distribution. This assumption often does not hold true, especially for high-dimensional real datasets.
– Even when the statistical assumption can be reasonably justified, there are several hypothesis test statistics that can be applied to detect anomalies; choosing the best statistic is often not a straightforward task. In particular, constructing hypothesis tests for complex distributions that are required to fit high-dimensional datasets is nontrivial [30].
2. Distance-Based. Outlier detection approaches that employ distance between data points frequently specify a distance between data points that is used to characterize typical behavior. A typical data point, for example, should be near to many other data points, and data points that depart from such regular behavior are labeled as outliers. Distance-based outlier identification methods are further classified as global or local based on the reference population utilized to determine whether a point is an outlier. A global distance-based outlier identification approach assesses whether a data point is an outlier based on its distance from all other data points in the dataset. A local approach, on the other hand, analyzes the distance between a location and its neighboring points for determining outliers.
There are many advantages of distance-based techniques:
There are disadvantages of distance-based technique:– A major advantage of distance-based techniques is that they are unsupervised in nature and do not make any assumptions regarding the generative distribution of the data. Instead, they are purely data-driven.
– Adapting distance-based techniques to different data types is straightforward, and primarily requires defining an appropriate distance measure for the given data.
– If the data has normal instances that do not have enough close neighbors, or if the data has anomalies that have enough close data points, distance-based techniques will fail to label them correctly.
– The computational complexity of the testing phase is also a significant challenge since it involves computing the distance of every pair of data points.
– Performance of a nearest neighbor-based technique greatly relies on a distance measure, defined between a pair of data instances, which can effectively distinguish between normal and anomalous instances. Defining distance measures between instances can be challenging when the data is complex, for example, graphs, sequences, and so on.
3. Model-Based. Model-based outlier identification approaches first train a classifier model using a collection of labeled data points before applying the trained classifier to a test data point to evaluate whether it is an outlier. Model based methods presume that utilizing the supplied feature space, a classifier can be trained to discriminate between normal and anomalous data points. If none of the trained models categorize a data point as normal, they mark it as an outlier. Model-based approaches are further classified into two types based on the labels used to train the classifier: multi-class model-based techniques and one-class model-based techniques. Multiclass model-based methods are based on the assumption that the training data points comprise labeled examples from several normal classes. One-class model based approaches, on the other hand, presume that all of the training data points belong to a single normal class.
The advantages of model-based techniques include:
The major disadvantages of model-based techniques is that they must rely on the availability of accurate labels for various normal classes, which is often not possible.– Model-based techniques, especially the multiclass techniques, can make use of powerful algorithms that can distinguish between instances belonging to different classes.
– The testing phase of model-based techniques is fast, since each test instance needs to be compared against the precomputed model.
5.Methodology
5.1.Outlier detection algorithms methodology
In this section, we will conduct a comparative study of several outlier detection algorithms, including Isolation Forest [34], Local Outlier Factor [35], Minimum Determinant Covariance [33], and One-Class SVM [36]. Firstly, we will select a conventional machine learning dataset and establish a baseline performance. This will serve as the reference point for the subsequent session, which will focus on outlier detection and removal techniques in data preparation. Each technique will be defined and then fitted to the training dataset. After that, the fitted model will predict whether each sample in the training dataset is an outlier or an inlier. Outliers will be removed from the training dataset before fitting the model to the remaining samples and evaluating its performance on the entire test dataset. Fitting the outlier detection technique to the entire training dataset is not appropriate because it would result in data leakage, which means that the model would have access to test set data that was not utilized during training. As a result, the model’s performance may be overestimated. Therefore, we should attempt to identify outliers in “fresh data,” such as the test set, before generating predictions.
The dataset used in this study is the House Price Regression dataset is a popular dataset used in machine learning for regression tasks, which includes 13 input variables describing the properties of the house and suburb. The goal is to predict the median value of houses in the suburb in thousands of dollars. When you examine the raw data, you’ll see that the first few rows of data are displayed below. As we can see, it is a regression predictive modeling problem with numerical input variables of various sizes.
5.2.Comparative analysis of outlier detection algorithms
After examining various outlier detection algorithms and their complexity, we performed a benchmarking study on four algorithms: Isolation Forest, Local Outlier Factor, Minimum Covariance Determinant, and One Class SVM. Based on the benchmark results, Isolation Forest had the best performance with the minimum mean absolute error. However, before proposing a solution to improve the number of outliers detected with minimum calculations, it is important to understand the complexities of these algorithms.
Isolation Forest stands out as it does not require distance or density measures to detect anomalies, which reduces the computational cost of distance calculation in other methods. This results in a linear time complexity with a low constant and a low memory requirement. Additionally, Isolation Forest can handle extremely large data sizes and high-dimensional problems with many irrelevant attributes.
On the other hand, the Local Outlier Factor algorithm (LOF) is density-based and identifies local outliers by assigning a degree of outlierness called the local outlier factor (LOF). However, LOF’s computation time grows exponentially with the number of dataset dimensions, known as the curse of dimensionality. This can lead to high computational complexity, particularly for high-dimensional data.
The Minimum Covariance Determinant (MCD) algorithm is useful when the dataset has two input variables and both are Gaussian, as the feature space forms a multi-dimensional Gaussian distribution. However, MCD is limited by the requirement that the dimension p must be less than the number of observations in any h-subset to be non-singular, resulting in a void in the availability of high breakdown techniques for “fat data” with fewer observations than variables.
Lastly, the One Class SVM algorithm uses supervised learning for knowledge training and gives a global solution for data classification. However, it has a high time complexity and can be complicated to implement. In summary, based on my analysis, Isolation Forest is the most promising algorithm for outlier detection in large, high-dimensional datasets with many irrelevant attributes.
Table 1
Comparison of outlier detection algorithms based on performance, execution time, advantages, and disadvantages
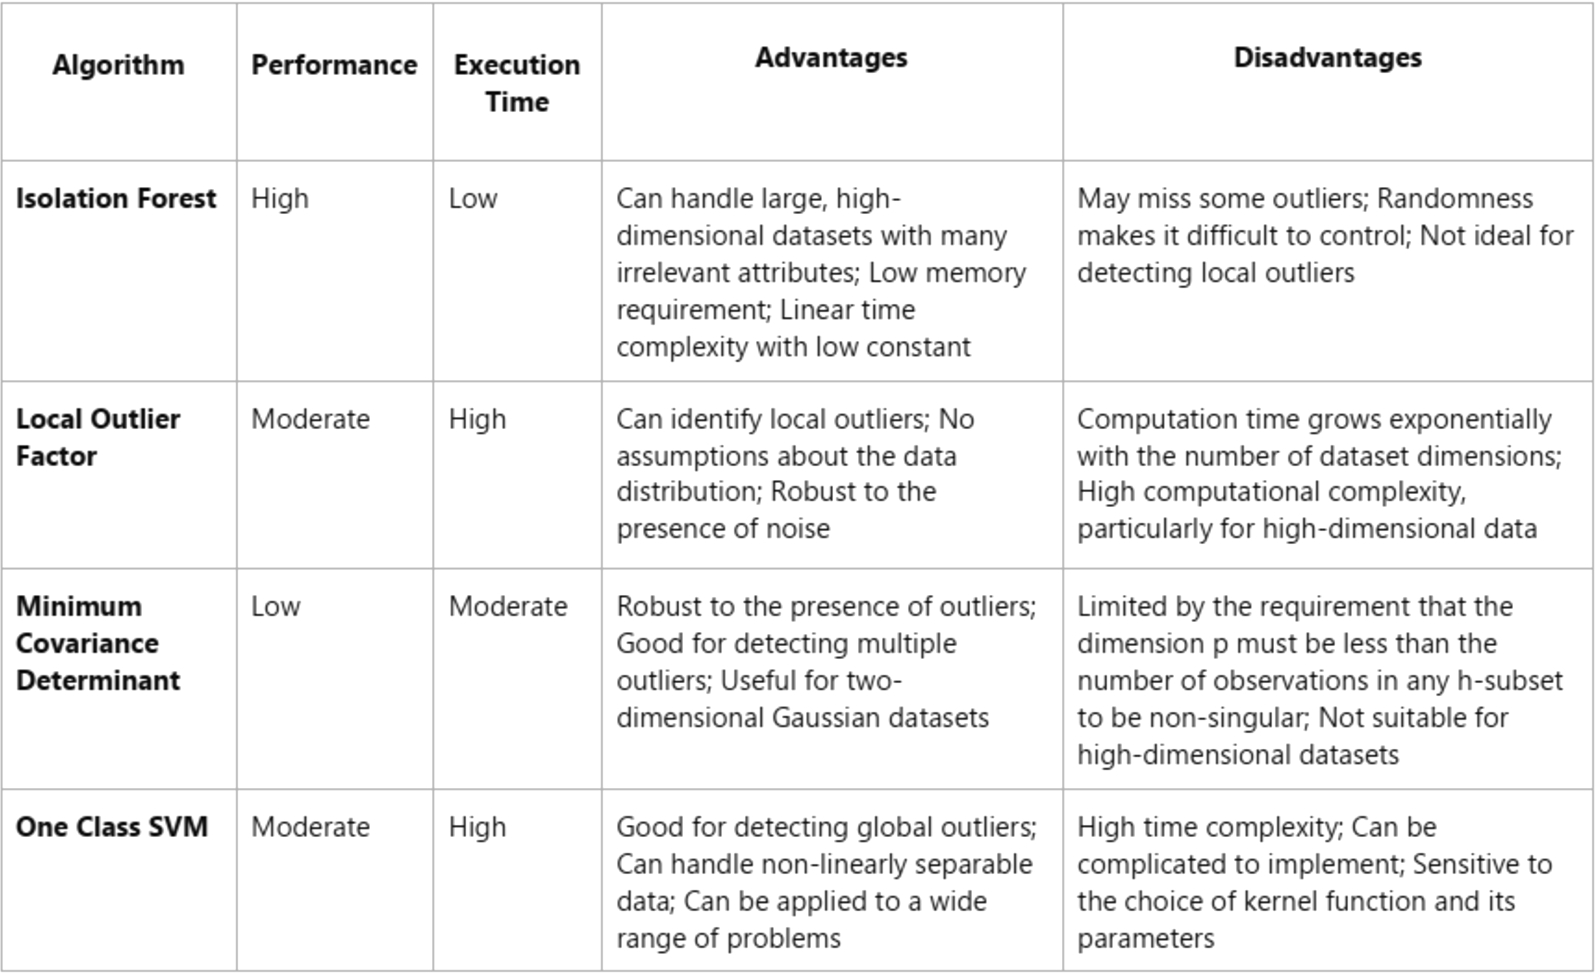
The table compares four outlier detection algorithms: Isolation Forest, Local Outlier Factor, Minimum Covariance Determinant, and One Class SVM – based on their performance, execution time, advantages, and disadvantages. One potential approach is to utilize a clustering algorithm to group similar data together, and then apply the Isolation Forest algorithm to each cluster individually. By doing so, the algorithm can run pathlength on the data without being affected by unrelated data points. This approach can improve the detection of local outliers.
5.3.Proposal explanation
To address the issue with the Isolation Forest algorithm, we propose merging the iForest model with a clustering algorithm. This involves slicing the dataset into subsets using the clustering algorithm and then running the Isolation Forest algorithm on each subset. This approach reduces the number of subsets generated and also fixes the problem with path length calculation, which is related to the anomaly score calculation. For the clustering step, we have chosen the K-means algorithm [37].
K-means Clustering is a vector quantization approach derived from signal processing that seeks to divide n observations into k clusters, with each observation belonging to the cluster with the closest mean (cluster centers or cluster centroid), which serves as the cluster’s prototype. As a result, the data space is partitioned into Voronoi cells. Within-cluster variances (squared Euclidean distances) are minimized by k-means clustering, but not regular Euclidean distances, which would be the more difficult Weber problem: the mean optimizes squared errors, but only the geometric median reduces Euclidean distances. Better Euclidean solutions, for example, can be discovered by employing k-medians and k-medoids. There is multiple inherited algorithms from the k-means clustering algorithm but the standard algorithm employs iterative refining. Because of its prevalence, it is commonly referred to as “the k-means algorithm”; it is also known as Lloyd’s algorithm, notably in the computer science community. It is also known as “naive k-means” because there are considerably quicker alternatives. The method proceeds by alternating between two stages, given an initial set of k means m1(1),…,mk(1).
– First Stage: The assignment step Assign each observation to the cluster with the nearest mean: that with the least squared Euclidean distance (Mathematically, this means partitioning the observations according to the Voronoi diagram generated by the means)
where each– Second Stage: Update step Recalculate means (centroids) for observations assigned to each cluster.
6.Experiments and results
6.1.Isolation forest implementations
In the first part, Isolation Forest is generated with external and internal nodes. The external node contains only one parameter, which is the size, and the internal node contains left and right nodes, split attributes, and split values. The second segment defines the iForest class, which requires three attributes: X for the dataset, noOfTrees for the number of trees in the forest, and sampleSize for subsampling. The iForest contains an nd array named forest and a variable named hlim, which is calculated as log2 of the sample size. The for loop takes a sample from the dataset X with the same sample size and self-calls the same class iForest, and appends the sample named Xtrain as a tree. The iForest class stores the itrees object and subsamples. The third step defines the Isolation-tree class, which requires attributes X for the dataset, the height of the tree in the forest, and the hlim that we have calculated in the iForest class. The Isolation-tree class stores the node as external whenever the height is above or equals the hlim or the length of the dataset is less or equals 1. When one of these two conditions is not satisfied, it stores the current tree as a left node with the data sample, which has a random q that is less than the value of the q index in the dataset. If the data sample has a value greater than or equal to the value of q index, it is stored as a right node. The final task is the pathlength calculation class, which takes three attributes: X for the dataset, the desired tree to calculate the length, and currentHeight.
To test this approach, we use a credit card dataset with many transactions and define the anomaly transactions. The dataset contains 30 columns, and we randomly select 100000 rows from the data as a training set and a sample size of 20000 rows to make the forest. After successfully making the forest, we calculate the pathlength for each data point. After plotting the data, we observe that the points with the lowest pathlength are the anomalies, and there is no anomaly with a long pathlength.
6.2.Proposal implementation:
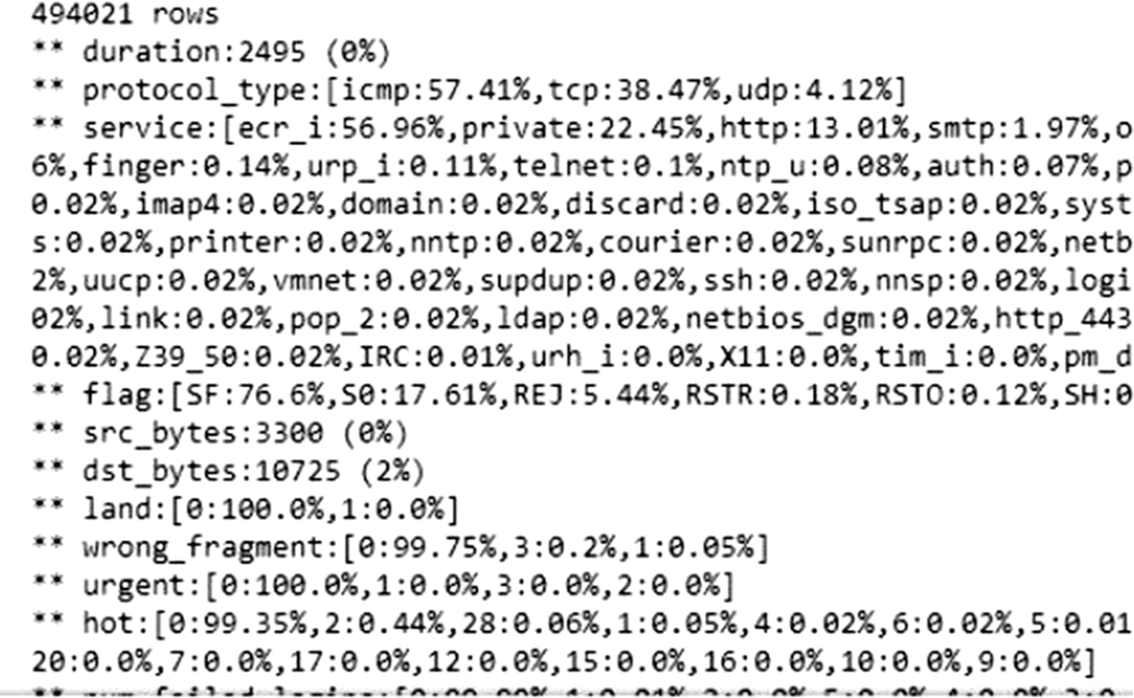
In this section, we will implement our algorithm and evaluate its performance in detecting outliers, including local outliers, on the dataset used for The Third International Knowledge Discovery and Data Mining Tools Competition. This database contains a standardized set of data for auditing purposes and includes a wide range of simulated intrusions in a military network environment. Initially, we load the dataset to make necessary changes before applying the algorithm. We examine the first five rows of the dataset and observe that it contains several categorical columns. Before handling these columns, we remove the rows that have empty data (NA’s) and assign column headers. The resulting first five rows of the dataset are presented below. Next, we define a function to analyze the data and plot the results. (Fig. 3) illustrates the outcome of the analysis.
Fig. 3.
Outcome of the analysis.
Next, we will create two functions to preprocess the data. The first function encodes Z-Scores for each column, and the second creates dummy variables from the categorical columns. We will then use these functions to encode the feature data. The outcome column specifies the type of attack. A value of ‘normal’ indicates that no attack is currently ongoing. We have found that certain attack types are far more common than others, so to reduce the computational load, we will consider every non-normal connection as an anomaly. The next step is to cluster our data using the k-means algorithm. Firstly, we need to specify an appropriate value for k. To do this, we will use the elbow curve method.
Fig. 4.
Elbow curve for clusters.
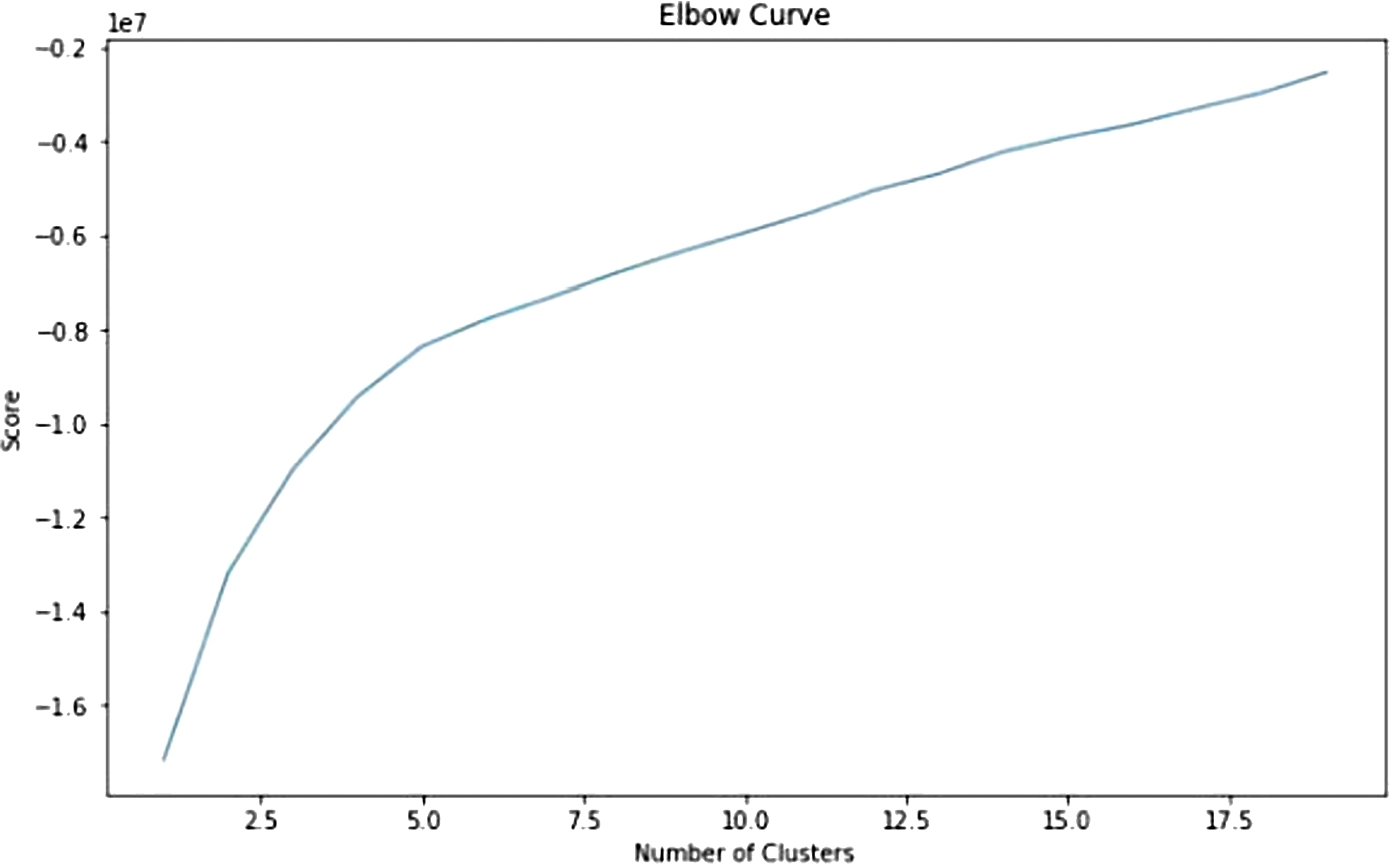
The elbow method runs k-means clustering on the dataset for a range of values for k (e.g. from 1 to 20) and then computes an average score for all clusters for each value of k. After examining the curve, we see that the score doesn’t change significantly after k = 15 (Fig. 4), so we will use this value for our analysis. (Note: 5 and 10 are also good values to consider).
We will run the k-means clustering algorithm with k = 15 and transform our data using the k-means transform method (Fig. 5), which transforms the dataset to a cluster-distance space. After the clustering is done (Fig. 6), we will extract all the data points and store them in an nd array based on which cluster they belong to, and we will use the last column as the validation column which indicates whether the connection is normal or not.
Fig. 5.
Dataset transformation.
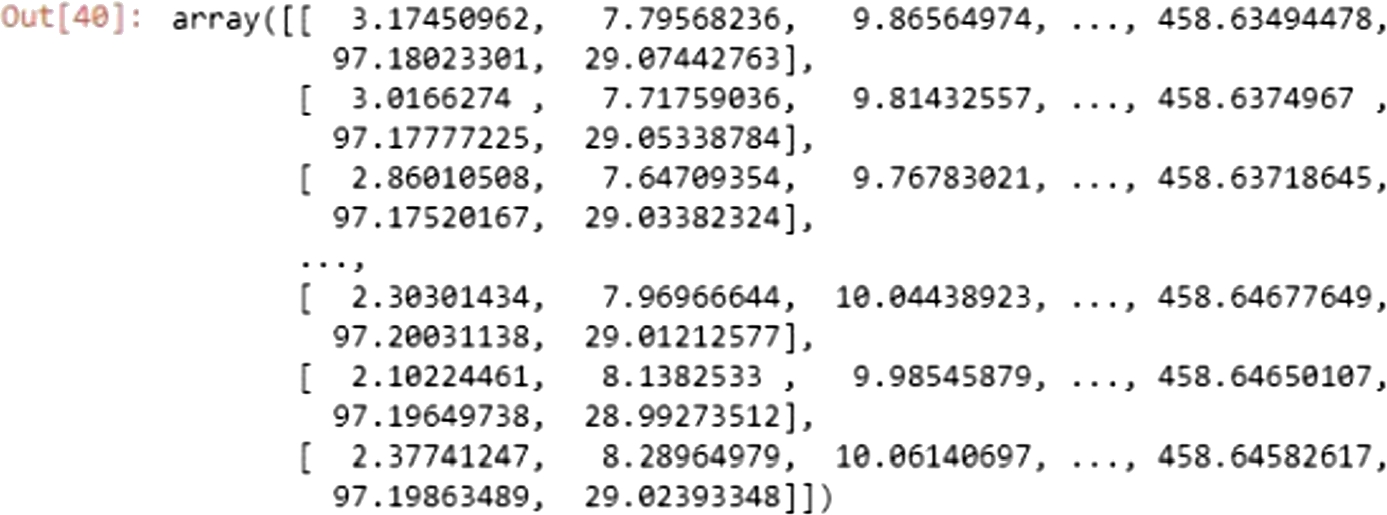
Fig. 6.
Created clusters.
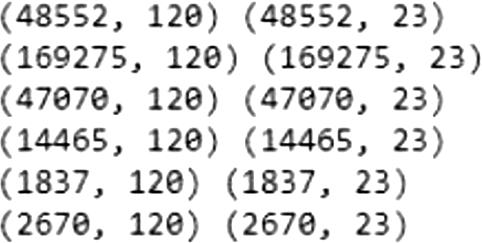
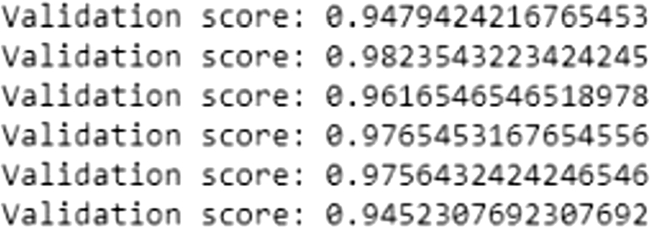
Then for each subset we will split them into small x_train x_test and y_train and y_test datasets and reshape our data into the same shape of the original data (which is 1,120) We see that the 9th dataset contains a single row which automatically means that it’s an outlier. We will also consider the (3,5,7,8,9,11,12,13,14) as a group of outliers based on the size difference between them and the other subsets.After it’s done, we simply select all rows that don’t contain outliers and summarize the shape of out dataset. Then we will fit our model and evaluate it with y_hat column and calculate the validation score between the predicted y_eval and the actual y_test. We observed that our model yielded superior results to the algorithm with an overall accuracy of 98% (Fig. 7).
Fig. 7.
Validation score.
7.Conclusions
Data cleaning is a vital process in ensuring that the data used for machine learning is accurate and reliable. Outlier detection is an essential task in data cleaning, and various techniques have been developed to detect outliers. We have discussed statistics-based, distance-based, and model-based outlier detection techniques. Additionally, we benchmarked major outlier detection algorithms and proposed a new algorithm that combines k-Means clustering and Isolation Forest for improved results. Our proposed algorithm achieved an accuracy of 98%, albeit with a higher time complexity. In future work, we propose the use of autoencoder algorithms to address the time complexity issue and predict future results accurately.
While writing this article, we realized that there are many other topics related to data cleaning that we didn’t cover, such as rule-based data cleaning approaches that discover and fix mistakes based on data quality standards, which are often referred to as different types of integrity constraints. However, manually developing data quality rules is a time-consuming task that requires human knowledge, so researchers have developed approaches for automatically identifying data quality rules in various languages. Despite the progress in data cleaning research, academic solutions are seldom implemented in practice. Most of the current data cleaning methods are inadequate for dealing with real-world situations where errors interact in complex ways. Additionally, many approaches are not scalable, either requiring several runs through the entire dataset or being quadratic in complexity. Finally, there is often a gap between where errors are generated and where they are detected. In conclusion, the effectiveness of data cleaning methods depends on the quality of the input dataset and where the data is harvested from. In other words, if the input data is of poor quality or insufficient, the chances of obtaining significant and informative data as output are low. On the other hand, having a well-harvested dataset that adheres to certain rules can increase the probability of obtaining useful results.
Conflict of interest
None to report.
References
[1] | J.M. Wing, The data life cycle, Harvard Data Science Review 1: (1) ((2019) ), 6. |
[2] | E.A. Mezmir, Qualitative data analysis: An overview of data reduction, data display, and interpretation, Research on humanities and social sciences 10: (21) ((2020) ), 15–27. |
[3] | Gil Press, Cleaning Big Data: Most Time-Consuming, Least Enjoyable Data Science Task, Survey Says, FORBES site web, https://www.forbes.com/sites/gilpress/2016/03/23/data-preparation-most-time-consuming-least-enjoyable-data-science-task-survey-says/?sh=78e8a5776f63. |
[4] | X. Chu and I.F. Ilyas, Data cleaning, 2019. |
[5] | J. Brownlee, Data preparation for machine learning: Data cleaning, feature selection, and data transforms in Python. Machine Learning Mastery, 2020. |
[6] | E. Rahm and H.H. Hai, Data cleaning: Problems and current approaches, IEEE Data Eng. Bull. 23: (4) ((2000) ), 3–13. |
[7] | H. Müller and J.C. Freytag, Problems, methods, and challenges in comprehensive data cleansing, Professoren des Inst. Für Informatik (2005). |
[8] | S. Xu et al., Data cleaning in the process industries, Reviews in Chemical Engineering 31: (5) ((2015) ), 453–490. doi:10.1515/revce-2015-0022. |
[9] | C. Xu et al., Data cleaning: Overview and emerging challenges, in: Proceedings of the 2016 International Conference on Management of Data, (2016) . |
[10] | F. Ridzuan and N.W.Z. Wan Mohd, A review on data cleansing methods for big data, Procedia Computer Science 161: ((2019) ), 731–738. doi:10.1016/j.procs.2019.11.177. |
[11] | D. Pahuja and R. Yadav, Outlier detection for different applications: Review, International Journal of Engineering Research & Technology (IJERT) 2 (2013). |
[12] | J. Zhang, Advancements of outlier detection: A survey, ICST Transactions on Scalable Information Systems 13: (1) ((2013) ), 1–26. doi:10.4108/trans.sis.2013.01-03.e2. |
[13] | D. Divya and S.S. Babu, Methods to Detect Different Types of Outliers, 2016 International Conference on Data Mining and Advanced Computing (SAPIENCE), IEEE, (2016) . |
[14] | H.C. Mandhare and S.R. Idate, A Comparative Study of Cluster Based Outlier Detection, Distance Based Outlier Detection and Density Based Outlier Detection Techniques, 2017 International Conference on Intelligent Computing and Control Systems (ICICCS), IEEE, (2017) . |
[15] | H. Wang, M.J. Bah and H. Mohamed, Progress in outlier detection techniques: A survey, Ieee Access 7: ((2019) ), 107964–108000. doi:10.1109/ACCESS.2019.2932769. |
[16] | P. Karczmarek et al., Fuzzy C-means-based isolation forest, Applied Soft Computing 106: ((2021) ), 107354. doi:10.1016/j.asoc.2021.107354. |
[17] | A. Mensi and M. Bicego, Enhanced anomaly scores for isolation forests, Pattern Recognition 120: ((2021) ), 108115. doi:10.1016/j.patcog.2021.108115. |
[18] | C.C. Aggarwal, Outlier Analysis, 2nd edn, (2016) . |
[19] | M. Abdelaal, C. Hammacher and H. Schoening, Rein: A comprehensive benchmark framework for data cleaning methods in ml pipelines, 2023, arXiv preprint arXiv:2302.04702. |
[20] | H.H. Mohamed, E-Clean: A Data Cleaning Framework for Patient Data, 2011 First International Conference on Informatics and Computational Intelligence, IEEE, (2011) . |
[21] | D.M. Hawkins and D.M. Hawkins, Multivariate outlier detection, Identification of outliers (1980), 104–114. doi:10.1007/978-94-015-3994-4_8. |
[22] | V. Barnett and T. Lewis, Outliers in Statistical Data, Vol. 3: , Wiley, New York, (1994) . |
[23] | R.J.A.Little and D.B. Rubin, Statistical Analysis with Missing Data, Vol. 793: , John Wiley & Sons, (2019) . |
[24] | J. Han, J. Pei and M. Kamber, Data Mining: Concepts and Techniques. 2011, (1999) . |
[25] | L. Cai and Y. Zhu, The challenges of data quality and data quality assessment in the big data era, Data Science Journal 14 (2015). |
[26] | H. Liu et al., Efficient outlier detection for high-dimensional data, IEEE Transactions on Systems, Man, and Cybernetics: Systems 48: (12) ((2017) ), 2451–2461. doi:10.1109/TSMC.2017.2718220. |
[27] | R. Bansal, N. Gaur and S.N. Singh, Outlier detection: Applications and techniques in data mining, in: 2016 6th International Conference-Cloud System and Big Data Engineering (Confluence), IEEE, (2016) . |
[28] | V. Chandola, A. Banerjee and V. Kumar, Anomaly detection: A survey, ACM computing surveys (CSUR) 41: (3) ((2009) ), 1–58. doi:10.1145/1541880.1541882. |
[29] | G.Y. Lee, L. Alzamil, B. Doskenov and A. Termehchy, A survey on data cleaning methods for improved machine learning model performance, Computer Science (2021). |
[30] | S. Maguerra, A. Boulmakoul and H. Badir, in: Time Framework: A Type Level and Algebra Driven Design Approach, 2021 International Conference on Data Analytics for Business and Industry (ICDABI), Sakheer, Bahrain, (2021) , pp. 25–26. |
[31] | F. Grubbs and E.S. Frank, Procedures for detecting outlying observations in samples, Technometrics (1969), 1–21. doi:10.1080/00401706.1969.10490657. |
[32] | F. Tietjen, L.S. Gary et al., Some Grubbs-type statistics for the detection of several outliers, Technometrics (1972) 583–597. |
[33] | F. Ridzuan and W.M.N. Wan Zainon, A review on data cleansing methods for big data, Procedia Computer Science 161: ((2019) ), 731–738. doi:10.1016/j.procs.2019.11.177. |
[34] | F.T. Liu, K.M. Ting and Z.-H. Zhou, Isolation forest, in: 2008 Eighth IEEE International Conference on Data Mining, IEEE, (2008) . |
[35] | M.M. Breunig et al., LOF: Identifying density-based local outliers, in: Proceedings of the 2000 ACM SIGMOD International Conference on Management of Data, (2000) . |
[36] | B. Schölkopf, R. Herbrich and A.J. Smola, A generalized representer theorem, in: Computational Learning Theory: 14th Annual Conference on Computational Learning Theory, COLT 2001 and 5th European Conference on Computational Learning Theory, EuroCOLT 2001, Amsterdam, The Netherlands, July 16–19, 2001 Proceedings 14, Springer, Berlin Heidelberg, (2001) . |
[37] | D. Steinley, K-means clustering: A half-century synthesis, British Journal of Mathematical and Statistical Psychology 59: (1) ((2006) ), 1–34. doi:10.1348/000711005X48266. |

