
Swallow Safety and Laryngeal Kinematics: A Comparison of Dysphagia Between Parkinson’s Disease and Cerebrovascular Accident
Abstract
Background:
Cerebrovascular accident (CVA) and Parkinson’s disease (PD) are well established etiologies of dysphagia. However, differing physiological mechanisms underlying dysphagia may exist between these two causes. There have been limited investigations specifically comparing dysphagia between these two groups. Comparing dysphagia presentation in two different populations may improve clinical expectations, guide treatment approaches, and inform future research.
Objective:
This study examined the differences in presentation of dysphagia between PD and CVA. Dysphagia presentation, swallow safety, and laryngeal kinematics were compared between two clinical cohorts. What factors best predicted airway invasion in each group were explored.
Methods:
110 swallow studies of individuals with PD and CVA who were referred for swallowing evaluation were obtained. Each video was analyzed for quantitative dysphagia presentation using the Videofluoroscopic Dysphagia Scale (VDS), swallow safety using the Penetration-Aspiration scale, and kinematic timings of the laryngeal vestibule (time-to-laryngeal vestibule closure [LVC] and closure duration [LVCd]).
Results:
Frequencies of penetration or aspiration were similar between groups. The PD group displayed significantly greater pharyngeal stage swallow impairment than CVA, with more frequent reduced laryngeal elevation and increased vallecular residue. The CVA group displayed significantly greater oral stage impairment, with prolonged oral transit times. Time-to-LVC was significantly prolonged and was the strongest predictor of airway invasion in the PD group, but not for CVA.
Conclusion:
Similar airway invasion rates for PD and CVA indicate the importance of screening for dysphagia in PD. Laryngeal kinematics as significant contributors to airway invasion in PD but not for CVA highlight the need for further research into these mechanisms and for targeted treatment approaches to dysphagia.
INTRODUCTION
Dysphagia in people with Parkinson’s disease (PWPD) is expected to occur in a majority of those diagnosed [1] and is associated with impairments in oral, pharyngeal, and esophageal stages across the degenerative course of the disease [2, 3]. The progression of PD is heterogenous, however, and the nature of dysphagia in PD across time is not well understood [4]. This knowledge gap exists despite the expected occurrence and cost of negative healthcare outcomes related to dysphagia in PWPD, including aspiration pneumonia and death [3, 5, 6].
The laryngeal impairments which lead to aspiration in PWPD are not as well understood as those in cerebrovascular accident (CVA), which is considered one of the leading causes of dysphagia [7]. While recent evidence suggests that time-to-laryngeal vestibule closure (LVC) and airway responses to penetrated material are impacted by PD [8–10], greater evidence is needed to elucidate those physiological impairments for which treatment might have the greatest impact for swallowing safety and efficiency. This is particularly true as the prevalence of dysphagia in PD has been reported as similar to that of CVA [11], yet our understanding of laryngeal kinematics in CVA is substantially more robust compared to PD. Investigations into broad samples of neurogenic dysphagia [12] have reported time-to-LVC as the most significant predictor of decreased swallow safety, further emphasizing time-to-LVC as a key mechanism in preventing airway invasion. However, documented differences in dysphagia presentation exist between etiologies of dysphagia, including neurogenic dysphagia [13, 14].
Despite the growing number of individuals diagnosed with PD compared to CVA in the United States [15, 16] similar guidelines or protocols are not widely available regarding dysphagia in PWPD. PWPD may be provided with different or inadequate information regarding dysphagia risk from their primary care professionals. This supposition is supported by the phenomenon that PWPD exhibit poor understanding of swallowing impairments associated with their disease [17] or how to identify symptomology [18]. There is a critical need to examine how dysphagia presents across a broad population of PWPD, as well as in comparison to other neurogenic etiologies of dysphagia. Knowledge gained from these studies may expand our understanding of how dysphagia presents in PD across the duration of the disease, what the most common and salient characteristics of dysphagia in PD are, and determine how specific kinematics related to laryngeal physiology for airway protection affect swallow safety. By examining the severity and consequences (such as aspiration) of dysphagia across neurologically impaired populations, knowledge created could be used to facilitate understanding and advocacy about dysphagia in PD for various healthcare professionals and clinicians.
To achieve these aims, the current project will address three primary research questions:
1. Do the frequencies of physiological breakdowns in swallowing across oral, pharyngeal, and esophageal stages of swallowing in PWPD differ in comparison to individuals post CVA? It was hypothesized that dysphagia presentation, as measured by the Videofluoroscopic Dysphagia Scale (VDS) items and subcomponent scorings, will be similar in both populations. It was also hypothesized that abnormal swallow events of penetration and aspiration as measured by the Penetration Aspiration Scale (PAS) [19] will occur more frequently in PWPD due to the ubiquity of upper airway sensorimotor dysfunction [20].
2. Which laryngeal kinematic measurements are the best predictors of airway invasion in PWPD and CVA? Based on the available literature [12] it was hypothesized that time-to-laryngeal vestibule closure (LVC) will be the strongest kinematic predictor of abnormal swallow events in those diagnosed with pharyngeal stage dysphagia in both groups.
3. Are laryngeal kinematic measures different between PWPD and individuals with CVA who have been diagnosed with pharyngeal stage dysphagia? It is unclear at this time how laryngeal kinematics such as time-to-LVC will differ between two neurogenic dysphagic groups. While the literature indicates that time-to-LVC is typically a strong predictor of abnormal swallow events in both populations [8, 9, 21, 22], how the specific kinematic timings compare between the groups has not been investigated previously.
MATERIALS AND METHODS
Study sample
This study was approved by the Texas Christian University (TCU) institutional review board (IRB). The study design was a cross-sectional, observational investigation consisting of videofluroscopic swallow study (VFSS) evaluations that were conducted on a clinical sample of people post-CVA and those diagnosed with PD between January 1st, 2020 and December 31st, 2020. All video recordings of instrumental (VFSS) swallow assessments were used with permission from Diagnostex, LLC (Hurst, TX). All VFSS evaluations were completed in a mobile radiology unit using the same equipment.
A summary flowchart of record reviews, exclusion, and final inclusion numbers can be found in Supplementary Material 1. Included VFSS recordings were required to meet the following criteria: 1) Recordings of patients diagnosed with a CVA within six months with no other underlying neurological impairment according to the medical record; 2) Recordings of patients diagnosed with PD prior to their VFSS with no other underlying neurological impairment unrelated to PD according to the medical record, as well as no atypical parkinsonism or parkinsonism related disorders; 3) Patients must have been diagnosed with dysphagia subsequent to the VFSS assessment, as indicated in the examination report; 4) Patients diagnosed with pharyngeal stage dysphagia must have exhibited abnormal swallow events measured by a score of ≥3 on the PAS, indicating some degree of airway safety compromise; 5) Patients must not have undergone targeted dysphagia therapy prior to the VFSS according to medical records; 6) VFSS examination videos must have had minimal movement and motion artifacts for adequate kinematic data extraction; and 7) Video quality was clear enough to visualize the upper airway from the arytenoids to the epiglottis to allow for measurement of laryngeal kinematic data and identify the bolus consistency and volume being administered by the clinician.
Procedures and instrumentation
All VFSS were conducted on a mobile swallowing/dysphagia assessment unit (Diagnostex, LLC). All studies were recorded at 30 frames per second (fps) in agreement with current literature [23] and conducted by a trained and certified Speech-Language Pathologist (SLP) who was blind to the conditions and purposes of this study. All patients were asked to consume multiple bolus trials at varying volumes and consistencies mixed with a radiographic barium solution (E-Z Paque 96% w/w, diluted to 40% w/v, or EZ Paste 60% w/v) for visualization on VFSS as part of a standard assessment protocol. As these VFSS were conducted as part of a clinically based, mobile radiography unit, these varying volumes and consistencies were presented on a patient by patient basis. As such, practical measurements of real world assessment such as teaspoon and individual patients’ natural sip size were used, rather than specific measurements (ounces or milliliters). Recordings were de-identified prior to any data collection.
Data collection
Demographic and diagnostic information was obtained from the patient records. Extracted data included: neurological diagnosis (stroke, or PD), dysphagia diagnosis (oral, pharyngeal, esophageal, a combination such as oropharyngeal), and time elapsed from onset of neurological diagnosis to VFSS, total disease duration (PWPD), age, and gender. As part of a standard VFSS protocol, an esophageal sweep was conducted on all patients. Esophageal dysfunction was identified by the presiding radiologist at the time of assessment and was extracted from the patient record. Video analysis software Avidemux v. 2.7 was used for video playback of VFSS as well as frame-by-frame analysis for kinematic measures and determination of PAS scores. Two kinematic timing measures were obtained: time-to-laryngeal vestibule closure (LVC) and laryngeal vestibule closure duration (LVCd). These measures have been utilized in previous studies to assess physiological timing events related to airway closure and protection during swallowing in these populations elsewhere [24, 25] as well as from our lab [9]. Time-to-LVC was operationally defined as beginning with (a) the initial and consistent anterior-superior burst of the hyoid and ending when (b) the arytenoids contact the underside of the epiglottis with the maximum extent of observed laryngeal vestibule obstruction. LVCd was defined as beginning at (a) the moment of maximum observed obstruction of the laryngeal vestibule and ending when (b) the descent of the arytenoids from the underside of the epiglottis began, as seen by the reemergence of the vestibule.
Visual-perceptual analysis was applied to every swallow recording of each participant to determine the PAS. The PAS measured the degree of laryngeal penetration and/or aspiration as judged by the depth of bolus material entering the airway. The scale can be found in Supplementary Material 2. After obtaining all PAS scores, data was transformed into a separate dichotomous variable to reflect either a “normal” and safe swallow (PAS score of 1 or 2) or “abnormal” (PAS score 3-8). This method has been suggested as one of several appropriate approaches with this study design [26] and used in recent work [9] to quantify the PAS for statistical hypothesis testing.
The VDS was scored and calculated for each recording of every patient. The VDS was used to assign quantifiable severity scores for various signs and physiological characteristics of dysphagia across oral and pharyngeal swallow stages. The signs that can be identified and scored with the VDS can be found in Supplementary Material 3. The VDS consists of 14 total items, with 7 separate items designed to assess overall severity of the oral stage of swallowing and 7 separate items to assess overall severity in the pharyngeal stage of swallowing. A patient’s VDS score was calculated by adding each item to produce a total score with a maximum of 100, with higher numbers indicating more severe dysphagia. The nature of the VDS also allowed for subcategory (i.e., oral vs. pharyngeal dysphagia) analysis between groups. This has been performed previously [27] by separating the oral components and pharyngeal components of the VDS based on the physiology of each stage. The oral stage components can be totaled out of a maximum 40 points and pharyngeal stage components out of a maximum of 60 points. The scale has been used and validated in CVA dysphagia research previously [28] and has shown translatability across dysphagia etiologies [29].
All kinematic measures, PAS scores, and VDS scores were performed independently by the PI. A 15% remeasure by a second, independent rater was performed to calculate interrater reliability, and a 15% remeasure by the PI was completed to calculate intrarater reliability for kinematic measures, PAS scores, and overall VDS scores. Intraclass Correlation Coefficients (ICC) were calculated using a two-way random effects model.
Statistical analysis
All statistical analyses were performed in SPSS (v. 24). Independent t-tests were conducted on demographic and key variables to determine if any differences were present between CVA and PD groups. Intraclass Correlation Coefficient (ICC) values were computed to determine interrater reliability for kinematic (time-to-LVC and LVCd), swallow safety (PAS), and VDS total scores.
For research question 1 related to differences in presentation of dysphagia in CVA and PD, chi-square tests were performed to examine differences in distributions of dysphagia diagnosis and PAS scores between CVA and PD groups. Current recommended statistical treatment of the PAS remains contested [26, 30]. In the current study, the PAS scale was examined through frequency distributions and investigating distribution differences between groups. This allowed the scale to be examined in its intended ordinal nature, on a measurement scale of 1-8, rather than treated as a continuous variable in a linear model. The PAS may also be described by the various score ranges when examining frequencies of airway invasion. As an example, PAS scores of 1-2 are often defined as “normal”, PAS scores of 3-5 correspond to events of penetration, and scores of 6-8 correspond to events of aspiration. When exploring the differences in airway invasion characteristics between groups, some comparisons were made based on these score ranges. A multivariate analysis of variance (MANOVA) was also used to assess differences in overall VDS subscale scores (Oral and Pharyngeal) between CVA and PD.
For research question 2, binary logistic regressions were used to determine how time-to-LVC and LVCd predicted normal vs. abnormal swallowing for CVA then PD groups, respectively. A PAS score of 1 or 2 was defined as normal and scored as a “0” and PAS scores 3-8 were defined as abnormal and scored as a “1”. To explore the influence of bolus characteristics, volume and consistency were examined with separate univariate ANOVAs to determine the potential need to include them as variables of interest in the regression model.
For research question 3, a multivariate analysis of covariance (MANCOVA) was used to examine the differences of time-to-LVC and LVCd between all CVA and PD patients, controlling for both bolus volume and consistency. All α levels for detecting significance were set to 0.05 and effect sizes were computed post hoc.
RESULTS
Data screening
Due to the individual and heterogeneous needs of patients at the time of their VFSS assessment, patients did not consume all bolus consistencies and volumes equally. Therefore, data screening was conducted to determine which consistencies and volumes all patients were able to consume and tolerate during the VFSS, and only data from patients receiving the same bolus types were included in the final analyses. All bolus consistencies and volumes across every patient were identified and recorded. Initial data screening indicated that all patients participated in at least one trial of thin liquid by teaspoon, nectar liquid by teaspoon and cup, and pudding thick consistency by teaspoon. There were no significant between-group differences in the number of patients recorded while swallowing either bolus volume or consistency (all p > 0.05). As such, kinematic and PAS scores derived from only those textures and volumes were included in the final analysis.
Descriptive statistics
A total of 110 (60 PD and 50 CVA) individual patients were included in the final analysis. Descriptive statistics are shown in Table 1. The distribution of gender across all patients was 53% male to 47% female. Within the CVA cohort, a 56% female to 44% male breakdown was observed. Within the PD cohort, a distribution of 62% male to 38% female was observed. Chi-square analysis indicated no significant differences between groups in terms of gender (p > 0.05). The mean and standard deviation for age of the CVA cohort was 76.24(±12.58) years, and for PD was 78.67(±8.08) years. Independent t-tests displayed no significant differences between groups for age (p > 0.05). The mean time elapsed from CVA diagnosis to dysphagia evaluation was 1.92(±1.6) months. The mean disease duration length for PWPD was 4.59(±4.80) years.
Table 1
Descriptive statistics for patient demographics
| Disease group | ||
| Total demographics | CVA | PD |
| Gender between groups (Male/Female%) | 53/47 (p > 0.05) | |
| Gender within groups (Male/Female%) | 56/44 | 62/38 |
| Age (mean±SD) | 76.24 (12.58) years | 78.67 (8.08) years (p > 0.05) |
| Time from diagnosis (mean±SD) | 1.92 (1.6) months | 4.59 (4.8) years |
| Oropharyngeal dysphagia diagnosis | 100% | 100% |
| Esophageal dysfunction | 14% | 52% |
| Time-to-LVC | 0.21 (±0.09) | 0.24 (±0.24) |
| LVCd | 0.55 (±0.20) | 0.50 (±0.20) |
A total of 844 swallows were measured and included in the final analysis with PAS scores obtained from every swallow. Across all patients, 68% of swallows were categorized as normal (PAS scores of 1 or 2) and the remaining 32% defined as abnormal (PAS scores ≥3). All patients included in the final analysis were diagnosed with oropharyngeal dysphagia (100%), per inclusion criteria. 4 patients in the CVA cohort who were originally diagnosed with oral dysphagia only were excluded from the final analysis as they showed no measurable impairments based on the outcome measures being used in this study. In assessing the frequency of Esophageal dysfunction diagnoses 7 patients were diagnosed with Esophageal dysfunction at time of assessment (14% of patients) in the CVA cohort, compared to 31 (52%) in the PD cohort.
Distribution of PAS scores and dysphagia presentation
Chi-square analysis revealed no significant differences in the distribution of PAS scores between groups (χ2 = 9.19, p = 0.163). 69.9% of swallows in CVA patients and 67.2% of swallows in PD patients were considered normal (PAS score 1-2). The distribution of aspiration events was similar with 36 (10%) events and 38 (7.9%). A summary of the distributions of PAS scores per group can be found in Table 2. Despite the nonsignificant chi-square, large discrepancies were observed between groups in frequencies of a PAS score of 3, with 58 (16% of swallows) occurrences in the CVA group compared to 105 (22%) for PWPD.
Table 2
Distribution of penetration and aspiration events by group & consistency
| PAS levels N(%) | |||
| Normal | Abnormal | Aspiration | |
| (1-2) | (3-8) | events (6-8) | |
| Diagnosis Status | |||
| PD | 67.2% | 32.8% | 7.9% |
| CVA | 69.9% | 30.1% | 10% |
| Consistencies | |||
| Thin | 53% | 47% | 13% |
| Nectar | 66% | 34% | 9% |
| Pudding | 86% | 14% | 3.6% |
| Volume | |||
| Teaspoon | 72.3% | 27.7% | 9% |
| Cup | 59.5% | 40.5% | 8.8% |
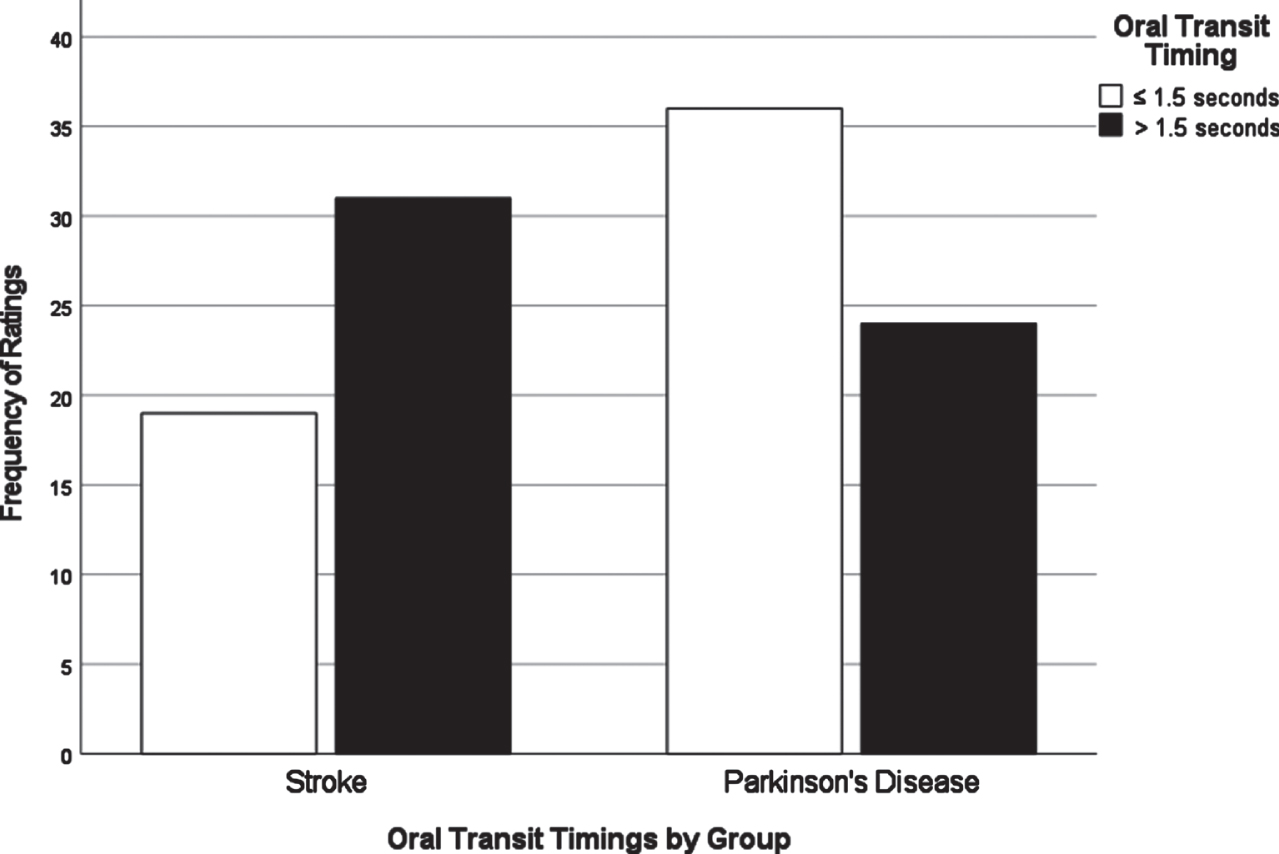
Chi-square analyses of dysphagia presentation between CVA and PD based on individual VDS items revealed significant differences in the distribution of scores for several items. All VDS items may be found in Supplementary Material 3. Oral transit times (χ2 = 5.28, p = 0.02) showed a significant association of higher scores (prolonged oral transit timings) with the CVA group. Higher (worse) vallecular residue scores (χ2 = 9.17, p = 0.03), and reduced laryngeal elevation (χ2 =7.19, p = 0.007) both displayed significant associations with the PD group. Though apraxia scores (χ2 = 9.18, p = 0.057) and tongue-to-palate contact scores (χ2 = 3.70, p = 0.054) were nonsignificant statistically, both sub-scale components indicated a trend towards worse scores for the CVA group. For apraxia scores, 70% of the PD group scored normal in this category while only 52% in the CVA group scored normal. 34% of the CVA group were scored with mild apraxia alone, while 30% of the remaining PD group in total fell into any of the possible apraxia categories (mild, moderate, severe). VDS items that were significantly different in their distribution across groups are presented in Figs. 1–3.
Fig. 1
Laryngeal elevation by group.
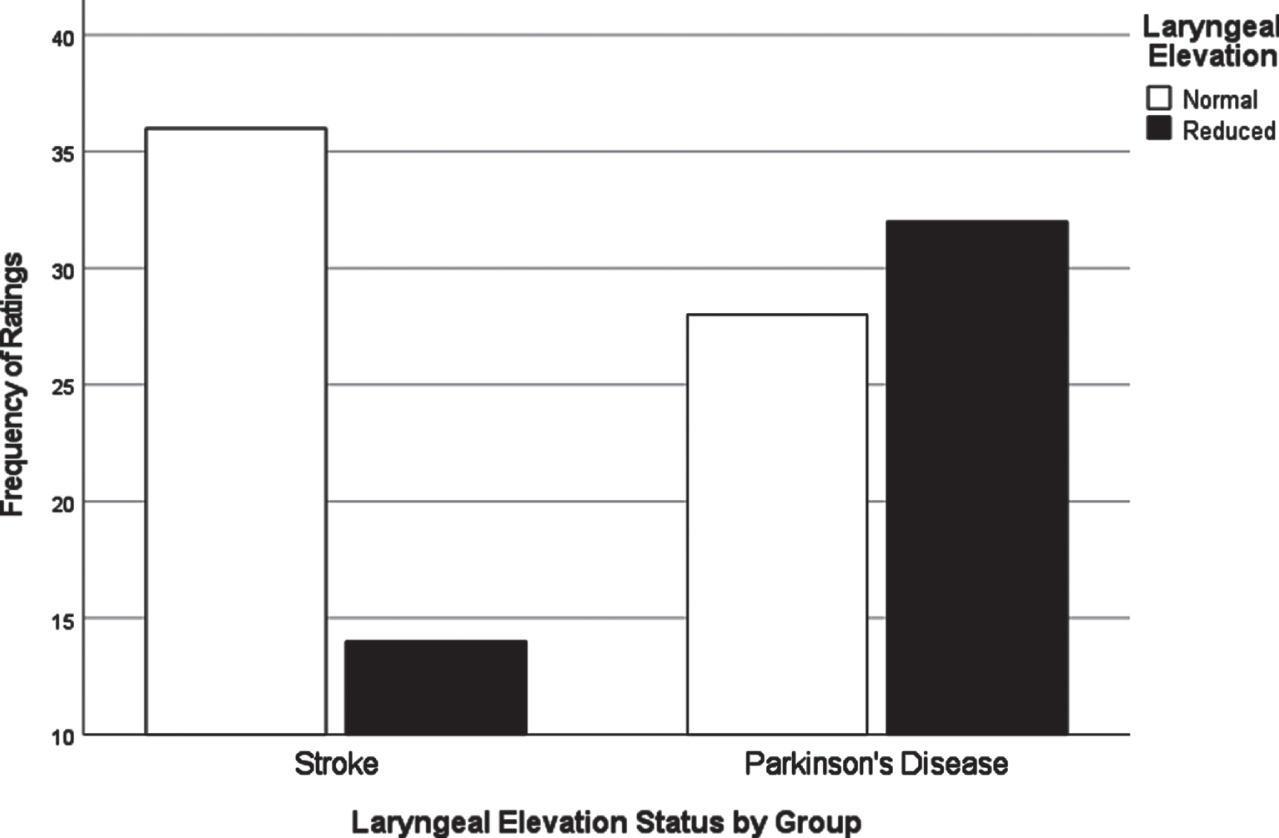
Fig. 2
Vallecular residue ratings by group.
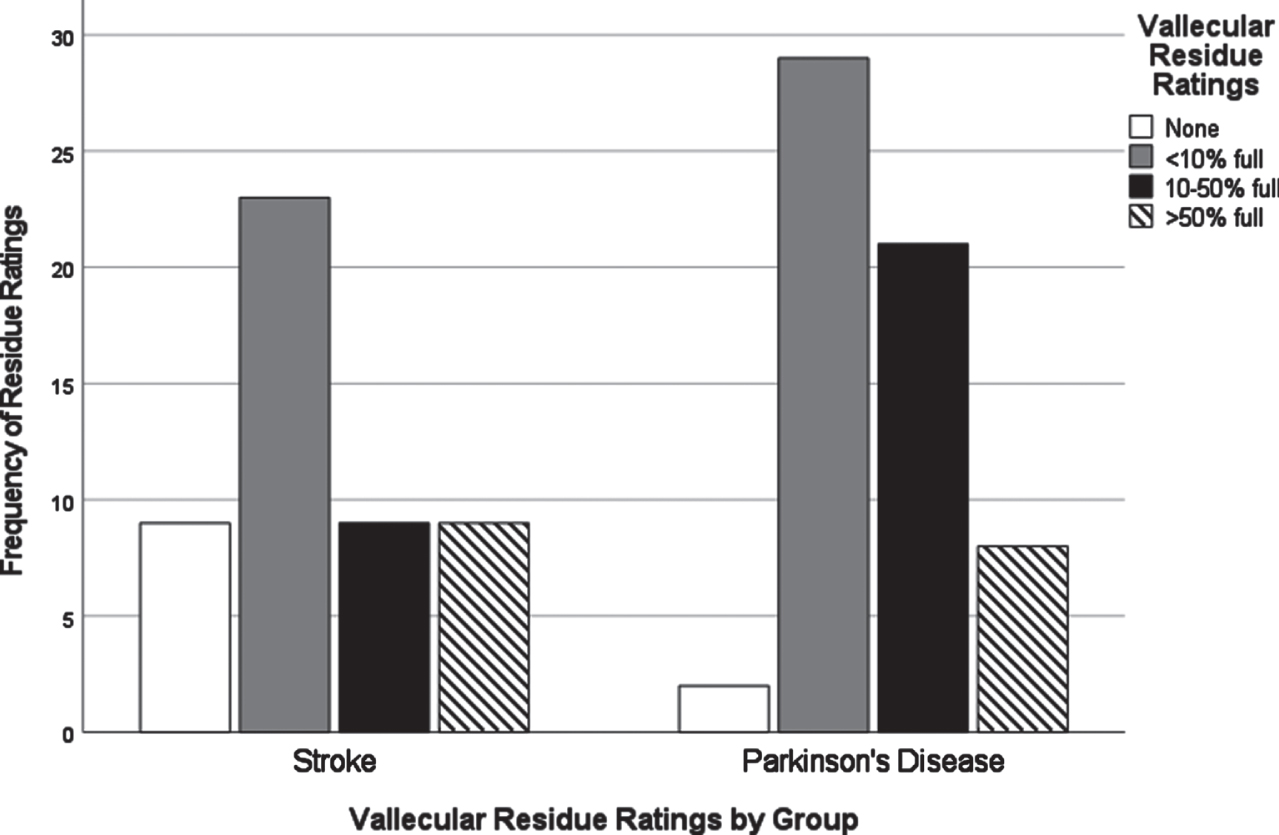
Fig. 3
Oral transit timings by group.
Differences in oral and pharyngeal VDS scores between CVA and PD
A one-way MANOVA testing for the effects of group membership (PWPD and CVA) for dysphagia severity based on VDS components (oral total scores and pharyngeal total scores) was conducted. VDS total scores were linearly dependent on the two other VDS variables (total scores are a function of oral and pharyngeal scores combined). As such, total VDS score as a variable was omitted from the final analysis. A separate univariate ANOVA confirmed no significant differences between groups for total VDS scores prior to conducting the final MANOVA (p = 0.29). Visual inspection of scatterplots indicated relative normality and Box’s M (M = 1.85, p = 0.61) indicated no concerns for heteroscedasticity. An omnibus multivariate analysis indicated a significant effect of group (PWPD and CVA) on VDS scores (T = 0.098, F[2] = 5.26, p = 0.007). The omnibus associated R2 statistics for the model (R2 = 0.09) indicated the combined effect of the variables in the model accounted for 9% of variance in the data. Between-subjects effects indicated a significant effect for VDS oral (F[1] = 7.6, p = 0.007) and VDS pharyngeal (F[1] = 4.47, p = 0.037) scores. Associated R2 statistics for VDS oral scores (R2 = 0.07) and VDS pharyngeal (R2 = 0.04) indicated the variables in our model accounted for 7% and 4% of the variance in the data, respectively. Inspection of pairwise-comparisons showed that the CVA group scored significantly higher (worse) in VDS oral components while the PD group scored significantly higher (worse) in the VDS pharyngeal components. In terms of estimating the size of the effect of these results, main effects of diagnosis on VDS oral scores and VDS pharyngeal scores resulted in medium and small effects (Cohen’s d = 0.52 and 0.41).
Laryngeal kinematics and bolus characteristics on penetration or aspiration
Chi-square analysis for distribution of PAS scores by consistency displayed a significant result (χ2 = 96.49, p < 0.001). For consistencies, pudding boluses were categorized with normal swallow events for 86% of those swallows, while nectar (66%) and thin (53%) showed decreasing instances of normal swallow classification respectively. In terms of aspiration events (PAS≥6), thin liquids were classified as aspiration on 13% of trials for that consistency while nectar (9%) and pudding (3.6%) accounted for far less aspiration related events. Chi-square test for distribution of PAS scores by volume also displayed a significant result (χ2 = 47.99, p < 0.001). Out of 844 swallows, teaspoon volume accounted for 548 (65%) and cup volume accounted for 296 (35%), indicating that teaspoon sized boluses were administered significantly more often than cup sized. A full report of PAS scores by bolus consistency and volume can be found in Table 2.
All cup volume boluses were associated with nectar thick consistencies. Despite the thicker consistency of nectar, teaspoon boluses which included both thin and pudding consistencies displayed lower rates of abnormal swallow events with 72.3% of swallows categorized as normal while cup volumes of nectar consistencies displayed normal swallow events 59.5% of the time. Chi-square results also displayed no significant differences (all p > 0.05) in the distribution of volume or consistency across diagnosis, indicating that volume and consistency effects on PAS scores were likely not isolated to one disease condition. Due to the apparent contribution of bolus characteristics overall to abnormal swallow events, it was considered appropriate to include these variables in the logistic regression model.
The first binary logistic regression was used to determine which laryngeal kinematics were best able to predict whether a patient would have a normal or abnormal swallow event in the CVA cohort. The binary outcome variable consisted of previously applied PAS scores recoded into either a normal (PAS scores of 1 or 2) or abnormal (PAS≥3) state. Kinematic predictor variables included time-to-LVC and LVCd, as well as volume (teaspoon and cup) and consistency (thin, nectar, pudding) of bolus as non-kinematic variables. A forward-entry regression approach was used to define the most parsimonious set of predictor variables and accurate model fit, for both regression models based on the Wald statistic for the variable’s contribution to a significant model. It has been suggested that using the Wald statistic as a criterion for variable selection may be more appropriate with a larger n of observations [31]. We believe that the n of these samples (n = 363 swallows in the CVA cohort and n = 461 in the PWPD cohort) is appropriate for choosing this method rather than the Likelihood-ratio.
The regression model produced a significant result over the constant (χ2 [2] = 35.54, p < 0.001) and a goodness-of-fit result (p > 0.05) indicated our regression model accurately fit our data. The Nagelkerke R2 = 0.13, indicated our model was accounting for 13% of the variance in the data. Overall, our model displayed a correct predictive rate of swallow event 67% of the time. Examination of the correlation matrix indicated no variables correlated higher than R = 0.44 suggesting there were no strong correlations between variables in the model, and therefore we were able to move forward with interpretation of the model. An overall model summary can be found in Table 3. Bolus volume (W = 1.43, p = 0.232), time-to-LVC (W = 1.07, p = 0.300), and LVCd (W = 2.97, p = 0.085) were excluded as variables from the final model after failing to contribute significantly to any step of the model produced.
Table 3
Regression Summaries for Predicting Abnormal Swallow Events for CVA and PWPD
| Group (CVA or PD) | Predictors | β | Wald | Sig. (p) | Odds Ratio | 95% CI |
| CVA | Pudding Consistency | –1.87 | 27.03 | <0.001 | 0.15 | 0.08–0.31 |
| PD | Time-to-LVC | 3.92 | 9.09 | 0.003 | 50.36 | 3.94–64.77 |
| LVCd | 1.50 | 5.86 | 0.02 | 4.50 | 1.33–15.22 | |
| Nectar Consistency | –1.07 | 20.63 | <0.001 | 0.34 | 0.22–0.55 | |
| Pudding Consistency | –1.99 | 38.09 | <0.001 | 0.14 | 0.07–0.26 | |
| Cup Volume | 0.46 | 3.95 | 0.04 | 1.59 | 1.01–2.51 |
Table 4
LVC timing differences between CVA and PD
| Kinematic variables | F statistic | Sig. (p) | Pairwise Difference (PD –CVA) | Effect size (Cohen’s d) |
| Time-to-LVC | 14.17 | <0.001 | -0.40 | 0.52 |
| LVCd | 8.64 | <0.001 | 0.06 | 0.27 |
Bolus consistency was significant for only one category (pudding) compared to the reference (thin). Pudding consistencies (β=-1.87, W = 27.03, p < 0.001, OR = 0.15) indicated significantly decreased odds of abnormal swallow events. This suggested a 95% reduction in the odds of a swallow being classified as abnormal over thin consistencies. Nectar consistencies (β=-0.36, W = 1.86, p = 0.17, OR = 0.70) were not a significant predictor of reduced abnormal swallow events.
The second binary logistic regression model was run to determine the same outcomes and used the same variables related to the cohort of PWPD (see above). The regression model produced a significant result over the constant (χ2[5] = 78.88, p < 0.001) and a goodness-of-fit test result (p > 0.05) indicated our regression model accurately fit our data. The Nagelkerke R2 = 0.21, indicated our model was accounting for 21% of the variance in the data. Overall, our model displayed a correct predictive rate of swallow event 70% of the time. Sensitivity (true-positives) and specificity (true-negatives) were 31% and 89%, respectively. Examination of the correlation matrix indicated no variables correlated higher than R = 0.34 suggesting there were no strong correlations between variables in the model, and therefore we were able to move forward with interpretation of the model. An overall model summary can be found in Table 3.
All variables entered in the regression were included as significant in the final iteration of the model (Step 4). Bolus volume (W = 3.95, p = 0.04, OR = 1.59) indicated larger volumes (cup sized) significantly increased the odds of penetration or aspiration occurring, with a 59% increase in the odds of this occurring. Both bolus consistencies (nectar and pudding) displayed significant reductions in the odds of penetration or aspiration in comparison to the reference (thin). Nectar consistencies (W = 20.63, p < 0.001, OR = 0.34) and pudding consistencies (W = 38.09, p < 0.001, OR = 0.14) suggested 66% and 86% reductions in the odds of penetration or aspiration compared to thin consistencies. Finally, both time-to-LVC (W = 9.09, p = 0.003, OR = 50.36) and LVCd (W = 5.86, p = 0.02, OR = 4.5) both significantly predicted whether a swallow would present normally or with penetration/aspiration. These results suggested a 50x increase in the odds of penetration or aspiration occurring as time-to-LVC became larger, and a 4.5x increase in the odds of penetration or aspiration occurring as LVCd times became larger.
Laryngeal kinematic differences between CVA and PD
Separate univariate ANOVAs were significant for both consistency (p = 0.028) and volume (p = 0.011) effects on laryngeal kinematic timings. These variables were then considered as relevant covariates to move forward in MANOVA hypothesis testing when laryngeal kinematics were included in the model. Age or gender had no significant effect on kinematic, dysphagia, or swallow event related outcomes (all p > 0.05) and were therefore not carried forward as covariates of interest into the model.
A one-way MANCOVA testing for the effect of group membership (PD vs. CVA) on kinematic differences (time-to-LVC and LVCd) was conducted with both volume and consistency serving as covariates in the model. These categorical variables were dummy coded to fit inclusion as covariates in the model [32]. Visual inspection of scatterplots indicated relative normality and Box’s M (M = 1.03, p = 0.79) indicated no concerns for heteroscedasticity. An omnibus multivariate analysis indicated a significant effect of group on kinematic timings (Hotellings Trace; T = 0.058, F[2] = 24.20, p < 0.001). Inspection of between-subjects effects indicated significant results for both time-to-LVC (F[4] = 14.7, p < 0.001) and LVCd (F[4] = 8.64, p < 0.001) when controlling for bolus consistency and volume. Associated R2 statistics for time-to-LVC (R2 = 0.07) and LVCd (R2 = 0.04) indicated that our model was accounting for 7% and 4% of the variance in the data, respectively. Inspection of pairwise comparisons showed that time-to-LVC was significantly longer (i.e., slower) in PWPD than in CVA. Additionally, LVCd was significantly shorter in PWPD than in CVA. Corresponding effect sizes for kinematic measures indicate the main effect of diagnosis on time-to-LVC resulted in a medium effect (Cohen’s d = 0.52) while the main effect of diagnosis on LVCd resulted in a small effect (Cohen’s d = 0.27).
Reliability
Total VDS scoring interrater reliability was excellent (ICC = 0.99, p = 0.02, CI = 0.93-0.99). Interrater reliability for kinematic measures indicated excellent reliability for both time-to-LVC (ICC = 0.94, p < 0.001, CI = 0.78-0.97) and LVCd (ICC = 0.95, p < 0.001, CI = 0.911-0.97). For PAS scores, interrater (ICC = 0.97, p < 0.001, CI = 0.94-0.98) values indicated excellent reliability for judging events of penetration and/or aspiration. Intrarater reliability for total VDS scoring indicated excellent reliability (ICC = 0.95, p < 0.001, CI = 0.62-.99). Intrarater reliability for time-to-LVC (ICC = 0.93, p < 0.001, CI = 0.87-0.96) and LVCd (ICC = 0.95, p < 0.001, CI = 0.88-0.97) indicated excellent reliability. Intrarater reliability for PAS scores was also excellent (ICC = 0.91, p < 0.001, CI = 0.83-0.93).
DISCUSSION
Dysphagia presentation in PD compared to CVA
A major goal of this study was to compare how dysphagia presents in PWPD compared to those diagnosed with CVA. The first research question asked what the most frequent physiological breakdowns in swallowing are in PD compared to CVA, based on all components scored in the VDS. It was hypothesized that these breakdowns in swallowing, as measured by item severity scores on the VDS, would manifest similarly in both populations. It was also hypothesized that abnormal swallow events of penetration (PAS scores 3-5) and aspiration (PAS scores 6-8) as measured by the Penetration Aspiration Scale (PAS) [19] would occur more frequently in PWPD. These results indicated that PWPD were more likely to exhibit frequent breakdowns related to the pharyngeal stage of swallowing, including reduced laryngeal elevation and residue, compared to patients with CVA. CVA patients displayed more frequent and severe impairments related to the oral stage of swallowing. Although overall dysphagia severity was similar between groups, our results indicated that PWPD are more impacted by pharyngeal stage impairments, and less impacted by oral stage impairments, when compared to patients with CVA.
These findings contribute to growing evidence that oral stage impairment is not as useful an indicator of dysphagia for PWPD. Previous research investigating oral stage impairment in PD, such as tongue pressure or oral transit times, has been based on the supposition that oral stage impairment is the most prevalent issue related to dysphagia in PWPD [33, 34]. However, our sample of PD patients displayed more frequent and more severe pharyngeal stage impairment. Our ability to compare this presentation to another etiology of dysphagia such as CVA provides more evidence that, although oral stage impairment does present in PD, it is most likely not the strongest or most reliable contributor to overall dysphagia severity. These findings are supported by those of Nienstedt et al. [35] who were able to show that deficits related to the oral stage, such as drooling, do not necessarily cause further issues in the pharyngeal stage such as residue management or decreased swallow safety.
An unexpected finding in our study was the lack of separation in PAS scores between the CVA and PD groups. While we originally hypothesized PWPD would have higher rates of penetration or aspiration, this was not the case. Patients in the CVA group presented with findings of aspiration 10% of the time and abnormal rates of swallow safety in 30% of swallows, in line with previous literature exploring swallow safety outcomes in post-CVA patients [36, 37]. PWPD displayed similar outcomes, with 8% categorized as silent aspiration alone and 33% of swallows categorized as abnormal PAS scores overall. Although the data did not confirm our hypothesis regarding PAS scores in PWPD, the rates of patients who did show aspiration (PAS 6-8) support findings in the existing literature [38] with greater than 30% of PWPD having an aspiration related event. Moreover, when considering that normal PAS scores of 1 and 2 should account for greater than 95% of swallows [39, 40] our study was able to show that both CVA and PD groups displayed substantially worse swallow safety metrics compared to normative data. Particularly for PWPD, these findings contribute significantly to a growing body of literature showing that PWPD are exhibiting abnormal swallow events regardless of disease duration, severity, or reports of dysphagia.
Predictors of abnormal swallowing between CVA and PD
Another goal of this study was to determine if laryngeal kinematics or bolus properties were strong predictors of penetration and aspiration in CVA and PD groups. We also sought to examine how laryngeal kinematics differ between these groups. In terms of bolus consistency, both CVA and PWPD patients were more likely to experience airway invasion on thin liquids than thicker liquids and were at the lowest risk of penetration or aspiration when consuming pudding thick consistencies. These findings are in line with the consensus for how individuals may respond to thicker liquids [40] as well as maximizing swallow safety in the clinical management of reducing events of penetration and/or aspiration [41–43]. Bolus volume was not a significant contributor for predicting abnormal swallow events in CVA. Despite having low predictive value, the findings in this study of higher rates of abnormal swallow events for larger boluses compared to smaller in clinical etiologies of dysphagia such as CVA agree with existing literature [44, 45].
In PWPD, however, larger volumes were significantly associated with occurrences of airway invasion. PWPD have been shown to take larger than expected bolus sip size on thicker consistencies [46] and all cup volume trials in this sample were of thickened consistencies. This suggests that the volume of liquid being taken per administration in PWPD, regardless of consistency, significantly elevates the risk of episodes of airway invasion. The reason for discrepancies on sip volume predictive ability between groups remains unclear. Healthy adults have been shown to take smaller sip volumes as boluses become thicker [40], and the self-selection of sip volume is suggested to be based on several factors including sensory integration and stable motor performance [47]. This may reflect several underlying causes of connection between larger bolus volumes and airway invasion in PWPD compared to CVA. It has been well documented that PWPD experience altered sensorimotor integration and motor control as a part of the disease process [48–50]. Poor sensorimotor integration and motor control may contribute to increased motor variability, resulting in a reduced ability to self-select consistent sip volumes or respond effectively when increased volumes are administered.
Another potential contributor may be awareness or perception of swallowing deficits. Parker et al. [51] suggested that even in post-stroke dysphagic patients with poor awareness, smaller average sip volumes were taken when compared to normative data. Given the attention that is often given to post-stroke dysphagia screening and assessment, and the potential lack of information provided to PWPD regarding swallowing difficulties that manifest with the disease [17, 18], discrepancies in self-awareness of swallowing difficulties may be a contributing factor. Substantially more research is needed to further our understanding of how PWPD understand swallowing difficulties and to improve education of dysphagia awareness from the time of diagnosis. Taken together, issues of bolus consistency, bolus volume, and patient knowledge of dysphagia have substantial clinical implications for the implementation of thickened consistencies as a dysphagia management strategy. This includes balancing patient experiences of pleasure and palatability when eating and drinking [52] with management of airway invasion, and improving patient awareness and knowledge of swallowing disorders.
Regarding laryngeal kinematics, both time-to-LVC and closure duration (LVCd) timings of the laryngeal vestibule were able to predict whether patients would display abnormal swallow events of penetration or aspiration in PWPD. Results also indicated significant differences in time-to-LVC and LVCd. However, these measures as predictors for abnormal swallows were not significant in CVA patients. While time-to-LVC predicting penetration or aspiration supports our hypothesis and the current literature in PD [8–10] the lack of predictive ability of time-to-LVC in the CVA group was not expected, as time-to-LVC is often described as one of the major contributors to airway invasion in post-stroke dysphagia and most neurogenic etiologies of dysphagia [21, 22]. The association of prolonged LVCd and airway invasion in PWPD has been postulated elsewhere [10] although the lack of association between LVCd and airway invasion in CVA agrees with the existing literature [53], in that LVCd by itself is not a strong predictor of airway invasion.
From a clinical standpoint these findings provide important distinctions and suggest the need for increased awareness of how dysphagia manifests in different neurologically impaired populations. Though current literature suggests that time-to-LVC is one of the strongest predictors of airway invasion across neurogenic etiologies of dysphagia [12], it is possible that subgroups may be inflating the predictive power of generalized measures (i.e., time-to-LVC). Therefore, increased attention needs to be given to the reality that physiological mechanisms of dysphagia and airway invasion may be different across clinical subgroups. Measured differences in time-to-LVC and LVCd may indicate differential adaptations, responses, and internal compensatory strategies in different etiologies of dysphagia (PD vs. CVA). Perhaps most importantly, identifying the distinct differences between these groups offers novel insight to the potential for investigating and developing specific, targeted treatment approaches for different etiologies of dysphagia.
Limitations and future research recommendations
This study was not without limitations and as such, caution should be used when interpreting these results. The two groups used in this study represented distinct neurological etiologies of dysphagia. The two groups included in this study were also clinically based samples. The data used was dependent on what was made available via the medical record and the VFSS conducted. It is therefore possible that some data such as underlying conditions may remain unaccounted for. As an example, because these VFSS were completed on a mobile radiography unit, they often took place in a non-centralized location dependent on the patient. Therefore, information such as medical or specialist follow up for severity of disease in PD, or full medical record access was not always possible or was incomplete. Despite being able to provide durations from the onset of conditions, the inability to provide specific disease severity information should be considered a limitation of this study.
Due to the retrospective methods employed in this study, a lack of control over the VFSS protocol are also a limitation. As an example, due to time restraints and practicality, real world measurements for administration such as teaspoon, or using a patients individual natural sip size were used and included. Future research and design should utilize more tightly controlled environments and methods to ensure adequate replication of these results. While our results do align with and support much of the existing literature, future research should seek to confirm these findings.
The use of the VDS as a tool to quantify dysphagia presentation across swallow stages may also be a limitation of this study. Quantification of dysphagia during VFSS in general continues to lack sufficient evidence of reliability in the literature available [54]. Additionally, recent literature suggests a shift to pixel-based measures of dysphagia presentation rather than visuoperceptual ratings [55] provides more accurate severity ratings. These suppositions in the literature therefore include the VDS used in this study, as it relies on visuoperceptual ratings of severity and should therefore be considered a limitation. Finally, this study only examined two temporal kinematic factors of interest (time-to-LVC and LVCd). It is possible that other spatial or temporal kinematic measurements may help develop more robust and complete models of airway invasion prediction. Future studies should continue to examine further how other measurements of swallow mechanics contribute to airway invasion in different etiologies of dysphagia.
ACKNOWLEDGMENTS
We would like to acknowledge Diagnostex for their assistance in conducting the swallow studies utilized in this project.
CONFLICT OF INTEREST
The authors report no conflict of interests to report.
SUPPLEMENTARY MATERIAL
[1] The supplementary material is available in the electronic version of this article: https://dx.doi.org/10.3233/JPD-223272.
REFERENCES
[1] | Simons JA ((2017) ) Swallowing dysfunctions in Parkinson’s disease. Int Rev Neurobiol 134: , 1207–1238. |
[2] | Mamolar Andrés S , Santamarina Rabanal ML , Granda Membiela CM , FernándezGutiérrez MJ , Sirgo Rodríguez P , Álvarez Marcos C ((2017) ) Trastornos de la deglución enla enfermedad de Parkinson. Acta Otorrinolaringol Esp 68: , 15–22. |
[3] | Suttrup I , Warnecke T ((2016) ) Dysphagia in Parkinson’s disease. Dysphagia 31: , 24–32. |
[4] | Kwon M , Lee J-H ((2019) ) Oro-pharyngeal dysphagia in Parkinson’s disease and related movement disorders. J Mov Disord 12: , 152–160. |
[5] | Beyer MK , Herlofson K , Årsland D , Larsen JP ((2001) ) Causes of death in a community-based study of Parkinson’s disease: Causes of death in Parkinson’s disease. Acta Neurol Scand 103: , 7–11. |
[6] | Yoritaka A , Shimo Y , Takanashi M , Fukae J , Hatano T , Nakahara T , Miyamato N , Urabe T , Mori H , Hattori N ((2013) ) Motor and non-motor symptoms of 1453 patients with Parkinson’s disease: Prevalence and risks. Parkinsonism Relat Disord 19: , 725–731. |
[7] | Jones CA , Colletti CM , Ding M-C ((2020) ) Post-stroke Dysphagia: recent insights and unanswered questions. Curr Neurol Neurosci Rep 20: , 61. |
[8] | Curtis JA , Molfenter S , Troche MS ((2020) ) Predictors of residue and airway invasion in Parkinson’s disease. Dysphagia 35: , 220–230. |
[9] | Dumican M , Watts C ((2020) ) Predicting airway invasion using screening tools and laryngeal kinematics in people with Parkinson’s disease: a pilot study. J Parkinsons Dis 10: , 1153–1160. |
[10] | Dumican M , Watts C , Drulia T , Zhang Y (2022) Dysphagia presentation, airway invasion, and gender differences in a clinically based sample of people with Parkinson’s disease. Dysphagia, doi: 10.1007/s00455-022-10472-y. |
[11] | Takizawa C , Gemmell E , Kenworthy J , Speyer R ((2016) ) A systematic review of the prevalence of oropharyngeal dysphagia in stroke, Parkinson’s disease, Alzheimer’s disease, head injury, and pneumonia. Dysphagia 31: , 434–441. |
[12] | Smaoui S , Peladeau-Pigeon M , Steele CM ((2022) ) Determining the relationship between hyoid bone kinematics and airway protection in swallowing. J Speech Lang Hear Res 65: , 419–430. |
[13] | Paik N-J , Kim SJ , Lee HJ , Jeon JY , Lim J-Y , Han TR ((2008) ) Movement of the hyoid bone and the epiglottis during swallowing in patients with dysphagia from different etiologies. J Electromyogr Kinesiol 18: , 329–335. |
[14] | Warnecke T , Labeit B , Schroeder J , Reckels A , Ahring S , Lapa S , Claus I , Muhle P , Suntrup-Krueger S , Dziewas R ((2021) ) Neurogenic dysphagia: a systematic review and proposal of a classification system. Neurology 96: , e876–e889. |
[15] | Marras C , Beck JC , Bower JH , Roberts E , Ritz B , Ross GW , Abbott RD , Savica R , Van Den Eeden SK , Willis AW , Tanner CM ; Parkinson’s Foundation P4 Group ((2018) ) Prevalence of Parkinson’s disease across North America. NPJ Parkinsons Dis 4: , 21. |
[16] | Ovbiagele B , Nguyen-Huynh MN ((2011) ) Stroke epidemiology: advancing our understanding of disease mechanism and therapy. Neurotherapeutics 8: , 319–329. |
[17] | Swales M , Theodoros D , Hill AJ , Russell T ((2021) ) Communication and swallowing changes, everyday impacts and access to speech-language pathology services for people with Parkinson’s disease: An Australian survey. Int J Speech Lang Pathol 23: , 70–82. |
[18] | Salinas MR , Chambers EJ , Ho T , Khemani P , Olson DM , Stutzman S , Chitnis S ((2020) ) Patient perceptions and knowledge of Parkinson’s disease and treatment (KnowPD). Clin Park Relat Disord 3: , 100038. |
[19] | Rosenbek JC , Robbins JA , Roecker EB , Coyle JL , Wood JL ((1996) ) A penetration-aspiration scale. Dysphagia 11: , 93–98. |
[20] | Hammer MJ , Murphy CA , Abrams TM ((2013) ) Airway somatosensory deficits and dysphagia in Parkinson’s disease. J Parkinsons Dis 3: , 39–44. |
[21] | Cabib C , Nascimento W , Rofes L , Arreola V , Tomsen N , Mundet L , Muriana D , Palomeras E , Michou E , Clavé P , Ortega O ((2020) ) Neurophysiological and biomechanical evaluation of the mechanisms which impair safety of swallow in chronic post-stroke patients. Transl Stroke Res 11: , 16–28. |
[22] | Park T , Kim Y , Ko D-H , McCullough G ((2010) ) Initiation and duration of laryngeal closure during the pharyngeal swallow in post-stroke patients. Dysphagia 25: , 177–182. |
[23] | Mulheren RW , Azola A , González-Fernández M ((2019) ) Do ratings of swallowing function differ by videofluoroscopic rate? An exploratory analysis in patients after acute stroke. Arch Phys Med Rehabil 100: , 1085–1090. |
[24] | Im I , Kim H , Kim H-G , Ko M-H ((2017) ) Relationship between temporal measurements of pharyngeal swallowing and penetration-aspiration in unilateral stroke patients. Commun Sci Disord 22: , 570–577. |
[25] | Park T , Kim Y , Oh B-M ((2017) ) Laryngeal closure during swallowing in stroke survivors with cortical or subcortical lesion. J Stroke Cerebrovasc Dis 26: , 1766–1772. |
[26] | Steele CM , Grace-Martin K ((2017) ) Reflections on clinical and statistical use of the Penetration-Aspiration Scale. Dysphagia 32: , 601–616. |
[27] | Park J-W , Oh J-C , Lee J-W , Yeo J-S , Ryu KH ((2013) ) The effect of 5Hz high-frequency rTMS over contralesional pharyngeal motor cortex in post-stroke oropharyngeal dysphagia: a randomized controlled study: 5Hz rTMS over intact pharyngeal cortex. Neurogastroenterol Motil 25: , 324–e250. |
[28] | Han TR , Paik N-J , Park J-W , Kwon BS ((2008) ) The prediction of persistent dysphagia beyond six months after stroke. Dysphagia 23: , 59–64. |
[29] | Kim J , Oh B-M , Kim JY , Lee GJ , Lee SA , Han TR ((2014) ) Validation of the videofluoroscopic dysphagia scale in various etiologies. Dysphagia 29: , 438–443. |
[30] | Borders JC , Brates D ((2020) ) Use of the Penetration-Aspiration Scale in dysphagia research: a systematic review. Dysphagia 35: , 583–597. |
[31] | Agresti A ((2007) ) An Introduction to Categorical Data Analysis, John Wiley & Sons, Inc., Hoboken, NJ, USA. |
[32] | HowellDC ((2010) ) Statistical Methods for Psychology (7th ed.). Cengage Learning Inc. |
[33] | Minagi Y , Ono T , Hori K , Fujiwara S , Tokuda Y , Murakami K , Maeda Y , Sakoda S , Yokoe M , Mihara M , Mochizuki H ((2018) ) Relationships between dysphagia and tongue pressure during swallowing in Parkinson’s disease patients. J Oral Rehabil 45: , 459–466. |
[34] | Wakasugi Y , Yamamoto T , Oda C , Murata M , Tohara H , Minakuchi S ((2017) ) Effect of an impaired oral stage on swallowing in patients with Parkinson’s disease. J Oral Rehabil 44: , 756–762. |
[35] | Nienstedt JC , Buhmann C , Bihler M , Niessen A , Plaetke R , Gerloff C , Pflug C ((2018) ) Drooling is no early sign of dysphagia in Parkinson′s disease. Neurogastroenterol Motil 30: , e13259. |
[36] | Falsetti P , Acciai C , Palilla R , Bosi M , Carpinteri F , Zingarelli A , Pedace C , Lenzi L ((2009) ) Oropharyngeal dysphagia after stroke: incidence, diagnosis, and clinical predictors in patients admitted to a neurorehabilitation unit. J Stroke Cerebrovasc Dis 18: , 329–335. |
[37] | Nakamori M , Hosomi N , Imamura E , Matsushima H , Maetani Y , Yoshida M , Yoshikawa M , Takeda C , Nagasaki T , Masuda S , Kayashita J , Tsuga K , Tanimoto K , Wakabayashi S , Maruyama H ((2021) ) Association between stroke lesions and videofluoroscopic findings in acute stroke patients. J Neurol 268: , 1025–1035. |
[38] | Pflug C , Bihler M , Emich K , Niessen A , Nienstedt JC , Flügel T , Koseki J-C , Plaetke R , Hidding U , Gerloff C , Buhmann C ((2018) ) Critical dysphagia is common in Parkinson disease and occurs even in early stages: a prospective cohort study. Dysphagia 33: , 41–50. |
[39] | Humbert IA , Sunday KL , Karagiorgos E , Vose AK , Gould F , Greene L , Azola A , Tolar A , Rivet A ((2018) ) Swallowing kinematic differences across frozen, mixed, and ultrathin liquid boluses in healthy adults: age, sex, and normal variability. J Speech Lang Hear Res 61: , 1544–1559. |
[40] | Steele CM , Peladeau-Pigeon M , Barbon CAE , Guida BT , Namasivayam-MacDonald AM , Nascimento WV , Smaoui S , Tapson MS , Valenzano TJ , Waito AA , Wolkin TS ((2019) ) Reference values for healthy swallowing across the range from thin to extremely thick liquids. J Speech Lang Hear Res 62: , 1338–1363. |
[41] | Bolivar-Prados M , Rofes L , Arreola V , Guida S , Nascimento WV , Martin A , Vilardell N , Ortega Fernández O , Ripken D , Lansink M , Clavé P ((2019) ) Effect of a gum-based thickener on the safety of swallowing in patients with poststroke oropharyngeal dysphagia. Neurogastroenterol Motil 31: , e13695. |
[42] | Newman R , Vilardell N , Clavé P , Speyer R ((2016) ) Effect of bolus viscosity on the safety and efficacy of swallowing and the kinematics of the swallow response in patients with oropharyngeal dysphagia: White Paper by the European Society for Swallowing Disorders (ESSD). Dysphagia 31: , 232–249. |
[43] | Steele CM , Alsanei WA , Ayanikalath S , Barbon CEA , Chen J , Cichero JAY , Coutts K , Dantas RO , Duivestein J , Giosa L , Hanson B , Lam P , Lecko C , Leigh C , Nagy A , Namasivayam AM , Nascimento WV , Odendaal I , Smith CH , Wang H ((2015) ) Erratum to: The influence of food texture and liquid consistency modification on swallowing physiology and function: a systematic review. Dysphagia 30: , 272–273. |
[44] | Leder SB , Suiter DM , Green BG ((2011) ) Silent aspiration risk is volume-dependent. Dysphagia 26: , 304–309. |
[45] | Miles A , McFarlane M , Scott S , Hunting A ((2018) ) Cough response to aspiration in thin and thick fluids during FEES in hospitalized inpatients: Cough response in thin and thick fluids. Int J Lang Commun Disord 53: , 909–918. |
[46] | Gandhi P , Mancopes R , Sutton D , Plowman EK , Steele CM ((2021) ) The frequency of atypical and extreme values for pharyngeal phase swallowing measures in mild Parkinson disease compared to healthy aging. J Speech Lang Hear Res 64: , 3032–3050. |
[47] | Colevas SM , Stalter LN , Jones CA , McCulloch TM (2021) The natural swallow: factors affecting subject choice of bolus volume and pharyngeal swallow parameters in a self-selected swallow. Dysphagia, doi: 10.1007/s00455-021-10373-6. |
[48] | Lewis GN ((2002) ) Altered sensorimotor integration in Parkinson’s disease. Brain 125: , 2089–2099. |
[49] | Konczak J , Corcos DM , Horak F , Poizner H , Shapiro M , Tuite P , Volkmann J , Maschke M ((2009) ) Proprioception and motor control in Parkinson’s disease. J Mot Behav 41: , 543–552. |
[50] | Nelson AJ , Hoque T , Gunraj C , Chen R ((2018) ) Altered somatosensory processing in Parkinson’s disease and modulation by dopaminergic medications. Parkinsonism Relat Disord 53: , 76–81. |
[51] | Parker C , Power M , Hamdy S , Bowen A , Tyrrell P , Thompson DG ((2004) ) Awareness of dysphagia by patients following stroke predicts swallowing performance. Dysphagia 19: , 28–35. |
[52] | McCurtin A , Healy C , Kelly L , Murphy F , Ryan J , Walsh J ((2018) ) Plugging the patient evidence gap: what patients with swallowing disorders post-stroke say about thickened liquids. Int J Lang Commun Disord 53: , 30–39. |
[53] | Steele CM , Cichero JAY ((2014) ) Physiological factors related to aspiration risk: a systematic review. Dysphagia 29: , 295–304. |
[54] | Swan K , Cordier R , Brown T , Speyer R ((2019) ) Psychometric properties of visuoperceptual measures of videofluoroscopic and fibre-endoscopic evaluations of swallowing: a systematic review. Dysphagia 34: , 2–33. |
[55] | Steele CM , Peladeau-Pigeon M , Nagy A , Waito AA ((2020) ) Measurement of pharyngeal residue from lateral view videofluoroscopic images. J Speech Lang Hear Res 63: , 1404–1415. |

