
The Unique Role of Self-Rated Health in Metabolic Syndrome and its Diagnostic Cardiometabolic Abnormalities: An Analysis of Population-Based Data
Abstract
Background:
Historically, previous research demonstrating associations between self-rated health (SRH) and metabolic anomalies have rarely controlled for metabolic covariates. Thus, there is currently poor understanding of the unique contribution of SRH to metabolic syndrome (MetS) over and beyond diagnostic cardiometabolic abnormalities.
Objective:
This study explored unique associations between SRH and multiple cardiometabolic factors, after controlling for metabolic covariates.
Methods:
This study was based on an analysis of archived population-based data from the 2019 Health Survey for England. A total of 352 MetS cases were extracted from 10299 participants in the survey. Bootstrapped adjusted regression methods were used to predict MetS status and cardiometabolic abnormalities (HDL (high-density lipoprotein) cholesterol, waist/hip ratio, body mass index (BMI), systolic and diastolic blood pressure, and glycated haemoglobin (HbA1c)) from SRH. Structural Equation Modelling (SEM) was used to explore direct and indirect associations between SRH and cardiometabolic factors, with SRH treated as a mediating factor.
Results:
SRH predicted MetS status but this was negated after cardiometabolic adjustments. Poor SRH independently predicted HDL cholesterol deficiency, and elevated waist/hip ratio, BMI, and HbA1c, even after cardiometabolic adjustments. SEM generated two models with equivalent fit indices, but different structural pathways. In one model SRH mediated relations between anthropometric risk factors (waist/hip ratio and BMI).
Conclusions:
SRH can help identify people at risk of developing MetS, irrespective of cardiometabolic abnormalities. Poor SRH may represent a non-intrusive easily measurable risk factor for adiposity in MetS, especially where direct measurement of body fat is impractical or socially challenging.
BACKGROUND
Overview
Historically, previous research demonstrating associations between self-rated health (SRH) and metabolic abnormalities (e.g., HDL cholesterol, triglycerides, truncal adiposity, blood pressure) have rarely controlled for related metabolic factors [1–9]. While some studies have adjusted for anthropometric markers, notably BMI [2], we found only one study that controlled for biochemical anomalies (e.g., HDL-C, triglycerides, blood glucose) [10]. No research has adjusted for blood pressure. Overall, there is currently little understanding of the unique contribution of SRH to metabolic health, over and beyond metabolic abnormalities.
This is the first study to explore the unique associations between SRH and metabolic abnormalities after adjusting for related metabolic factors. The findings show that while self-rated health is not linked to MetS ‘caseness’ after controlling for metabolic factors, it is uniquely linked to several metabolic abnormalities (adiposity, lipoprotein, and blood glucose levels).
Self-rated health
SRH refers to a person’s evaluation of their health status [11]. SRH may denote both diagnosed and undiagnosed metabolic dysfunction (e.g., cardiometabolic disease still at a preclinical phase), and can be easily assessed using a simple single-item self-report measure in which respondents rate their health on a 5-point scale (e.g., 1 = ‘excellent’, 5 = ‘very poor’) [12]. The relationship between SRH and metabolic health has been of particular interest in biomedical research for over two decades [4, 5, 13]. SRH has been implicated in both MetS status, and the cardiometabolic diagnostic biomarkers used to define MetS, including insulin resistance, hyperlipidaemia (high cholesterol), blood pressure, and anthropometric factors [1–3]. More generally, SRH reliably predicts future mortality despite controlling for biomedical risk factors, and has shown improved predictive power over time [14]. SRH also predicts morbidity over and beyond biomedical and sociodemographic risk factors [15, 16]. Overall, although subjective, SRH is considered a reliable health index compared with biomarkers, including metabolic abnormalities, and hence can be a useful metric for understanding and predicting MetS [17].
Metabolic syndrome
MetS constitutes a cluster of cardiovascular risk factors whose precise clinical definition varies [18]. The harmonised diagnostic criteria for MetS is shown in Table 1. The presence of any 3 out of the 5 criteria is considered diagnostic. Preceding the harmonised criteria were the WHO, 1998; EGIR, 1999; NCEP-ATP III, 2003 and the IDF, 2006 criteria. While the definitions have similar parameters, there are variations in the way some diagnostic metrics have been defined [19]. The reported prevalence rates of MetS varies due to these variations. Despite this there is recognition that MetS is a global phenomenon with an estimated 25% of the world’s population being affected [20]. Studies continue to demonstrate the global burden of MetS, within regional and country settings [21–26].
Table 1
Definition of the metabolic syndrome (adapted from Alberti et al 2009)
| Parameter | Definition | Comment |
| Elevated waist circumference | Based on population and country specific definitions | Waist circumference cut off varies between regions |
| Elevated triglycerides | ≥ 150 mg/dL (1.7 mmol/L) | Or if on drug treatment |
| Reduced HDL-C | <40 mg/dL (1.0 mmol/L) in males <50 mg/dL (1.3 mmol/L) in females | Or if on drug treatment |
| Elevated Fasting Glucose | ≥ 100 mg/dL | Or if on drug treatment |
| Elevated Blood pressure | systolic ≥ 130 and/or diastolic ≥ 85 mm Hg | Or if on drug treatment |
Self-reported health and metabolic syndrome
Self-rated health (SRH) is a consistent predictor of mortality and morbidity even after controlling for major biomedical risk factors [11, 14, 27]. It is commonly used in clinical settings and epidemiological surveys [17]. Multiple studies have demonstrated a reliable association between SRH and MetS [1–5]. In general, MetS caseness is associated with poor SRH [5] irrespective of ethnic differences [1]. A study of 2997 individuals representative of the US civilian population found that people with MetS had a higher prevalence of poor SRH (OR = 1.90; 95% CI: 1.03–1.59). Research with 12662 adults (mean age = 43.68) found significant differences in SRH between MetS cases and non-cases; 23.8% of cases reported “poor” or “very poor” SRH compared to just 12.9% of non-cases [4]. Furthermore, an investigation of 1,535 community dwelling sedentary adults (aged 70 to 89) found a significant relationship between MetS and poor SRH; participants’ evaluations of their health worsened progressively as the number of MetS risk factors increased (b = 0.04, p = 0.01) [13].
Self-reported health and cardiometabolic abnormalities
The relationship between SRH and MetS also applies to specific diagnostic cardiometabolic abnormalities [2, 5–9]. Poor SRH is linked to abnormal waist circumference (OR = 1.27, 95% CI: 1.03, 1.59), deficient high density lipoprotein (HDL) (OR = 1.67:95% CI: 1.34, 2.09) and high triglycerides (OR = 1.66:95% CI: 1.33, 2.06) [5]. Poor SRH is also implicated in hypertriglyceridemia, insulin resistance [2], elevated BMI and waist/hip ratio [6, 7, 28–30] and blood pressure [31–33]. A recent population-based cohort study of SRH and MetS in 85,377 metabolically healthy men and women found that poorer SRH was associated with a greater risk of developing metabolic abnormalities including hypertriglyceridemia and insulin resistance [2]. SRH was more strongly associated with cardiometabolic dysfunction in obese individuals (the multivariable-adjusted HR (95% CI) for any abnormality given “poor” versus “good” SRH was 0.97 (0.90–1.05) in non-obese individuals, compared to 1.25 (1.02–1.52) in obese participants).
Confounding effects
There is ambiguity regarding the unique contribution of SRH to MetS status and diagnostic criteria. Most studies fail to adjust for the confounding effects of various MetS diagnostic biomarkers when assessing how SRH relates to MetS status or a specific diagnostic criterion [1–4, 13]. Some research has adjusted for anthropometric (BMI) differentials, but excluded other metabolic abnormalities (e.g., HDL cholesterol, blood pressure) [2, 13]. One study [13] initially found a significant association between SRH and MetS status, adjusting for BMI and other covariates. However, this relationship was nullified after stratifying the sample by physician-diagnosed diabetes status. Another study adjusted for BMI when assessing relations between SRH and metabolic abnormalities (e.g., hypertriglyceridemia, insulin resistance) [2]. However, other diagnostic criteria, notably waist/hip ratio, systolic/diastolic blood pressure, and HDL cholesterol, were not included as covariates.
There is also ambiguity regarding direct and indirect effects involving BMI, SRH, and metabolic health. A longitudinal study of BMI trajectories preceding first report of “poor” SRH in 2927 adults found that BMI had previously increased markedly (1.3 kg/m2 95% CI: 0.9 to 1.8 across ten years) in participants with poor SRH [28]. However, it is unclear whether SRH was an intervening variable in metabolic health, mediating associations between past BMI and future cardiometabolic abnormalities. Since MetS diagnosis does not necessarily require adiposity [34], SRH may be a useful indicator of metabolic dysfunction involving obesity, especially in situations where body weight measurements are impractical or socially unacceptable [35].
Research objectives
Overall, there is ambiguity regarding the unique contribution of SRH to MetS status and its diagnostic criteria after accounting for metabolic covariates. There is also uncertainty regarding the direct and indirect relationships between SRH, BMI, and other cardiometabolic factors. Overall, the current study examined three specific questions:
1. Is SRH independently associated with MetS status (‘caseness’) even after adjusting for cardiometabolic risk factors? Based on previous research [1, 3, 4] we hypothesised that the odds of MetS ‘caseness’ is significantly higher in people with “fair” or “poor” SRH, compared to those with “good” or “very good” evaluations of their health (Hypothesis 1), irrespective of metabolic covariates.
2. Is SRH independently associated with individual cardiometabolic abnormalities, even after adjusting for metabolic covariates? Consistent with previous work [2] we expected independent associations between SRH and individual metabolic risk factors (systolic/diastolic blood pressure, BMI, waist/hip ratio, HDL cholesterol), even after adjustments for metabolic covariates (Hypothesis 2)
3. Are associations between cardiometabolic abnormalities explained by SRH? Given that higher previous BMI predicts poorer current SRH [28], which in turn is linked to increased risk of future cardiometabolic abnormalities [2], we hypothesised that SRH mediates associations between BMI and other metabolic factors (Hypothesis 3).
METHODOLOGY
Ethics approval
Ethics approval for this investigation was provided by the university research ethics committee, covering research using archived data from the Health Survey for England (approval number 16/NSP/035). The study was performed in accordance with ethical standards as laid down in the 1964 Declaration of Helsinki, and its later amendments or comparable ethical standards.
Data availability statement
This study analysed data from the Health Survey for England (HSE) which is conducted by the National Centre for Social Research (NatCen) and the Department of Epidemiology and Public Health at University College London. HSE data and materials cannot be shared publicly for legal and ethical reasons, due to third party rights, institutional or national regulations or laws, and the nature of data gathered. Access to HSE data is provided by the UK Data Service under restrictions to protect confidential or proprietary information. To gain access users need to be registered with the UK Data Service. Access is limited to applicants based in UK further and higher education institutions, central and local government, NHS, research companies and charities for not-for-profit education and research purposes only. Access requests from users not in the above categories can be submitted to [email protected] and will be subject to approval. For more information, please see the UK Data Service website. https://rb.gy/vhi5uf
Study participants
This study used data extracted from the 2019 HSE, a national population-based survey of biomedical and lifestyle characteristics of private households in England [36–38], with around 8000 adults and 2000 children participating each year. The HSE adopts a multi-stage stratified sampling approach. The 2019 HSE records contain data from 10299 adults (aged = >16) and children (aged 0 to 15) interviewed in 2019, with 4,947 adults and 1,169 children being visited by a nurse, to collect biometric data. All participants provided informed consent. The sample included males (n = 4745) and females (n = 5554) who provided data on SRH and cardiometabolic risk factors, including diabetes status, glycaeted haemoglobin (HbA1c), HDL cholesterol, BMI, waist/hip ratio, and systolic/diastolic blood pressure. The sample was predominantly Caucasian (n = 8561 (83.1%)) and aged over 16 (n = 8204, (79.7%)), with a minority reporting degree-level education (n = 2370 (23%)).
Determination of sample size
Power analysis for logistic regression using G*Power 3.1.7 [39] generated a minimum total sample size of 7990 (at p < 0.05, 80% power). Power analysis for multiple regression (p < 0.05, 80% power) indicated a minimum total sample size of 822 [40].
Self-reported health
The SRH measure was adapted from a previous study [12]. In the wider literature SRH is measured using three to five response categories reflecting favourable, neutral, and unfavourable ratings (e.g., “poor”, “fair”, “good”) [11]. The HSE responses were grouped into five options (“very bad” (4), “bad” (3), “fair” (2), “good” (1) and “very good” (0)), which we collapsed into a dichotomous measure, with two response categories: “very bad/bad/fair” (code = 1) vs. “good/very good” (code = 0) [41]. The creation of a dichotomous variable was primarily due to low frequencies of “bad” (n = 522 (5.1%)) and “very bad” (n = 176 (1.7%)) responses.
Demographics
Gender was a simple dichotomy: male (coded 1), female (coded 0). Age was measured using twenty-two 5-year bands, ranging from 0 to 90 + . Ages 1 to 16 were grouped into six 1- or 2-year age bands (e.g., 2–4, 5–7, 13–15), while ages over 16 were classified into 3- or 4-year age bands (e.g., 16–19, 30–34, 75–70). Socio-economic classification was based on eight groupings of the UK Registrar General’s scale: (code = 0) ‘Higher managerial and professional’, (code = 1) ‘Lower managerial and professional’, (code = 2) ‘Intermediate occupations’, (code = 3) ‘Small employers & own account workers’, (code = 4) ‘Lower supervisory and technical’, (code = 5) ‘Semi-routine occupations’, (code = 6) ‘Routine occupations’, and (code = 7) ‘Never worked & long-term unemployed’. Ethnic groups were ‘White’ (coded 0) and ‘non-White’ (coded 1). Educational level was collapsed into two categories: ‘below degree or none’ (coded 0) and ‘degree or equivalent’ (coded 1).
Metabolic syndrome
To identify MetS cases we used WHO clinical criteria as a starting point [20]. This comprises presence of insulin resistance or glucose > 6.1 mmol/L (110 mg/dl), 2 hour glucose > 7.8 mmol (140 mg/dl), combined with any two of four additional clinical criteria: (a) HDL cholesterol < 0.9 mmol/L (35 mg/dl) for men, and <1.0 mmol/L (40 mg/dl) for women, (b) triglycerides > 1.7 mmol/L (150 mg/dl), (c) a waist/hip ratio > 0.9 for men, or > 0.85 for women, or a BMI value > 30 kg/m2, and (d) blood pressure > 140/90 mmHg. Since type 2 diabetes (T2DM) is the predominate clinical consequence of insulin resistance [42] we used respondents T2DM status as a biomarker for the former. We also opted for BMI rather than waist/hip ratio in identifying MetS cases since the former criterion (BMI > 30 kg/m2) applies to both males and females [43]. We adopted the more conservative HDL cholesterol threshold for men (<0.9 mmol/L (35 mg/dl)). Overall, consistent with WHO criteria [34], we identified MetS cases based on the presence of T2DM plus any two additional cardiometabolic abnormalities: (a) HDL cholesterol < 0.9 mmol/L (35 mg/dl); (b) BMI value > 30 kg/m2; (c) blood pressure > 140/90 mmHg. Due to the small number of respondents who provided systolic (n = 844) and diastolic (n = 256) readings, we used formal diagnosis of hypertension by a doctor or nurse (n = 2033) as the blood pressure criterion. In total, 352 MetS cases (3.4%) were identified using the clinical criteria (coding: MetS cases = 1, non-cases = 0).
Cardiometabolic measurements
Cardiometabolic measures were based on blood samples drawn during the nurse visit undertaken as part of the HSE [36]. All variables were treated as both continuous measures and dichotomised variables (the latter based on clinically significant thresholds, with unhealthy values coded as 1). HDL or ‘good cholesterol’ was calibrated in mmol/L, with 0.9 mmol/L (35 mg/dl) for men used as the critical cut-off (≥0.9 mmol/L (coded 0) vs. <0.9 mmol/L (coded 1)); We extracted waist/hip ratio data, with 0.85 (women) used as the critical threshold (>0.85 (coded 1) vs. <0.85 (coded 0)). BMI (body mass index) scores were dichotomised based on 30 kg/m2 cut-off for obesity (WHO, 1999) (>30 kg/m2 (coded 1) vs. <30 kg/m2 (coded 0)). As in previous research [12] systolic and diastolic blood pressure data were treated as separate variables due to their differential impact on health outcomes (e.g. systolic pressure has a more pronounced effect on mortality rates in older adults) [44]; systolic (≤120 mm Hg (coded 0) vs.>120 mm Hg (coded 1)); diastolic (≤80 mm Hg (coded 0) vs.>80 mm Hg (coded 1)). Diagnosis with hypertension by a doctor was also dichotomised (‘Yes’ (coded 1) vs. ‘No’ (coded 0)). Although MetS diagnostic criteria does not include glycaeted haemoglobin (HbA1c) [34], we assessed it here in place of fasting glucose. This is consistent with a new MetS clinical definition proposed by the IDF (International Diabetes Federation), [45]. The HSE measures HbA1c in both IFCC (International Federation of Clinical Chemistry) units of mmol/mol, and DCCT (Diabetes Control and Complications Trial) percentages. We assessed the IFCC calibration, which is more familiar in Europe [46]. HbA1c mmol/mol data was dichotomised, using the recommended 48 mmol/mol clinical threshold; (<48 mmol/mol (coded 0) vs. = >48 mmol/mol (coded 1)) [47].
Data analysis
Chi-square and independent samples t-tests were used to analyse descriptive data based on MetS status. Bootstrapped hierarchical logistic regression was used to test Hypothesis 1, which posits that SRH is independently associated with MetS, adjusting for six cardiometabolic covariates: (a) HDL cholesterol (mmol/L), (b) waist/hip ratio, (c) BMI (kg/m2), (d) systolic blood pressure (mmHg), (e) diastolic blood pressure (mmHg), and (f) HbA1c (mmol/mol)). These covariates reflect WHO diagnostic biomarkers used to define MetS [20], with the exception of HbA1c which we included in place of fasting glucose [45]. Thus, the purpose of the analysis was to control for the confounding effects of MetS diagnostic metrics in assessing the association between SRH and MetS status. Several socio-demographic factors (age, gender, social class, ethnicity) were also treated as covariates, given previous research implicating these characteristics in metabolic health [48–50]. We tested three models: Model 1 (MetS = Intercept + Age + Gender + Social Class + Ethnicity), Model 2 (MetS = Intercept + Age + Gender + Social Class + Ethnicity + SRH), Model 3 (MetS = Intercept + Age + Gender + Social Class + Ethnicity + SRH + metabolic factors).
Bootstrapped hierarchical multiple regression was used to test Hypothesis 2, which proposes associations between SRH (predictor) and the six cardiometabolic factors. In each regression analysis to predict a metabolic variable the other metabolic factors were treated as covariates. The goal was to adjust for the confounding effects of MetS diagnostic biomarkers when assessing the relationship between SRH and a specific biomarker. Socio-demographic factors (age, gender, social class, ethnicity) were also assessed as covariates. Again, we tested three models: Model 1 (a cardiometabolic factor = Intercept + Age + Gender + Social Class + Ethnicity), Model 2 (a cardiometabolic factor = Intercept + Age + Gender + Social Class + Ethnicity + SRH), Model 3 (a cardiometabolic factor = Intercept + Age + Gender + Social Class + Ethnicity + SRH + the other cardiometabolic risk factors).
SEM (IBM AMOS SPSS statistical package, version 26) was used to test Hypothesis 3 (i.e., SRH mediates relationships between BMI and other cardiometabolic factors). We analysed data from the whole sample (N = 10299), and used maximum likelihood estimation [51], which required treating SRH categories (“very bad” (4), “bad” (3), “fair” (2), “good” (1) and “very good” (0)) as one continuous variable. Since maximum likelihood estimation assumes multivariate normality we tested all variables for skewness, and kurtosis. Acceptable levels of skewness fall between –3 and +3, and kurtosis values from –10 to +10, when using SEM [52]. Skewness for all variables was < 1, except for HbA1c, which was highly skewed (4.63). Similarly, kurtosis values for all values were < 10, apart from HbA1c, which indicated a highly leptokurtic distribution (i.e., very peaked). Thus, we excluded HbA1c data from SEM. To reduce the type 1 error rates, we adopted a more conservative alpha level (p < 0.001) by applying a Bonferroni correction. While this may increase the risk of false negatives greater emphasis was placed on minimising type 1 errors given the multiple statistical analyses [53].
RESULTS
Descriptive statistics
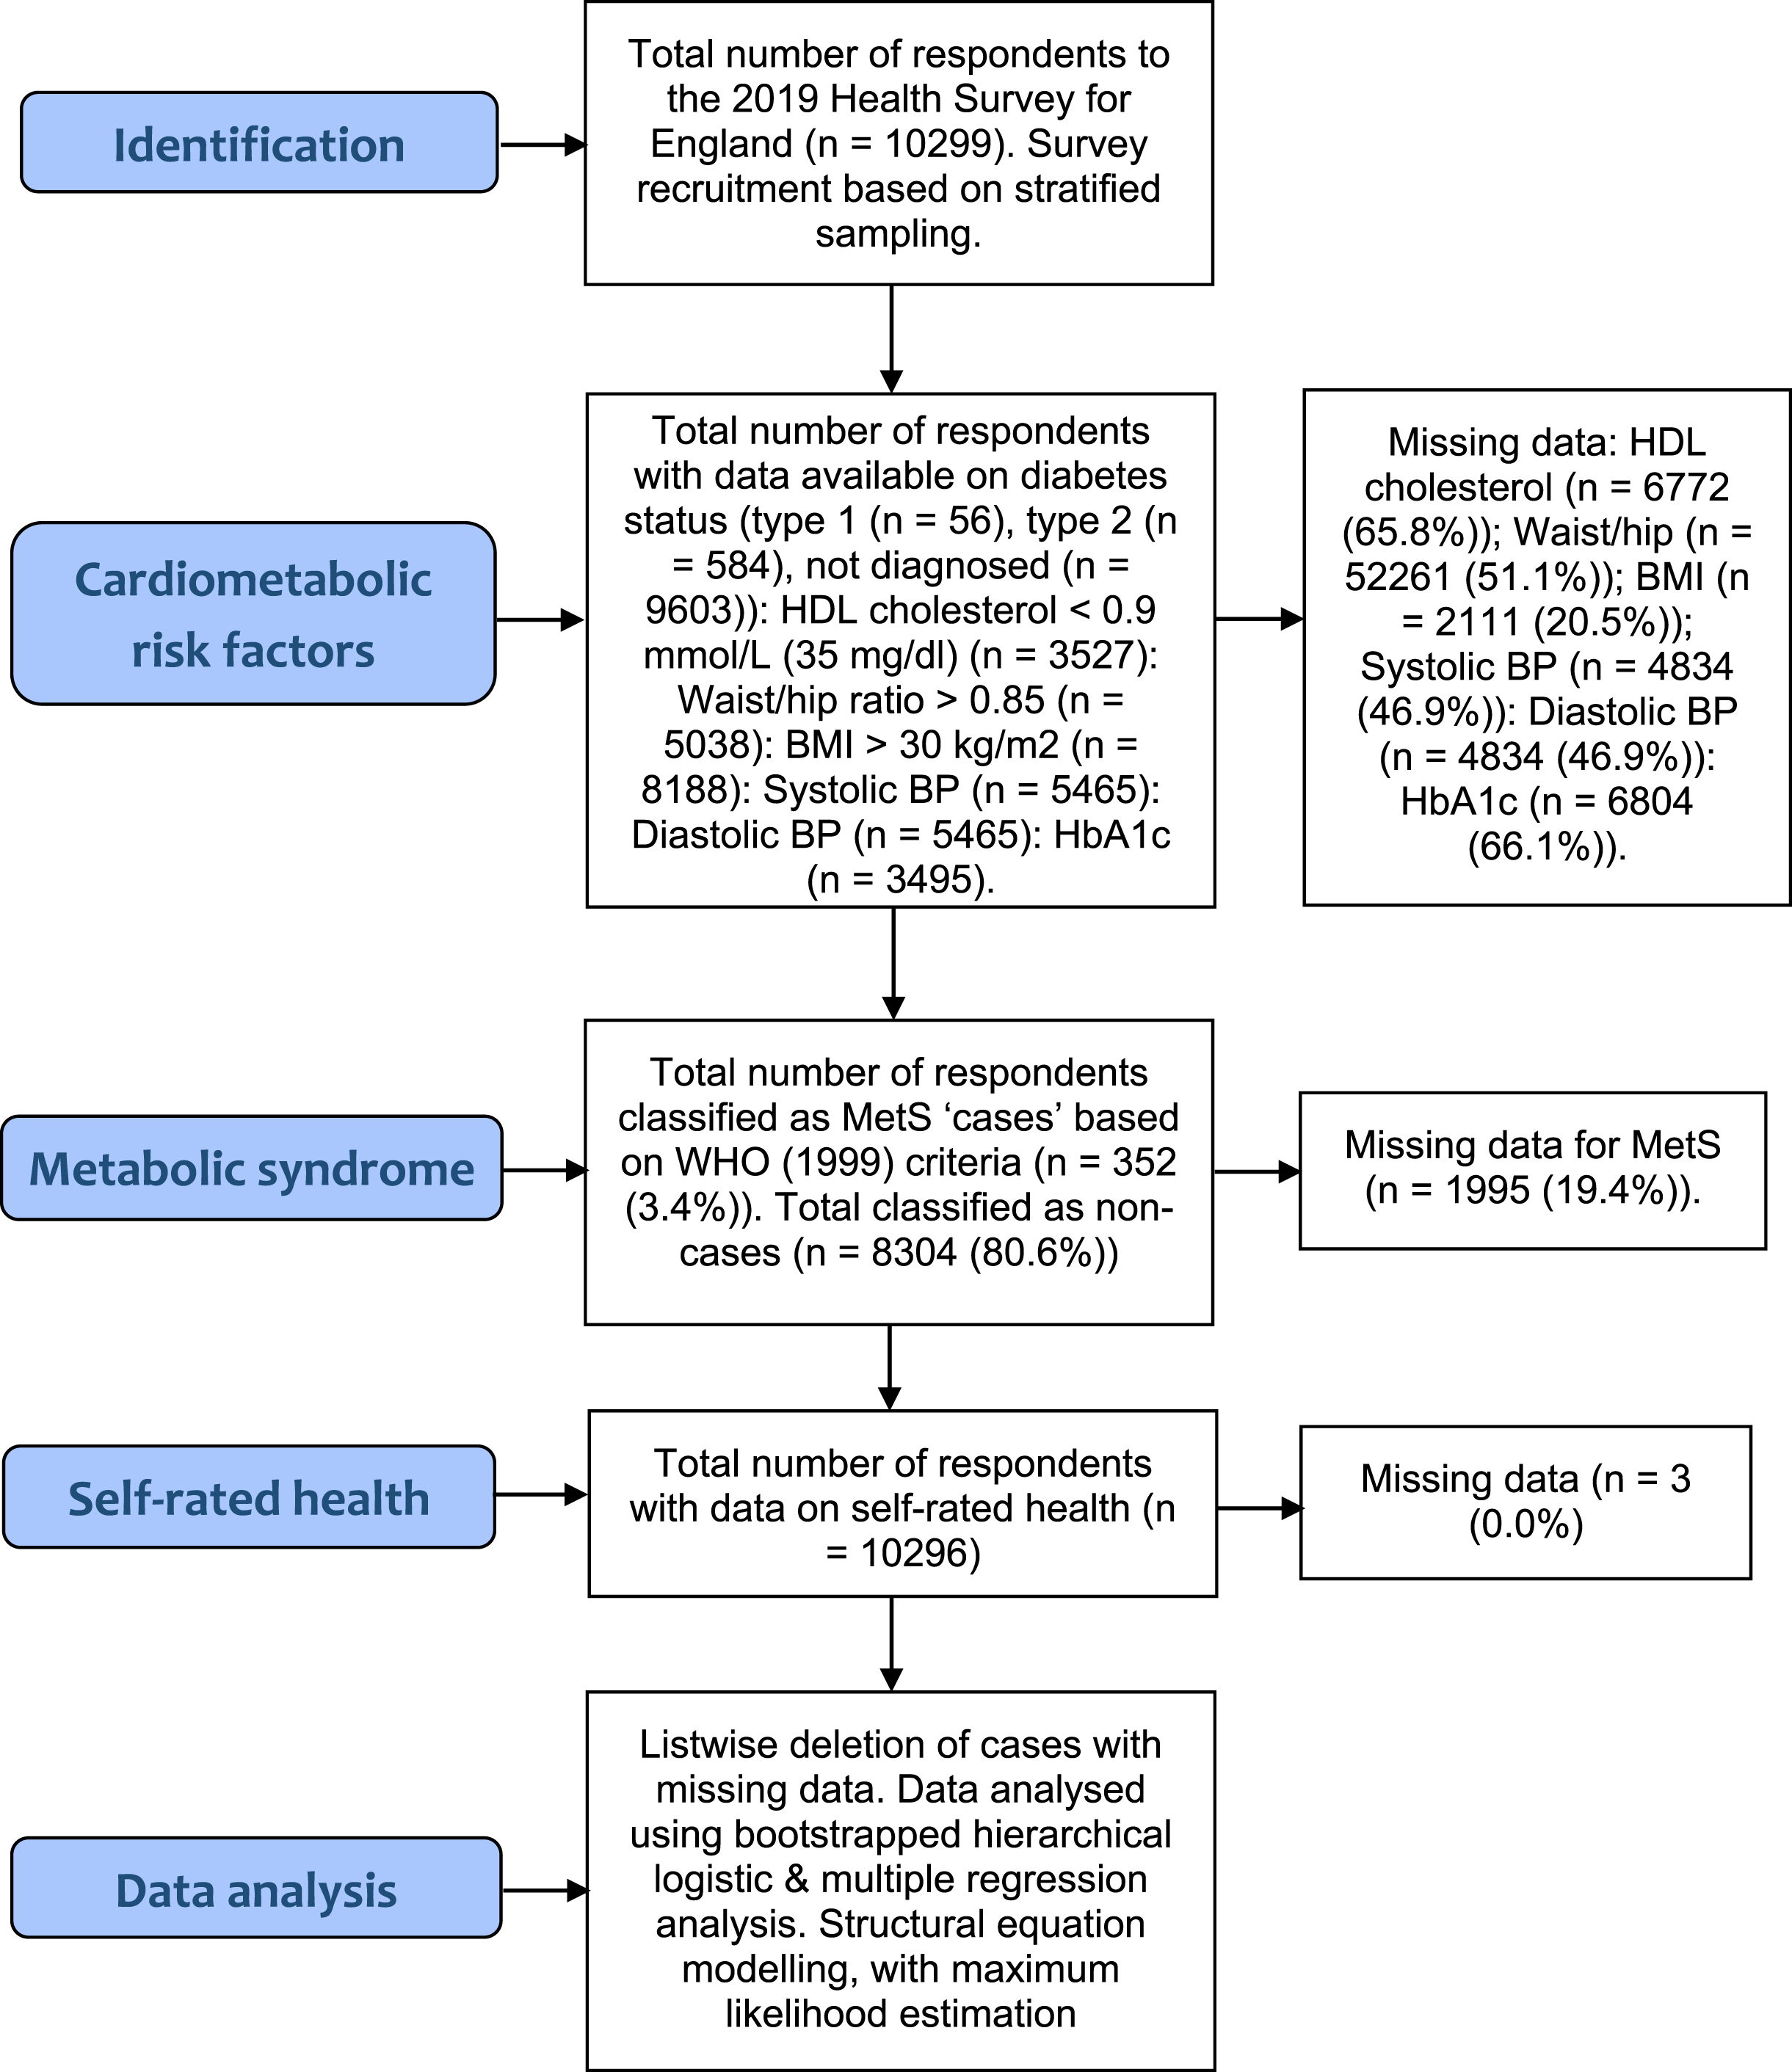
The rates of missing data ranged from 20.5% (BMI) to 66.1% (HbA1c) (see Fig. 1). Given the large overall sample size, and hence statistical power, we opted for listwise deletion of cases with missing values. Despite the drawbacks of listwise deletion [54], we chose to avoid statistical methods that input (replace) missing values by estimating parameters (e.g., Expectation Maximisation (EM) method), due to limitations associated with such methods, including assumptions of multivariate normality (which does not hold in dealing with categorical variables e.g., MetS status (case/non-case)) [55]. Overall, 352 patients (3.4%) met the diagnostic criteria for MetS [34]. Almost 600 respondents had been diagnosed with type 2 diabetes (n = 584 (5.7%)). Subgroups of participants also met other diagnostic criteria, specifically HDL cholesterol< = 0.9 mmol/L (35 mg/dl) (n = 7079 (68.7%)), Waist/hip ratio = >0.85 (n = 3018 (29.3%)); a BMI > 30 kg/m2 (n = 2049 (19.9%)); and just over 2000 respondents had been diagnosed with hypertension by a doctor or nurse; (n = 2033 (19.7%)). A smaller number of participants provided actual systolic data (n = 844 (8.2%)>140 mmHg) and diastolic data (n = 256 (2.5%)>90 mmHg). Most respondents reported “very good” or “good” SRH (n = 7931 (77%)), with the remainder reporting “fair”, “bad”, or “very bad” health (n = 2365 (23%)).
Fig. 1
STROBE Flow Diagram.
Frequency data is presented in Fig. 2. MetS cases had all been diagnosed with T2DM by a doctor/nurse (100%), were more likely to be HDL deficient (mmol/L) < 0.9 (63.1% versus 82.1%), (χ2 (1, N = 8304) = 52.87, p < 0.001), and have an elevated waist/hip ratio (27.2% versus 48%), (χ2 (1, N = 8304) = 72.17, p < 0.001), and BMI (>30 kg/m2) (6.6% versus 59.9%), (χ2 (1, N = 8304) = 1189.34, p < 0.001). Compared to non-cases MetS cases were more likely to be hypertensive (6.3% versus 88.1%), (χ2 (1, N = 8303) = 2549.86, p < 0.001), with abnormal systolic blood pressure (>140 mmHg) (7.2% versus 12.2%) (χ2 (1, N = 8304) = 12.24, p < 0.001), and HbA1c (>48 mmol/mol) (2.1% versus 18.5%), (χ2 (1, N = 8304) = 326.80, p < 0.001), and less likely to report “good/very good” SRH (82.9% versus 36.6%), (χ2 (1, N = 8302) = 468.57, p < 0.001). There were also significant demographic differences. Compared to healthy respondents MetS cases were less likely to have a (lower) managerial, administrative, and professional background (7.4% versus 4.1%) (χ2 (1, N = 5790) = 33.30, p < 0.001), and more likely to be male (45.3% versus 54.8%) (χ2 (1, N = 8304) = 12.34, p < 0.000), and belong to the oldest age group, aged over 75 years (9.1% versus 24.4%) (χ2 (1, N = 6232) = 340.72, p < 0.001).
Fig. 2
Frequencies for metabolic syndrome (MetS) status by self-rated health (SRH) and cardiometabolic abnormalities (HbA1c, BMI, Waist/hip ratio, HDL cholesterol, and hypertension). All variables are dichotomised, to maximise cell frequencies. Asterisk (*) = significant (p≤0.001).
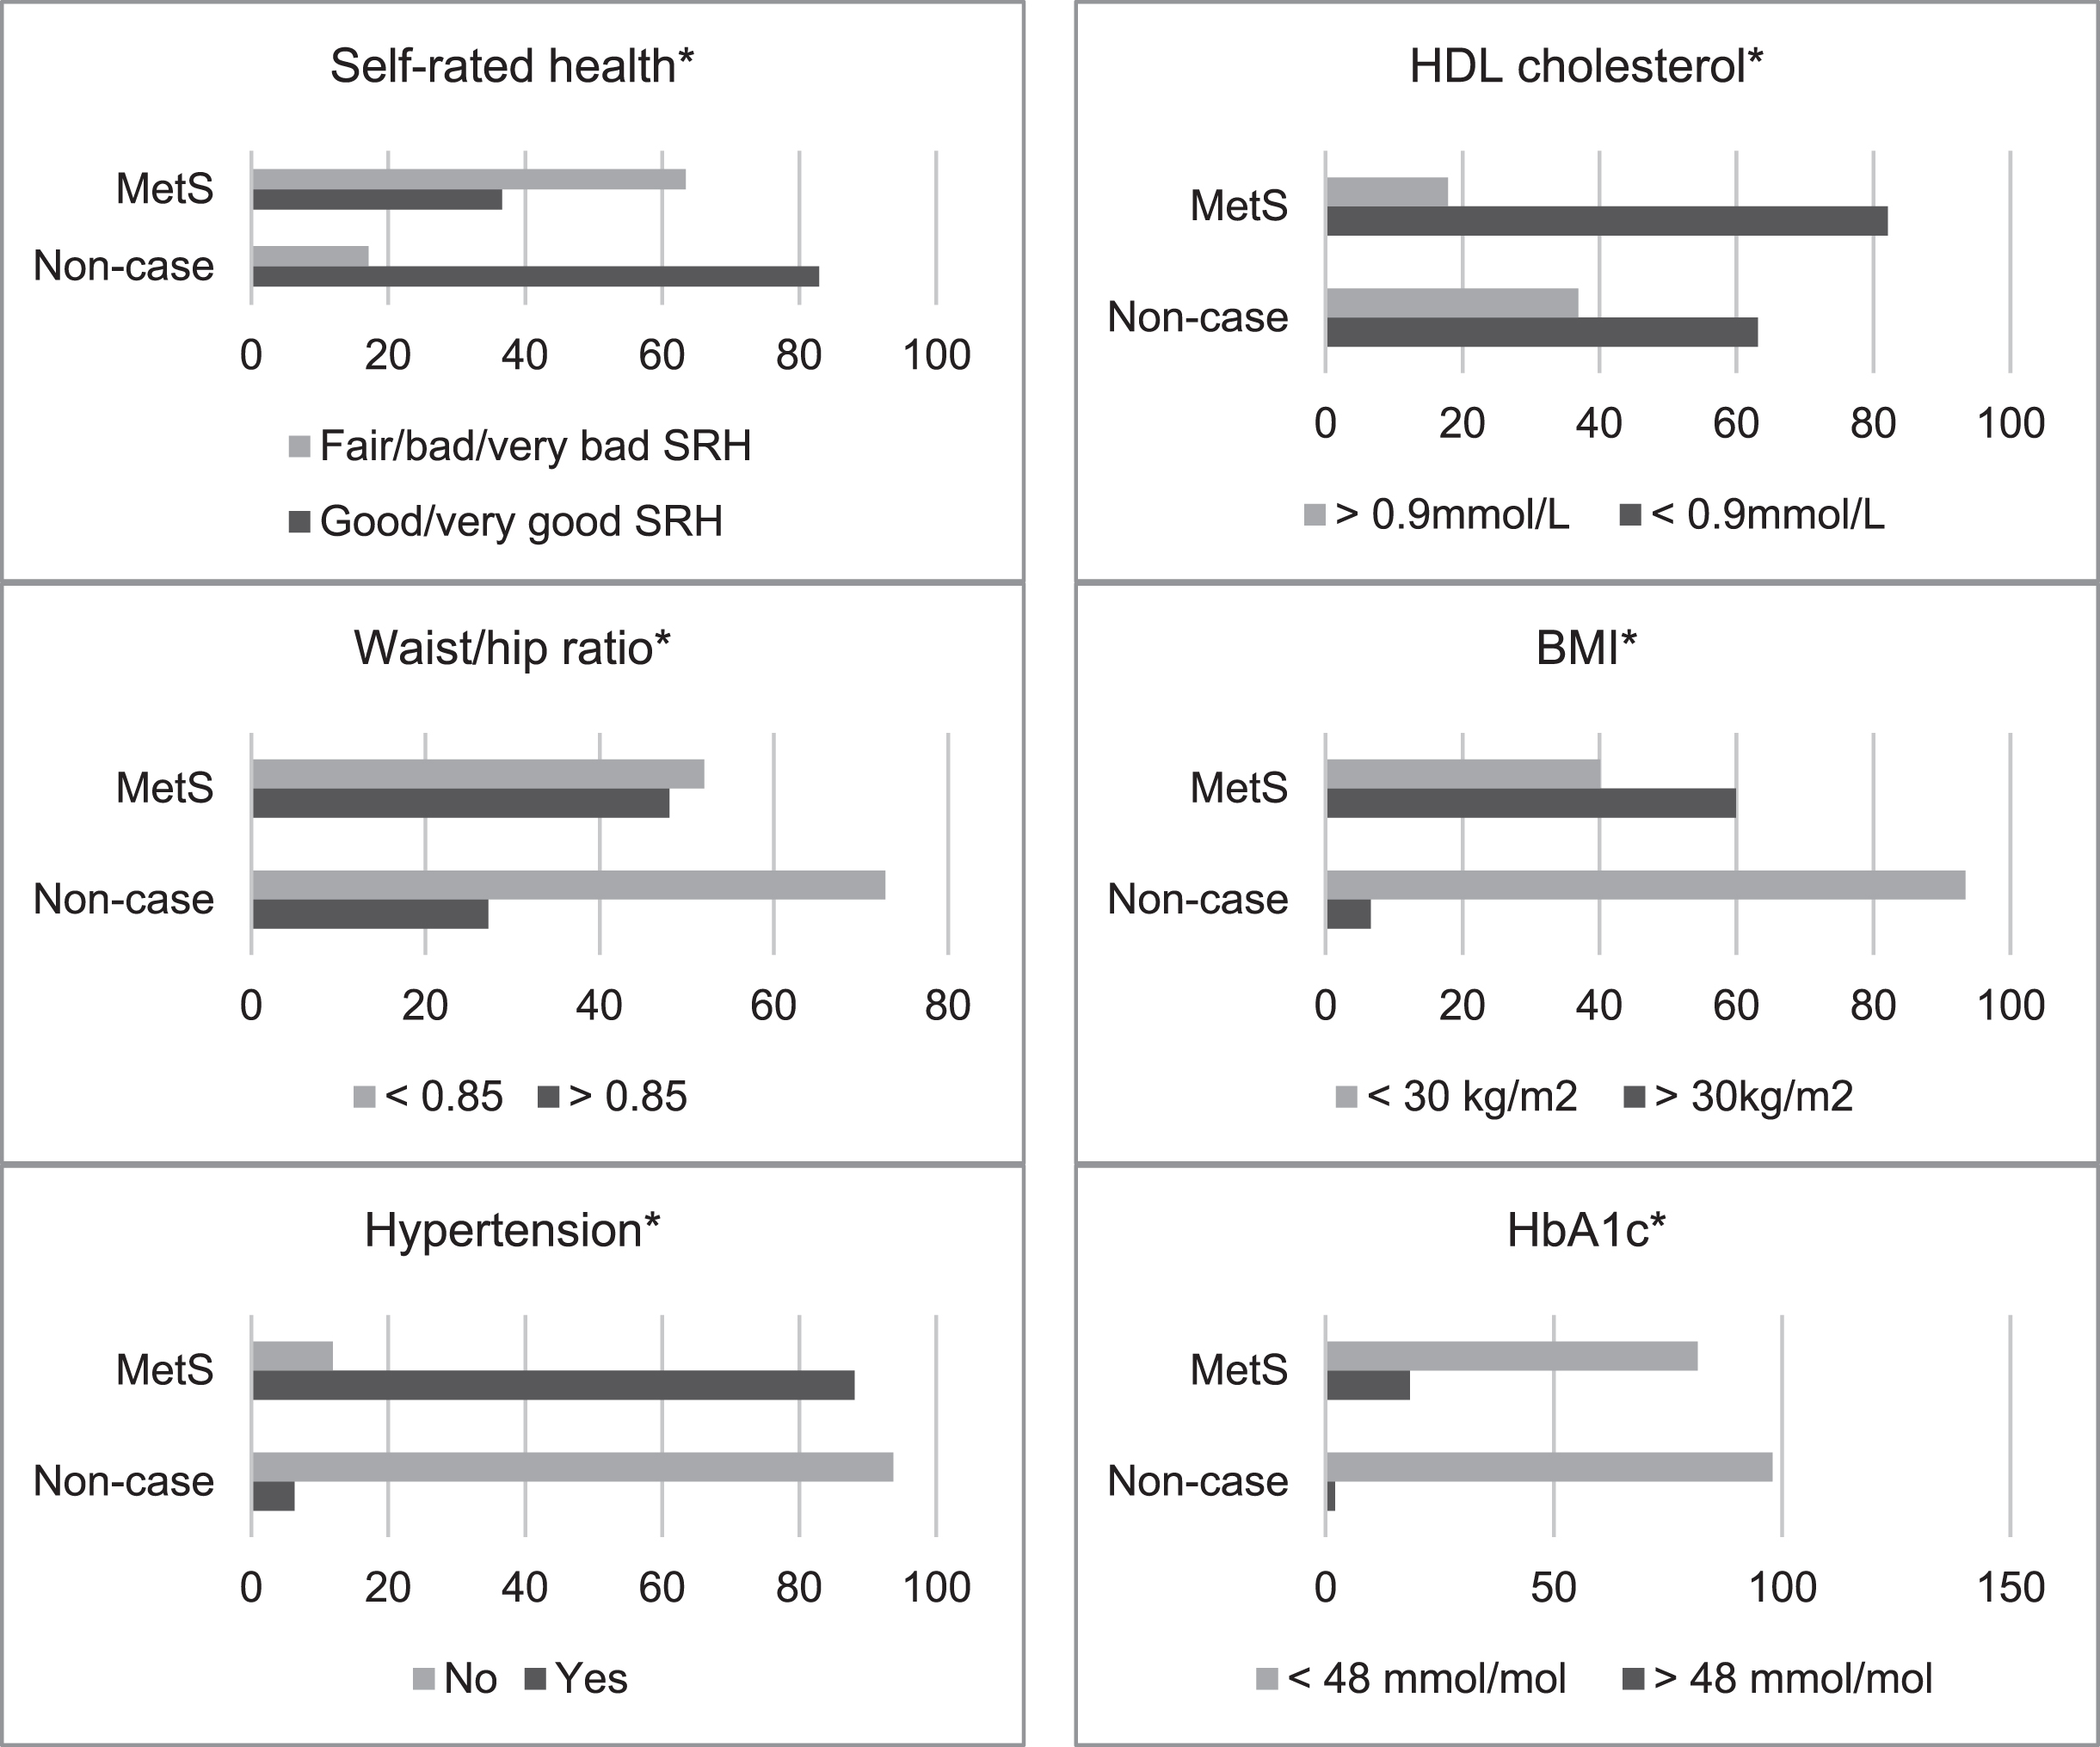
Table 2 shows means and standard deviations. T-tests for independent groups showed that, compared to non-cases, participants with MetS had significantly lower HDL cholesterol (mmol/L) (M = 1.49 versus 1.18), t(3161) = –7.15, p < 0.0001, and higher HbA1c (mmol/mol) (M = 38.97 versus 59.61), t(89.84) = 10.50, p < 0.0001, waist/hip ratio (M = 0.86 versus 0.98), t(41911) = 17.45, p < 0.0001, BMI (M = 24.08 versus 33.41), t(308.70) = 24.97, p < 0.0001, and systolic blood pressure (mmHg) (M = 120.48 versus 129.34), t(4589) = 7.10, p < 0.0001.
Table 2
Means and standard deviations for metabolic syndrome by cardiometabolic factors and self-rated health
| Total sample | Metabolic syndrome case | Non-case | ||
| Metabolic factors | N, Mean (SD) | N, Mean (SD) | N, Mean (SD) | Sig |
| High density lipoprotein (HDL) (mmol/L) | 3527, 1.45 (0.42) | 90, 1.18 (0.33) | 3073, 1.49 (0.41) | p < 0.001 |
| Waist/hip ratio | 5038, 0.87 (0.09) | 181, 0.98 (0.08) | 4012, 0.86 (0.08) | p < 0.001 |
| Body mass index (BMI) (kg/m2) | 8188, 26.24 (6.59) | 290, 33.41 (6.25) | 6155, 24.08 (5.27) | p < 0.001 |
| Diastolic BP (mm Hg) | 5465, 70.72 (11.02) | 184, 69.99 (10.84) | 4407, 69.87 (10.68) | n.s. |
| Systolic BP (mm Hg) | 5465, 122.38 (17.18) | 184, 129.34 (16.37) | 4407, 120.48 (16.57) | p < 0.001 |
| HbA1c (mmol/mol) | 3495, 39.63 (8.40) | 90, 59.61 (18.60) | 3038, 38.97 (7.43) | p < 0.001 |
Notes: Samples sizes represent valid N (listwise.
Hypothesis 1: SRH and metabolic syndrome
Table 3 shows logistic regression estimates, together with overall model parameters. One demographic variable (age) predicted MetS status (Model 1) (OR = 1.21, 95% CI [1.13 –1.31]). Addition of SRH (Model 2) resulted in good fit: respondents reporting “good/very good” SRH were less likely to have MetS, compared to those reporting “fair/bad/very bad” SRH (OR = 0.26, 95% CI [0.16 –0.42]). The small confidence intervals suggest a more precise population estimate. However, addition of cardiometabolic variables (HDL cholesterol (mmol/L), BMI (kg/m2), systolic/diastolic blood pressure (mmHg), and HbA1c (mmol/mol)) (Model 3) nullified the association between SRH and MetS status (waist/hip ratio was excluded from this analysis due to an extremely high odds ratio observed in preliminary analysis, indicating a large standard error). Respondents with higher BMI values (OR = 1.33, 95% CI [1.26 –1.41]), and HbA1c levels (OR = 1.08, 95% CI [1.06 –1.10]), were more likely to meet MetS criteria.
Table 3
Bootstrapped hierarchical logistic regression predicting MetS ‘caseness’ from demographics, self-rated health and metabolic covariates
| Model 1 | Model 2 | Model 3 | |
| Demographics | Self-rated health | Cardiometabolic risk factors | |
| n = 10299 | n = 10299 | n = 10299 | |
| Predictors | Odds ratio (95% CI), Sig | Odds ratio (95% CI), Sig | Odds ratio (95% CI), Sig |
| Age | 1.21 (1.13, 1.31), p < 0.001* | 1.16 (1.08, 1.26), p < 0.001* | 1.34 (1.17, 1.53), p < 0.001* |
| Gender | 1.26 (0.81, 1.98), p = 0.298 | 1.27 (0.81, 2.00), p = 0.294 | 1.51 (0.80, 2.85), p = 0.199 |
| Social class | 1.07 (0.91, 1.26), p = 0.395 | 0.99 (0.83, 1.17), p = 0.922 | 0.93 (0.75, 1.15), p = 0.529 |
| Ethnicity | 1.18 (0.46, 3.02), p = 0.717 | 1.41 (0.55, 3.61), p = 0.470 | 1.59 (0.50, 5.00), p = 0.424 |
| Self-rated health | 0.26 (0.16, 0.42), p < 0.001* | 0.91 (0.49, 1.66), p = 0.763 | |
| HDL cholesterol (mmol/L) | 0.32 (0.11, 0.93), p = 0.037 | ||
| Body Mass Index (kg/m2) | 1.33 (1.26, 1.41), p < 0.001* | ||
| Systolic blood pressure (mmHg) | 1.01 (0.98, 1.03), p = 0.387 | ||
| Diastolic blood pressure (mmHg) | 0.97 (0.93, 1.00), p = 0.115 | ||
| HbA1c (mmol/mol) | 1.08 (1.06, 1.10), p < 0.001* | ||
| -2 log-likelihood | 686.466 | 656.872 | 359.741 |
| Cox &Snell R Square | 0.013 | 0.023 | 0.125 |
| Nagelkerke R Square | 0.053 | 0.099 | 0.534 |
| Model Chi-square (χ2) | X2 (4, 10299) = 33.93, p < 0.001 | X2 (5, 10299) = 63.53, p < 0.001 | X2 (10, 10299) = 360.66, p < 0.001 |
| Hosmer and Lemeshow test | X2 (8, 10299) = 21.22, p = 0.007 | X2 (8, 10299) = 13.46, p = 0.097 | X2 (8, 10299) = 4.21, p = 0.837 |
Note. Model 1 (demographics), Model 2 (SRH added), Model 3 (cardiometabolic covariates added). Model 3 includes all predictor variables. Asterisk symbols indicate significance. Hosmer & Lemeshow goodness-of-fit test assesses whether observed frequencies reflect expected frequencies in subgroups (with different predicted probabilities) within the model population. p-values < 0.05 suggest poor fit, albeit p > 0.05 does not necessarily denote good fit.
Hypothesis 2: SRH and cardiometabolic abnormalities
Table 4 shows the results. SRH predicted HDL cholesterol (mmol/L) (Model 2), contributing a significant increase in the explained variance, ΔR2 = 0.019, F (1, 2967) = 70.31, p < 0.001. Good SRH was associated with higher HDL cholesterol (mmol/L) (β= 0.06, p < 0.001). This relationship remained significant after adjusting for BMI (kg/m2), waist/hip ratio, systolic/diastolic blood pressure (mmHg), and HbA1c (mmol/mol) (Model 3). SRH significantly predicted waist/hip ratio (Model 2), accounting for circa 2% of the variance, ΔR2 = 0.017, F (1, 2967) = 94.65, p < 0.001. Respondents reporting favourable SRH had lower waist/hip ratios (β= –0.13, p < 0.001). Adjusting for cardiometabolic variables (Model 3) failed to attenuate the association between SRH and waist/hip ratio.
Table 4
Final regression models predicting cardiometabolic factors from demographics, self-rated health, and metabolic covariates
| HDL cholesterol (mmol/L) | Waist/hip ratio | BMI (kg/m2) | Systolic BP (mmHg) | Diastolic BP (mmHg) | HbA1c (mmol/mol) | |
| Predictors (Model 3) | b 95% CI [LL, UL], beta | b 95% CI [LL, UL], beta | b 95% CI [LL, UL], beta | b 95% CI [LL, UL], beta | b 95% CI [LL, UL], beta | b 95% CI [LL, UL], beta |
| Age | 0.02* [0.02, 0.03], 0.20 | 0.00* [0.00, 0.00], 0.29 | –0.19* [–0.25, –0.13], –0.12 | 1.81* [1.67, 1.96], 0.36 | –0.89* [–0.99, –0.78], –0.28 | 0.55* [0.44, 0.65], 0.22 |
| Gender | –0.21* [–0.25, –0.18], –0.25 | 0.09* [0.08, 0.09], 0.30 | –3.81* [–4.22, –3.40], –0.35 | 5.67* [4.54, 6.81], 0.17 | –2.52* [–3.31, –1.74], –0.11 | –1.47* [–2.23, –0.70], –0.08 |
| Social class | –0.01 [–0.02, –0.00], –0.03 | 0.00* [0.00, 0.00], 0.03 | –0.04 [–0.15, 0.07], –0.01 | 0.22 [–0.08, 0.53], 0.01 | –0.12 [–0.33, 0.08], –0.01 | 0.17 [–0.03, 0.37], 0.02 |
| Ethnicity | 0.06 [0.01, 0.10], 0.04 | –0.00 [–0.01, –0.00], –0.02 | 1.20* [0.68, 1.72], 0.07 | 2.12 [0.72, 3.51], 0.03 | –2.02* [–2.98, –1.07], –0.05 | –2.15* [–3.07, –1.23], –0.07 |
| Self-rated health | 0.06* [0.03, 0.09], 0.06 | –0.01* [–0.01, –0.00], –0.04 | –1.05* [–1.44, –0.66], –0.08 | –0.02 [–1.07, 1.01], –0.00 | 0.47 [–0.24, 1.18], 0.01 | –1.95* [–2.64, –1.26], –0.09 |
| HDL cholesterol (mmol/L) | – | –0.02* [–0.03, –0.01], –0.11 | –2.39 * [–2.82, –1.96], –0.19 | 1.62 [0.46, 2.78], 0.04 | 0.38 [–0.41, 1.18], 0.01 | –2.13* [–2.90, –1.37], –0.10 |
| Waist/hip ratio | –0.96* [–1.18, –0.74], –0.21 | – | 29.85* [27.38, 32.32], 0.52 | –3.23 [–10.43, 3.95], –0.01 | 13.17* [8.25, 18.09], 0.11 | 17.06* [12.33, 21.79], 0.18 |
| BMI (kg/m2) | –0.01* [–0.01, –0.01], –0.20 | 0.00* [0.00, 0.00], 0.30 | – | 0.07 [–0.02, 0.17], 0.02 | 0.25* [0.18, 0.31], 0.12 | 0.07 [0.00, 0.13], 0.04 |
| Systolic BP (mmHg) | 0.00 [0.00, 0.00], 0.06 | 0.00 [0.00, 0.00], –0.01 | 0.01 [–0.00, 0.02], 0.03 | – | 0.42* [0.40, 0.44], 0.66 | 0.01 [–0.00, 0.03], 0.02 |
| Diastolic BP (mmHg) | 0.00 [–0.00, 0.00], 0.02 | 0.01* [0.00, 0.00], 0.08 | 0.07* [0.05, 0.09], 0.15 | 0.90* [0.86, 0.94], 0.57 | – | –0.03 [–0.06, 0.00], –0.04 |
| HbA1c (mmol/mol) | –0.00* [–0.00, 0.00], –0.09 | –0.02* [–0.03, –0.01], –0.11 | 0.02 [0.00, 0.04], 0.03 | 0.03 [–0.02, 0.08], 0.01 | –0.03 [–0.07, 0.00], –0.02 | – |
| R2 | 0.28 (28%) | 0.60 (60%) | 0.33 (33%) | 0.51 (51%) | 0.44 (44%) | 0.16 (16%) |
| F | F (10, 2962) = 120.08, p < 0.001 | F (10, 2962) = 460.77, p < 0.001 | F (10, 2962) = 145.94, p < 0.001 | F (10, 2962) = 315.25, p < 0.001 | F (10, 2962) = 232.67, p < 0.001 | F (10, 2962) = 60.05, p < 0.001 |
Note. Model 1 (+ demographics), Model 2 (+ SRH), Model 3 (+ cardiometabolic covariates). Coefficients with an asterisk (*) are significant (p < 0.001).
More favourable SRH predicted reduced BMI (kg/m2) (β= –0.19, p < 0.001), accounting for an additional 3.5% variance after adjustment for demographic factors (Model 2), ΔR2 = 0.035, F (1, 2967) = 108.90, p < 0.001. Accounting for cardiometabolic factors (Model 3) did not negate relations between SRH and BMI (kg/m2). There was no association between SRH and systolic blood pressure. However, SRH significantly predicted HbA1c (mmol/mol) following adjustment for demographics (Model 2). Good SRH depicted lower HbA1c (β= –0.14, p < 0.001), with significant model improvement (ΔR2 = 0.021, F (1, 2967) = 69.48, p < 0.001). This association remained significant after including cardiometabolic covariates.
Sensitivity analysis
The data was reanalysed with and without EM applied to missing data for SRH, MetS status, and cardiometabolic factors (HDL cholesterol, waist/hip ratio, BMI, systolic/diastolic blood pressure, HbA1c). Logistic regression results using EM data reflected the original findings, except for a significant association between SRH and MetS status in the fully adjusted model (comprising all cardiometabolic covariates) (Model 3) (OR = 0.40, [CI 0.29–0.56]). Unlike the original results, relations between SRH and MetS remained significant following metabolic adjustment. This suggests the overall outcome of this model is partly affected by management of missing data using EM algorithms. Multiple regression results with EM data supported the original analysis. SRH significantly predicted HDL cholesterol (β= 0.03, p < 0.001), BMI (β= –0.06, p < 0.001), and HbA1c (β= –0.05, p < 0.001), but was unrelated to both systolic and diastolic blood pressure (p’s > 0.001) in the full adjusted models with all metabolic covariates included. The only exception was waist/hip ratio, which SRH failed to predict at the Bonferroni-adjusted alpha level (β= 0.03, p = 0.03).
Hypothesis 3: Direct and indirect relationships
Assessment of model fit was based on the following criteria: chi-square χ2 (CMIN) (p > 0.05), χ2 (CMIN)/df < 2.00, root mean square error of approximation (RMSEA) < 0.07, comparative fit index (CFI)≥0.95, Tucker and Lewis Index (TLI)≥0.95, and normed fit index (NFI)≥0.95 [56]. BMI was allowed to directly predict SRH, and both were allowed to affect metabolic factors (Hypothesis 3). We also tested reverse pathways. We excluded diastolic and systolic blood pressure due to the lack of significant associations with SRH in prior regression analysis. Initial analysis using specification-search generated two models with good metrics. The first model is presented in Fig. 3, while maximum likelihood estimates are shown in Table 5. Multiple fit criteria suggested good fit: χ2 (CMIN) = 1.69, df = 1, p = 0.193, χ2 (CMIN) /df = 1.69, RMSEA = 0.008, CFI = 1.00, TLI = 0.997, and NFI = 0.999. This model showed that SRH mediated relations between BMI and waist/hip ratio, whereby the latter predicted poorer SRH (β= 0.18, p < 0.001), which in turn predicted higher BMI (β= 0.25, p < 0.001). The alternative model is displayed in Fig. 4. This model had similar fit indices to the first model: χ2 (CMIN) = 1.69, df = 1, p = 0.193, χ2 (CMIN) /df = 1.69, RMSEA = 0.008, CFI = 1.00, TLI = 0.997, and NFI = 0.999. Maximum likelihood estimates are shown in Table 6. Beyond fit indices this model differed in its structural pathways and explained variance. SRH had no mediating effect. Rather, it directly predicted BMI, with poorer SRH associated with higher adiposity (β= 0.54, p < 0.001).
Fig. 3
First SEM model suggesting SRH mediates the relationship between BMI and waist/hip ratio.
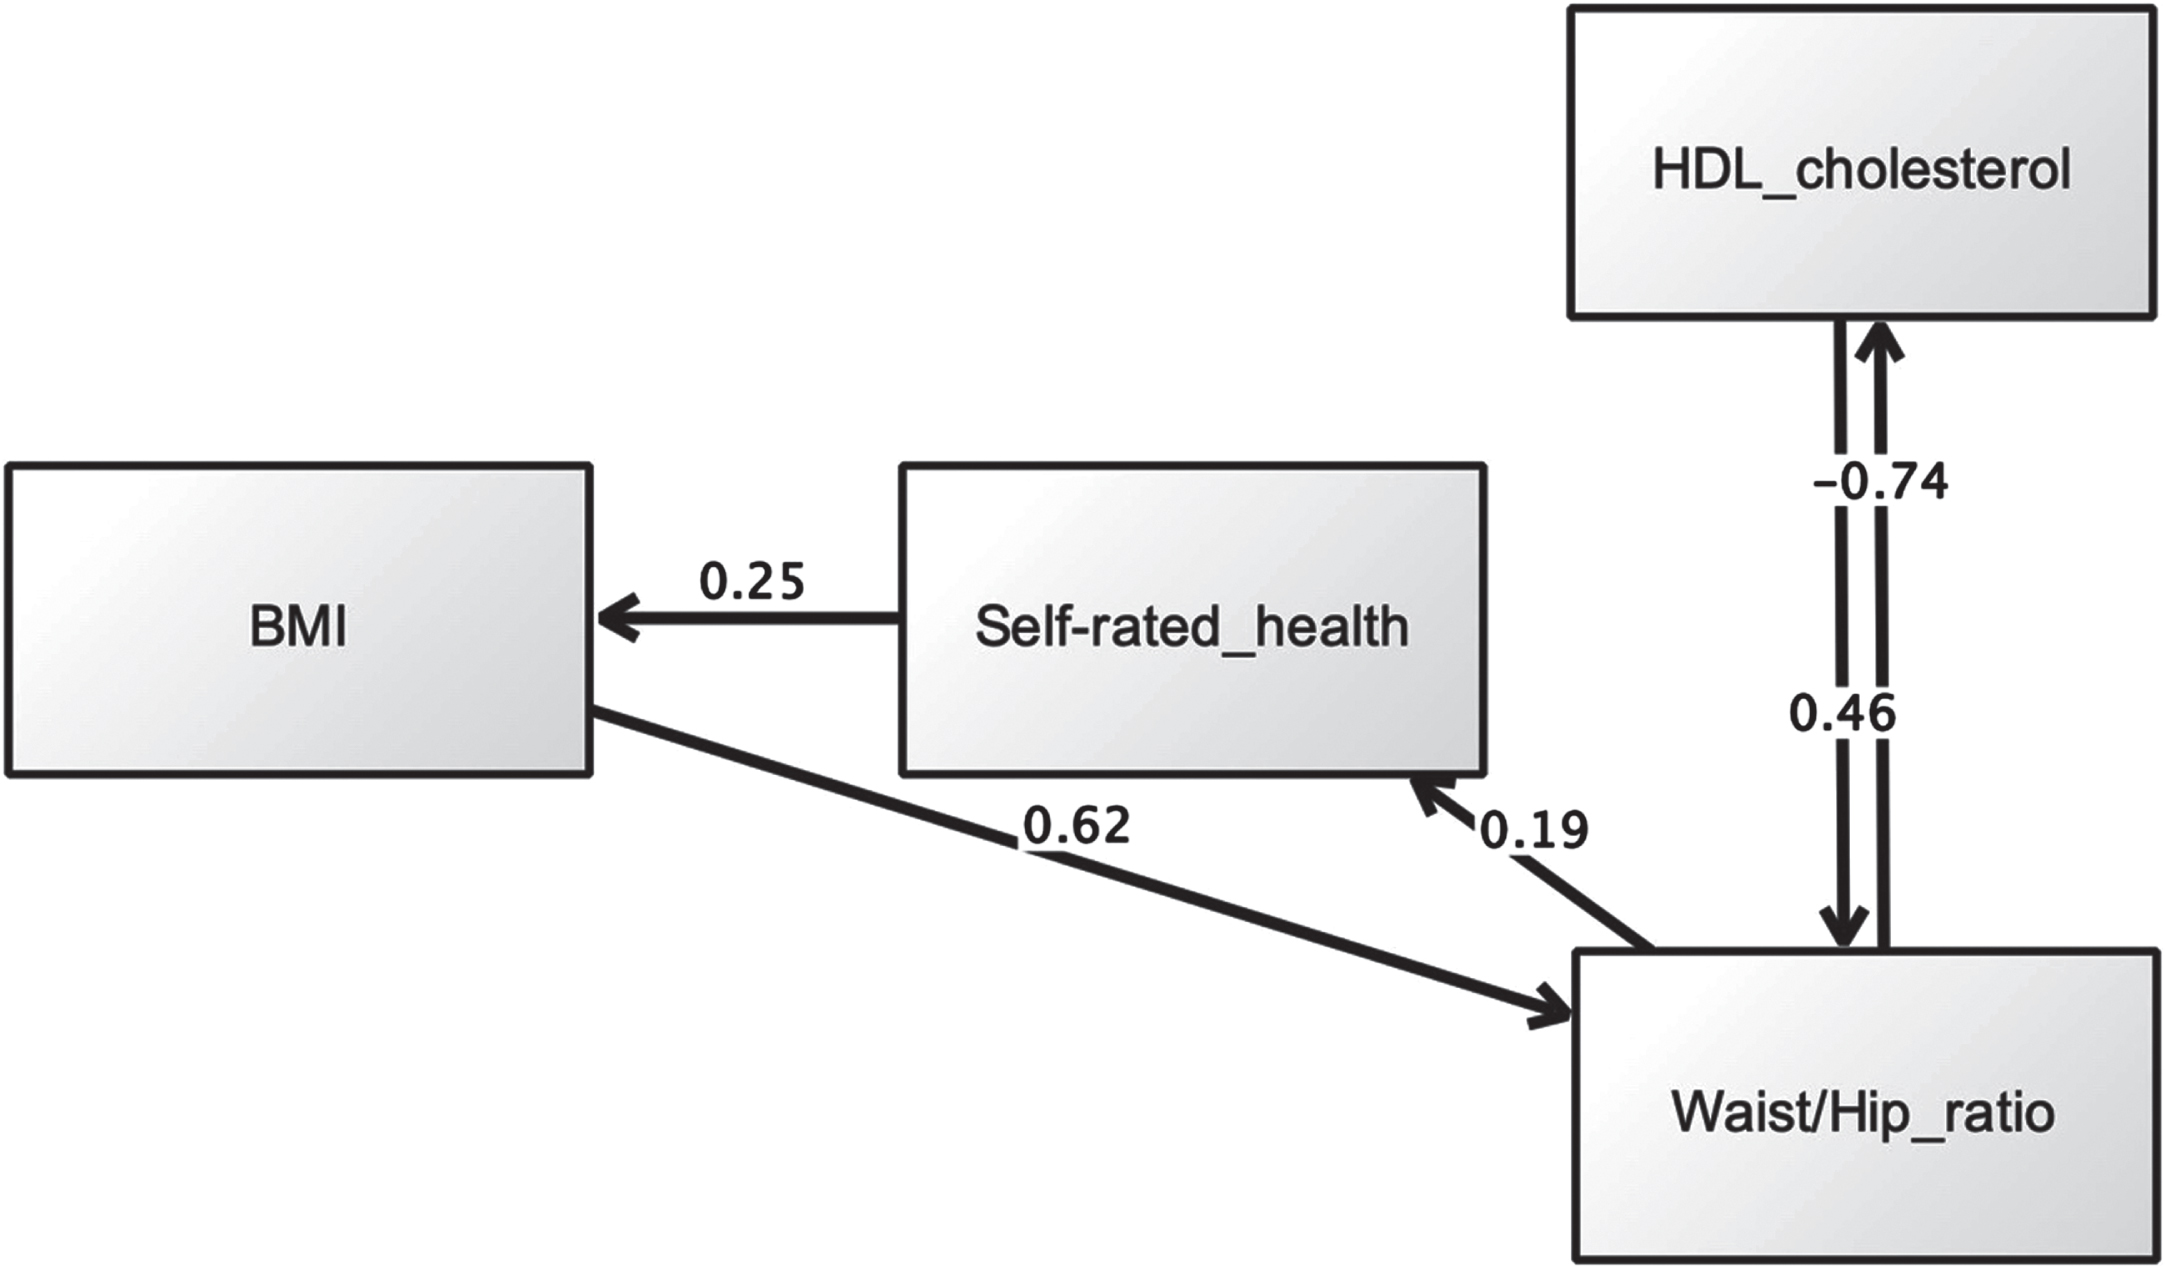
Table 5
Maximum likelihood estimation results (first model)
| Estimate | S.E. | C.R. | P | Label | |||
| Waist/hip ratio | ← | Body mass index (BMI, (kg/m2)) | 0.616 | 0.000 | 24.358 | *** | Supported |
| Waist/hip ratio | ← | High density lipoprotein (HDL, (mmol/L)) | 0.456 | 0.012 | 8.702 | *** | Supported |
| Self-rated health | ← | Waist/hip ratio | 0.185 | 0.150 | 12.054 | *** | Supported |
| High density lipoprotein (HDL, (mmol/L)) | ← | Waist/hip ratio | –0.742 | 0.160 | –20.690 | *** | Supported |
| Body mass index (BMI, (kg/m2)) | ← | Self-rated health | 0.250 | 0.088 | 19.896 | *** | Supported |
Note: estimates are standardised regression weights (default model). *** indicate p < 0.001.
Fig. 4
Second SEM model showing a direct link between SRH and BMI, but no mediating effect for SRH.
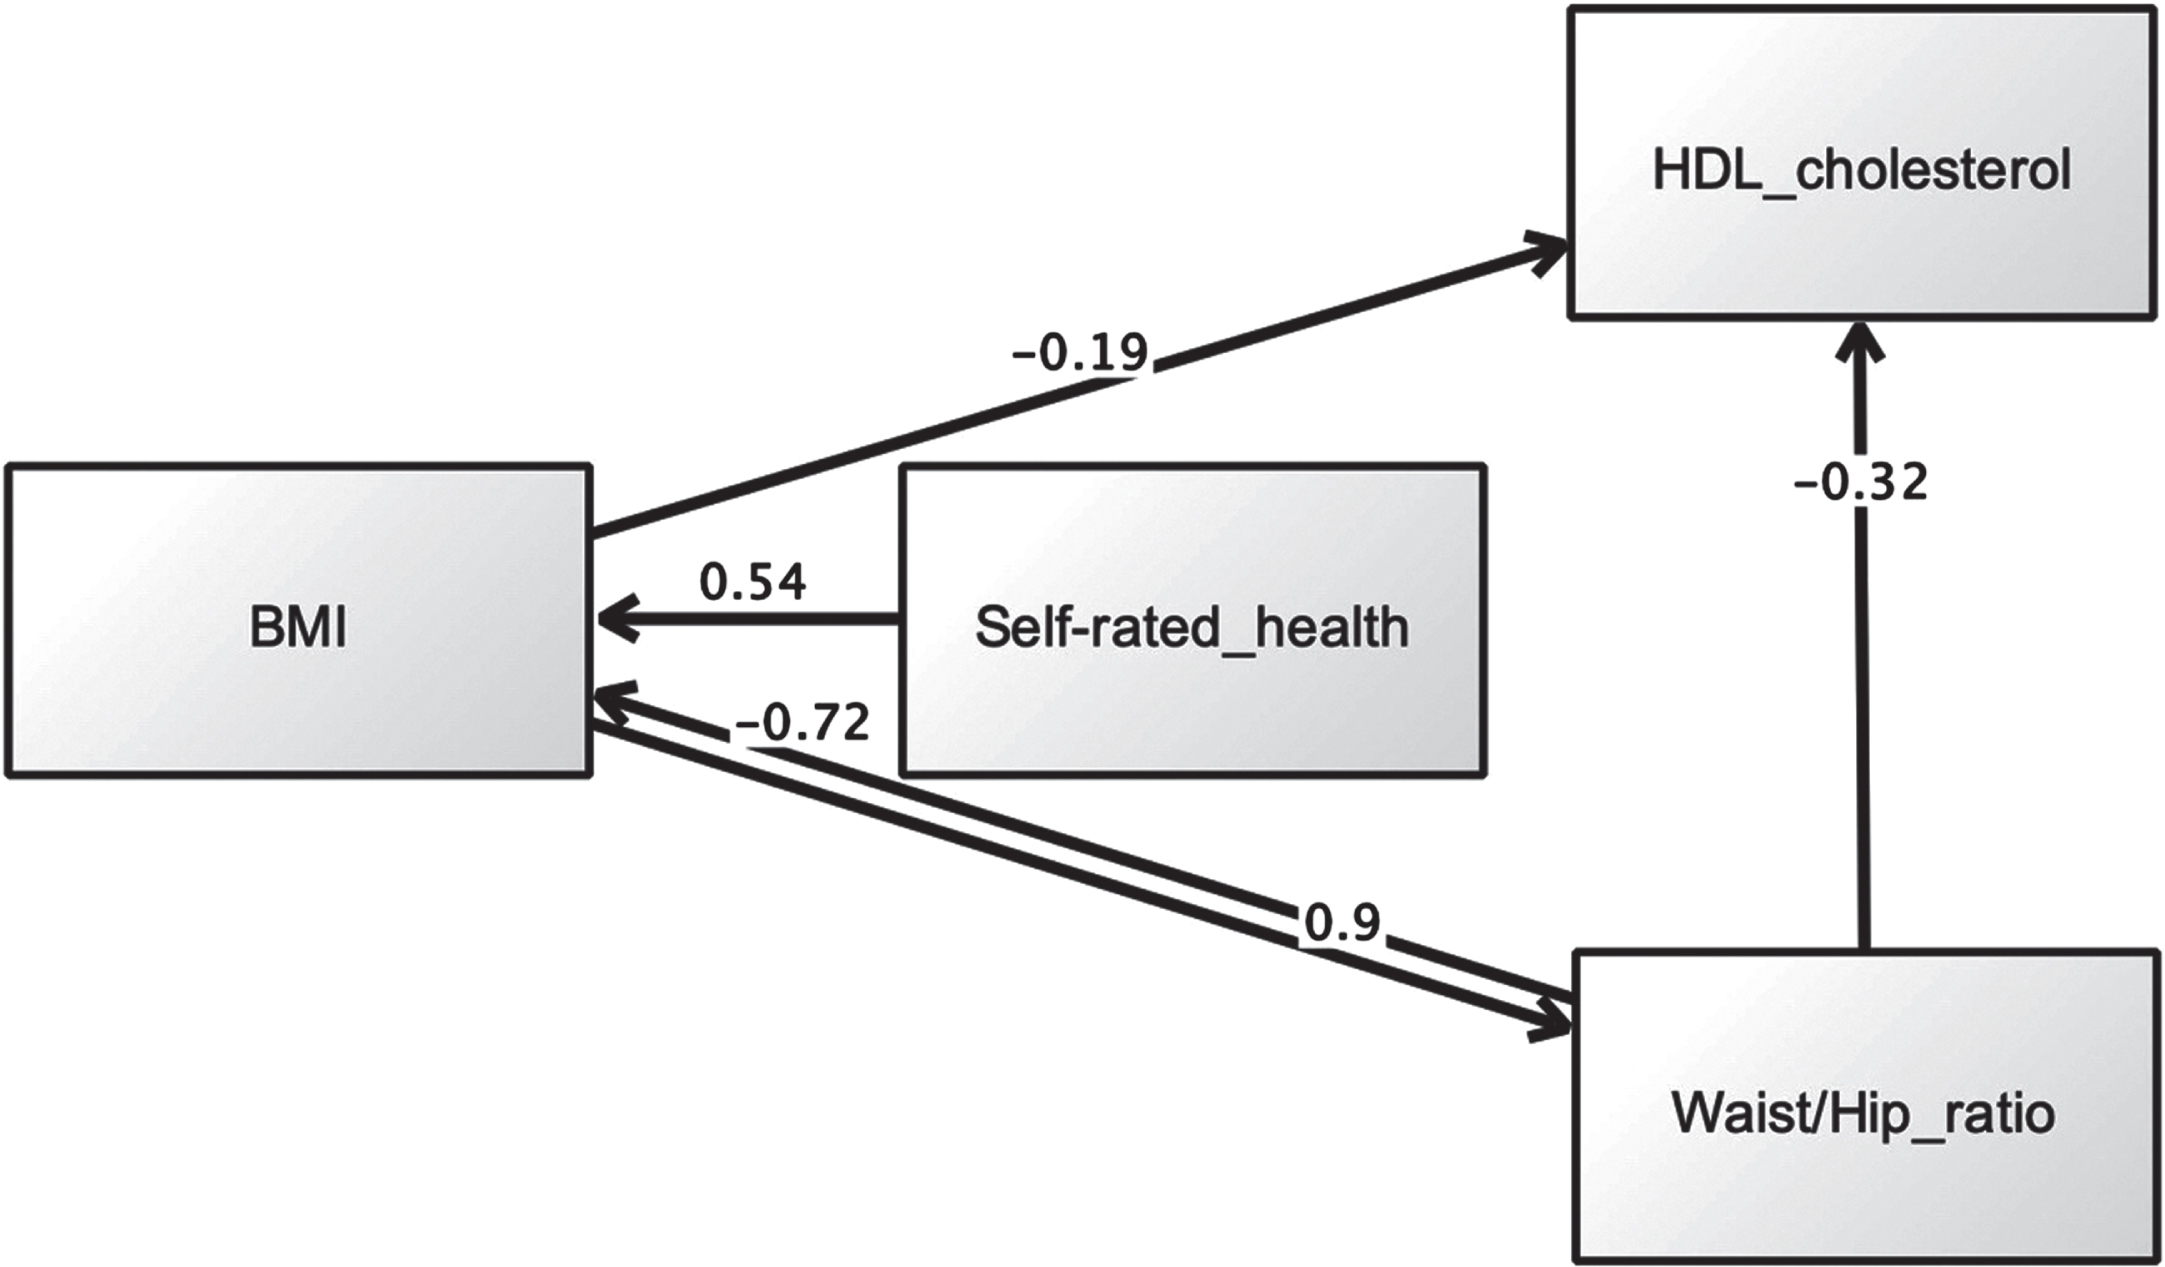
Table 6
Maximum likelihood estimation results (alternative model)
| Estimate | S.E. | C.R. | P | Label | |||
| Body mass index (BMI, (kg/m2)) | ← | Self-rated health | 0.540 | 0.236 | 16.106 | *** | Supported |
| High density lipoprotein (HDL, (mmol/L)) | ← | Waist/hip ratio | –0.321 | 0.079 | –18.166 | *** | Supported |
| High density lipoprotein (HDL, (mmol/L)) | ← | Body mass index (BMI, (kg/m2)) | –0.194 | 0.001 | –10.735 | *** | Supported |
| Waist/hip ratio | ← | Body mass index (BMI, (kg/m2)) | 0.896 | 0.001 | 22.360 | *** | Supported |
| Body mass index (BMI, (kg/m2)) | ← | Waist/hip ratio | –0.720 | 6.234 | –7.916 | *** | Supported |
Note: estimates are standardised regression weights (default model). *** indicate p < 0.001.
DISCUSSION
This is the first study to explore the unique contribution of SRH to MetS status and diagnostic criteria, while adjusting for multiple metabolic covariates. It is also the first study to examine direct and indirect pathways between SRH and cardiometabolic abnormalities, accounting for measurement error. We found qualified support for all three propositions.
Hypothesis 1 SRH and metabolic syndrome
Consistent with previous research SRH predicted MetS status (respondents with poor SRH were more likely to have MetS) [1, 5]. Very few studies have directly examined relations between SRH and MetS caseness (as opposed to MetS diagnostic criteria; see discussion of Hypothesis 2 below). A recent investigation of 4403 adults found that MetS caseness was associated with poor SRH in overweight/obese adults, across various ethnic groups, adjusting for demographics (e.g., age, education, gender, income) and lifestyle factors (e.g., physical activity) [1]. However, past studies have rarely adjusted for diagnostic criteria. Controlling for metabolic covariates nullified the relationship between SRH and MetS status, suggesting any link between SRH and MetS is explained by poor metabolic health (i.e., poor SRH is merely a proxy for obesity and high blood sugar). To the best of our knowledge, no previous study on SRH and MetS caseness has demonstrated these confounding effects, especially for glycaeted haemoglobin. One study [13] found the relationship between SRH and MetS remained significant despite adjusting for BMI but was attenuated after accounting for diabetes status. However, HbA1c was not assessed in that study. The current findings highlight a need to better understand the interrelationships between SRH, obesity, and glycaemic control.
Hypothesis 2 SRH and cardiometabolic factors
As hypothesised SRH predicted HDL cholesterol, waist/hip ratio, BMI, and HbA1c, even after adjusting for metabolic covariates. This suggests the association between SRH and MetS diagnostic criteria is robust and not attributable to cardiometabolic covariates. Our study is perhaps the first to demonstrate the unshared contribution of SRH to metabolic health over and beyond multiple metabolic covariates [2, 13]. Interestingly, we found no association between SRH and blood pressure (both systolic and diastolic), suggesting the link between SRH and blood pressure is conditional on additional factors, including demographics and chronic illness [11]. Overall, more research is needed to better understand the complex biopsychosocial mechanisms underpinning relations between SRH and hypertension. Finally, covariance between SRH and HbA1c is well documented [57] and supported by the current data. Given that glycaeted haemoglobin is included in the new MetS clinical definition proposed by the IDF [45], the utility of poor SRH as an indicator of bad glycaemic control may be especially important in populations not yet formally diagnosed with MetS or type 2 diabetes [58].
Hypothesis 3 SRH as a mediating mechanism
When viewed collectively, the SEM data reveals SRH as an important psychological mechanism implicated metabolic health [34]. As expected, poor SRH emerged as a common denominator in people with higher BMI and elevated waist/hip ratio. Given that diagnosis of MetS does not necessarily require adiposity [20] poor SRH might be a particularly useful, non-intrusive and easily measured indicator for metabolic dysfunction that includes body weight, especially in situations where direct measurement of body fat is impractical or socially unacceptable [35, 59]. Curiously, neither path model revealed a direct link between SRH and HDL cholesterol, suggesting people are less sensitive to HDL deficiency, compared to increased body weight, and/or relations between SRH and hyperlipidemia is moderated by other factors [8, 9].
Limitations
We did not assess insulin resistance directly, but instead relied on a formal diagnosis of type 2 diabetes by a health professional. Thus, the current findings need to be verified using direct measurements of insulin resistance [2]. Sensitivity analyses produced some (arguably minor) changes in our interpretation of the data. The emerging regression models were slightly affected by conversion of missing data using EM and suggests a need for further research to verify the current statistical models using more complete data sets. We employed listwise deletion of missing data, which can incorporate systematic biases based on patterns of missingness, and also reduce statistical power (due to reduced sample size) [54]. Simulation studies should compare the effects of different methods for resolving missing data. Finally, although previous research has implicated lifestyle factors in metabolic syndrome (e.g., alcohol intake, physical activity, smoking status) [2, 50], these variables were not assessed as potential confounders here. Future research needs to examine the extent to which behavioural risk factors explain associations between SRH and metabolic dysfunction. Despite these limitations, this investigation has some strengths, notably the adjustment for multiple metabolic covariates in evaluating associations between SRH and MetS status, and diagnostic criteria, the large sample size, and assessment of both direct and indirect pathways between SRH and metabolic factors. This is the first study to model the structural interrelationships between SRH and metabolic variables while simultaneously accounting for measurement error [60].
CONCLUSION
Although SRH has previously been linked to MetS, this is the first investigation to demonstrate the unique contribution of SRH to metabolic health, while adjusting for multiple metabolic covariates. The findings suggest SRH is not linked to MetS caseness but shows unique associations with BMI and abdominal obesity that can’t be explained by other cardiometabolic factors. Overall, poor SRH may represent a non-intrusive easily measurable risk factor for adiposity in MetS, irrespective other cardiometabolic anomalies, especially where direct measurement of body fat is impractical or socially challenging.
CONFLICT OF INTEREST
The authors have no conflict of interest to report.
ACKNOWLEDGMENTS
The authors would like to thank the UK Data Service for providing access to the HSE population database.
FUNDING
The authors have no funding to report.
REFERENCES
[1] | Okosun IS , Airhihenbuwa C , Henry TL . Allostatic load, metabolic syndrome and self-rated health in overweight/obese Non-Hispanic White, non-Hispanic Black and Mexican American adults. Diabetes Metab Syndr. (2021) ;15: (4):102154. |
[2] | Kim MH , Chang Y , Jung HS , Shin H , Ryu S . Impact of Self-Rated Health on Progression to a Metabolically Unhealthy Phenotype in Metabolically Healthy Obese and Non-Obese Individuals. J Clin Med. (2019) ;8: (1). |
[3] | Kim MJ , Kim IW . Self-rated health may be a predictor for metabolic syndrome and high hs-CRP prevalences in healthy adults in South Korea: Based on the Korea National Health and Nutrition Examination Survey. Nutr Res. (2022) ;102: :71–83. |
[4] | Lee BG , Lee JY , Kim SA , Son DM , Ham OK . [Factors associated with Self-Rated Health in Metabolic Syndrome and Relationship between Sleep Duration and Metabolic Syndrome Risk Factors]. J Korean Acad Nurs. (2015) ;45: (3):420–8. |
[5] | Liu Y , Ozodiegwu ID , Nickel JC , Wang K , Iwasaki LR . Self-reported health and behavioral factors are associated with metabolic syndrome in Americans aged 40 and over. Prev Med Rep. (2017) ;7: :193–7. |
[6] | Cullinan J , Gillespie P . Does Overweight and Obesity Impact on Self-Rated Health? Evidence Using Instrumental Variables Ordered Probit Models. Health Econ. (2016) ;25: (10):1341–8. |
[7] | Hellgren MI , Kitsche E , Groot-Zevert M , Lindblad U , Daka B . Association between body mass index and self-rated health: A Swedish population-based longitudinal study. Scand J Public Health. (2021) ;49: (4):369–76. |
[8] | Shirom A , Toker S , Melamed S , Shapira I . The relationships between self-rated health and serum lipids across time. Int J Behav Med. (2012) ;19: (1):73–81. |
[9] | Tomten SE , Hostmark AT . Self-rated health showed a consistent association with serum HDL-cholesterol in the cross-sectional Oslo Health Study. Int J Med Sci. (2007) ;4: (5):278–87. |
[10] | Kananen L , Enroth L , Raitanen J , Jylhava J , Burkle A , Moreno-Villanueva M , et al. Self-rated health in individuals with and without disease is associated with multiple biomarkers representing multiple biological domains. Sci Rep. (2021) ;11: (1):6139. |
[11] | Idler EL , Benyamini Y . Self-rated health and mortality: a review of twenty-seven community studies. J Health Soc Behav. (1997) ;38: (1):21–37. |
[12] | Umeh K . Self-rated health and multimorbidity in patients with type 2 diabetes. J Health Psychol. 2021: :13591053211001419. |
[13] | Botoseneanu A , Ambrosius WT , Beavers DP , de Rekeneire N , Anton S , Church T , et al. Prevalence of metabolic syndrome and its association with physical capacity, disability, and self-rated health in Lifestyle Interventions and Independence for Elders Study participants. J Am Geriatr Soc. (2015) ;63: (2):222–32. |
[14] | Schnittker J , Bacak V . The increasing predictive validity of self-rated health. PLoS One. (2014) ;9: (1):e84933. |
[15] | Latham K , Peek CW . Self-rated health and morbidity onset among late midlife U. S. adults. J Gerontol B Psychol Sci Soc Sci. (2013) ;68: (1):107–16. |
[16] | Wu S , Wang R , Zhao Y , Ma X , Wu M , Yan X , et al. The relationship between self-rated health and objective health status: a population-based study. BMC Public Health. (2013) ;13: :320. |
[17] | Bombak AE . Self-rated health and public health: a critical perspective. Front Public Health. (2013) ;1: :15. |
[18] | Huang PL . A comprehensive definition for metabolic syndrome. Dis Model Mech. (2009) ;2: (5-6):231–7. |
[19] | Cornier MA , Dabelea D , Hernandez TL , Lindstrom RC , Steig AJ , Stob NR , et al. The metabolic syndrome. Endocr Rev. (2008) ;29: (7):777–822. |
[20] | Saklayen MG . The Global Epidemic of the Metabolic Syndrome. Curr Hypertens Rep. (2018) ;20: (2):12. |
[21] | Li R , Li W , Lun Z , Zhang H , Sun Z , Kanu JS , et al. Prevalence of metabolic syndrome in Mainland China: a meta-analysis of published studies. BMC Public Health. (2016) ;16: :296. |
[22] | Chowdhury MZI , Anik AM , Farhana Z , Bristi PD , Abu Al Mamun BM , Uddin MJ , et al. Prevalence of metabolic syndrome in Bangladesh: a systematic review and meta-analysis of the studies. BMC Public Health. (2018) ;18: (1):308. |
[23] | de Carvalho Vidigal F , Bressan J , Babio N , Salas-Salvado J . Prevalence of metabolic syndrome in Brazilian adults: a systematic review. BMC Public Health. (2013) ;13: :1198. |
[24] | Isomaa B , Almgren P , Tuomi T , Forsen B , Lahti K , Nissen M , et al. Cardiovascular morbidity and mortality associated with the metabolic syndrome. Diabetes Care. (2001) ;24: (4):683–9. |
[25] | Lakka HM , Laaksonen DE , Lakka TA , Niskanen LK , Kumpusalo E , Tuomilehto J , et al. The metabolic syndrome and total and cardiovascular disease mortality in middle-aged men. Jama. (2002) ;288: (21):2709–16. |
[26] | Huh JH , Ahn SG , Kim YI , Go T , Sung KC , Choi JH , et al. Impact of Longitudinal Changes in Metabolic Syndrome Status over 2 Years on 10-Year Incident Diabetes Mellitus. Diabetes Metab J. (2019) ;43: (4):530–8. |
[27] | Falconer J , Quesnel-Vallee A . Pathway from poor self-rated health to mortality: Explanatory power of disease diagnosis. Soc Sci Med. (2017) ;190: :227–36. |
[28] | Hulman A , Ibsen DB , Laursen ASD , Dahm CC . Body mass index trajectories preceding first report of poor self-rated health: A longitudinal case-control analysis of the English Longitudinal Study of Ageing. PLoS One. (2019) ;14: (2):e0212862. |
[29] | Sandvik J , Hole T , Klockner CA , Kulseng BE , Wibe A . Assessment of self-rated health 5 years after Roux-en-Y gastric bypass for severe obesity. BJS Open. (2019) ;3: (6):777–84. |
[30] | Tang K , Zhao Y , Li C . The association between self-rated health and different anthropometric and body composition measures in the Chinese population. BMC Public Health. (2017) ;17: (1):317. |
[31] | Uchino BN . Self-Rated Health and Age-Related Differences in Ambulatory Blood Pressure: The Mediating Role of Behavioral and Affective Factors. Psychosom Med. (2020) ;82: (4):402–8. |
[32] | Shin HY , Shin MH , Rhee JA . Gender differences in the association between self-rated health and hypertension in a Korean adult population. BMC Public Health. (2012) ;12: :135. |
[33] | Shankar A , Wang JJ , Rochtchina E , Mitchell P . Association between self-rated health and incident severe hypertension among men: a population-based cohort study. Singapore Med J. (2008) ;49: (11):860–7. |
[34] | Rochlani Y , Pothineni NV , Kovelamudi S , Mehta JL . Metabolic syndrome: pathophysiology, management, and modulation by natural compounds. Ther Adv Cardiovasc Dis. (2017) ;11: (8):215–25. |
[35] | Tomiyama AJ , Carr D , Granberg EM , Major B , Robinson E , Sutin AR , et al. How and why weight stigma drives the obesity ‘epidemic’ and harms health. BMC Med. (2018) ;16: (1):123. |
[36] | Mindell J , Biddulph JP , Hirani V , Stamatakis E , Craig R , Nunn S , et al. Cohort profile: the health survey for England. Int J Epidemiol. (2012) ;41: (6):1585–93. |
[37] | Oyebode O , Mindell JS . A review of the use of health examination data from the Health Survey for England in government policy development and implementation. Arch Public Health. (2014) ;72: (1):24. |
[38] | Marques C , Johansen IC . Health and household surveys in Brazil and England: The National Health Survey and the Health Survey for England. Cien Saude Colet. (2021) ;26: (9):3943–54. |
[39] | Faul F , Erdfelder E , Buchner A , Lang AG . Statistical power analyses using G*Power 3. Tests for correlation and regression analyses. Behav Res Methods. (2009) ;41: (4):1149–60. |
[40] | Gelman A , Hill J . Sample size and power calculations. Data analysis using regression and multilevel/hierarchical models (analytical methods for social research).. Cambridge: Cambridge University Press; (2006) . |
[41] | Bourne PA . Dichotomising poor self-reported health status: Using secondary cross-sectional survey data for Jamaica. N Am J Med Sci. (2009) ;1: (6):295–302. |
[42] | Taylor R . Insulin resistance and type 2 diabetes. Diabetes. (2012) ;61: (4):778–9. |
[43] | Nuttall FQ . Body Mass Index: Obesity, BMI, and Health: A Critical Review. Nutr Today. (2015) ;50: (3):117–28. |
[44] | Taylor BC , Wilt TJ , Welch HG . Impact of Diastolic and Systolic Blood Pressure on Mortality: Implications for the Definition of “Normal". Journal of General Internal Medicine. (2011) ;26: (7):685–90. |
[45] | Cavero-Redondo I , Martinez-Vizcaino V , Alvarez-Bueno C , Agudo-Conde C , Lugones-Sanchez C , Garcia-Ortiz L . Metabolic Syndrome Including Glycated Hemoglobin A1c in Adults: Is It Time to Change? J Clin Med. (2019) ;8: (12). |
[46] | Goodall I . HbA1c standardisation destination–global IFCC Standardisation. How, why, where and when–a tortuous pathway from kit manufacturers, via inter-laboratory lyophilized and whole blood comparisons to designated national comparison schemes. Clin Biochem Rev. (2005) ;26: (1):5–19. |
[47] | Sherwani SI , Khan HA , Ekhzaimy A , Masood A , Sakharkar MK . Significance of HbA1c Test in Diagnosis and Prognosis of Diabetic Patients. Biomark Insights. (2016) ;11: :95–104. |
[48] | Abbate M , Pericas J , Yanez AM , Lopez-Gonzalez AA , De Pedro-Gomez J , Aguilo A , et al. Socioeconomic Inequalities in Metabolic Syndrome by Age and Gender in a Spanish Working Population. Int J Environ Res Public Health. (2021) ;18: (19). |
[49] | Rampal S , Mahadeva S , Guallar E , Bulgiba A , Mohamed R , Rahmat R , et al. Ethnic differences in the prevalence of metabolic syndrome: results from a multi-ethnic population-based survey in Malaysia. PLoS One. (2012) ;7: (9):e46365. |
[50] | Sugathan S , Ali O , Myint Soe M , Ismail S , Ahmad W . Socio demographic and lifestyle factors of metabolic syndrome among adult rural indigenous Malaysian population from Perak State, Malaysia. Saudi J Biol Sci. (2021) ;28: (8):4818–24. |
[51] | Shi D , Maydeu-Olivares A . The effect of estimation methods on SEM fit indices. Educational and Psychological Measurement. (2020) ;80: (3):421–45. |
[52] | Griffin MM , Steinbrecher TD . Large-Scale Datasets in Special Education Research. Int Rev Res Dev Disa. (2013) ;45: :155–83. |
[53] | Menyhart O , Weltz B , Gyorffy B . MultipleTesting.com: A tool for life science researchers for multiple hypothesis testing correction. PLoS One. (2021) ;16: (6):e0245824. |
[54] | Rubin LH , Witkiewitz K , Andre JS , Reilly S . Methods for Handling Missing Data in the Behavioral Neurosciences: Don’t Throw the Baby Rat out with the Bath Water. J Undergrad Neurosci Educ. (2007) ;5: (2):A71–7. |
[55] | Stavseth MR , Clausen T , Roislien J . How handling missing data may impact conclusions: A comparison of six different imputation methods for categorical questionnaire data. SAGE Open Med. (2019) ;7: :2050312118822912. |
[56] | Hooper D , Coughlan J , Mullen MR . Structural equation modelling: guidelines for determining model fit. The Electronic Journal of Business Research Methods. (2008) ;6: (1):53–60. |
[57] | Assari S , Lankarani MM , Piette JD , Aikens JE . Self-Rated Health and Glycemic Control in Type 2 Diabetes: Race by Gender Differences. J Racial Ethn Health Disparities. (2018) ;5: (4):721–7. |
[58] | Beagley J , Guariguata L , Weil C , Motala AA . Global estimates of undiagnosed diabetes in adults. Diabetes Res Clin Pract. (2014) ;103: (2):150–60. |
[59] | Altman CE , Van Hook J , Hillemeier M . What Does Self-rated Health Mean? Changes and Variations in the Association of Obesity with Objective and Subjective Components Of Self-rated Health. J Health Soc Behav. (2016) ;57: (1):39–58. |
[60] | Beran TN , Violato C . Structural equation modeling in medical research: a primer. BMC Res Notes. (2010) ;3: :267. |

