
Complex graph neural networks for medication interaction verification
Abstract
This paper presents the development and application of graph neural networks to verify drug interactions, consisting of drug-protein networks. For this, the DrugBank databases were used, creating four complex networks of interactions: target proteins, transport proteins, carrier proteins, and enzymes. The Louvain and Girvan-Newman community detection algorithms were used to establish communities and validate the interactions between them. Positive results were obtained when checking the interactions of two sets of drugs for disease treatments: diabetes and anxiety; diabetes and antibiotics. There were found 371 interactions by the Girvan-Newman algorithm and 58 interactions via Louvain.
1Introduction
According to the World Health Organization [1], more than 50% of medicines are incorrectly prescribed, dispensed, and/or sold. The National System of Toxic Pharmacological Information recorded that in 2011, there were 30,000 cases of poisoning due to the use of medicines. Although it is not possible to state which of them occurred due to drug interaction, in three specific circumstances the possibility is very extensive: (i) by wrong therapeutic use, (ii) by incorrect medical prescription, and (iii) by self-medication. Even so, the consequences range from body pain, bleeding, or heart problems, which can be fatal [2].
Drug interactions (DIs) occur when the pharmacological effect of a particular drug is changed by the action of another drug. DI is a major cause of adverse drug reaction (ADR), particularly in patient populations taking multiple medications. A study indicated that medications were often used together in older people, with nearly 1 in 25 individuals potentially at risk for a major DI [3].
Sehn et al. [4] reported the impact of the interaction on the hospitalized patient. Severe interactions were classified as those that are possibly life-threatening or capable of causing permanent damage. Moderate are those which cause clinical deterioration of the patient, requiring extra treatment, hospitalization, or an increase in the length of hospital stay. Mild are those effects that are generally mild, can be uncomfortable, or go unnoticed; however, they do not significantly affect the effectiveness of therapy and usually do not require additional treatment.
DIs are one of the common causes of medication error in developed countries, mainly in elderly people due to polytherapy, with a prevalence of 20-40% [5]. Currently, more than 8,300 types of drugs are available, including more than 2,300 approved drugs by the Food and Drug Administration, and more than 6,000 experimental drugs [6].
Thakrar et al. [7] indicate that the process of identifying DIs occurs in clinical trial stages, however, many interactions will be identified with the experience in population use. In the post-marketing period, it is the notifications that bring out the effects of DIs. However, DIs are rarely reported, and when they are, there is a lack of information about the pharmacokinetic changes of the drugs that caused the reaction in the patient.
According to Sehn et al. [4], drug interactions are usually identified through the knowledge and experience of the pharmacist, the physician when prescribing the drug, or by consulting the drug package insert, which presents information pertinent to possible interactions. Moreover, the author underlines that algorithm that performs drug interaction prediction tend to find a greater number of interactions than pharmaceutical professionals, becoming a viable and more effective alternative.
In this context, the use of graph neural networks (GNN) is increasingly recurrent to model real and artificial systems [8], especially for service recommendation [9]. These networks can represent the analysis of chemical reactions to the dynamics of relationships that permeate society [10]. GNNs might have different architectures [11], depending on the problem need, such as graph convolution networks [12], hierarchical graph neural networks [13], dynamic graphs [14], and complex networks [15]. The graph models have been improved with the inclusion of mechanisms that enhance their performance [16], such as the attention mechanisms in graph attention network [17].
A complex network is a graph neural network with non-trivial topological features [18]. Complex networks are used for knowledge representation, data processing, and modeling of complex systems. These systems are formed by many parts, being interrelated possibly in a non-linear way, exhibiting emergent and multi-choice behaviors. Examples of complex systems can be found especially in biological [19], transportation [20], social, and climate domains. The complex network have been applied in several fields such as time series [21], community detection [22], forecast [23], diagnostic prediction [24], and evaluation of vulnerability of communities [25].
Considering the high capacity of this approach, this paper proposes to use GNNs, especially complex networks to verify DIs that may cause some adverse effects on a person’s body. The Louvain and Girvan-Newman models are applied for evaluating the quality of communities in a graph, being an approach that is necessary for a complete evaluation of the presented problem.
The sequence of this paper is organized as follows: Section 2 presents a review on drug interactions. In Section 3 the proposed methodology for analyzing the issue is presented. Section 4 presents the analysis of results and Section 5 presents a conclusion.
2Theoretical background
A DI occurs when the effects and/or toxicity of one drug are altered by the presence of another [26]. There are several risk factors for the occurrence of DIs, which are related to the prescription, in which the increased risk of interactions is directly proportional to the amount of drugs prescribed [27]. DIs can be classified as synergistic, when the effect of the interaction is greater than the individual result of the drugs, and antagonistic, when the effect of the interaction decreases or change/cancel the effectiveness of the drug individually.
To summarize the comparisons with related works, Table 1 shows authors that have presented closely related works with this paper. In this table, a summary of the main points in their research is presented. A complete explanation of the methods is presented throughout this section. It is noted that the works by Cheng, Kovács, and Barabási [28], Alaimo et al. [29, and Huang et al. 30], have similar objectives to that presented in this paper. Related works by other authors will also be discussed in this section.
Table 1
Example of samples from the used dataset.
| Paper | Goals | Main functionalities | Findings |
| [28] | Modeling a network to determine drug combinations. | Two algorithms were applied, the z-score and the shortest average distance. | For a drug pair to have a therapeutic effect, both target modules must overlap with the disease module. |
| [29] | Integrate the DrugBank database with the recommendation algorithm. | A web system for target drug interaction (TDI) was developed. | DT-web project allows the user to browse and test predictions of a likely new TDI. |
| [30] | Identify drug interactions through the use of complex networks. | Developed a proteinprotein interaction network. | The higher the grade of the drugs, the more likely a interaction will happen. |
According to Oga, Basile, and Carvalho [31], interactions occur due to several types of mechanisms, the main ones being classified as physical-chemical (pharmaceutical), when the interaction occurs solely due to the physical and chemical composition of the medication, thus causing incompatibility between them; the pharmacokinetic mechanism, in which a medication is able to alter the absorption, distribution, transformation and excretion of the medication by the body. In the pharmacodynamic mechanism the final effects of the drug are the result of the pharmacodynamic actions of the drugs, i.e., related to the interaction of the drug with its target, promoting addition or potentiation in the effects of the drugs.
The mechanism of action of most drugs is attributed to interactions with the body’s macromolecular components. In this context, the term receptor is attributed to the components of organisms with which the chemicals of the drug appear to interact, through which biochemical and physiological changes are produced [32]. Moreover, proteins are the most important group of pharmacological receptors, since they act in the endocrine system, as hormone receptors, in the nervous system, as neurotransmitter receptors, and in the transcription of growth factors. Enzymes, on the other hand, proteins that catalyze chemical reactions, participate in crucial metabolic and regulatory pathways. Above all, proteins are still involved in the transport process through the plasma membrane and in its structure.
According to Brunton, Lazo, and Parker [32], drug transporter proteins act in pharmacokinetic and pharmacodynamic pathways, involved in both therapeutic actions and adverse effects. Transport proteins are present in plasma membranes found in all organisms. These are responsible for controlling the flow of essential nutrients, ions, the efflux of cellular degradation products, environmental toxins, and other xenobiotics. Pharmacologists generally classify transporters into two large families: (i) bindig cassette transporters, (ii) solute carrier transporters or carriers.
Another group of proteins important for the regulation of the organism’s homeostasis are enzymes, proteins that catalyze chemical reactions [33]. They are found in various tissues of the body, however, are present at higher levels in the tissues of the gastrointestinal tract (liver and small and large intestines). These sites are responsible for the metabolization and excretion of drugs. Besides biotransforming the drugs into metabolites for elimination, they act as converters of prodrugs (inactive form) in active compounds, which reach their respective sites of action.
The elderly have a greater number of pathologies and, consequently, receive a greater amount of medications when compared to other age groups [34]. The risk of potential DIs increases with advancing age, considering that the elderly tend to use more medications and be accompanied by more than one physician. To Secoli [35] the use of two or more medications, is directly associated with increased risk of DIs, which can cause serious adverse drug reactions. Artificial intelligence-based models are an alternative for dealing with these complex tasks in prediction (emergency [36], faults [37], and power generation [38]), optimization [39], and classification using k-nearest neighbors [40], convolutional neural networks [41], and other structures based on deep learning [42]. There is room for application of these models in several fields, such as in the study of electrical machines [43], combining with optimization methods [44], and sustainability [45].
Bueno et al. [34] suggest that besides the use of more medications, the physiological characteristics of the elderly also contribute to the occurrence of more DIs. These are decreased gastric juice production, slower gastric emptying, less total water content, higher adipose tissue content, lower plasma proteins, decreased renal irrigation, glomerular filtration, and tubular secretion. However, many of the adverse effects that the drug may present will be unpredictable, taking into consideration that several factors can influence pharmaceutical actions, from several concomitant drugs, to physical and metabolic characteristics of people, making it difficult to predict the extent and depth of the action of any drug [46].
Backes [47] suggests that the recognition of drug interactions is a complex task, being the spontaneous notification of reactions, one of the main ways of identification. This notification is understood as notifications of DIs, usually linked to the concomitant use of more drugs, and when the notifications reach a statistically significant amount, compared to all other drugs, it may be a sign that there is an DI generating significant ADRs. Thus, it is possible to observe the importance of studies for recognizing drug interactions, allowing the search for alternatives for a treatment, avoiding or minimizing the chance of this treatment causing an ADR to the patient. However, with the aid of tools that seek to identify these interactions, it is possible to exchange one drug for another, and consecutively providing an opportunity for a treatment that offers less risk to the patient’s health.
Cheng, Kovács, and Barabási [28] modeled a network to determine drug combinations (administration of two or more drugs) for treatments of complex and specific diseases. The authors used data from the drugs related to the proteins that this drug interacts with, examining each protein that the drug acts on and looking for correlation of target proteins between drugs, i.e., identifying which drugs act on the same proteins. Two algorithms were developed, the first being z-score, however, the authors report that z-score did not prove adherent to the problem and would not be effective in determining combinations of drug pairs. In light of this, they developed the second algorithm called shortest average distance.
Alaimo et al. [29] integrated the DrugBank database with the DT-Hybrid recommendation algorithm to validate network inference with drug-target interaction. As well as, perform integration of DrugBank, DT-Hybrid and Pathway-Commons to aid in the experimental phase of drug combinations to act on multiple targets simultaneously. A web system was developed, where it is possible to inform the drug model to validate drug interactions. In predicting target drug interactions, the authors used the DT-Hybrid algorithm, which can be adjusted according to the user’s input parameters to fit the input data.
Huang et al. [30] identified DIs through the use of complex networks, focusing on the identification of pharmacodynamic type drug interactions. In their work a protein-protein interaction network was developed from the DrugBank database, applying a scoring algorithm to define drugs that have target protein connection, the authors termed this algorithm S-score. Considering the increasing applicability of machine learning for prediction (such as ultrasound [48], leakage current [49], faults [50], and pandemic conditions [51]), optimization [52], and classification [53, 54], it becomes increasingly promising to evaluate the ability of these models to identify patterns and automate decision making, considering the needs of supply chain management [55], especially in relation to medicines, as will be presented in this paper.
3Description of the application
This section presents the most relevant aspects related to the development of the model for the identification of DIs with the usually used diabetes drugs, using complex networks for modeling and community algorithms for the identification/analysis of interactions.
3.1Proposed method
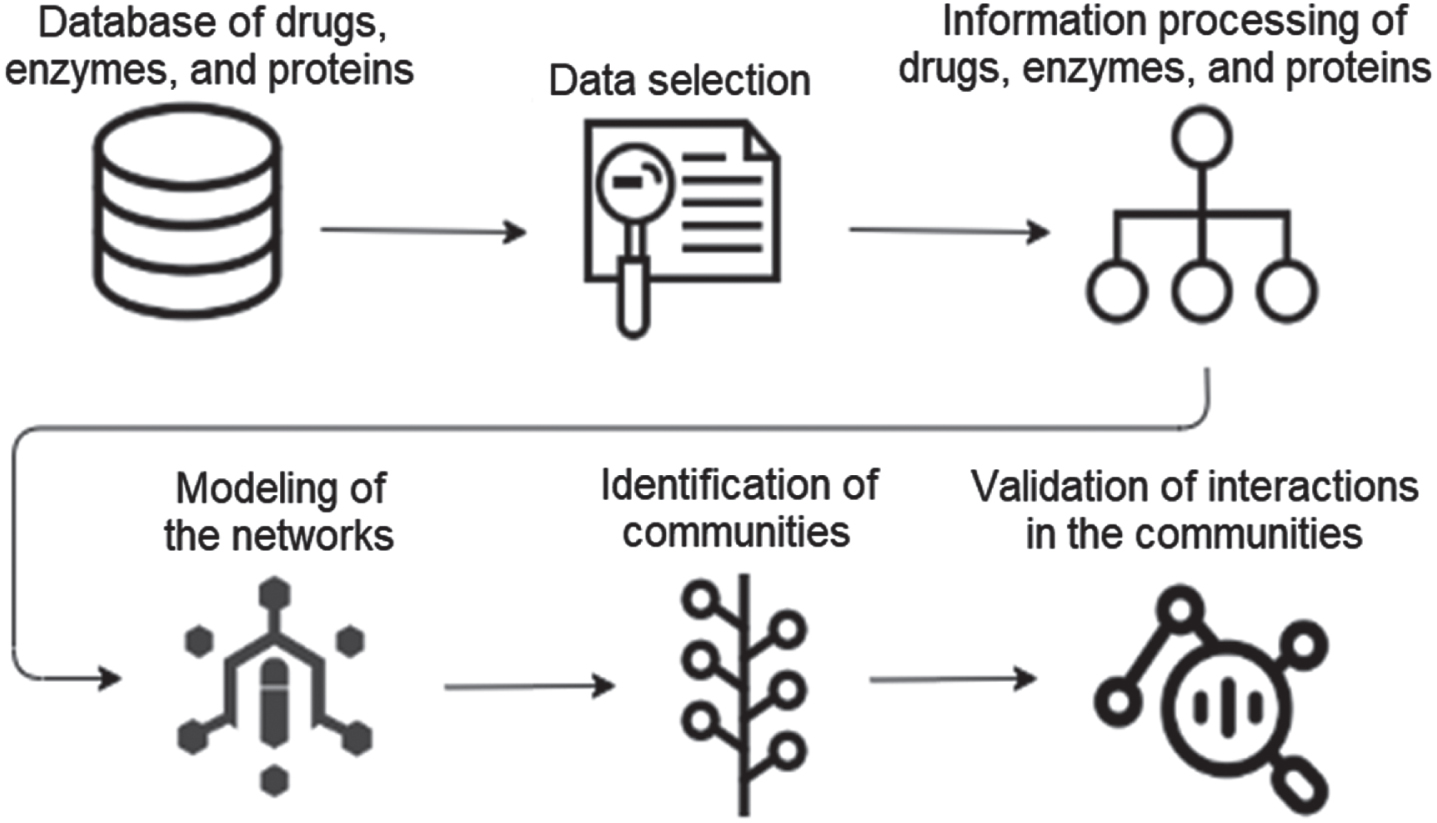
For the development of this paper, community algorithms were used in complex networks. The database was created using several steps, such as: (i) data selection, (ii) processing of drugs, enzymes and proteins, (iii) modeling of networks (iv) identification of communities and, finally, (v) validation of interactions; this procedure is shown in Fig. 1.
Fig. 1
Procedure applied for the proposed method.
In the data selection phase, we used the data extracted from the database provided by DrugBank, available at (1). In addition to the drugs, target proteins (TA), transport proteins (TP), carrier proteins (CP) and enzymes (E), were used. The dataset consists of 14,315 drugs, 5,260 target proteins, 292 transport proteins, 97 carrier proteins, and 494 enzymes. An example of samples of the used dataset is presented in Table 2.
Table 2
Example of samples from the used dataset.
| ID | Name | Gene Name | GenBank Protein ID | GenBank Gene ID | UniProt ID | Uniprot Title | PDB ID |
| 16 | Coagulation factor VIII | F8 | 182818 | M14113 | P00451 | FA8_HUMAN | 1CFG |
| 41 | Coagulation factor V | F5 | 182412 | M16967 | P12259 | FA5_HUMAN | 1CZS |
| 130 | Hemoglobin subunit alpha | HBA1 | 386764 | J00153 | P69905 | HBA_HUMAN | 1A00 |
| 256 | SEC14-like protein 2 | SEC14L2 | 5596693 | AL096881 | O76054 | S14L2_HUMAN | 1O6U |
| 314 | Retinol-binding protein 4 | RBP4 | 35897 | X00129 | P02753 | RET4_HUMAN | 1BRP |
Table 3 shows the arrangement of the dataset after the data selection phase.
Table 3
DrugBank PA Database Structure Example.
| Name | Drug Ids |
| Peptidoglycan synthase FtsI | DB00303 |
| Histidine decarboxylase | DB00114, DB00117 |
| Glutaminase liver isoform, mitochondrial | DB00142 |
| Coagulation factor XIII A chain | DB02340, DB11300, DB11311, DB11571, DB13151 |
| Nitric oxide synthase, inducible | DB00125, DB00155, DB01017, DB01110, DB01234, DB01686, DB01835, DB01997, DB02044, DB02207, DB02234, DB02462, DB02644, DB03100, DB03144, DB03366, DB03449, DB03953, DB04400, DB04534, DB05214, DB05252, DB05383, DB06879, DB06916, DB07002, DB07003, DB07007, DB07008, DB07011, DB07029, DB07306, DB07318, DB07388, DB07389, DB07405, DB08214, DB08750, DB08814, DB09237, DB11327, DB14649 |
The processing phase of drugs, proteins and enzymes consists in identifying all the proteins and enzymes that each drug binds, which in turn were already catalogued by DrugBank, listed in the TA, TP, CP, and E bases, having all the drugs that they bind.
For example, when analyzing a specific drug, such as Metformin that in the database has the identifier DB00331, using only the PA data, one can see that this drug binds to three different target proteins, which in turn bind to other drugs, as shown in Table 4. In this way all drugs that bind to these proteins are extracted.
Table 4
Example with the PA links of the drug Metformin.
| Name | Drug Ids |
| Glycerol-3-phosphate dehydrogenase [NAD(+)], cytoplasmic | DB00157, DB00331 |
| 5’AMP-activated protein kinase subunit beta-1 | DB00131, DB00331 |
| Electron transfer flavoprotein ubiquinone oxidoreductase, mitochondrial | DB00331, DB04141 |
From the data obtained in the previous phase, one can move on to the network modeling phase, in which the drugs and proteins represent the vertices of the network and the connection between them being the edges. In the case of the drug Metformin, one can observe that it has binding with three target proteins.
In this pattern four networks were created, being TA, TP, CP, and E. It is noteworthy that the network modeling was performed this way, because it took into account the importance of receptors for the biochemical and physiological effects to the drugs. It is noteworthy that the project could be created with only one complex network, but the division of the networks was done to facilitate the process of detecting the communities.
After the modeling, the identification phase of the communities begins. In this phase, two algorithms were used for the detection of communities, the first being Louvain and the second Girvan-Newman. To execute the Louvain algorithm, the algorithm implemented by the NetworkX library community was used. For the application of the Girvan-Newman algorithm, the implementations natively present in the NetworkX library were used.
A common property in complex networks is the presence of modular structures called communities. According to Mostaço-Guidolin [56], the goal behind the clustering procedures or community detection in complex networks, is the determination of sets of vertices that have some common feature between them, that through these characteristics should be possible to classify them and organize them into groups.
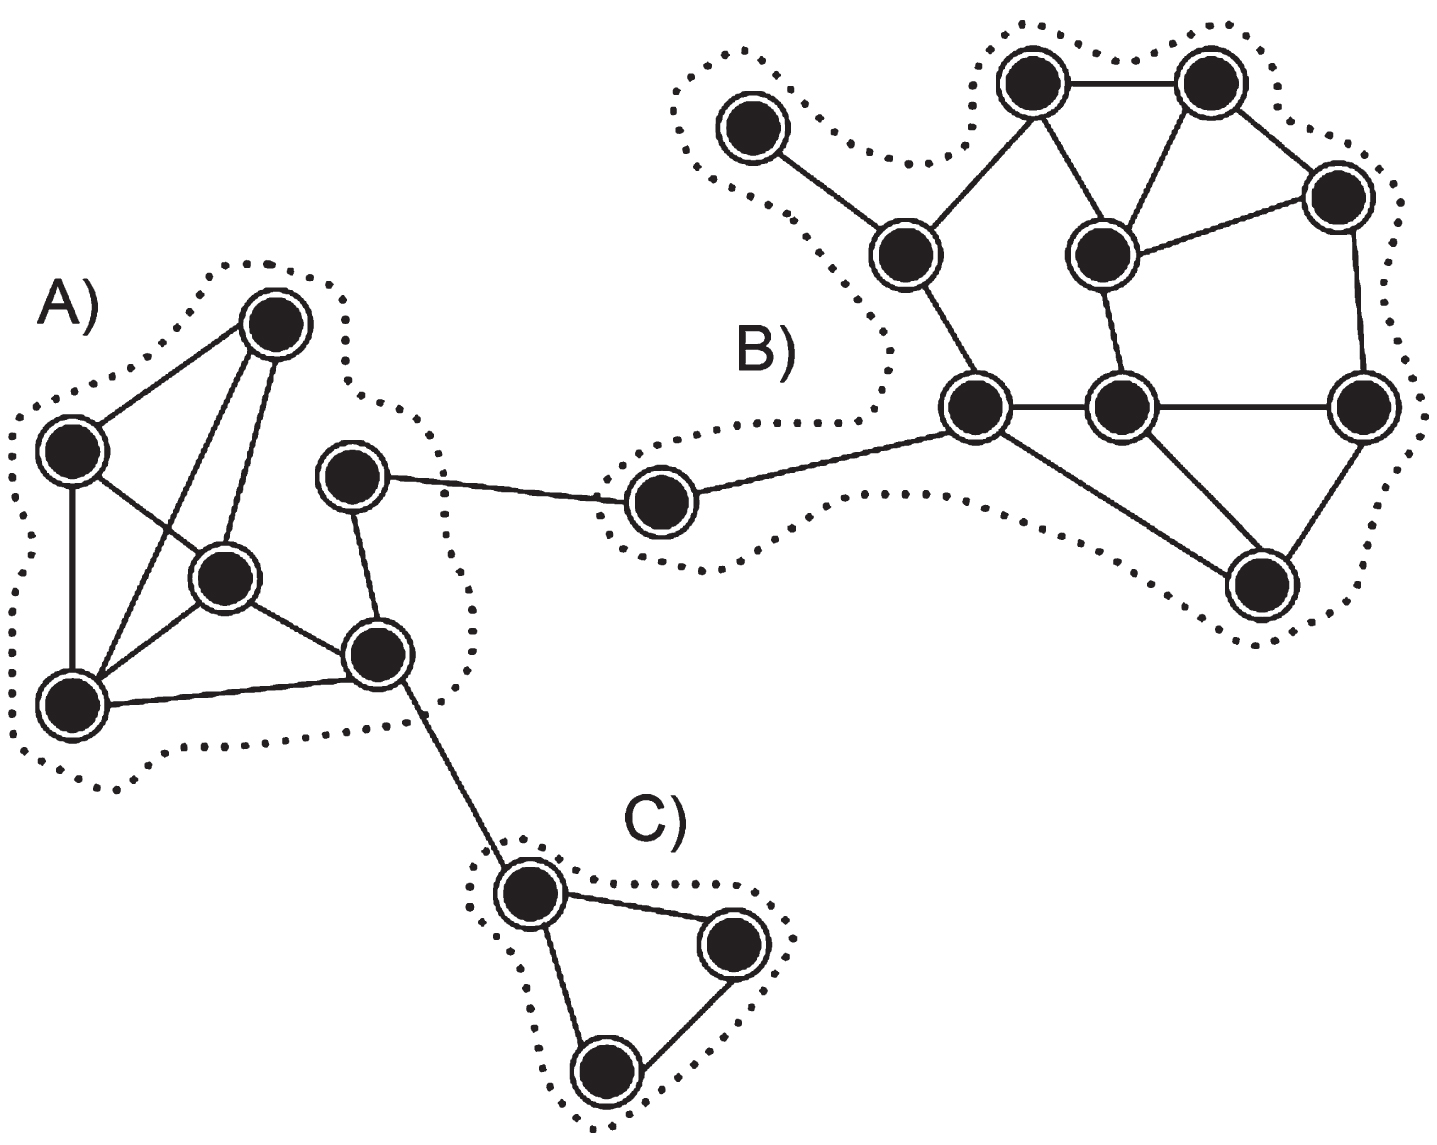
It is possible to define that a community is composed of a set of vertices, which have a greater number of edges connecting vertices of the same community, instead of edges connecting to vertices of other communities [56]. Figure 2 shows an example of a community in a network, and it is possible to observe the existence of three well-defined communities, demonstrating that the vertices within the communities connect in greater numbers, forming the communities A, B and C.
Fig. 2
Example of communities in complex networks.
Modularity Q is a measure proposed by Girvan and Newman [57], widely accepted in the scientific community as one of the important measures for evaluating the quality of communities in a network, used both for the Louvain algorithm and in Girvan and Newman’s algorithm itself. The calculation of modularity is shown in Equation (1).
(1)
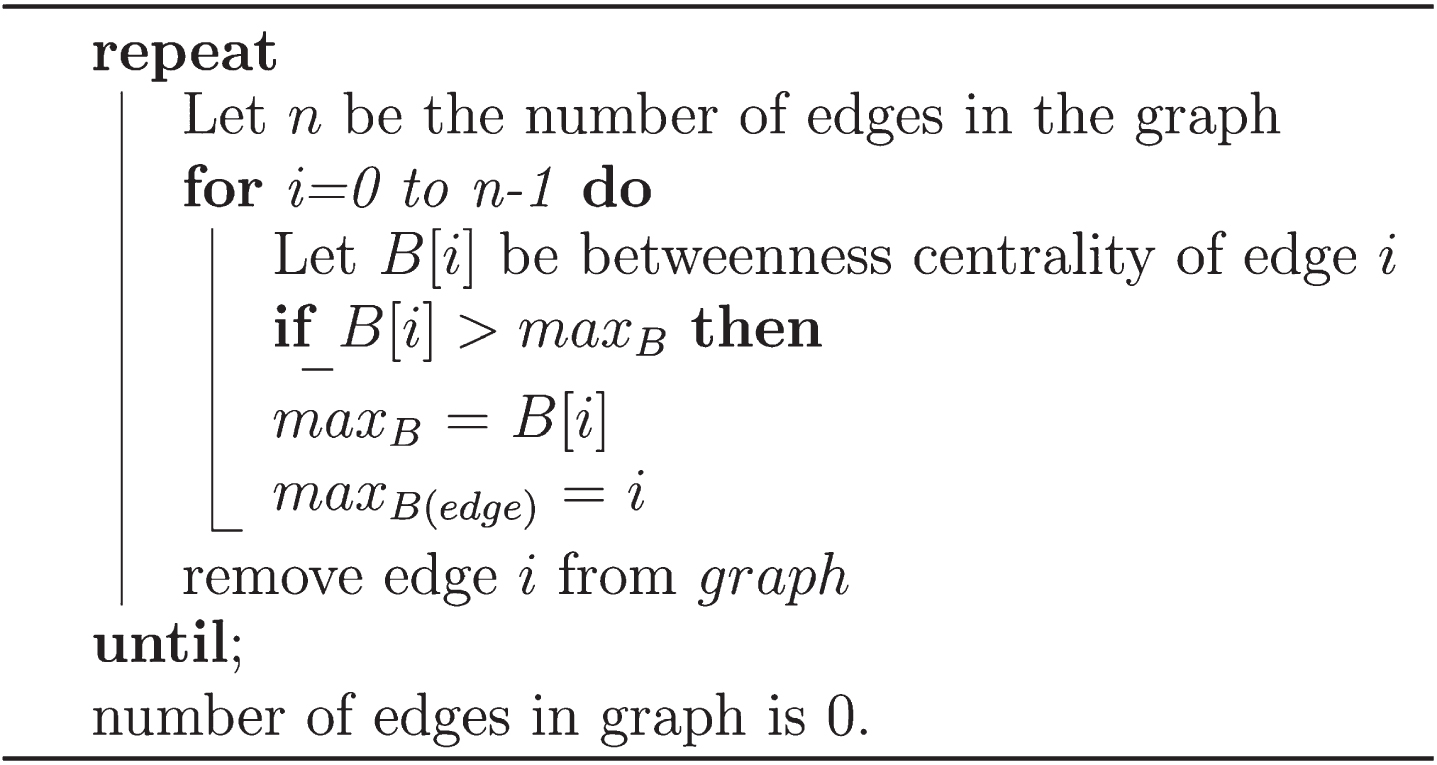
From this, modularity assumes a value between -1 and 1, the higher these values are, the better the community structures are. It is noteworthy that the process of finding the maximum modularity of the network can be considered an NP-Complete algorithm, i.e., of polynomial time complexity. The Pseudocode of the Girvan-Newman algorithm is presented in Fig. 3.
Fig. 3
Pseudocode of the Girvan-Newman algorithm.
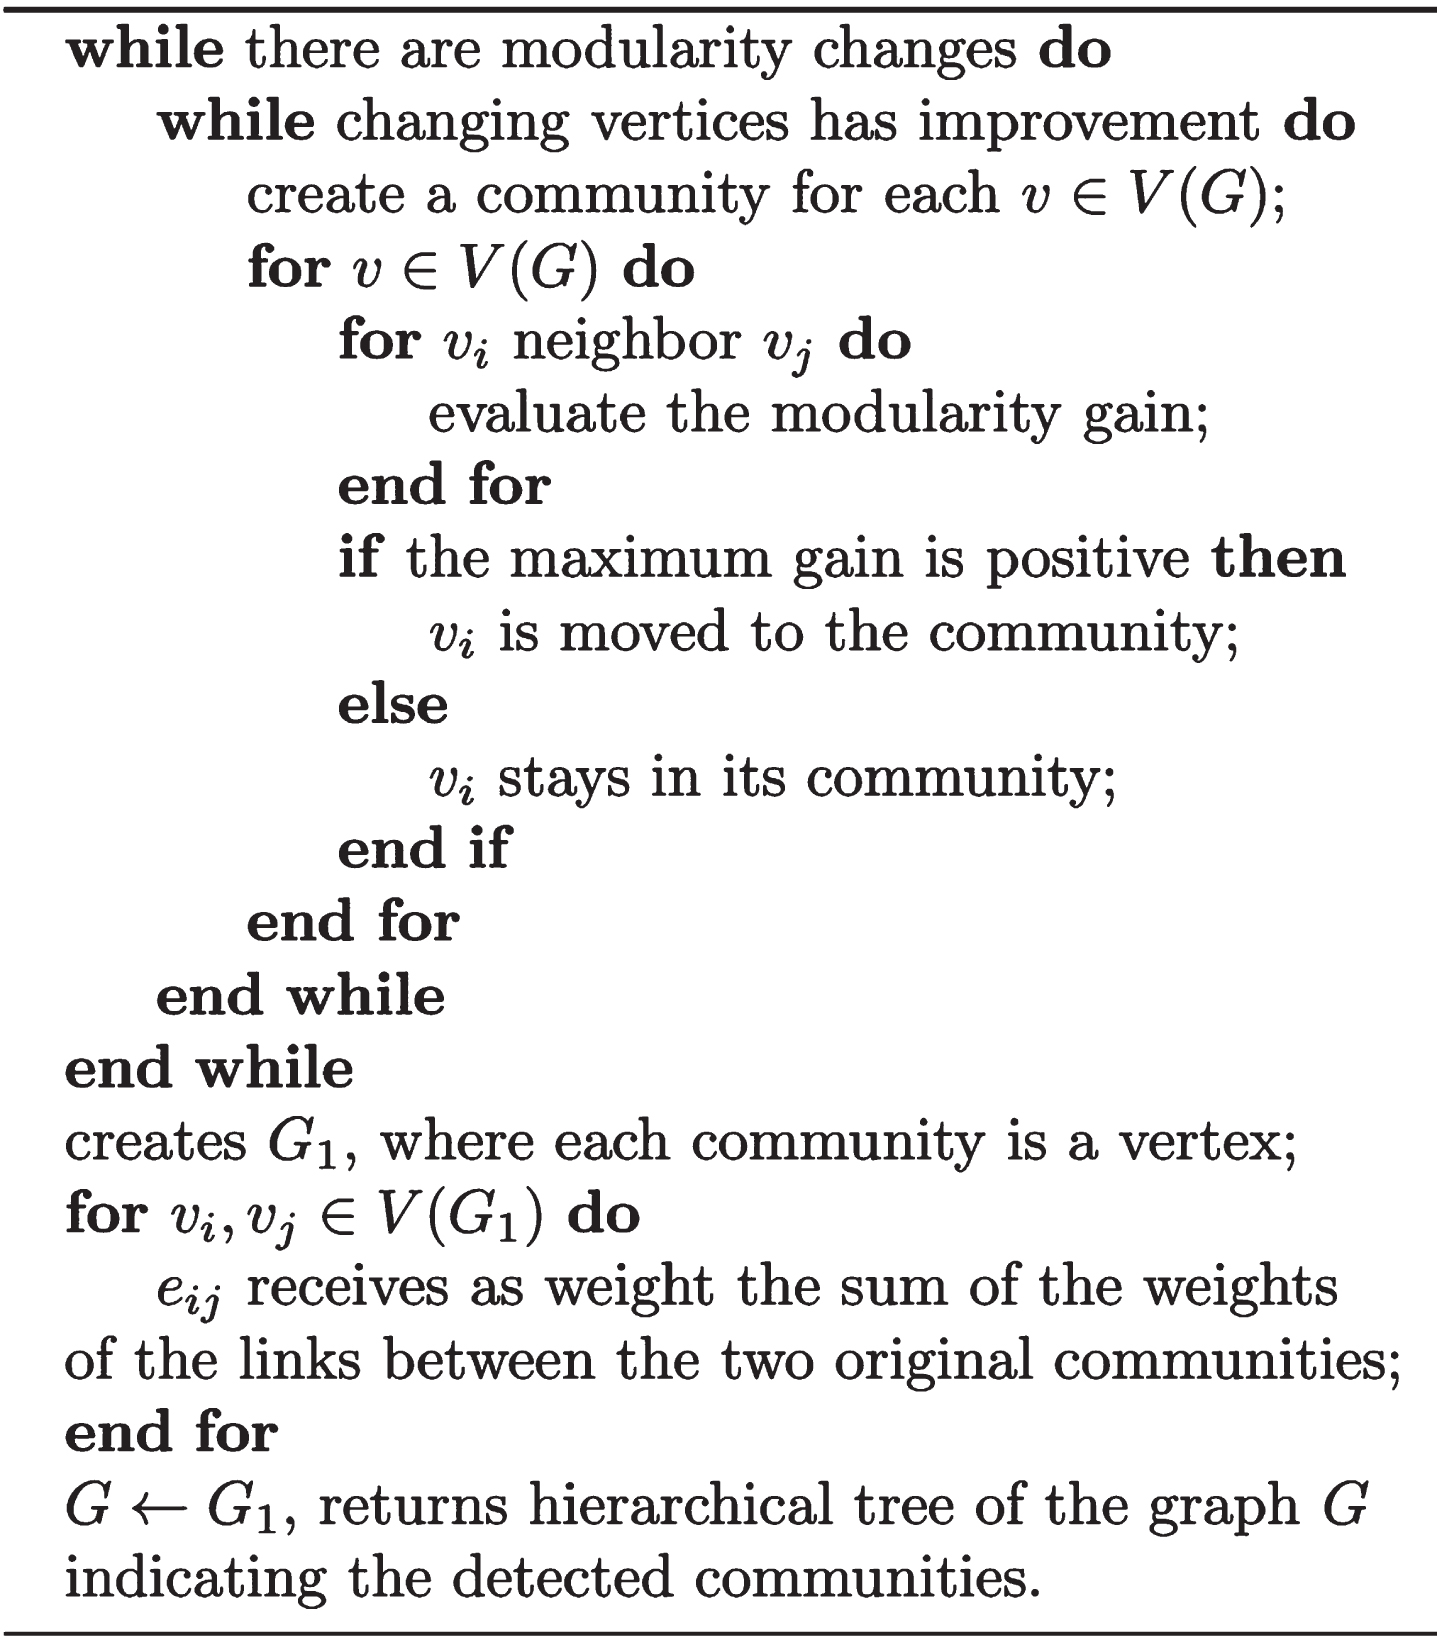
The Louvain method is a heuristic algorithm based on Q-modularity optimization. It can also be considered a clustering method of agglomerative nature, having as input of the algorithm a network of n vertices. This algorithm in turn is divided into two well-defined phases. In the first phase, each vertex is considered a community, and for each vertex i, each of its j neighbors is considered, evaluating the modularity gain if vertex i were removed from its community and placed in the community of its neighbor j.
At the end of the evaluation of all its neighbors, vertex i is placed in the community with the highest gain, but only if the gain is positive, otherwise it remains in its community. The process is repeated until each vertex is in the community with the highest gain [58]. In Fig. 4 the pseudocode of the Louvain community detection is presented, and it is possible to observe each phase of this approach.
In this work a computer with an i5-7600K processor and 24GB of random access memory (RAM) was used. All simulations were performed from processing using the central processing unit (CPU). The models were evaluated using the Python language.
Fig. 4
Pseudocode of the Louvain algorithm.
4Analysis of results and discussion
In this section the results of the analysis of the use of the proposed approach are presented. For this evaluation, a new network is built where the vertices are the communities found previously. All nodes that belong to the same community are merged into one large vertex. The edges connecting these vertices are the same edges that connected the communities to each other. At this stage edges are also created that go out and come back to the same vertex (loops), these in turn have the weight of the sum of all edges within the communities before being transformed into a single large vertex. This process is repeated until the highest degree of modularity is obtained based on the Algorithm presented in Fig. 4.
Table 5 shows the communities generated in the complex networks TA, TP, CP, and E after processing the Louvain community detection algorithm, where you can see the number of communities generated for each network.
Table 5
Communities detected with Louvain.
| Complex network | Number of communities |
| Target proteins | 495 |
| Carrier proteins | 25 |
| Transport proteins | 44 |
| Enzymes | 74 |
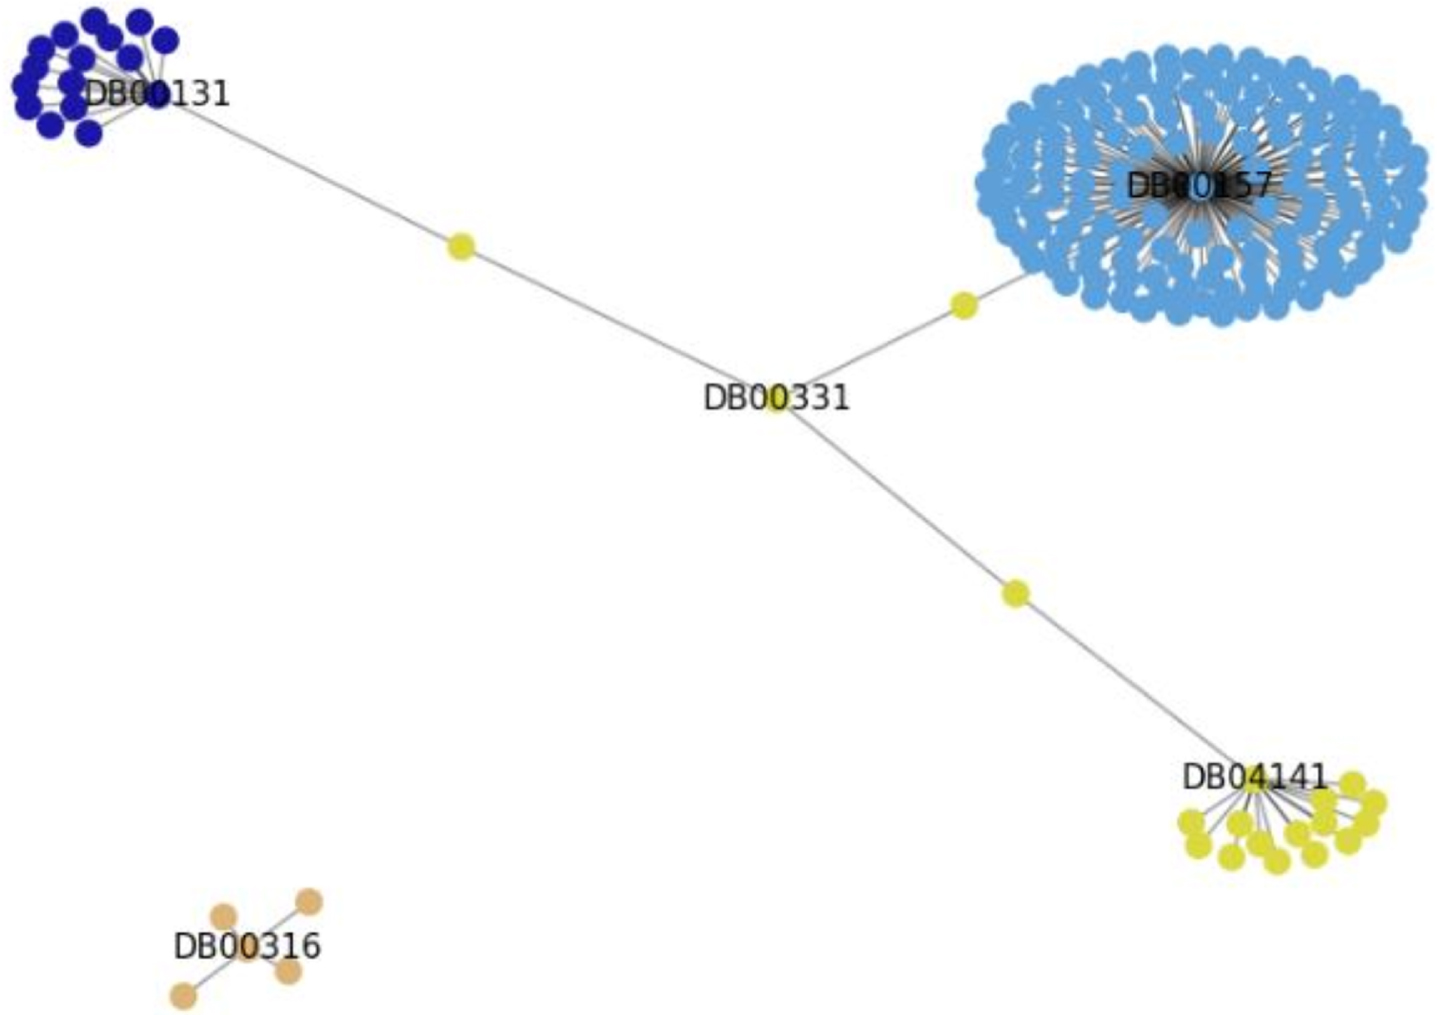
Figure 5 shows the exemplification of the communities generated by the Louvain method, and it is possible to visualize the links between the drugs that have proteins in common with the drug Metformin (DB0331), and Paracetamol (DB00316) that has no links with the mentioned proteins.
It can be noted that the drug (DB00157) has links with several APs, and for this reason it has created a community for itself. The drugs DB04141 and DB00331 are part of the same community. The drug DB00131 was also isolated in its community, and the drug DB00316, for not having any links with the others, is part of its own community.
Fig. 5
Communities generated by the Louvain method.
Another option for community generation is the Girvan-Newman algorithm [57], which is considered a splitting algorithm, i.e., the edges are removed progressively. The algorithm is based on the edges called “betweenness,” which are the edges present within the communities. The betweenness is identified from minimum path calculations between pairs of vertices.
The algorithm performs the progressive removal of edges, and is divided into four steps: (a) calculate the betweenness for all edges in the network; b) the edge with the highest betweenness is removed from the network; c) the betweenness calculation is redone for all edges that might be affected by the removal; d) step “b” is repeated until there are no more edges.
The algorithm presents as a result a hierarchical tree (dendrogram), which is a tree started in a general community, being the network complex, which grows with the progression of edges removals. Table 6 shows the result of the communities generated after applying the Girvan-Newman algorithm to the complex networks TA, TP, CP, and E. In it, one can observe the complex network and the number of communities identified.
Table 6
Communities detected with Girvan.
| Complex network | Number of communities |
| Target proteins | 449 |
| Carrier proteins | 16 |
| Transport proteins | 30 |
| Enzymes | 58 |
The communities generated by the Girvan-Newman algorithm can be visualized in Fig. 6. The links between the drugs that have the proteins in common with the drug Metformin (DB0331), and Paracetamol (DB00316) that has no links with the mentioned proteins. Each color means a community.
Fig. 6
Example of communities detected for the drug Metformin.
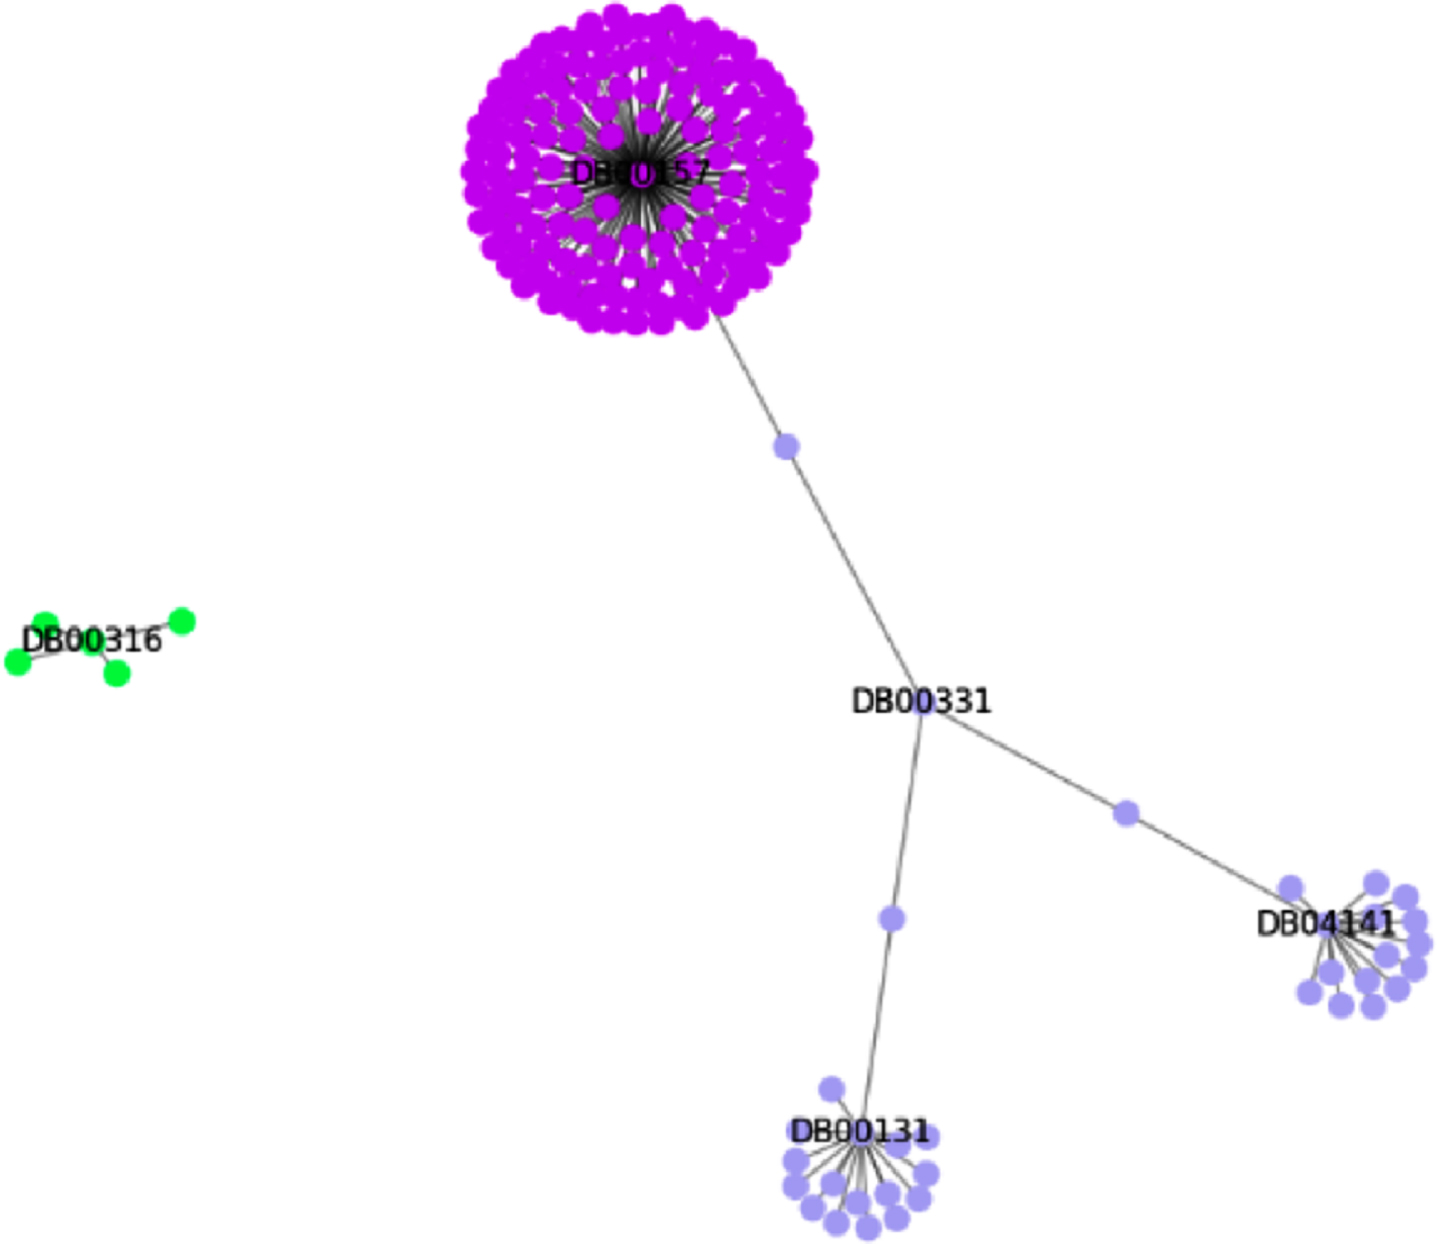
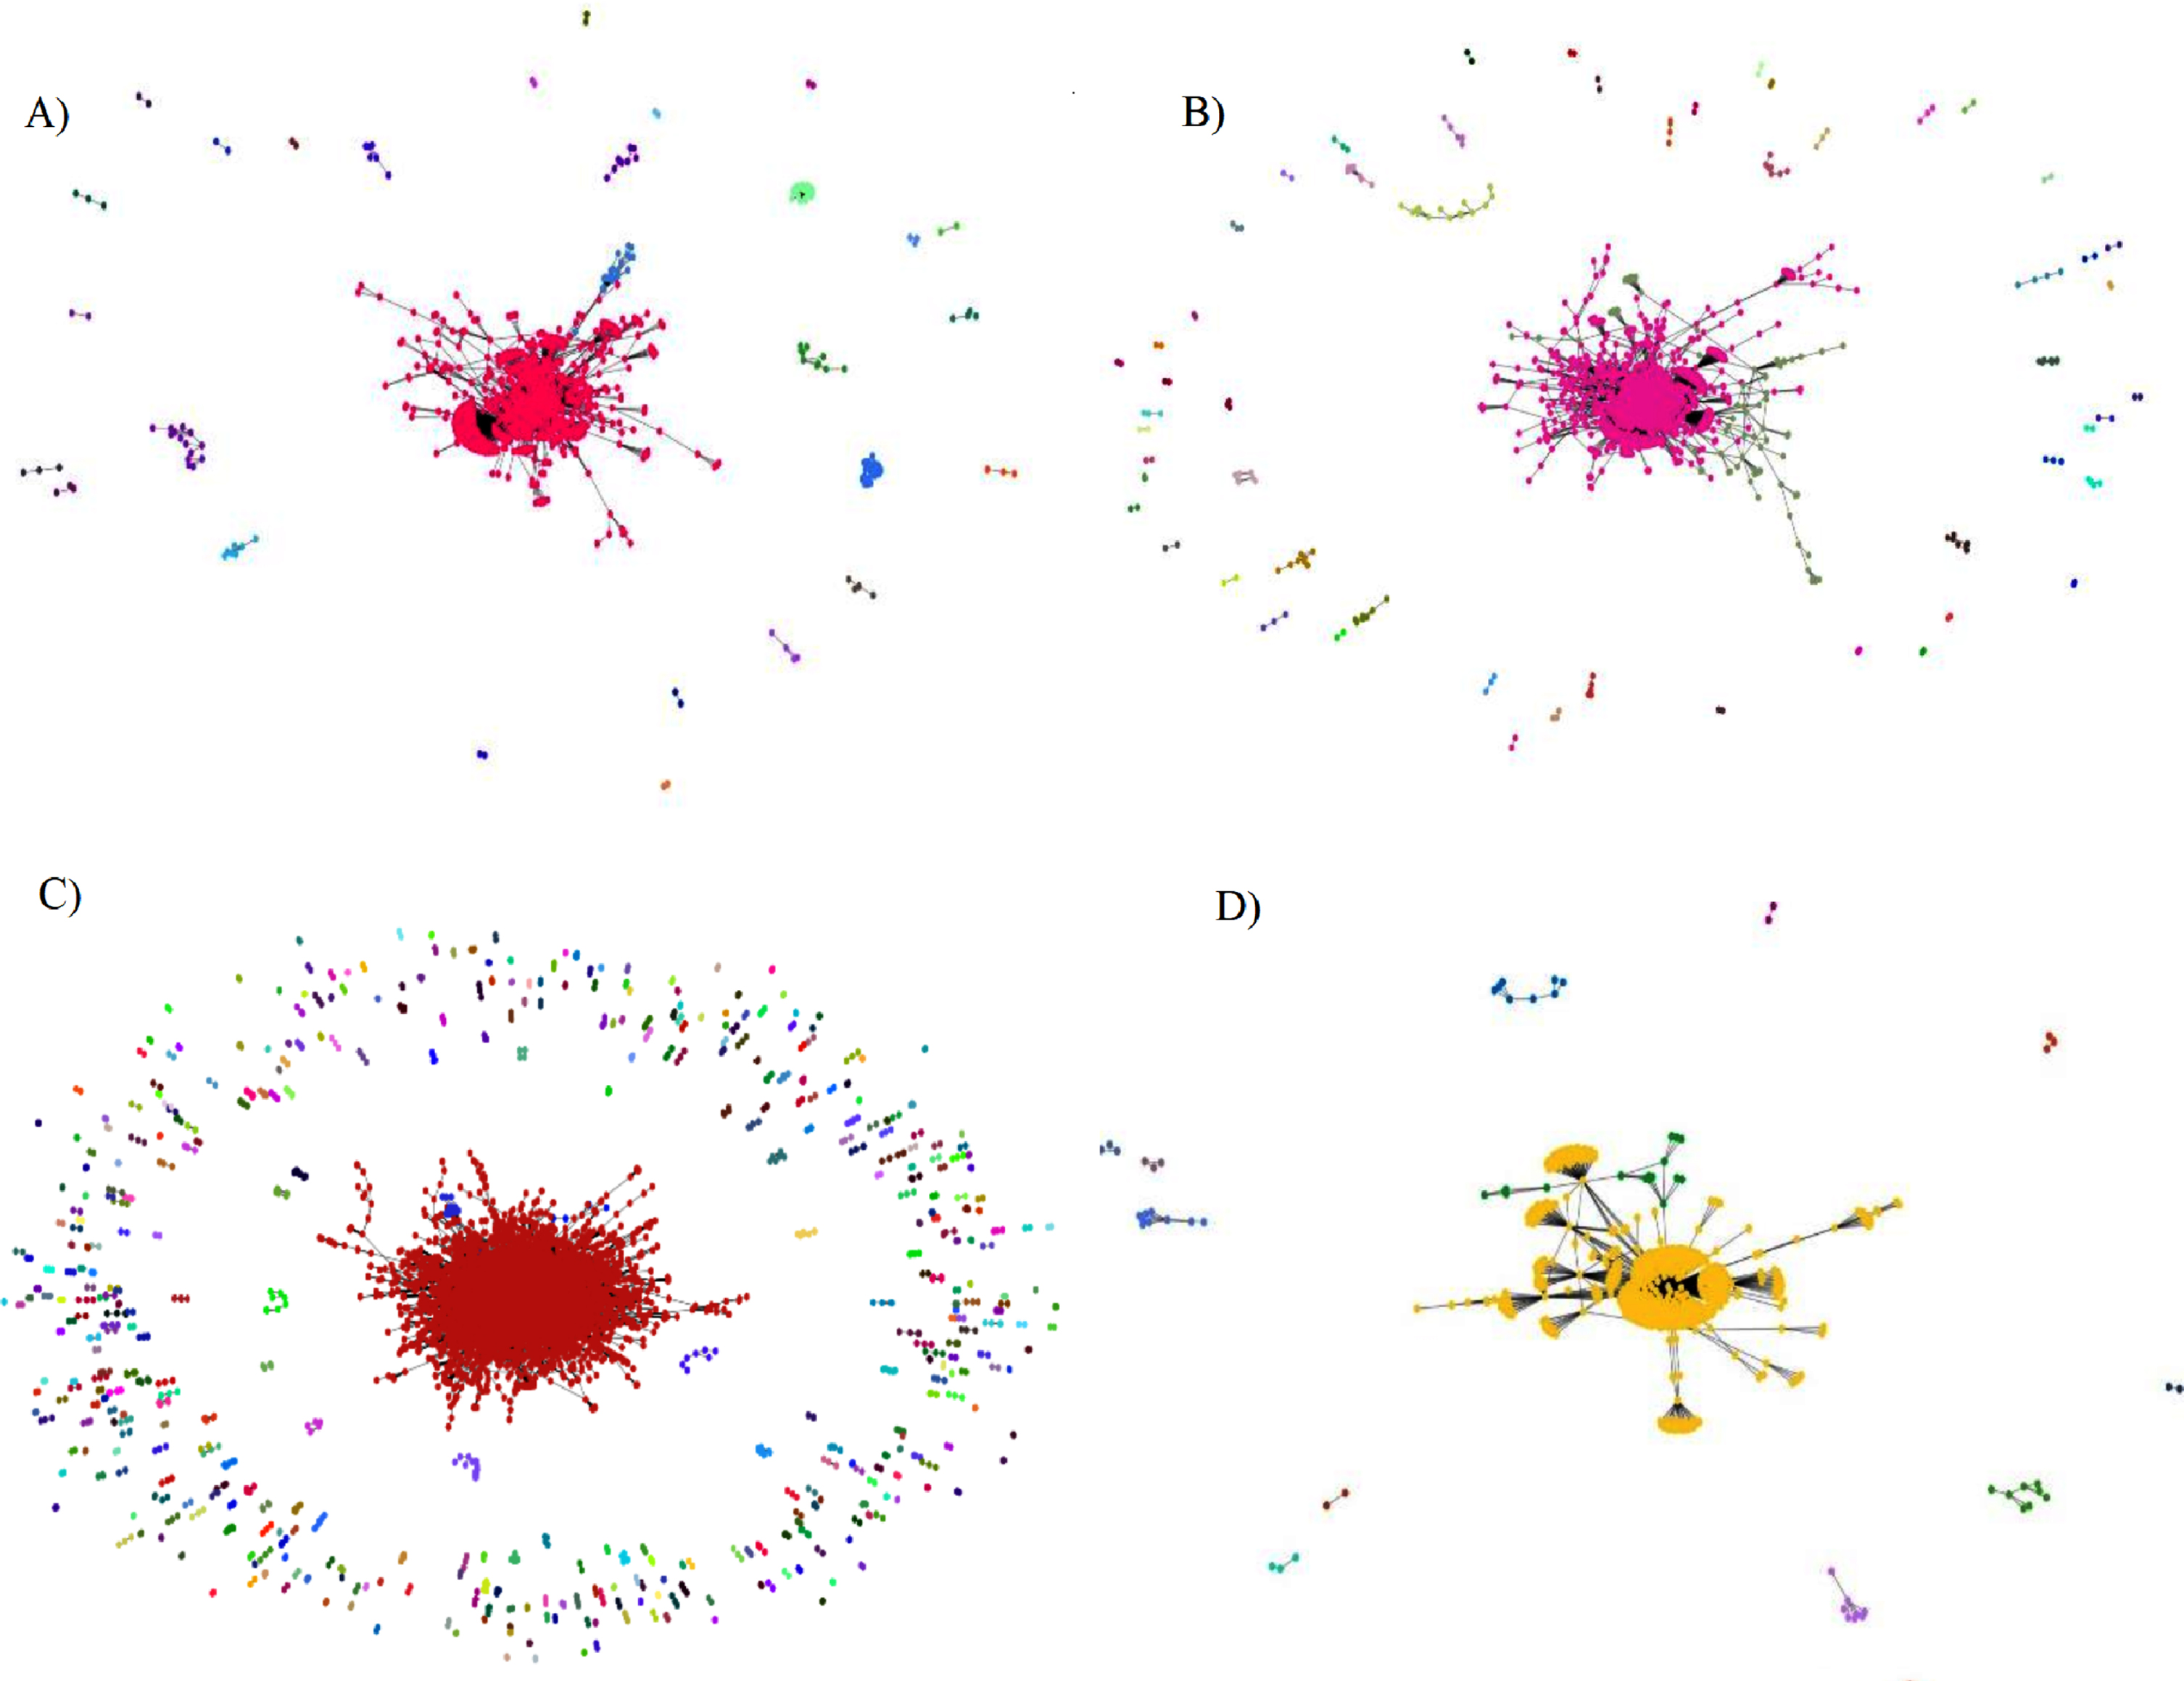
Fig. 7
Complex networks and their communities by the Girvan-Newman algorithm.
It can be noted that the drug (DB00157) has links with several TAs, and for this reason it created a community for itself, since the analysis occurred from these five drugs separately. Drugs DB04141, DB00331 and DB00131 are part of the same community, while drug DB00316 has no links with the others and is isolated in its own community.
Figure 7 item (A) demonstrates the complex transport proteins graph generated by the Girvan-Newman algorithm, containing 1,300 vertices and 3,132 edges. In item (B) is shown the enzymes graph, containing 2,170 vertices and 5,420 edges. In item (C) is shown the target proteins graph, which in turn is the largest network, with 11,886 vertices and 20,622 edges, also having the largest communities. Item (D) shows the carrier proteins graph containing 670 vertices and 867 edges.
To evaluate the computational effort in generating graphs using the Louvain and Girvan-Newman algorithms, Table 7 presents the time required for the models to create the graph with respect to the size of the graph. In this evaluation, the Louvain method required less time to create the graphs needed to evaluate drug interactions.
Table 7
Time required to generate the graph.
| Graph | Number of nodes / edges | Method | Time (s) |
| A | 1,300 / 3,132 | Louvain | 0.83 |
| Girvan-Newman | 35.06 | ||
| B | 2,170 / 5,420 | Louvain | 1.78 |
| Girvan-Newman | 162.21 | ||
| C | 11,886 / 20,622 | Louvain | 20.59 |
| Girvan-Newman | 5,860.33 | ||
| D | 670 / 867 | Louvain | 0.37 |
| Girvan-Newman | 2.38 |
Fig. 8
Extended communities of the TP network.
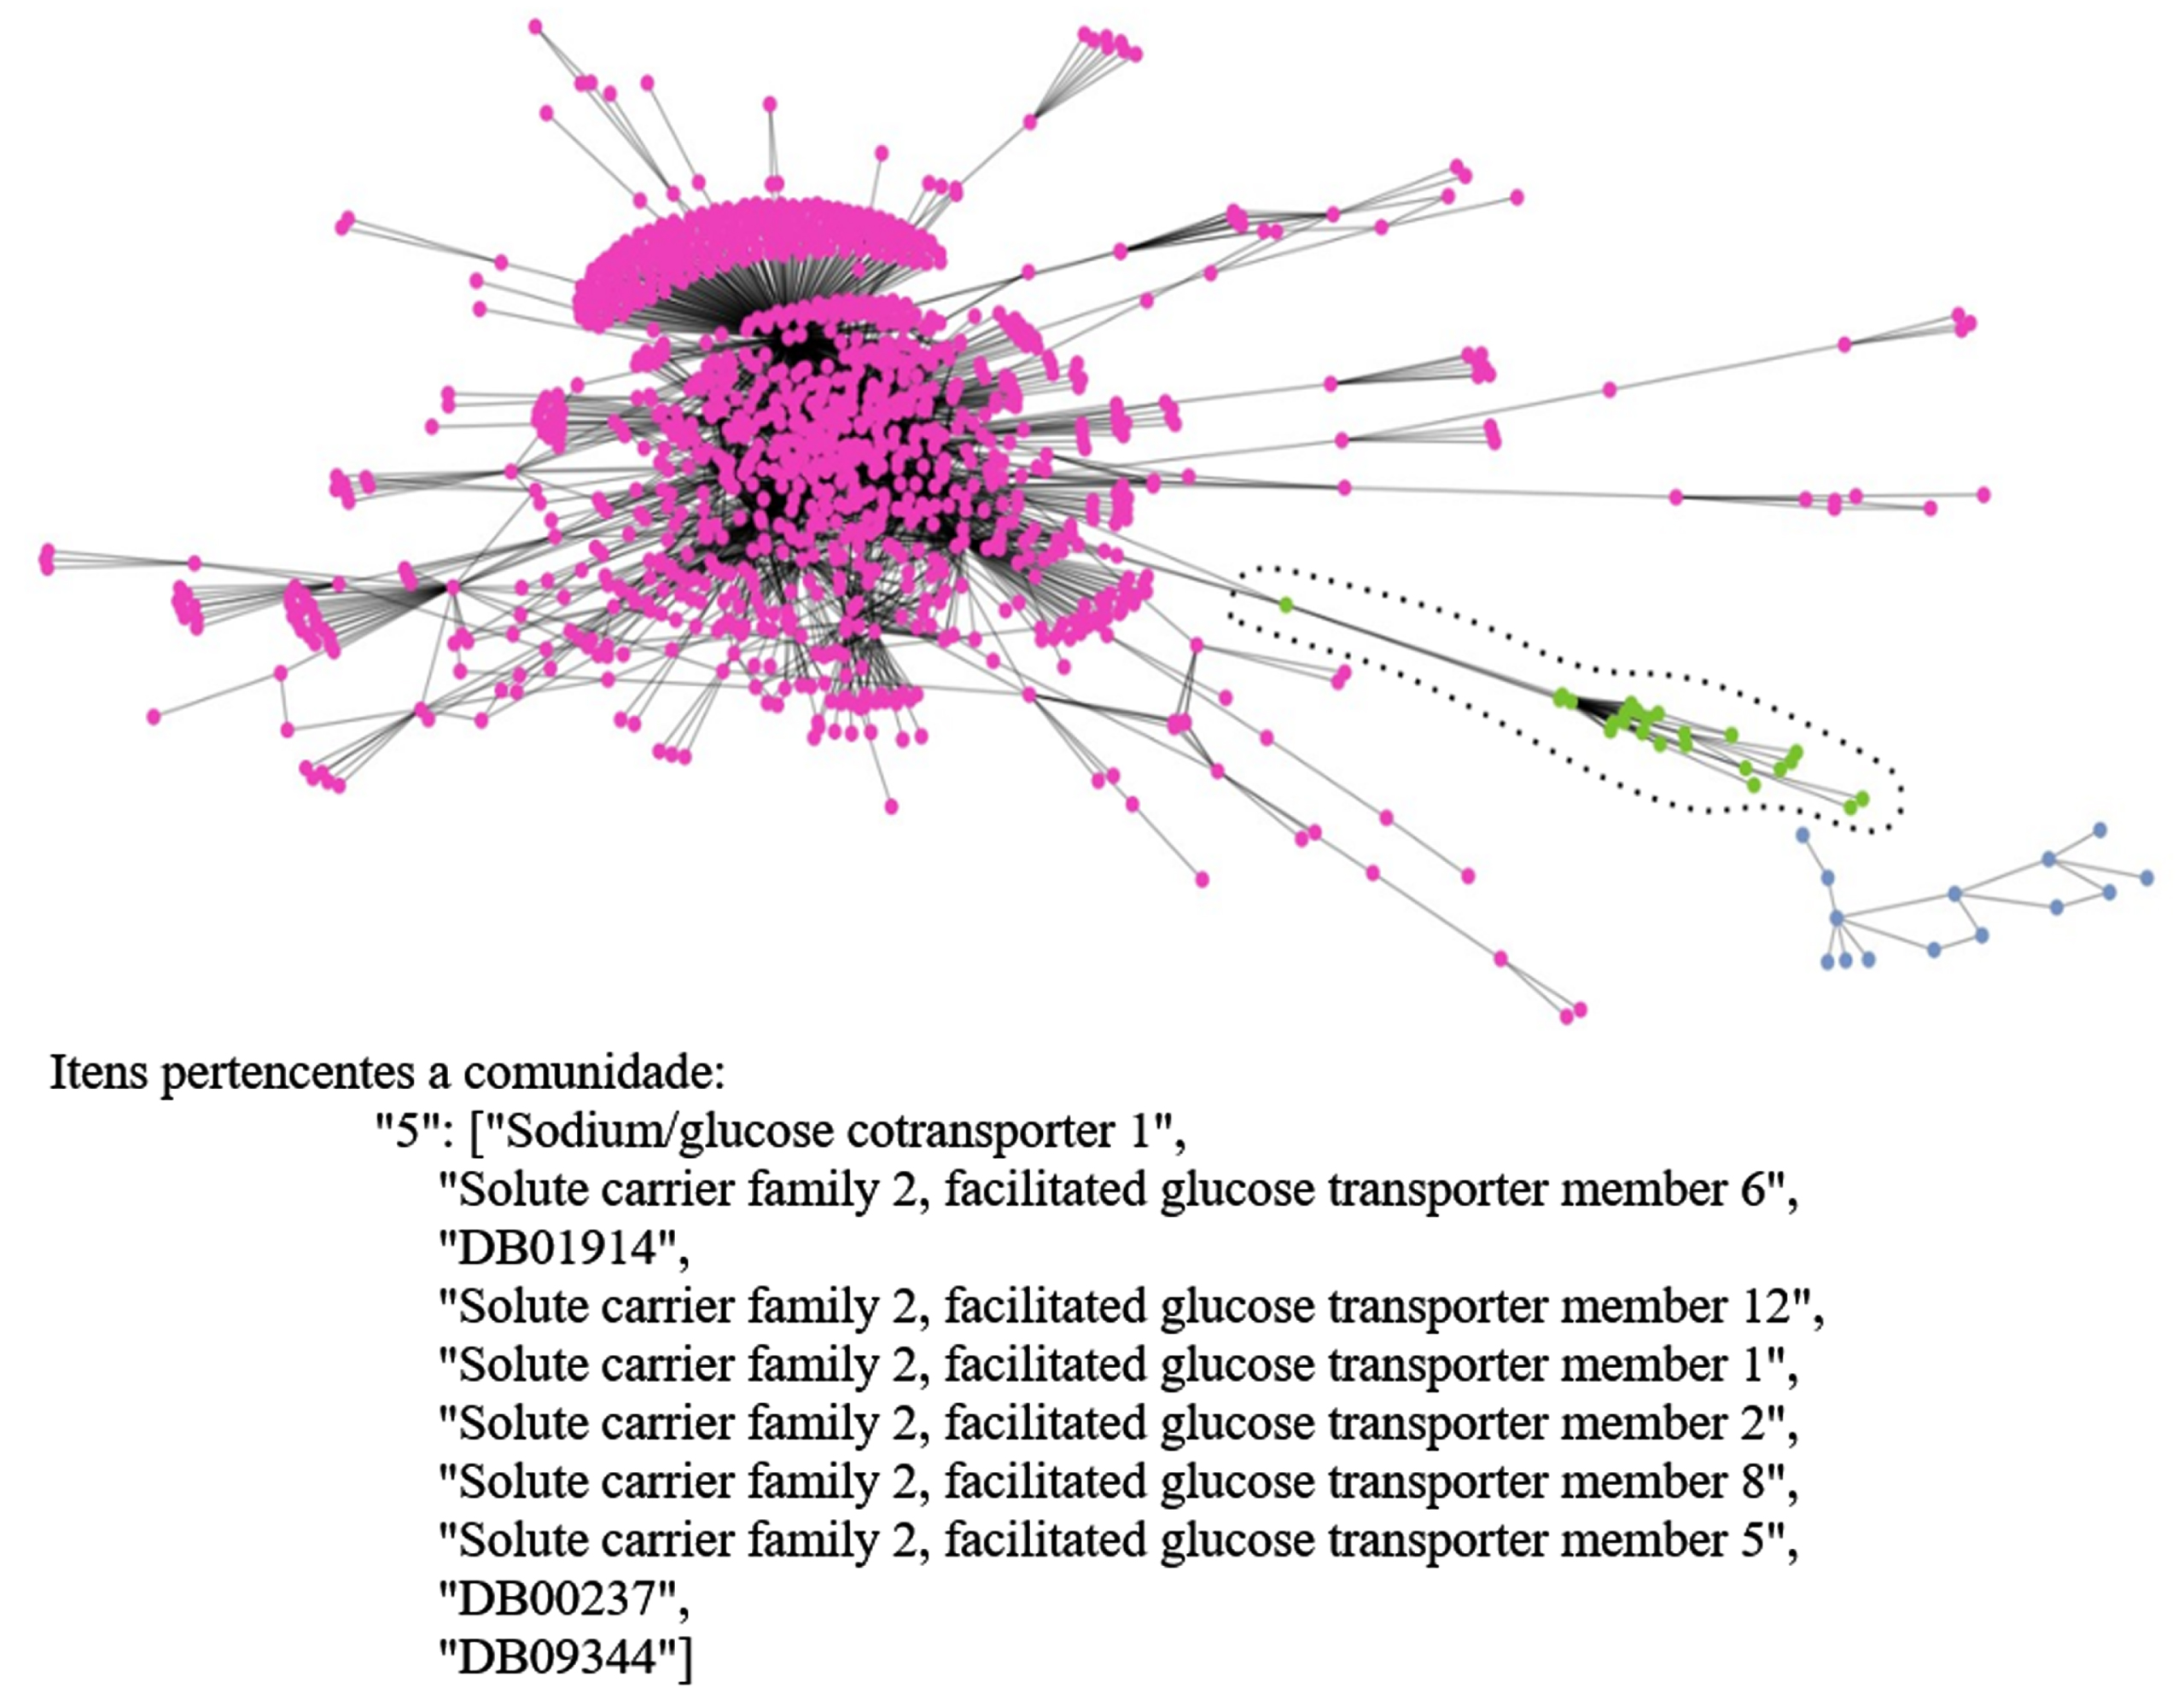
Based on the communities obtained by the detection algorithms, one can then proceed to the validation phase of the interactions within the communities. This, in turn, consists of two steps, (i) from a set of drugs to be validated, the communities that each drug in this set belongs to is obtained, (ii) from a second set of drugs, each drug is verified if it is present in any community of the first step, if the drug is included in the same community an DI between the two drugs is then noted. In Fig. 8, an extended example of some communities detected by the Girvan-Nerwman algorithm and the items belonging to a community in the TP network is shown.
After analyzing and validating the interactions belonging to the generated communities, it can be observed from Table 8 that the Girvan-Newman algorithm was able to identify a greater amount of drug interactions compared to the Louvain algorithm. In it, one can observe the quantity of interactions identified in each complex network. The drug interactions between 10 drugs for type 2 diabetes, with 10 drugs for anxiety and another 10 of antibiotics were analyzed.
Table 8
DIs identified by the algorithms for each set of drugs.
| Complex network | Interac. ident. by Louvain | Interact. identif. by Girvan-Newman | |
| Diabetes | Target Proteins | 5 | 90 |
| X | Carrier proteins | 17 | 40 |
| Anxiety | Transport proteins | 7 | 72 |
| Enzymes | 11 | 63 | |
| Diabetes | Target Proteins | 0 | 27 |
| X | Carrier proteins | 21 | 24 |
| Antibiotics | Transport proteins | 11 | 56 |
| Enzymes | 9 | 35 | |
Table 11
Statistical evaluation of the models.
| Algorithm | Measure | Min | Max | Mean | Median | Std. Dev. | Variance |
| População | 0.98602 | 0.99224 | 0.98940 | 0.98921 | 1.31×10⁻³ | 1.72×10⁻⁶ | |
| Louvain | Influância | 0.98602 | 0.99224 | 0.98940 | 0.98921 | 1.31×10⁻³ | 1.72×10⁻⁶ |
| Centralidade | 0.98602 | 0.99224 | 0.98940 | 0.98921 | 1.31×10⁻³ | 1.72×10⁻⁶ | |
| População | 0.98602 | 0.99224 | 0.98940 | 0.98921 | 1.31×10⁻³ | 1.72×10⁻⁶ | |
| Girvan-Newman | Influância | 0.98602 | 0.99224 | 0.98940 | 0.98921 | 1.31×10⁻³ | 1.72×10⁻⁶ |
| Centralidade | 0.98602 | 0.99224 | 0.98940 | 0.98921 | 1.31×10⁻³ | 1.72×10⁻⁶ |
The results were validated from the websites (2) and (3). Positive results were defined as those interactions that were present in at least one of the cited sites and that contained some bibliographic reference talking about the possible DIs with the two validated drugs.
Evaluating the results of the two algorithms, it can be seen that the Girvan-Newman algorithm presented a large number of DIs compared to the Louvain algorithm. Table 9 shows the hit percentages of the algorithms for each set of drugs. It can be seen that the results in terms of percentages are similar, however, Girvan was able to structure the communities in a way that allows the detection of more positive DIs than the Louvain structure.
Table 9
Percentage of positive DIs for each network.
| Complex network | Positive DIs with Louvain | Positive DIs with Girvan-Newman | |
| Diabetes | Target Proteins | 60.00% | 74.44% |
| X | Carrier proteins | 76.47% | 82.50% |
| Anxiety | Transport proteins | 28.60% | 83.33% |
| Enzymes | 81.81% | 77.78% | |
| Diabetes | Target Proteins | - | 62.96% |
| X | Carrier proteins | 61.90% | 66.66% |
| Antibiotics | Transport proteins | 45.45% | 60.71% |
| Enzymes | 66.66% | 71.43% | |
In addition to the interactions verified from the links within the communities, one can perform some metrics on the centrality of the modeled networks. Table 10 demonstrates the protein with the highest results of the metrics used, which in turn were: popularity, influence, centrality, and bridging between communities.
Table 10
Metrics about the complex network.
| Protein | Popul. | Influen. | Central. | Bridge between communities |
| Serum albumin | 0.59 | 0.67 | 0.56 | 0.79 |
From these results, one can evaluate in the context of the network, which proteins are more likely to have some kind of drug interaction, so these proteins are linked to several drugs. The popularity metric aims to find the vertex with the highest degree in the network. In this aspect, it can be observed that the protein has several drugs that bind to it. Also in relation to the degree of the protein, with the result of the influence, it is noted that besides containing the highest degree, this protein is connected to other drugs that also have a high degree, that is, they are linked to several other proteins.
The network centrality metric defines whether a vertex is close to all other vertices in the network. In this sense, the protein showed a low centrality value. On the other hand, in the bridge between communities metric, the protein showed a high value, i.e., the protein is linked to several other communities, thus being able to interact with other proteins.
5Conclusion
The identification of drug interactions is an important process to avoid and mitigate possible adverse drug reactions, which can often worsen a patient’s clinical condition. Aiming to identify these interactions, this work presented the use of complex networks for analysis and validation of drug interactions. To do this, it used databases made available by DrugBank that contain information about drugs, as well as information about several proteins and enzymes in the human body. These, in turn, went through the process of data selection, obtaining only the information relevant to the modeling of complex networks.
The work was developed using the Python programming language, as well as NetworkX, the main library used for modeling and analyzing complex networks. Two native NetworkX algorithms named Louvain and Girvan-Newman were used to detect the network communities. During the project, only drugs focused on the treatment of type 2 diabetes were used for validation, being tested with other drugs for anxiety and antibiotics, thus forming two sets: diabetes and anxiety; and diabetes and antibiotics. It is emphasized that this limitation in scope was done to facilitate validations of the identified interactions.
The results were validated on the DrugBank and Drugs.com platforms, and were considered positive when articles referencing such interactions were present or presented. Good results were obtained for the identification of validated sets of drugs, considering that, overall, 371 validated interactions were found within the communities detected by the Grivan-Newman algorithm, and 58 validated interactions within the Louvain algorithm communities.
Finally, it should be noted that this work was limited to only the detection and analysis of the communities of the complex networks modeled within the context of the work: (i) the use of more metrics for the identification of drug interactions, in addition to the analysis of interactions within the communities, (ii) inclusion of other databases, containing protein-protein interactions, thus increasing the ascertainment of biochemical and physiological changes, thus being able to ascertain drug-protein-protein interactions, (iii) inclusion of more databases with drug-protein interactions, (iv) availability of a graphical interface to facilitate the visualization of interactions, as well as tools for analyzing the veracity of the results.
In future work, other models could be used to evaluate the probability of connections between samples, highlighted are graph convolutional networks (GCNs), graph attention networks (GATs) which uses the attention mechanism, possibly been superior to standard GNN methods.
Acknowledgment
This work was supported by the Fundação para a Ciência e a Tecnologia, I. P. (Portuguese Foundation for Science and Technology) by the Project “VALORIZA-Research Center for Endogenous Resource Valorization,” under Grant UIDB/05064/2020; and in part by the Fundação para a Ciência e a Tecnologia under Project UIDB/04111/2020.
References
[1] | Holloway K. and Dijk L.V. , The world medicines situation 2011: Rational use of medicines (2022). |
[2] | Mahmood Karimy , Majed Rezaee-Momtaz , Mahmoud Tavousi and Ali Montazeriand Marzieh Araban , Risk factors associated with self-medicationamong women in Iran, BMC Public Health 19: (1) ((2019) ), 1–7. |
[3] | Sirimas Sudsakorn , Praveen Bahadduri , Jennifer Fretland and Chuang Lu , FDA drug–drug interaction guidance: a comparison analysis and action plan by pharmaceutical industrial scientists, Current Drug Metabolism 21: (6) ((2020) ), 403–426. |
[4] | Sehn R. , Camargo A.L. , Heineck I. and Ferreira M.B.C. , Interacoes medicamentosas potenciais em prescricoes de pacientes hospitalizados, Infarma 15: (9–10) ((2003) ), 77–81. |
[5] | Palleria C. , Di Paolo A. , Giofre C. , Caglioti C. , Leuzzi G. , Siniscalchi A. , De Sarro G. and Gallelli L. , Pharmacokinetic drug-drug interaction and their implication in clinical management, Journal of Research in Medical Sciences: The Official Journal of Isfahan University of Medical Sciences 18: (7) ((2013) ), 601. |
[6] | Safdari R. , Ferdousi R. , Aziziheris K. , Niakan-Kalhori S.R. and Omidi Y. , Computerized techniques pave the way for drugdrug interactionprediction and interpretation, BioImpacts: BI 6: (2) ((2016) ), 71. |
[7] | Thakrar B.T. , Grundschober S.B. and Doessegger L. , Detecting signalsof drug–drug interactions in a spontaneous reports database, British Journal of Clinical Pharmacology 64: (4) ((2007) ), 489–495. |
[8] | Xie Y. , Huang L. , Kong Y. , Wang S. , Xu S. , Wang X. and Ren J. , Virtualized network function forwarding graph placing in sdn andnfv-enabled iot networks: A graph neural network assisted deep reinforcement learning method, IEEE Transactions on Network and Service Management 19: (1) ((2022) ), 524–537. |
[9] | Wei C. , Fan Y. and Zhang J. , High-order social graph neural network for service recommendation, IEEE Transactions on Network and Service Management, 2022, pp. 1–1. |
[10] | Jia S. , Gao L. , Gao Y. , Nastos J. , Wen X. , Zhang X. and Wang H. , Exploring triad-rich substructures by graph-theoretic characterizations in complex networks, Physica A: Statistical Mechanics and its Applications 468: ((2017) ), 53–69. |
[11] | Zerwas J. , Kalmbach P. , Schmid S. and Blenk A. , Ismael: Using machine learning to predict acceptance of virtual clusters in datacenters, IEEE Transactions on Network and Service Management 16: (3) ((2019) ), 950–964. |
[12] | Yu K. , Jiang H. , Li T. , Han S. and Wu X. , Data fusion oriented graph convolution network model for rumor detection, IEEE Transactions on Network and Service Management 17: (4) ((2020) ), 2171–2181. |
[13] | Zhao X. and Wu C. , Large-scale machine learning cluster scheduling via multi-agent graph reinforcement learning, IEEE Transactions on Network and Service Management, 2021, pp. 1–1. |
[14] | Krishnamurthy P. , Khorrami F. , Schmidt S. and Wright K. , Machine learning for net flow anomaly detection with humanreadable annotations, IEEE Transactions on Network and Service Management 18: (2) ((2021) ), 1885–1898. |
[15] | Wei X. , Gao S. , Huang T. , Bompard E. , Pi R. and Wang T. , Complex network-based cascading faults graph for the analysis of transmission network vulnerability, IEEE Transactions on Industrial Informatics 15: (3) ((2019) ), 1265–1276. |
[16] | Hu B. , Guo K. , Wang X. , Zhang J. and Zhou D. , Rrlgat: Graph attention network-driven multilabel image robust representation learning, IEEE Internet of Things Journal 9: (12) ((2022) ), 9167–9178. |
[17] | Yong Liu , Susen Yang , Yonghui Xu , Chunyan Miao , Min Wu and Juyong Zhang , Contextualized graph attention network for recommendation with item knowledge graph, IEEE Transactions on Knowledge and Data Engineering 35: (1) ((2021) ), 181–195. |
[18] | Yoon S. , Cho J.-H. , Kim D.S. , Moore T.J. , Free-Nelson F. and Lim H. , Attack graph-based moving target defense in software defined networks, IEEE Transactions on Network and Service Management 17: (3) ((2020) ), 1653–1668. |
[19] | Huang Z. , Du X. , Chen L. , Li Y. , Liu M. , Chou Y. and Jin L. , Convolutional neural network based on complex networks for brain tumor image classification with a modified activation function, IEEE Access 8: ((2020) ), 89281–89290. |
[20] | Yan B. , Wang G. , Yu J. , Jin X. and Zhang H. , Spatial-temporal chebyshev graph neural network for traffic flow prediction iniot-based its, IEEE Internet of Things Journal 9: (12) ((2022) ), 9266–9279. |
[21] | Yong Zou , Reik Donner V , Norbert Marwan , Jonathan Donges F and Jurgen Kurths , Complex network approaches to nonlinear time seriesanalysis, Physics Reports 787: ((2019) ), 1–97. |
[22] | Chaobo He , Xiang Fei , Qiwei Cheng , Hanchao Li , Zeng Hu and Yong Tang , A survey of community detection in complex networks using nonnegative matrix factorization, IEEE Transactions on Computational Social Systems (2021). |
[23] | Christian Messier , Jurgen Bauhus , Frederik Doyon , Fanny Maure , RitaSousa-Silva , Philippe Nolet , Marco Mina , Nuria Aquilue , Marie-JoseeFortin and Klaus Puettmann , The functional complex network approachto foster forest resilience to global changes, Forest Ecosystems 6: (1) ((2019) ), 1–16. |
[24] | Chaitra N. , Vijaya P.A. and Gopikrishna Deshpande , Diagnostic prediction of autism spectrum disorder using complex network measures in a machine learning framework, Biomedical Signal Processing and Control 62: ((2020) ), 102099. |
[25] | Tao Wen and Yong Deng , The vulnerability of communities in complex networks: An entropy approach, Reliability Engineering & System Safety 196: ((2020) ), 106782. |
[26] | Hammes J.A. , Pfuetzenreiter F. , da Silveira F. , Koenig A. and Westphal G.A. , Prevalencia de potenciais interacoes medicamentosasdroga-droga em unidades de terapia intensiva, Revista Brasileira de Terapia Intensiva 20: ((2008) ), 349–354. |
[27] | Leao D.F.L. , de Moura C.S. and de Medeiros D.S. , Avaliacao deinteracoes medicamentosas potenciais em prescricoes da atencaoprimaria de vitoria da conquista (ba), Brasil, Ciencia & SaudeColetiva 19: ((2014) ), 311–318. |
[28] | Cheng F. , Kovacs I.A. and Barabasi A.-L. , Network-based predictionof drug combinations, Nature Communications 10: (1) ((2019) ), 1–11. |
[29] | Alaimo S. , Bonnici V. , Cancemi D. , Ferro A. , Giugno R. and Pulvirenti A. , Dt-web: a web-based application for drug-target interaction and drug combination prediction through domaintuned network-based inference, BMC Systems Biology 9: (3) ((2015) ), 1–11. |
[30] | Huang J. , Niu C. , Green C.D. , Yang L. , Mei H. and Han J.-D.J. , Systematic prediction of pharmacodynamic drug–drug interactions through protein–protein-interaction network, PLoS Computational Biology 9: (3) ((2013) ), e1002998. |
[31] | Oga S. , Basile A.C. and Carvalho M.F. , Guia zanini-oga de interacoes medicamentosas. In Guia Zanini-Oga de interacoes medicamentosas, 2002, pp. 390–390. |
[32] | Brunton L.L. , Lazo J.S. and Parker K.L. , Goodman & gilman: As bases farmacologicas da terapeutica. In Goodman & Gilman: as bases farmacologicas da terapeutica, 2006, pp. 1819–1819. |
[33] | Pereira D.G. , Importancia do metabolismo no planejamento defarmacos, Quimica Nova 30: ((2007) ), 171–177. |
[34] | Bueno C.S. , Oliveira K.R. , Berlezi E.M. , Eickhoff H.M. , Dallepiane L.B. , Girardon-Perlini N.M.O. and Mafalda A. , Utilizacao demedicamentos e risco de interacoes medicamentosas em idososatendidos pelo programa de atencao ao idoso da unijui, Revistade Ciencias Farmaceuticas Basica e Aplicada 30: (3) ((2009) ). |
[35] | Secoli S.R. , Polifarmacia: interacoes e reacoes adversas no uso demedicamentos por idosos, Revista Brasileira de Enfermagem 63: ((2010) ), 136–140. |
[36] | Stefenon S.F. , Ribeiro M.H.D.M. , Nied A. , Yow K.-C. , Mariani V.C. , Coelho L.S. and Seman L.O. , Time series forecasting using ensemble learning methods for emergency prevention in hydroelectric power plants with dam, Electric Power Systems Research 202: (2022), 107584. |
[37] | Branco N.W. , Cavalca M.S.M. , Stefenon S.F. and Leithardt V.R.Q. , Wavelet lstm for fault forecasting in electrical power grids, Sensors 22: (21) ((2022) ), 8323. |
[38] | Stefenon S.F. , Kasburg C. , Freire R.Z. , Silva Ferreira F.C. , Bertol D.W. and Nied A. , Photovoltaic power forecasting using wavelet neuro-fuzzy for active solar trackers, Journal of Intelligent & Fuzzy Systems 40: (1) ((1083) ), 1096. |
[39] | Stefenon S.F. , Seman L.O. , Schutel Furtado Neto A. , Nied D.M. , Seganfredo F. , Garcia da Luz P.H. , Torreblanca Gonzalezand J. and Leithardt V.R.Q. , Electric field evaluation using the finite element method and proxy models for the design of stator slots in apermanent magnet synchronous motor, Electronics 9: (11) ((2020) ), 1975. |
[40] | Corso M.P. , Perez F.L. , Stefenon S.F. , Yow K.-C. , Ovejero R.G. and Leithardt V.R.Q. , Classification of contaminated insulators usingk-nearest neighbors based on computer vision, Computers 10: (9) ((2021) ), 112. |
[41] | Stefenon S.F. , Yow K.-C. , Nied A. and Meyer L.H. , Classification of distribution power grid structures using inception v3 deep neuralnetwork, Electrical Engineering 104: ((2022) ), 4557–4569. |
[42] | Stefenon S.F. , Singh G. , Yow K.-C. and Cimatti A. , Semiprotopnet deep neural network for the classification of defective power grid distribution structures, Sensors 22: (13) ((2022) ), 4859. |
[43] | Itajiba J.A. , Varnier C.A.C. , Cabral S.H.L. , Stefenon S.F. , Leithardt V.R.Q. , Ovejero R.G. , Nied A. and Yow K.-C. , Experimental comparison of preferential vs. common delta connections for thestar-delta starting of induction motors, Energies 14: (5) ((2021) ), 1318. |
[44] | Stefenon S.F. and Nied A. , Fem applied to evaluation of theinfluence of electric field on design of the stator slots in pmsm, IEEE Latin America Transactions 17: (04) ((2019) ), 590–596. |
[45] | Rafael Ninno Muniz , Stefano Frizzo Stefenon , William Gouvea Buratto , Ademir Nied , Luiz Henrique Meyer , Erlon Cristian Finardi , Ricardo Marino Kuhl , Jose Alberto Silva de Sa and Brigida Ramati Pereira da Rocha , Tools for measuring energy sustainability: A comparative review, Energies 13: (9) ((2020) ), 2366. |
[46] | de Carvalho A.R. and da Silva T.F.B.X. , Interacoes medicamentosas noambito hospitalar e a atuacao do farmaceutico nesse cenario, Revista Saude e Desenvolvimento 12: (13) ((2018) ), 84–101. |
[47] | Backes P. , et al. Identificacao e avaliacao de potenciais interacoes medicamentosas em prescricao de pacientes internados no hospital universitario da UFSC (2013). |
[48] | Stefenon S.F. , Bruns R. , Sartori A. , Meyer L.H. , Ovejero R.G. and Leithardt V.R.Q. , Analysis of the ultrasonic signal in polymeric contaminated insulators through ensemble learning methods, IEEEAccess 10: ((2022) ), 33980–33991. |
[49] | Medeiros A. , Sartori A. , Stefenon S.F. , Meyer L.H. and Nied A. , Comparison of artificial intelligence techniques to failure prediction in contaminated insulators based on leakage current, Journal of Intelligent & Fuzzy Systems 42: (4) ((2022) ), 3285–3298. |
[50] | Sopelsa Neto N.F. , Stefenon S.F. , Meyer L.H. , Ovejero R.G. and Leithardt V.R.Q. , Fault prediction based on leakage current in contaminated insulators using enhanced time series forecasting models, Sensors 22: (16) ((2022) ), 6121. |
[51] | Fernandes F. , Stefenon S.F. , Seman L.O. , Nied A. , Ferreira F.C.S. , Subtil M.C.M. , Klaar A.C.R. and Leithardt V.R.Q. , Long short-termmemory stacking model to predict the number of cases and deathscaused by covid-19, Journal of Intelligent & Fuzzy Systems 6: (42) ((2022) ), 6221–6234. |
[52] | Stefenon S.F. , Furtado Neto C.S. , Coelho T.S. , Nied A. , Yamaguchi C.K. and Yow K.-C. , Particle swarm optimization for design of insulators of distribution power system based on finite element method, Electrical Engineering 104: ((2022) ), 615–622. |
[53] | Vieira J.C. , Sartori A. , Stefenon S.F. , Perez F.L. , de Jesusand G.S. and Leithardt V.R.Q. , Low-cost cnn for automatic violencerecognition on embedded system, IEEE Access 10: ((2022) ), 25190–25202. |
[54] | Stefenon S.F. , Corso M.P. , Nied A. , Perez F.L. , Yow K.-C. , Gonzalez G.V. and Leithardt V.R.Q. , Classification of insulators using neural network based on computer vision, IET Generation, Transmission & Distribution 16: (6) ((2021) ), 1096–1107. |
[55] | de Oliveira J.R. , Stefenon S.F. , Klaar A.C.R. , Yamaguchi C.K. , da Silva M.P. , Salvador Bizotto B.L. , Silva Ogoshi R.C. and Gequelin E.F. , Enterprise resource planning and customer relationship management through management of the supply chain, Interciencia 43: (11) ((2018) ), 784–791. |
[56] | Mostaco-Guidolin L.C.B. , Identificacao de dominios em proteinas com redes complexas. PhD thesis, Universidade de Sao Paulo (2011). |
[57] | Girvan M. and Newman M.E.J. , Community structure in social and biological networks, Proceedings of the National Academy of Sciences 99: (12) ((2002) ), 7821–7826. |
[58] | Blondel V.D. , Guillaume J.-L. , Lambiotte R. and Lefebvre E. , Fast unfolding of communities in large networks, Journal of Statistical Mechanics: Theory and Experiment 2008: (10) ((2008) ), P10008. |

