
Impact of Concurrent Visual and Hearing Impairment on Incident Alzheimer’s Disease: The LIFE Study
Abstract
Background:
The prevalence of Alzheimer’s disease (AD) is increasing in Japan due to population aging. The association between sensory impairment and incident AD remains unclear.
Objective:
This study aimed to investigate the impact of sensory impairment on incident AD.
Methods:
We analyzed residents of five municipalities participating in the Longevity Improvement & Fair Evidence (LIFE) Study. The participants comprised individuals who had newly applied for long-term care needs certification between 2017 and 2022 and had no cognitive impairment upon application or AD diagnosis within the preceding six months. Participants were classified according to sensory impairment status: visual impairment (VI), hearing impairment (HI), neither sensory impairment (NSI), and dual sensory impairment (DSI). The month succeeding the certification application was set as the index month, and the interval from that month until AD onset was assessed. Multivariable Cox proportional hazards analysis was performed to calculate the risk of AD onset according to sensory impairment status while adjusting for sex, age, dependence level, self-reliance level, and comorbidities.
Results:
Among 14,186 participants, we identified 1,194 (8.4%) who developed AD over a median follow-up period of 22.6 months. VI and HI only were not associated with incident AD. However, DSI conferred a significantly higher risk (HR: 1.6, CI: 1.1–2.2, p = 0.008) of AD onset than NSI.
Conclusions:
Individuals with concurrent DSI have a higher risk of developing AD than those with single or NSI. Preventing and treating sensory impairment may not only improve functional outcomes, but could also help to reduce the future risk of AD.
INTRODUCTION
Alzheimer’s disease (AD) is the prevailing form of dementia, and its prevalence is expected to rise with population aging [1]. Approximately 50 million people worldwide were living with dementia in 2018, and the number is predicted to triple by 2050 [2]. The World Health Organization has estimated that AD accounts for 60–70% of all dementia cases [3]. Forecasts indicate that a new case of AD will develop every 33 seconds by 2050, resulting in almost one million new cases each year [4]. Japan is currently the world’s oldest country with over 28% of its population aged ≥65 years, and the number of people with dementia is projected to increase from 6 million in 2020 (approximately 18% of the total population) to 7 million in 2025 [5]. This means that in the not-too-distant future, one-fifth of Japan’s population will be affected by dementia. In addition, approximately 7 million Japanese people will have mild cognitive impairment, which can progress to dementia, by 2025 [6]. As a consequence, the prevention of dementia has emerged as an urgent sociomedical problem. Moreover, the prevalence of AD is expected to increase more rapidly than other dementia types, such as vascular dementia [7]. Therefore, the identification of risk factors for AD and the establishment of preventive measures have become key targets for reducing the overall burden of dementia.
Advanced age is a major risk factor for dementia, and studies have explored the effects of aging-related physical changes and diseases on cognitive decline [8–10]. Sensory impairment is one such aging-related change, and is relatively common in older adults [11, 12]. As age increases, cellular degeneration in the organ of Corti can cause sensorineural hearing impairment (HI) or presbycusis [13]. It was reported that the cognitive reduction associated with a 25 dB increase in hearing loss was equivalent to an age difference of seven years [14]. Similarly, the age-related functional deterioration of vision or presbyopia is another common phenomenon in older adults [15]. Visual impairment (VI) is mainly caused by cataracts, glaucoma, and/or macular degeneration, which are common features of aging [16]. A study found that individuals with poorer vision than 20/40 in both eyes were almost three times more likely to have cognitive impairment than those with better visual acuity [17].
Numerous studies have confirmed that VI and HI can independently affect dementia [18–22], and other studies have shown that their concurrent presentation can reduce cognitive function and increase the risk of dementia [23–27]. However, those studies had substantial heterogeneity in their applied methodology (e.g., study populations, follow-up periods, definitions of cognitive function, and measurement of sensory impairment), leading to a lack of consistency in their reported results. Furthermore, little is known about the impact of these impairments on AD, which constitutes the majority of all dementia cases. Among the few studies on sensory deficits associated with AD, one reported that various visual problems were found in AD patients [28], and another identified multiple retinal changes during the early stages of AD [29]. A review in 2018 by Swords et al. noted that both peripheral and central auditory dysfunction can be found in the early AD stages and suggested that these deficits could be used as early AD indicators [30]. Several epidemiological studies have also described an association between HI and cognitive impairment and indicated that hearing disorders may be a potentially modifiable risk factor of AD [31–33]. However, the independent and combined impact of VI and HI on AD development has yet to be clarified. Although the combined presence of these impairments may lead to further deterioration of cognitive function [23, 27], their potential impact on AD risk has not been quantified.
This study aimed to investigate the impact of single sensory impairment and dual sensory impairment (DSI) on incident AD using objectively confirmed diagnoses of VI and HI in five Japanese municipalities.
MATERIALS AND METHODS
Study design and data collection
This retrospective cohort study was conducted using 1) Basic Resident Register data, 2) long-term care (LTC) needs certification questionnaire data, 3) LTC claims data, and 4) medical care claims data. These data were provided by the Longevity Improvement & Fair Evidence (LIFE) Study, which is a multi-region database project managed by Kyushu University, Japan [34]. The LIFE Study is the only database in Japan that links medical care claims data and LTC claims data at the municipal level and is therefore highly optimized for epidemiological studies of older adults who require both medical care and LTC services. Each Japanese municipality manages a Basic Resident Register that includes resident-level information on age, sex, address, and household composition. The LTC insurance system is a public insurance scheme for older adults aged ≥65 years and adults aged 40–64 years with specific diseases who have applied for and received LTC needs certification. LTC needs are categorized into seven levels (support needs levels 1–2 and care needs levels 1–5) based on each beneficiary’s degree of physical and/or cognitive impairment [35]. LTC claims data include information on LTC service utilization and the corresponding expenditures for all individuals who are covered under this system. The LIFE Study collects medical care claims data from persons enrolled in either of Japan’s public medical care insurance systems: National Health Insurance and the Latter-Stage Older Persons Health Care System. National Health Insurance enrollees are aged ≤74 years, and include self-employed persons, unemployed persons, and primary sector workers. Latter-Stage Older Persons Health Care System enrollees include residents aged 65–74 years with specific disabilities and all residents aged ≥75 years. Medical care claims data include information on patient characteristics, recorded diagnoses, comorbidities, medical treatments, and corresponding expenditures for all individuals who received insurance-covered care in the outpatient and inpatient settings. Under Japan’s universal health insurance system, all citizens and long-term residents are required to enroll in a medical care insurance plan (public or otherwise). Therefore, the entire resident population is eligible for medical care services. In contrast, only persons who have applied for and received LTC needs certification are eligible for LTC services.
The study sample comprised residents from five municipalities participating in the LIFE Study who had newly applied for and received LTC certification between April 2017 and March 2022. We focused on individuals who displayed no cognitive impairment at the time of application and had not been diagnosed with AD within the preceding six months inclusive of the month of application. Participants were censored at death or if they had dropped out due to changing insurance during the study period.
The study was approved by the Kyushu University Institutional Review Board for Clinical Research (Approval No. 22114-02). The study was in accordance with the ethical standards of the responsible committee on human experimentation (institutional and national) and with the Helsinki Declaration of 1964 and later versions.
Outcome
The study outcome was AD onset, which was defined as a diagnosis of AD after the index month. The month succeeding the LTC certification application was set as the index month (baseline), and the interval from that month until the onset of AD was assessed. AD diagnoses were identified from the medical care claims data using International Classification of Diseases, 10th Revision (ICD-10) codes F00 and G30 [36]. Persons without any recorded diagnosis of AD were considered to have no AD.
Sensory impairment
Sensory impairment at the time of LTC certification application was identified from the medical care claims data using the corresponding ICD-10 codes (Supplementary Table 1). VI included eye-related diseases such as macular degeneration and glaucoma, and HI included diseases of the external ear, middle ear and mastoid, and inner ear. Individuals with concurrent VI and HI were classified as having DSI, whereas individuals without either impairment were classified as having neither sensory impairment (NSI).
Table 1
Baseline characteristics of participants according to sensory impairment status
| Characteristics | Categories | Total | NSI | VI only | HI only | DSI | p |
| n | 14,186 | 10,973 | 2,396 | 541 | 276 | ||
| Sex | Male (%) | 5,968 (42.1) | 4,888 (44.5) | 835 (34.9) | 172 (31.8) | 73 (26.5) | <0.001 |
| Female (%) | 8,218 (57.9) | 6,085 (55.5) | 1,561 (65.1) | 369 (68.2) | 203 (73.5) | ||
| Age, y | Mean (SD) | 80.4 (7.5) | 79.9 (7.6) | 81.6 (6.7) | 82.2 (6.5) | 82.6 (6.3) | |
| ≤64 (%) | 1,210 (8.5) | 1,066 (9.7) | 111 (4.6) | 25 (4.6) | 8 (2.9) | <0.001 | |
| 65–74 (%) | 4,665 (32.9) | 3,775 (34.3) | 682 (28.5) | 136 (25.1) | 72 (26.1) | ||
| 75–84 (%) | 7,033 (49.6) | 5,189 (47.3) | 1,353 (56.5) | 325 (60.1) | 166 (60.1) | ||
| ≥85 (%) | 1,278 (9.0) | 943 (8.6) | 250 (10.4) | 55 (10.2) | 30 (10.9) | ||
| LTC needs levels | Level 1 (%) | 5,031 (35.5) | 3,670 (33.4) | 979 (40.9) | 248 (45.8) | 134 (48.5) | <0.001 |
| Level 2 (%) | 2,822 (19.9) | 2,079 (19.0) | 538 (22.4) | 117 (21.6) | 88 (31.9) | ||
| Level 3 (%) | 2,584 (18.2) | 2,087 (19.0) | 392 (16.4) | 74 (13.7) | 31 (11.2) | ||
| Level 4 (%) | 1,432 (10.1) | 1,185 (10.8) | 190 (7.9) | 44 (8.1) | 13 (4.7) | ||
| Level 5 (%) | 1,042 (7.4) | 875 (8.0) | 128 (5.3) | 32 (5.9) | 7 (2.5) | ||
| Level 6 (%) | 937 (6.6) | 788 (7.2) | 126 (5.3) | 20 (3.7) | 3 (1.1) | ||
| Level 7 (%) | 338 (2.4) | 289 (2.6) | 43 (1.8) | 6 (1.1) | 0 (0.0) | ||
| Self-reliance levels | Level 1 (%) | 10 (0.1) | 8 (0.1) | 1 (0.0) | 0 (0.0) | 1 (0.4) | <0.001 |
| Level 2 (%) | 1,361 (9.6) | 1,000 (9.1) | 256 (10.7) | 66 (12.2) | 39 (14.1) | ||
| Level 3 (%) | 3,379 (23.8) | 2,442 (22.3) | 669 (27.9) | 171 (31.6) | 97 (35.1) | ||
| Level 4 (%) | 2.439 (17.2) | 1,777 (16.2) | 494 (20.6) | 106 (19.6) | 62 (22.5) | ||
| Level 5 (%) | 4,294 (30.3) | 3,472 (31.6) | 621 (25.9) | 138 (25.5) | 63 (22.8) | ||
| Level 6 (%) | 974 (6.9) | 816 (7.4) | 126 (5.3) | 24 (4.4) | 8 (2.9) | ||
| Level 7 (%) | 1,483 (10.5) | 1,251 (11.4) | 199 (8.3) | 30 (5.6) | 3 (1.1) | ||
| Level 8 (%) | 145 (1.0) | 120 (1.1) | 19 (0.8) | 5 (0.9) | 1 (0.4) | ||
| Level 9 (%) | 101 (0.7) | 87 (0.8) | 11 (0.5) | 1 (0.2) | 2 (0.7) | ||
| Diabetes | Yes (%) | 5,627 (39.7) | 4,095 (37.3) | 1,170 (48.8) | 228 (42.1) | 134 (48.6) | <0.001 |
| No (%) | 8,559 (60.3) | 6,878 (62.7) | 1,226 (51.2) | 313 (57.9) | 142 (51.4) | ||
| Cancer | Yes (%) | 3,957 (27.9) | 3,051 (27.8) | 689 (28.8) | 150 (27.7) | 67 (24.3) | 0.44 |
| No (%) | 10,229 (72.1) | 7,922 (72.2) | 1,707 (71.2) | 391 (72.3) | 209 (75.7) | ||
| Ischemic heart disease | Yes (%) | 3,722 (26.2) | 2,665 (24.3) | 763 (31.8) | 187 (34.6) | 107 (38.8) | <0.001 |
| No (%) | 10,464 (73.8) | 8,308 (75.7) | 1,633 (68.2) | 354 (65.4) | 169 (61.2) | ||
| Cerebrovascular disease | Yes (%) | 4,361 (30.7) | 3,161 (28.8) | 862 (36.0) | 236 (43.6) | 102 (37.0) | <0.001 |
| No (%) | 9,825 (69.3) | 7,812 (71.2) | 1,534 (64.0) | 305 (56.4) | 174 (63.0) | ||
| Heart failure | Yes (%) | 4,633 (32.7) | 3,455 (31.5) | 922 (38.5) | 171 (31.6) | 85 (30.8) | <0.001 |
| No (%) | 9,553 (67.3) | 7,518 (68.5) | 1,474 (61.5) | 370 (68.4) | 191 (69.2) | ||
| Arthritis | Yes (%) | 4,946 (34.9) | 3,434 (31.3) | 1,079 (45.0) | 275 (50.8) | 158 (57.3) | <0.001 |
| No (%) | 9,240 (65.1) | 7,539 (68.7) | 1,317 (55.0) | 266 (49.2) | 118 (42.8) | ||
| Fracture | Yes (%) | 2,887 (20.3) | 2,190 (20.0) | 555 (23.2) | 541 (17.2) | 48 (17.8) | 0.002 |
| No (%) | 11,299 (79.7) | 8,783 (80.0) | 1,841 (76.8) | 448 (82.8) | 227 (82.3) |
DSI, dual sensory impairment; HI, hearing impairment; LTC, long-term care; NSI, neither sensory impairment; SD, standard deviation; VI, visual impairment.
Covariates
Information was obtained on participant sex, age, LTC needs levels, self-reliance levels, and comorbidities. Age was divided into four categories (≤64, 65–74, 75–84, and ≥85 years). LTC needs were categorized into seven levels: support needs levels 1–2 (designated levels 1–2 for this study) and care needs levels 1–5 (designated levels 3–7), with level 7 representing the highest level of dependence. Self-reliance was assessed using Japan’s degree of independent living scale for older adults, which is divided into nine levels: level 1 represents individuals who are self-reliant; levels 2–3 represent individuals who have some kind of disability, but are mostly independent in daily life and can go out alone; levels 4–5 represent individuals who are mostly independent in indoor daily life, but are unable to go out without assistance; levels 6–7 represent individuals who require some assistance in indoor daily life and spend most of the day in bed, but can remain in a sitting position by themselves; and levels 8–9 represent individuals who remain in bed all day and require assistance with toileting, eating, and dressing. We analyzed the following comorbidities that occurred within the preceding six months inclusive of the index month: diabetes, cancer, ischemic heart disease, cerebrovascular disease, heart failure, arthritis, and fracture. These comorbidities were identified based on their corresponding ICD-10 codes recorded in the medical care claims data (Supplementary Table 1).
Statistical analysis
First, categorical variables were reported as numbers and percentages, and compared using Pearson’s chi-squared test. Cox proportional hazards models were used to evaluate the risks of VI, HI, and DSI (reference: NSI) associated with incident AD after adjusting for sex, age categories, LTC needs levels, self-reliance levels, and comorbidities. We constructed a sex/age-adjusted model and a multivariable model that included all covariates. Schoenfeld residuals were used to assess the proportional hazards assumption. Risks were calculated as hazard ratios (HRs) with 95% confidence intervals (CIs), and Kaplan–Meier curves were plotted to visually assess the differences in risk for AD development between single sensory impairment and DSI over time. The analyses were performed using Stata Statistical Software Release 17 (StataCorp, College Station, TX).
RESULTS
Study sample
We identified 14,186 participants who had no cognitive impairment at the time of LTC certification application or AD diagnosis within the preceding six months. Table 1 presents the baseline characteristics of the participants according to sensory impairment status. Overall, the age of the participants ranged from 40 to 105 years (mean±standard deviation: 80.4±7.5 years), and 57.9% were women. There were significant inter-group differences for sex, age categories, LTC needs levels, self-reliance levels, and all comorbidities except cancer. The prevalence of sensory impairment was generally higher in women and tended to increase with age. In participants with diabetes, ischemic heart disease, cerebrovascular disease, and arthritis, the prevalence of VI only and HI only was generally higher than that of NSI. Furthermore, in participants with ischemic heart disease and arthritis, the prevalence of DSI was higher than VI only and HI only. The prevalence of HI was highest in participants with cerebrovascular disease and the prevalence of VI was highest in participants with fracture. Participants with cancer showed no significant differences in sensory impairment prevalence.
Incidence of AD
During the mean follow-up period of 22.6 months, we identified AD onset in 1,194 (8.4%) participants. Of these incident cases, 870 were in the NSI group, 222 in the VI only group, 64 in the HI only group, and 38 in the DSI group. The log-rank test demonstrated a significant difference in AD incidence among the four groups (p < 0.001). Table 2 compares the baseline characteristics between the AD group (with an AD diagnosis) and the non-AD group (without an AD diagnosis). As shown in the univariable Cox proportional hazards analyses, age, ischemic heart disease, cerebrovascular disease, heart failure, and arthritis were significant risk factors for AD.
Table 2
Baseline characteristics of participants according to AD development
| Characteristics | Categories | No AD | Incident AD | p | HR [95% CI] | p |
| N | 13,943 | 1,194 | ||||
| Sex | Male (%) | 5,526 (42.5) | 442 (37.0) | <0.001 | Reference | |
| Female (%) | 7,466 (57.5) | 752 (63.0) | 1.1 [1.0–1.2] | 0.26 | ||
| Age, y | Mean (SD) | 80.2 (7.5) | 82.6 (6.0) | |||
| ≤64 (%) | 1,181 (9.1) | 29 (2.4) | <0.001 | Reference | ||
| 65–74 (%) | 4,354 (33.5) | 311 (26.1) | 2.9 [2.0–4.2] | <0.001 | ||
| 75–84 (%) | 6,313 (48.6) | 720 (60.3) | 4.4 [3.0–6.3] | <0.001 | ||
| ≥85 (%) | 1,144 (8.8) | 134 (11.2) | 4.7 [3.1–7.0] | <0.001 | ||
| LTC needs levels | Level 1 (%) | 4,511 (34.7) | 520 (43.5) | <0.001 | Reference | |
| Level 2 (%) | 2,551 (19.6) | 271 (22.7) | 0.9 [0.8–1.1] | 0.30 | ||
| Level 3 (%) | 2,390 (18.4) | 194 (16.3) | 0.9 [0.7–1.0] | 0.11 | ||
| Level 4 (%) | 1,349 (10.4) | 83 (7.0) | 0.7 [0.6–0.9] | 0.002 | ||
| Level 5 (%) | 988 (7.6) | 54 (4.5) | 0.6 [0.5–0.8] | <0.001 | ||
| Level 6 (%) | 884 (6.8) | 53 (4.4) | 0.7 [0.5–0.9] | 0.014 | ||
| Level 7 (%) | 319 (2.5) | 19 (1.6) | 0.8 [0.5–1.3] | 0.33 | ||
| Self-reliance levels | Level 1 (%) | 8 (0.1) | 2 (0.2) | <0.001 | Reference | |
| Level 2 (%) | 1,238 (9.5) | 123 (10.3) | 0.3 [0.1–1.2] | 0.09 | ||
| Level 3 (%) | 3,048 (23.5) | 331 (27.7) | 0.3 [0.1–1.3] | 0.12 | ||
| Level 4 (%) | 2,213 (17.0) | 226 (18.9) | 0.3 [0.1–1.3] | 0.11 | ||
| Level 5 (%) | 3,921 (30.2) | 373 (31.2) | 0.3 [0.1–1.3] | 0.11 | ||
| Level 6 (%) | 919 (7.1) | 55 (4.6) | 0.2 [0.1–0.8] | 0.025 | ||
| Level 7 (%) | 1,410 (10.9) | 73 (6.1) | 0.2 [0.1–0.8] | 0.019 | ||
| Level 8 (%) | 137 (1.0) | 8 (0.7) | 0.2 [0.1–1.1] | 0.07 | ||
| Level 9 (%) | 98 (0.7) | 3 (0.3) | 0.1 [0.0–0.8] | 0.031 | ||
| Diabetes | Yes (%) | 5,144 (39.6) | 483 (40.5) | 0.56 | Reference | |
| No (%) | 7,848 (60.4) | 711 (59.5) | 1.1 [1.0–1.2] | 0.13 | ||
| Cancer | Yes (%) | 3,711 (28.6) | 246 (20.6) | <0.001 | Reference | |
| No (%) | 9,281 (71.4) | 948 (79.4) | 1.0 [0.8–1.1] | 0.66 | ||
| Ischemic heart disease | Yes (%) | 3,360 (25.9) | 362 (30.3) | 0.001 | Reference | |
| No (%) | 9,632 (74.1) | 832 (69.7) | 1.2 [1.1–1.4] | 0.001 | ||
| Cerebrovascular disease | Yes (%) | 3,926 (30.2) | 435 (36.4) | <0.001 | Reference | |
| No (%) | 9,066 (69.8) | 759 (63.6) | 1.3 [1.1–1.4] | <0.001 | ||
| Heart failure | Yes (%) | 4,209 (32.4) | 424 (35.5) | 0.028 | Reference | |
| No (%) | 8,783 (67.6) | 770 (64.5) | 1.3 [1.1–1.4] | <0.001 | ||
| Arthritis | Yes (%) | 4,451 (34.3) | 495 (41.5) | <0.001 | Reference | |
| No (%) | 8,541 (65.7) | 699 (58.5) | 1.2 [1.1–1.4] | <0.001 | ||
| Fracture | Yes (%) | 2,619 (20.2) | 268 (22.5) | 0.06 | Reference | |
| No (%) | 10,373 (79.8) | 926 (77.5) | 1.1 [0.9–1.2] | 0.36 |
AD, Alzheimer’s disease; CI, confidence interval; HR, hazard ratio; LTC, long-term care; SD, standard deviation.
Sensory impairment and AD onset
Table 3 shows the results of the sex/age-adjusted and multivariable Cox proportional hazards models. The sex/age-adjusted model estimated the HR for developing AD (reference: NSI) to be 1.1 (95% CI: 1.0–1.3, p = 0.08) for participants with VI only, 1.4 (95% CI: 1.1–1.8, p = 0.011) for participants with HI only, and 1.7 (95% CI: 1.3–2.4, p < 0.001) for participants with DSI. The multivariable model estimated the HR for developing AD (reference: NSI) to be 1.0 (95% CI: 0.9–1.2, p = 0.60) for participants with VI only, 1.2 (95% CI: 0.9–1.5, p = 0.21) for participants with HI only, and 1.6 (95% CI: 1.1–2.2, p = 0.008) for participants with DSI.
Table 3
Association of sensory impairment status with incident Alzheimer’s disease
| Sensory impairment | Sex/age-adjusted model | Multivariable modela | ||
| status | HR [95% CI] | p | HR [95% CI] | p |
| NSI | Reference | Reference | ||
| VI only | 1.1 [1.0–1.3] | 0.08 | 1.0 [0.9–1.2] | 0.60 |
| HI only | 1.4 [1.1–1.8] | 0.011 | 1.2 [0.9–1.5] | 0.21 |
| DSI | 1.7 [1.3–2.4] | <0.001 | 1.6 [1.1–2.2] | 0.008 |
DSI, dual sensory impairment; CI, confidence interval; HI, hearing impairment; HR, hazard ratio; NSI, neither sensory impairment; VI, visual impairment. aThe multivariable model adjusted for sex, age categories, long-term care needs levels, self-reliance levels, and comorbidities (diabetes, cancer, ischemic heart disease, cerebrovascular, cardiac failure, arthritis, and fracture) diagnosed within the preceding six months inclusive of the index month.
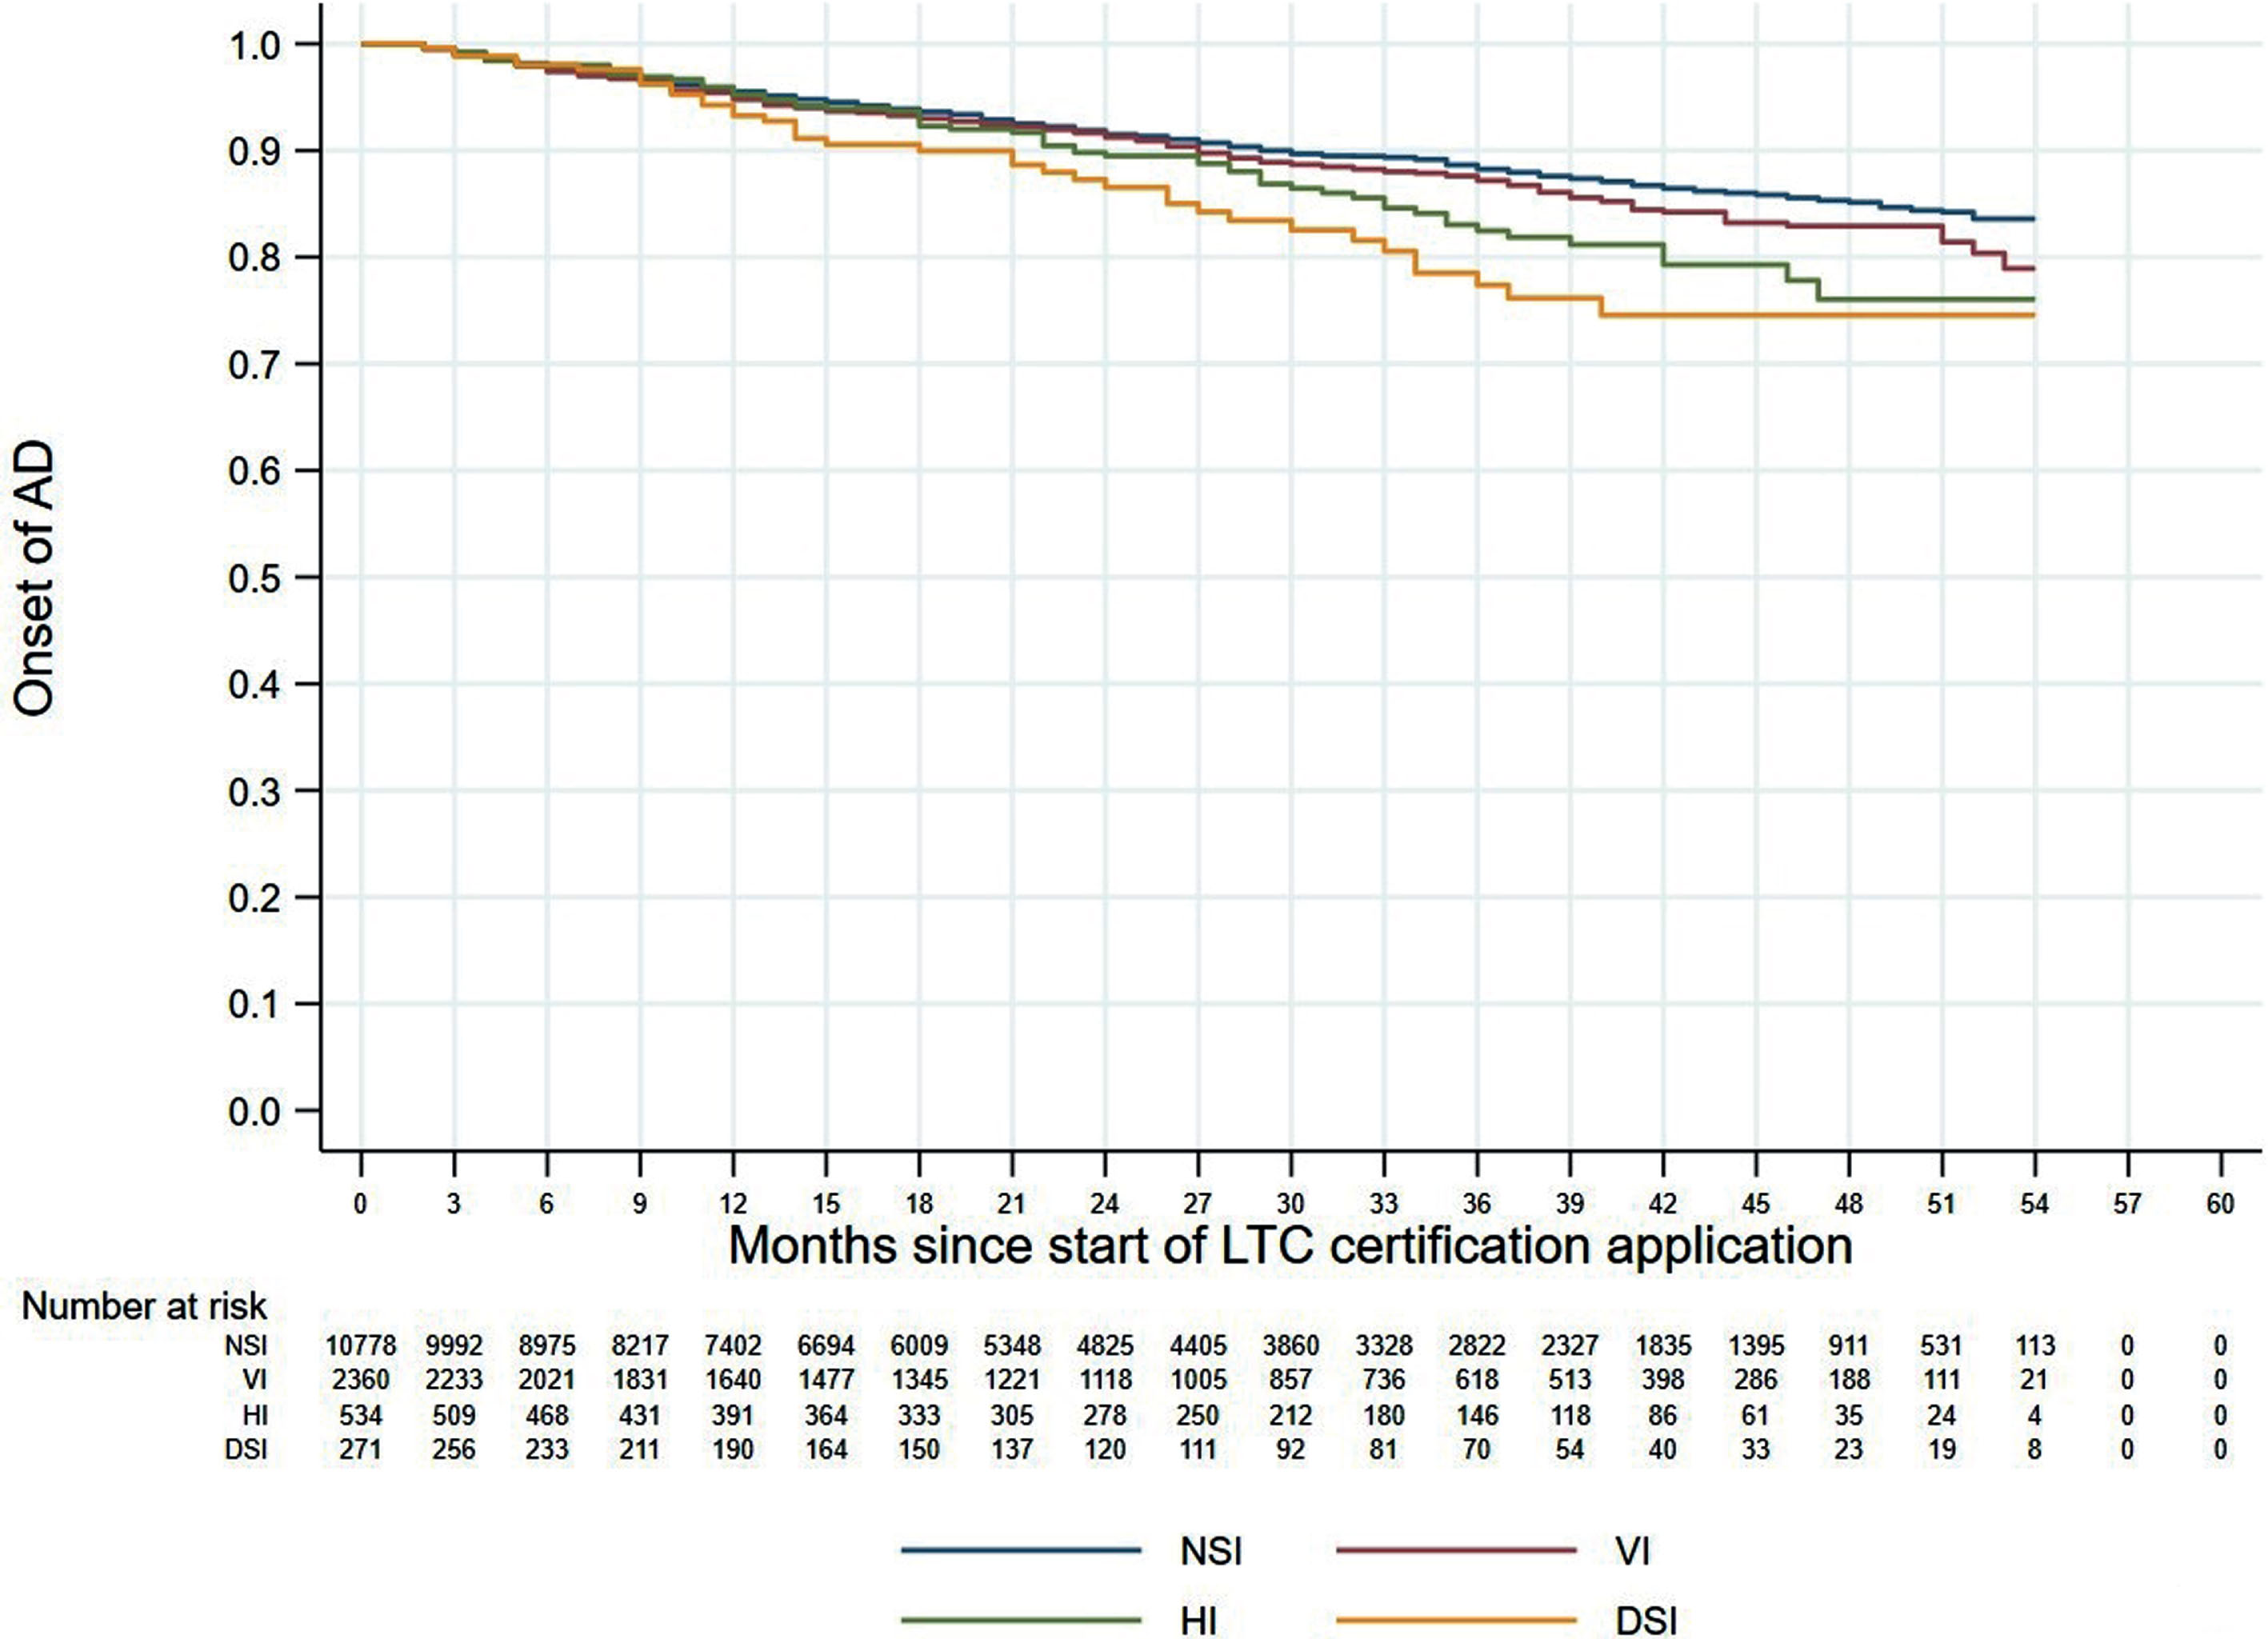
Figures 1 and 2 shows the 60-month Kaplan–Meier curves of AD onset for the VI only group and HI only group compared to the NSI group. The results indicated that participants with a single sensory impairment had a higher risk of developing AD than those without any sensory impairment. Similarly, Fig. 3 presents the 60-month Kaplan–Meier curves of AD onset for the NSI group, VI only group, HI only group, and DSI group. When compared to the NSI group, the risk of AD onset was highest in the DSI group, followed by the HI only and VI only groups.
Fig. 1
Kaplan–Meier curves of AD onset in the VI only group versus the NSI group. AD, Alzheimer’s disease; NSI, neither sensory impairment; VI, visual impairment.
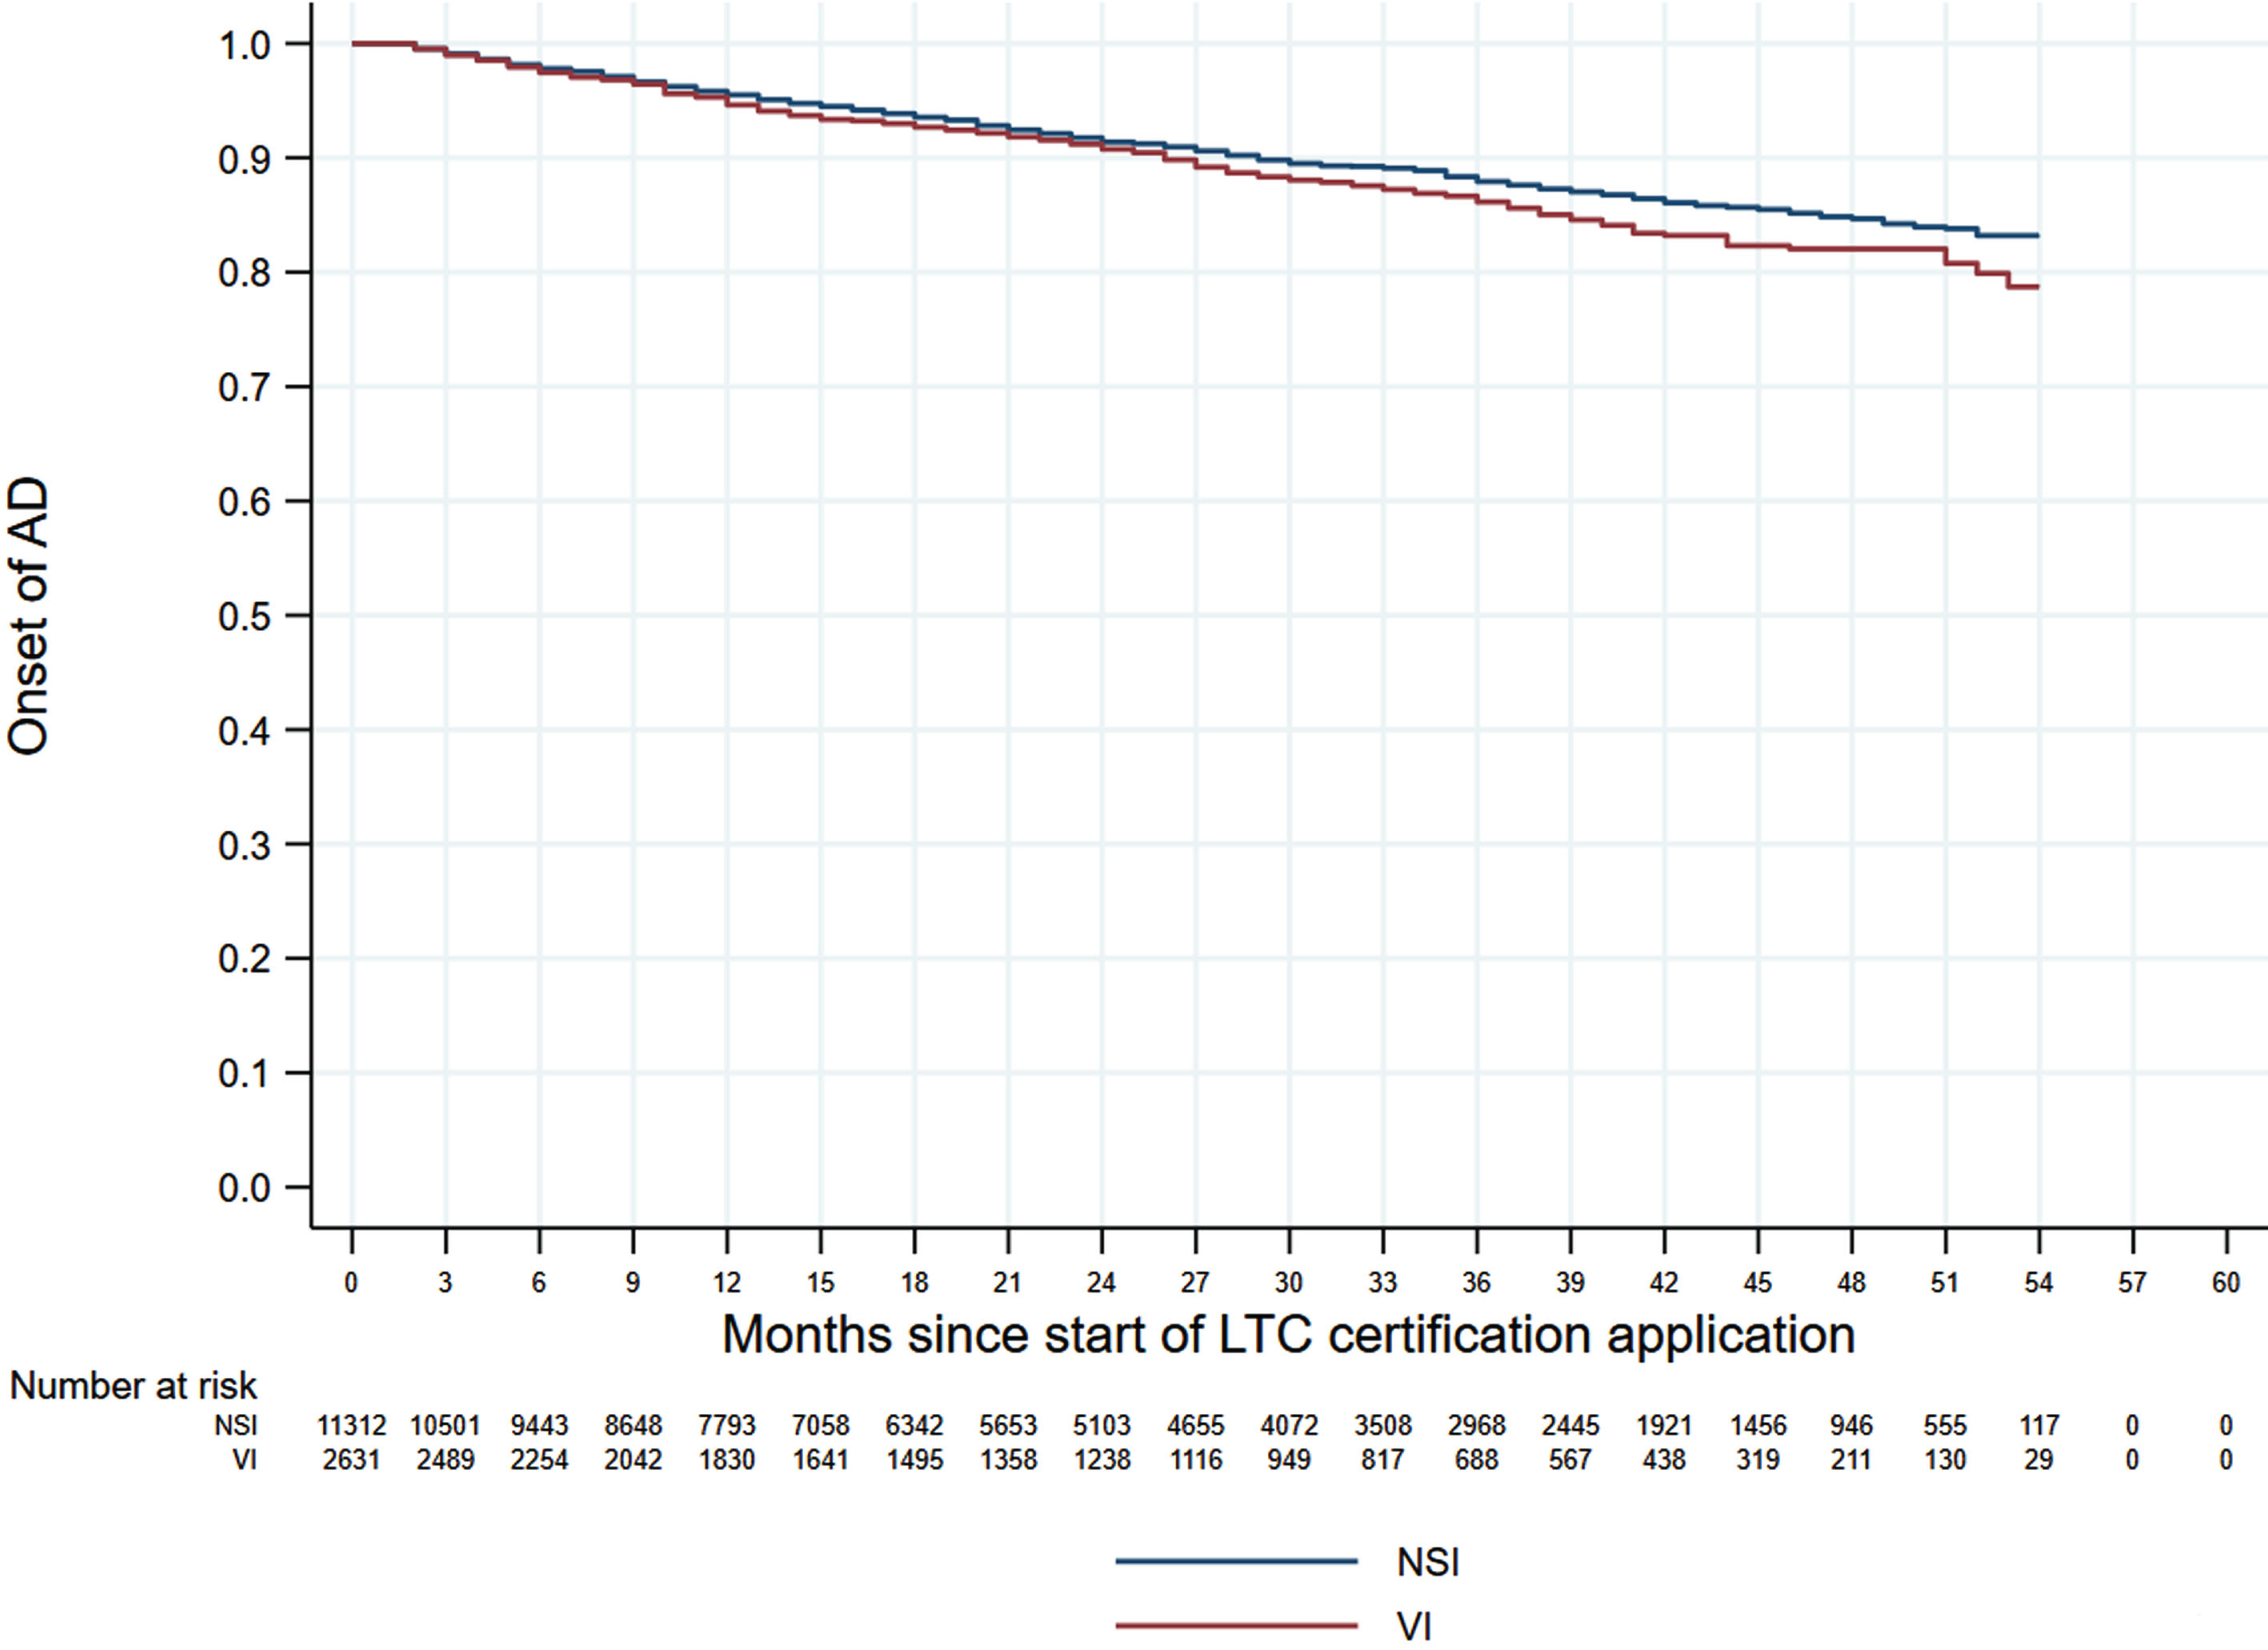
Fig. 2
Kaplan–Meier curves of AD onset in the HI only group versus the NSI group. AD, Alzheimer’s disease; HI, hearing impairment; NSI, neither sensory impairment.
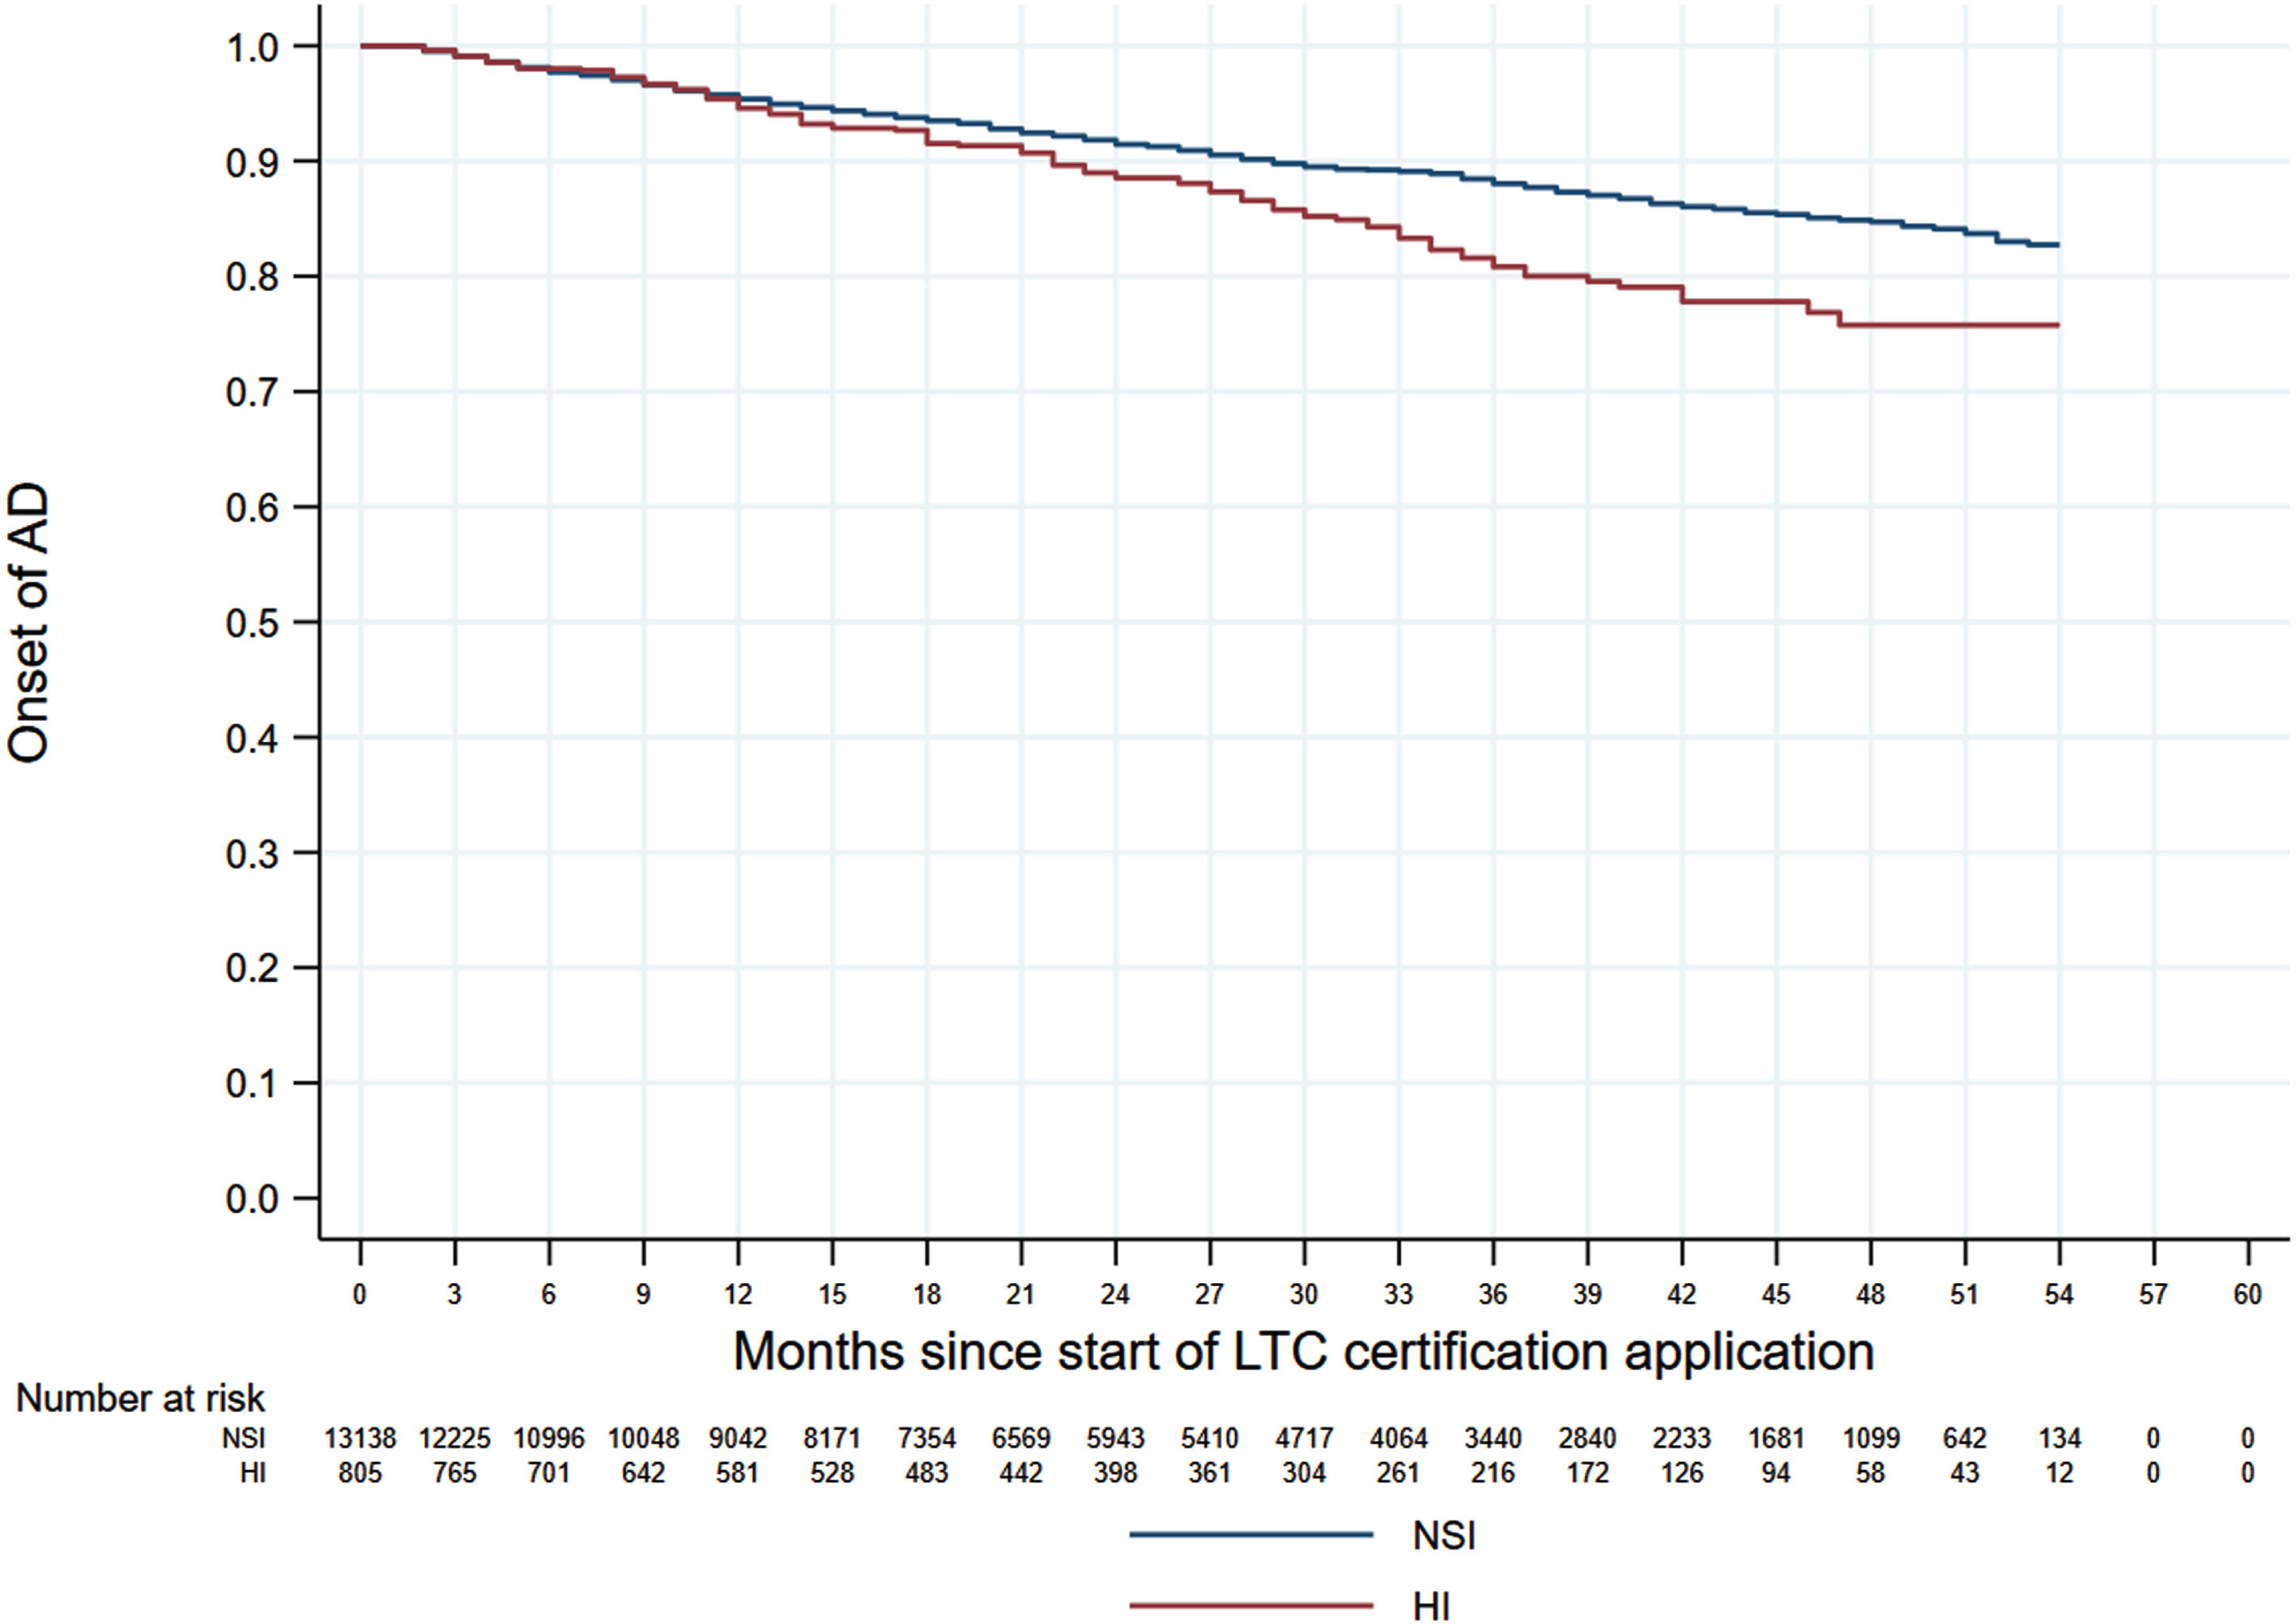
Fig. 3
Kaplan–Meier curves of AD onset according to sensory impairment status. AD, Alzheimer’s disease; DSI, dual sensory impairment; HI, hearing impairment; NSI, neither sensory impairment; VI, visual impairment.
DISCUSSION
In this retrospective cohort study of 14,186 individuals residing in five Japanese municipalities, we found that participants with DSI had a 56% higher risk of developing AD than those with NSI. This finding indicates that individuals with concurrent VI and HI are potential interventional targets for AD prevention.
A feature of this study is that all participants were enrolled in Japan’s LTC insurance system, and the study sample therefore encompassed people who already had certified LTC needs. The mean age of the participants was 80.4 years, and many cases had underlying diseases. In addition, our participants were not diagnosed with AD for a period of up to six months before the baseline and had not shown any cognitive impairment when they were being evaluated for LTC certification. This increased the reliability of identifying new cases of AD in our data. Another feature of our study is that sensory impairment was determined using recorded diagnoses of diseases that affect vision and hearing. In some previous studies, sensory impairment was identified through subjective criteria such as self-reporting [24, 25], whereas our cases were based on objective clinical criteria that led to physician diagnoses. Accordingly, our findings add important evidence to the body of knowledge on the relationship of eye and ear diseases with AD using objective diagnoses.
Our multivariable Cox proportional hazards analysis found that DSI was significantly associated with incident AD but did not detect any increased risk of AD for individuals with a single sensory impairment. A previous study reported that VI, but not HI, was independently associated with a higher risk of incident dementia [24], whereas other studies have shown the opposite result [25, 26]. According to the Lancet Commission’s 2020 report on “Dementia prevention, intervention, and care”, approximately 40% of all dementia cases are associated with potentially modifiable risk factors, and hearing loss has a population attributable fraction for dementia of about 8% in persons aged 45–65 years [37]. Another study reported that VI only, HI only, and DSI significantly increased the incidence of dementia [23]. In our present study, the Kaplan–Meier curves for the four impairment groups showed that AD onset risk was highest in the DSI group, followed by the HI group and the VI group. By consolidating the results of previous studies and our present study, it appears that either VI or HI alone can reduce cognitive function and increase the possibility of developing AD, and that concurrent DSI can significantly elevate the risk of developing AD. The positive association between DSI and incident AD suggests that sensory preservation and rehabilitation may indirectly help to prevent and/or delay the progression of cognitive decline.
A person’s ability to communicate with others is highly dependent on their ability to hear and process auditory information. Presbycusis can impede a person’s ability to converse and socialize, and the ensuing isolation can lead to the development of depression, cognitive decline, and dementia [38]. Aging is frequently accompanied by the progressive deterioration of vision and hearing, but these should not be simply accepted as unavoidable problems. Sensory impairment reduces external stimuli and cognitive stimulation, which could increase the risk of dementia including AD. The results of our study highlight the importance of preventing VI and HI and indicate that older adults with DSI should be recognized as potential candidates for increased monitoring and dementia prevention interventions when needed.
This study has several important limitations. First, residual confounding may have biased our results. For example, information on disease severity or stage, genetic markers, demographic factors (e.g., education and income level), and health-related behaviors (e.g., smoking and alcohol intake) could not be ascertained from claims data, and these unmeasured confounders may affect the observed associations between sensory impairment and AD development. Second, all medical conditions, including sensory impairment and AD, were identified using physician-assigned diagnoses recorded in outpatient and inpatient claims data. However, the accuracy of these records has yet to be validated, and there is a possibility of coding errors and misclassifications that could affect the results [39]. Furthermore, AD could be underdiagnosed by physicians, and some patients without a recorded diagnosis may actually have AD. Also, we did not account for other types of dementia, which may have affected the grouping in the analysis. In addition, some participants with the target eye or ear diseases may not necessarily have VI or HI if their conditions were in the early stages. Future studies are needed to verify the accuracy of using ICD-10 codes in Japanese claims data to identify these diseases. Nevertheless, concerns about the accuracy of these records were minimized by collecting and confirming duplicate information on cognitive function and sensory impairment from the LTC data. Also, our study was not conducted according to specific diseases, but rather focused on the general presence or absence of eye and ear conditions. Therefore, we do not think that this would have a major impact on our analysis. Third, our study data lacked information on the use of assistive devices for VI and HI, such as hearing aids, cochlear implants, and eyeglasses. Fourth, our study focused on persons enrolled in Japan’s public medical care and LTC insurance systems. These individuals may have some differences in sociodemographic and health factors from those enrolled in other insurance systems, which could have introduced selection bias into our study. However, the different sensory impairment groups would be similarly vulnerable to this bias, which could limit the effects on our risk estimates. Finally, our findings may have limited generalizability because we did not examine the heterogeneity of treatment effects. Further studies are needed to determine whether treatments for VI and HI can reduce the risk of AD.
Conclusions and implications
This study demonstrates that DSI was associated with a significantly higher risk of incident AD than single sensory impairment or no impairment. The findings also suggest that HI may have a greater impact on the development of AD than VI. The prevention and treatment of sensory impairment may have clinical implications beyond the preservation of visual and auditory function. Increasing the availability and accessibility of such interventions for at-risk persons may not only improve their functional outcomes and quality of life, but could also help to reduce their future risk of AD.
AUTHOR CONTRIBUTIONS
Haruhisa Fukuda (Conceptualization; Data curation; Funding acquisition; Project administration; Resources; Supervision; Writing – review & editing); Sung-a Kim (Formal analysis; Methodology; Writing – original draft); Megumi Maeda (Data curation; Writing – review & editing); Fumiko Murata (Data curation; Writing – review & editing); Takayuki Fujii (Conceptualization; Supervision; Writing – review & editing); Emi Ueda (Conceptualization; Supervision; Writing – review & editing); Rei Ono (Conceptualization; Supervision; Writing – review & editing).
ACKNOWLEDGMENTS
We thank all the municipalities for their participation in the LIFE Study.
FUNDING
The construction of the study database was funded by the JST FOREST Program (Grant Number JPMJFR205J). Data analysis and publication were funded by grants from Eisai Co., Ltd. and Biogen Inc.
CONFLICT OF INTEREST
Haruhisa Fukuda received grants from Eisai Co., Ltd. and Biogen Inc.
DATA AVAILABILITY
The data used in this study were acquired under agreements between Kyushu University and the participating municipalities, which stipulate that the data can only be used by authorized research institutions and cannot be shared with third parties.
SUPPLEMENTARY MATERIAL
[1] The supplementary material is available in the electronic version of this article: https://dx.doi.org/10.3233/JAD230806.
REFERENCES
[1] | Kellar D , Craft S ((2020) ) Brain insulin resistance in Alzheimer’s disease and related disorders: Mechanisms and therapeutic approaches, Lancet Neurol 19: , 758–766. |
[2] | Patterson C (2018) World Alzheimer Report 2018. Alzheimer’s Disease International, London. |
[3] | World Health Organization (2012) Dementia. https://www.who.int/publications/i/item/dementia-a-public-health-priorityAccessed on June 6, 2023. |
[4] | Alzheimer’s Association (2019) Alzheimer’s disease facts and figures.https://www.alz.org/media/documents/alzheimers-factsand-figures-2019-r.pdfAccessed on June 6, 2023. |
[5] | Cabinet Office Japan (2022) Annual Report on the Ageing Society. Japan.https://www8.cao.go.jp/kourei/english/annualreport/index-wh.htmlAccessed on June 6, 2023. |
[6] | Niimi Y ((2018) ) Overseas dementia prevalence study, Japan J Geriatric Psychiatry 29: , 369–375. |
[7] | Ninomiya T , Nakaji S , Maeda T , Yamada M , Mimura M , Nakashima K , Mori T , Takebayashi M , Ohara T , Hata J , Kokubo Y , Uchida K , Taki Y , Kumagai S , Yonemoto K , Yoshida H , Muto K , Momozawa Y , Akiyama M , Kubo M , Ikeda M , Kanba S , Kiyohara Y ((2020) ) Study design and baseline characteristics of a population-based prospective cohort study of dementia in Japan: The Japan Prospective Studies Collaboration for Aging and Dementia (JPSC-AD), Environ Health Prev Med 25: , 64. |
[8] | Cunnane S , Nugent S , Roy M , Courchesne-Loyer A , Croteau E , Tremblay S , Castellano A , Pifferi F , Bocti C , Paquet N , Begdouri H , Bentourkia M , Turcotte E , Allard M , Barberger-Gateau P , Fulop T , Rappoport S ((2011) ) Brain fuel metabolism, aging, and Alzheimer’s disease, Nutrition 27: , 3–20. |
[9] | Sharma P , Srivastava P , Seth A , Tripathi PN , Banerjee AG , Shrivastava SK ((2019) ) Comprehensive review of mechanisms of pathogenesis involved in Alzheimer’s disease and potential therapeutic strategies, Prog Neurobiol 174: , 53–89. |
[10] | Fjell AM , McEvoy L , Holland D , Dale AM , Walhovd KB ((2014) ) What is normal in normal aging? Effects of aging, amyloid and Alzheimer’s disease on the cerebral cortex and the hippocampus, Prog Neurobiol 117: , 20–40. |
[11] | Campbell VA , Crews JE , Moriarty DG , Zack MM , Blackman DK ((1999) ) Surveillance for sensory impairment, activity limitation, and health-related quality of life among older adults-United States, 1993–1997, MMWR CDC Surveill Summ 48: , 131–156. |
[12] | Swenor BK , Ramulu PY , Willis JR , Friedman D , Lin FR ((2013) ) The prevalence of concurrent hearing and vision impairment in the United States, JAMA Intern Med 173: , 312–313. |
[13] | Bagai A , Thavendiranathan P , Detsky AS ((2006) ) Does this patient have hearing impairment? , JAMA 295: , 416–428. |
[14] | Lin FR , Thorpe R , Gorden-Salant S , Ferrucci L ((2011) ) Hearing loss and cognition among older adults in the United States, J Gerontol A Biol Sci Med Sci 66: , 582–590. |
[15] | Zetterberg M ((2016) ) Age-related eye disease and gender, Maturitas 83: , 19–26. |
[16] | Resnikoff S , Pascolini D , Etya’ale D , Kocur I , Pararajasegaram R , Pokharel GP , Mariotti SP ((2004) ) Global data on visual impairment in the year 2004, Bull World Health Organ 82: , 844–851. |
[17] | Clemons TE , Rankin MW , McBee WL ((2006) ) Age-related eye disease study research group. Cognitive impairment in the age-related eye disease study: AREDS report no.16, Arch Ophthalmol 124: , 537–543. |
[18] | Shang X , Zhu Z , Wang W , Ha J , He M ((2021) ) The association between vision impairment and incidence of dementia and cognitive impairment: A systematic review and meta-analysis, Ophthalmology 128: , 1135–1149. |
[19] | Lee ATC , Richards M , Chan WC , Chiu HFK , Lee RSY , Lam LCW ((2020) ) Higher dementia incidence in older adults with poor visual acuity, J Gerontol A 75: , 2162–2168. |
[20] | Loughrey DG , Kelly ME , Kelley GA , Brennan S , Lawlor BA ((2018) ) Association of age-related hearing loss with cognitive function, cognitive impairment, and dementia: A systematic review and meta-analysis, JAMA Otolaryngol Head Neck Surg 144: , 115–126. |
[21] | Lin FR , Metter EJ , O’Brien RJ , Resnick SM , Zonderman AB , Ferrucci L ((2011) ) Hearing loss and incident dementia, Arch Neurol 68: , 214–220. |
[22] | Gurgel RK , Ward PD , Schwartz S , Norton MC , Foster NL , Tschanz JT ((2014) ) Relationship of hearing loss and dementia: A prospective, population-based study, Otol Neurotol 35: , 775–781. |
[23] | Hu W , Wang Y , Wang W , Zhang X , Shang X , Liao H , Chen Y , Huang Y , Zhang X , Tang S , Yu H , Yang X , He M , Zhu Z ((2022) ) Association of visual, hearing, and dual sensory impairment with incident dementia, Front Aging Neurosci 14: , 872967. |
[24] | Hwang PH , Longstreth WTJ , Brenowitz WD , Thielke SM , Lopez OL , Francis CE , DeKosky ST , Fitzpatrick AL ((2020) ) Dual sensory impairment in older adults and risk of dementia from the GEM study, Alzheimers Dement (Amst) 12: , e12054. |
[25] | Byeon G , Oh GH , Jhoo JH , Jang JW , Bae JB , Han JW , Kim TH , Kwak KP , Kim BJ , Kim SG , Kim JL , Moon SW , Park JH , Ryu SH , Youn JC , Lee DW , Lee SB , Lee JJ , Lee DY , Kim KW ((2021) ) Dual sensory impairment and cognitive impairment in the Korean longitudinal elderly cohort, Neurology 96: , e2284–e2295. |
[26] | Michalowsky B , Hoffimann W , Kostev K ((2019) ) Association between hearing and vision impairment and risk of dementia: Results of a case-control study based on secondary data, Neurosci 11: , 363. |
[27] | Lin MY , Gutierrez PR , Stone KL , Yaffe K , Ensrud KE , Fink HA , Sarkisian CA , Coleman AL , Mangione CM ((2004) ) Vision impairment and combined vision and hearing impairment predict cognitive and functional decline in older women, J Am Geriatr Soc 52: , 1996–2002. |
[28] | Armstrong RA ((2009) ) Alzheimer’s disease and the eye, J Optometry 2: , 103–111. |
[29] | Gupta VB , Chitranshi N , Haan JD , Mirzaei M , You Y , Lim JKH , Basavarajappa D , Godinez A , Angelantonio SD , Sachdev P , Salekdeh GH , Bouwman F , Graham S , Gupta V ((2021) ) Retinal changes in Alzheimer’s disease –integrated prospects of imaging, functional and molecular advances, Prog Retinal Eye Res 82: , 100899. |
[30] | Swords GM , Nguyen LT , Mudar RA , Llano DA ((2018) ) Auditory system dysfunction in Alzheimer disease and its prodromal states: A review, Ageing Res Rev 44: , 49–59. |
[31] | Liu CM , Lee CTC ((2019) ) Association of hearing loss with dementia., JAMA Netw Open 2: , e198112. |
[32] | Peracino A ((2014) ) Hearing loss and dementia in the aging population, Audiol Neurootol 19: , 6–9. |
[33] | Panza F , Solfrizzi V , Seripa D , Imbimbo B , Capozzo R , Quaranta N , Pilotto A , Logroscino G ((2015) ) Age-related hearing impairment and frailty in Alzheimer’s disease: Interconnected associations and mechanisms, Front Aging Neurosci 7: , 113–114. |
[34] | Fukuda H , Ishiguro C , Ono R , Kiyohara K ((2023) ) The Longevity Improvement and Fair Evidence (LIFE) Study: Overview of the study design and baseline participant profile, J Epidemiol 33: , 428–437. |
[35] | Olivares-Tirado P , Tamiya N (2013) Trends and factors in Japan’s long-term care insurance system: Japan’s 10-year experience. Springer. |
[36] | World Health Organization. ICD 10 online.https://www.who.int/publications/m/item/official-who-icd-10-updates-2019-packageAccessed on June 6, 2023. |
[37] | Livingston G , Huntley J , Sommerlad A , Ames D , Ballard C , Banerjee S , Brayne C , Burns A , Cohen-Mansfield J , Cooper C , Costafreda SG , Dias A , Fox N , Gitlin LN , Howard R , Kales HC , Kivimaki M , Larson EB , Ogunniyi A , Orgeta V , Ritchie K , Rockwood K , Sampson EL , Samus Q , Schneider LS , Selbaek G , Teri L , Mukadam N ((2020) ) Dementia prevention, intervention, and care: 2020 report of the Lancet Commission, Lancet 396: , 413–446. |
[38] | Hardy CJD , Marshall CR , Golden HL , Clark CN , Mummery CJ , Griffiths TD , Bamiou DE , Warren JD ((2016) ) Hearing and dementia, J Neurol 263: , 2339–54. |
[39] | Yamana H , Moriwaki M , Horiguchi H , Kodan M , Fushimi K , Yasunaga H ((2017) ) Validity of diagnoses, procedures, and laboratory data in Japanese administrative data in Japanese administrative data, J Epidemiol 27: , 476–482. |

