
The Role of Impaired Receptor Trafficking in Mediating the Pathological Effects of APOE4 in Alzheimer’s Disease
Abstract
Background:
Apolipoprotein E4 (APOE4) is the most prevalent genetic risk factor of Alzheimer’s disease. Several studies suggest that APOE4 binding to its receptors is associated with their internalization and accumulation in intracellular compartments. Importantly, this phenomenon also occurs with other, non-ApoE receptors. Based on these observations, we hypothesized that APOE4 pathological effects are mediated by impairment in the life cycle of distinct receptors (APOER2, LRP1, IR, VEGFR).
Objective:
To examine the effects of APOE genotype on receptors protein levels and compartmentalization.
Methods:
Primary mouse neurons were prepared from APOE3 or APOE4 targeted replacement mice, or APOE-KO mice. Specific receptors protein levels were evaluated in these neurons, utilizing immunofluorescent staining. Additionally, surface membrane protein levels of those receptors were assessed by cell surface biotinylation assay and ELISA. Receptors’ colocalization with intracellular compartments was assessed by double staining and confocal microscopy, followed by colocalization analysis. Finally, LRP1 or APOER2 were knocked-down with CRISPR/Cas9 system to examine their role in mediating APOE4 effects on the receptors.
Results:
Our results revealed lower receptors’ levels in APOE4, specifically on the membrane surface. Additionally, APOE4 affects the compartmentation of these receptors in two patterns: the first was observed with LRP1 and was associated with decreased receptor levels in numerous intracellular compartments. The second was obtained with the other receptors and was associated with their accumulation in early endosomes and their decrease in the late endosomes.
Conclusions:
These results provide a unifying mechanism, in which APOE4 drives the down regulation of various receptors, which plays important roles in distinct APOE4 related pathological processes.
INTRODUCTION
Many brain disorders lead to cognitive decline and dementia, among which Alzheimer’s disease (AD) is the most prevalent [1]. Studies exploring genetic risk factors for AD, revealed an association with several genes [2–7], the most important of which is the apolipoprotein E gene on chromosome 17 (APOE gene, ApoE protein).
The involvement of APOE in AD was first suggested by Strittmatter and Roses [8], who showed that of the three polymorphic forms of APOE, namely APOE2, APOE3, and APOE4, carriers of APOE4 are more likely to develop AD. Furthermore, the cognitive changes in APOE4 carriers were shown to occur several years earlier, with a dose-dependent effect [9].
Although the ApoE protein is synthesized primary in the liver, it is also produced in the brain and functions there in many capacities, some of which may be relevant to AD. One of the major roles of ApoE in the brain, which is similar to its effects in the rest of the body, is related to lipid transport and cholesterol homeostasis, a function that was shown to be genotype dependent [10–12]. Specifically, APOE4 was shown to be hypolipidated relative to the AD benign lipoprotein ApoE3, and less effective than APOE3 in inducing cholesterol efflux [13]. Taken together, this suggests that the pathological effects of APOE4 may be related to lipid metabolism, and distribution.
Additionally, APOE4 is associated with numerous AD-related biochemical abnormalities including Aβ metabolism [14–18], tau phosphorylation and metabolism [19–21], disruption of mitochondrial function [22–24], neuroinflammation [25–28], disruption of vascular integrity [12, 29–31], and dysfunctional insulin and VEGF signaling [32–36] (for review, see Safieh et al. [1]). The plethora of phenotypes associated with APOE4 raises the possibility of them being driven by a common fundamental upstream biochemical mechanism which, by affecting different cellular systems, results in a large spectrum of varied responses.
Key physiological effects of APOE4 are mediated by ApoE-receptors: the low-density lipoprotein receptor family, which includes LRP1, APOER2, LDLR, and VLDLR, as key players [37, 38]. These receptors have an NPXY motif at their cytoplasmic domain and have been implicated in endocytosis [37, 39, 40], which results in the trafficking of the receptors between the cell surface and intracellular compartments [41, 42]. Specifically, the endocytosis of LRP1 [43–45] and APOER2 [37, 42] triggers the internalization of The N-methyl-D-aspartate receptor (NMDA) and α-amino-3-hydroxy-5-methyl-4-isoxazolepropionic acid receptor (AMPA) receptors which are the key players of synaptic excitatory transmission. Importantly, APOE4 modulates the effects of APOER2 on NMDA and AMPA receptors such that it reduces the surface expression of APOER2 in primary cultured neurons and in targeted replacement (TR) APOE4 mice [46–49]. This then, leads to inactivation and decreased phosphorylation of NMDA and AMPA receptors [46], and to the reduction of their levels in the plasma membrane as well as to their sequestering in intracellular compartments [46], leading to impaired glutamate signaling, and excitatory activity. Similar effects of APOE4 on LRP1 have been observed in neuronal cultures [50, 51].
Diabetes and impaired insulin signaling, including low levels of brain insulin, and insulin receptors, are linked to the pathogenesis of AD [18, 52–54], which inspired the study of the effects of APOE genotype on the levels of insulin receptors in mice and corresponding cellular cultures. This revealed that brain insulin metabolism in AD is differentially affected by the various APOE isoforms [55], and that APOE4 results in lower surface expression of insulin receptors (IR) and impairs its trafficking by trapping it in the early endosomes [56]. Furthermore, this phenomenon was shown to be LRP1 dependent, such that LRP1 deficiency in LRP1 knock out mice neurons lead to an impairment of brain insulin signaling and glucose metabolism [18, 57].
Additional studies revealed that other growth factor receptors are also affected by APOE4. Accordingly, the levels of the vascular endothelial growth factor receptor 2 (VEGFR2), a tyrosine kinase receptor which plays important roles in regulating vascular development, angiogenesis, and neuronal plasticity [58–60], are significantly lower in the hippocampus of APOE4 TR mice compared to the corresponding APOE3 mice [36]. The mechanisms underlying this APOE4-driven effect, and the involvement of the ApoE receptors in these processes calls for further investigation.
All in all, these findings suggest that APOE4 has important effects on the levels and trafficking of several classes of receptors, including ApoE receptors, and growth factor receptors, each of which can result in varied phenotypes (e.g., vascular pathology, and impaired neuronal signaling in the case of the VEGFR, and insulin-related impairments in the case of the IR).
This study examines the impact of APOE4 on the levels and trafficking of ApoE receptors, specifically LRP1 and APOER2, as well as growth factor receptors VEGFR and IR. Additionally, it investigates the mechanisms underlying these effects. This was done utilizing APOE3 and APOE4 primary neuronal cultures prepared from APOE3 and APOE4 TR mice. The research focuses first on the characterization of the effect of ApoE3 and APOE4 on the plasma membrane levels and on intracellular trafficking of these receptors. The current paper includes measurements of the localization of the receptors in early and late endosomes as well as in recycling endosomes and lysosomes. it also assesses the extent to which these receptors are affected by similar or different pathways. furthermore, it examines the role of interactions between APOE4 and the ApoE receptors, APOER2 and LRP1, in mediating the pathological effects of APOE4 on the growth factor receptors IR and VEGFR.
MATERIALS AND METHODS
Primary neuronal cultures
Primary mouse neurons were prepared from 1–3 days old pups of either APOE3 or APOE4 TR mice or APOE-KO mice, these mice were on α-syn-/- background. previous study in our laboratory showed that α -syn-/- does not affect the upstream lipidation impairment of APOE4, and importantly, it acts as a “second hit” enhancer of the subsequent APOE4-driven pathologies [61, 62]. The protocol was performed as follows, the mice brains were excised and incubated with Hanks’ Balanced Salt Solution buffer (HBSS- Gibco 14175-053), after which the neuronal cells were separated from the rest of the mix utilizing the protocol described in Katzenell et al. (2017) [63]. Briefly, mice brains were incubated for 20 min with dissociation solution (HBSS-HEPES with 2.5 mM CaCl2 and 0.83 mM EDTA) containing L-cysteine, DNAse (Sigma- D5025-150KU) and 100 units of papain. After which, the buffer was removed by centrifugation and the tissue was resuspended with plating medium: Neurobasal A medium (Gibco 10888022) containing 2% B-27 supplement (Gibco 17504044), 1% GlutaMAX (Gibco 35050061), 0.5% Penicillin-Streptomycin (Gibco 15140122), and 5% Fetal Bovine Serum (FBS- Gibco A4736301). After waiting a few seconds, a gradient appeared in the tubes and only cells below the surface and above the large tissue pieces were extracted, filtered, and plated.
Each culture was created using 2-3 pups pooled together to ensure enough cells for the experiments. Neuronal enriched cultures were seeded at a density of 120,000 cells per well in 12-well plates in the plating medium. The next day, the medium was removed and replaced with serum-free growth medium. At day 3, the cells were treated with FUDR (25.0 mg 5-fluro-2-deoxyuridine, 62.5 mg uridine in 12.5 ml neurobasal-A medium) to inhibit astrocytic and glia cells proliferation, thereby rendering the culture neuronal rich. The cultures were incubated at 37°C with pH of 7.2 to 7.5 and a relative humidity of about 95%, and the growth medium was replaced every 3 days. Experiments were performed on day 21 of the culture. We repeated each experiment at least three times to ensure statistical reliability, each repetition is referred to as ‘cohort’ in the results section and it indicated a different pups’ sacrifice. The specific number of cohorts used in each experiment is indicated in the relevant results section.
Immunofluorescent labeling
Following the indicated treatments, primary cultures were fixed in Dulbecco’s Phosphate Buffered Saline (DPBS, Biological industries, 02-020-1A) containing 4% paraformaldehyde (PFA) at room temperature for 10 min and then permeabilized with 0.3% PBST (1X Phosphate-Buffered Saline, 0.1% Tween) for 10 min. After blocking in PBST containing 3% bovine serum albumin (BSA) and 3% donkey serum for 30 min at room temperature, the cells were incubated with primary antibodies (Abs) for 1 h (Details of Abs used are presented in Table 1). Afterwards, they were washed with 0.1% PBST three times and incubated with the appropriate secondary Abs for 1 h at room temperature (Details of Abs used are presented in Table 1). Co-labelling was done by using two separate primary Abs originating from different species. Utilizing distinct secondary Abs, which were attached to two different fluorophores, we were able to analyze the extent of colocalization of different proteins. Control experiment utilizing one of the two Abs revealed that there was no leakage of the staining of one of the parameters to the channel of the other parameter. Following immunostaining, the cells were washed three times in 0.1% PBST and mounted in ProLong Gold Antifade mounting medium (Molecular probes, P36931). Images were taken with confocal microscopy (Leica sp8) at X63 magnification followed by zoom X3 and quantified using Image Pro 10 image processing program (Media Cybernetics).
Table 1
A list of the primary and secondary antibodies (Abs) used in this study, as well as of the concentration used and their commercial source
| Ab | Host | Dilution Ratio | Company | Cat. Number | ||
| Primary Abs | Receptors | APOER2 | Rabbit | 1 : 500 | Santa Cruz Biotechnology | sc-20746 |
| IR | Rabbit | 1 : 500 | Abcam | ab137747 | ||
| VEGFR-2 | Rabbit | 1 : 500 | Cell Signalling | 55B11 | ||
| LRP1 | Rabbit | 1 : 500 | Abcam | ab92544 | ||
| Intracellular compartment | Rab5 (early endosomes) | Goat | 1 : 1000 | MyBioSource | MBS249664 | |
| Rab7 (late endosomes) | Goat | 1 : 1000 | MyBioSource | MBS448054 | ||
| CatD (lysosomes) | Goat | 1 : 1000 | Santa Cruz Biotechnology | Sc-6486 | ||
| Rab11 (recycling endosomes) | Rat | 1 : 500 | Abcam | ab95375 | ||
| Others | GFAP | Goat | 1 : 1000 | Sigma | G9269 | |
| NeuN | Goat | 1 : 1000 | Abcam | ab177487 | ||
| Secondary Abs | Donkey anti rabbit Alexa fluor 488nm | 1 : 1000 | Thermo Fisher Scientific | A11055 | ||
| Donkey anti goat Alexa fluor 647nm | 1 : 1000 | Thermo Fisher Scientific | A21206 | |||
| Donkey anti rat Alexa fluor 488nm | 1 : 1000 | Abcam | ab150155 | |||
Image analysis
Neuronal cultures were co-stained with two Abs simultaneously: an anti-receptor antibody and an anti-intracellular compartment antibody, which were coupled with a fluorophore labelled secondary Abs of different wavelength (488 nm and 633 nm for example). The capturing of each label (channel) was done separately using confocal microscopy. It is important to note that we selected neurons for the analysis by morphological distinction. The method we used for cell selection was that in each culture, we randomly selected 10 fields that were in a specific radius from the slide center, and in each field, we distinguished the neurons from other cell types morphologically and captured the neurons for analysis. We analyzed each neuron separately, and in each cohort, we captured at least 10 neurons for statistical analysis. The quantification of the results was done by averaging the values of all captured neurons. Using image processing program- Image Pro-10, the analysis of the images was then performed at the following two levels:
1. Each channel by itself:
a. For the receptors we chose to use Integrated Optical Density (IOD) which is equivalent to the pixels area times mean intensity. This value represents the number of receptors present in the region of interest.
b. For the compartments we choose to use the parameter “% area” to evaluate the total area of the compartments out of the region of interest.
2. The extent of colocalization:
This was measured utilizing the “M1” parameter which addresses the question: “How much of the receptor of interest is colocalized with the compartment of interest?”. M1 calculates the ratio of the receptors’ intensity that is colocalized with the compartment (S1icoloc), out of the total intensity of the receptor (S1i), as mathematically described below [64, 65]: This ratio is indicative of the percentage of the receptor which is colocalized to a specific compartment.
Cell surface biotinylation
To further investigate the receptors’ localization, we determined how much of the receptors are located on the external surface and is thus potentially active. For that end, we used cell surface biotinylation technique. This was done utilizing a commercially available kit (Pierce A44390) and performed according to the kit’s protocol. Specifically, neurons were washed with PBS once, and then incubated in PBS containing 0.5 mg/mL sulfo-NHS-SS-biotin (Pierce cell surface protein biotinylation and isolation kit- A44390) for 30 min at 4°C with shaking. Excess reagent was quenched by rinsing in cold PBS containing 50 mM glycine. These cells were then lysed with RIPA buffer (Sigma- 89900) containing protease inhibitor cocktail for 20 min at 4°C. After which, the cell lysate was centrifuged at 10,000 g for 10 min, and the supernatant was collected. After protein quantification with BCA kit (Pierce- 23225), cell lysates with the same amount of protein were incubated with 100uL of NeutrAvidin agarose kit- A44390) for 30 min. Agarose beads were washed three times in PBS containing protease inhibitor cocktail and the labeled proteins were eluted using the elusion buffer supplied in the kit. The levels of biotinylated surface proteins and total proteins were analyzed by ELISA.
ELISA
Levels of LRP1, APOER2, IR, and VEGFR were determined by ELISA according to the manufacturer instructions (LSBio Mouse APOER2/LRP8 kit- LS-F15529, LSBio Mouse LRP1/CD91 kit- LS-F33153, LSBio Mouse INSR/Insulin Receptor kit- LS-F9939 and LSBio Mouse KDR/VEFGR2/FLK1 kit- LS-F2595). In brief, plates pre-coated by the manufacture with capture antibodies specific to each of the receptors were used. The corresponding receptors which bound to the plates were then reacted with a biotin-conjugated detection antibody directed specifically at the receptor. The second anti-receptor antibody which bound to the corresponding receptor were than visualized by Avidin-Horseradish peroxidase (HPR) which results in color formation. A sulfuric acid stop solution was added to terminate the reaction followed by measurements of optical density at 450 nm. The amount of receptor thus bound to the plates was calculated utilizing a standard curve (provided with the kit).
Western blotting
Conditioned media from neuronal cultures were collected at day 21 of the culture and were aliquoted and stored at –70°C. The samples were mixed with sample buffer and boiled for 10 min prior to gel electrophoresis, after which the electrophoresis and immunoblot assays were performed utilizing anti-ApoE antibody 1 : 10,000 (goat anti-ApoE, Santa Cruz, sc-6384). A scale for quantitative results of ApoE levels was prepared of known quantities of recombinant ApoE. The immunoblot bands were visualized utilizing the ECL chemiluminescent substrate (Pierce), after which the bands were imaged using Bio Rad chemidoc touch imaging system and quantified utilizing image j, image processing software.
CRISPR/CAS9
To elucidate the involvement of specific ApoE receptors, we knocked them down by genome editing as previously described [66, 67] with the following modifications. Guide RNA (gRNA) sequences, directed at either APOER2 or LRP1, were designed and cloned into Adeno-associated virus (AAv) by VectorBuilder company. The viruses cloned with the gRNAs and the Cas9 were introduced to the neurons at a ratio of 1 : 1 on day 3 of the culture for an overnight incubation at 37°C. This was performed by diluting 105 gene copies from the vials supplied by the company in neuronal media and applying it directly on the prewashed cells. On the following day, the virus-containing media was removed and replaced with fresh growth medium. The cells were collected for immunofluorescent labeling after 10 days. Details regarding the AAvs from the VectorBuilder company are presented in Table 2 below.
Table 2
Details of the designed AAvs containing either gRNA directed at APOER2, gRNA directed at LRP1, or Cas9
| Target | Cat. Number | Description |
| APOER2 | AAV9 S (VB200212-1070wfu) | pAAV[2gRNA]-U6 > mLrp8[gRNA#1]-U6 > mLrp8[gRNA#2]-CMV mKate2: WPRE (Vector ID:VB200212-1070wfu) Custom single-gRNA AAV9 virus (no Cas9) (>1011 GC/ml, 10x 25μl, PBS buffer) |
| EGFP control AAV9 virus (>1011 GC/ml, 100μl, PBS buffer), made from vector: VB190926- 1395dab | ||
| LRP1 | AAV9 S (VB200511-1421qaq) | pAAV[2gRNA]-U6 > mLrp1[gRNA#1]-U6 > mLrp1[gRNA#2]-CMV>mKate2: WPRE (Vector ID:VB200511-1421qaq) Custom single-gRNA AAV9 virus (no Cas9) (typical titer:>1012 GC/ml, minimum titer:>2x10¹¹ GC/ml, 10x25μl, PBS buffer) |
| EGFP control AAV9 virus (>2x10¹¹ GC/ml, 1000μl, PBS buffer), made from vector: VB190926- 1395dab | ||
| Cas9 | AAV9M (VB200212-1013fen) | pAAV[Exp]-SYN1 > SaCas9(Vector ID:VB200212- 1013fen) Custom gene expression AAV9 virus (>1011 GC/ml, 10x 100μl, PBS buffer) |
| EGFP control AAV9 virus (>1011 GC/ml, 2x 100μl, PBS buffer), made from vector: VB190926- 1395dab |
To determine the working concentration, neurons were transduced at a multiplicity of infections ranging between 104 to 106 genome copies, as recommended by the VectorBuilder company. The first step was to calibrate the system to reach optimal genome copies. This yielded a desired working concentration that is equal to 105 genome copies per well. The transfection of the cells was evaluated daily using microscopy since the vectors themselves were florescent, we choose this concentration as it achieved maximum transfection while maintaining maximal cell viability. Additionally, it is important to note that the analysis of the cells was based on their transfection, meaning that only positively transfected cells were further analyzed in the experiments.
Statistical analysis
Statistically significance was analyzed utilizing the GraphPad Prism software (Version 9.5.1). Experiments that contained two groups were analyzed using Student’s T-test, whereas experiments with more than two groups were analyzed using ANOVA, followed by further post hoc Bonferroni analysis to test for individual effects, and these findings are depicted in the figures. A p value of < 0.05 was considered statistically significant.
It is important to note that in the immunofluorescent experiments, a minimum of two cohorts were used for each condition (APOE3, APOE4, APOE-KO, with and without treatment); each group contained at least 10 neurons that were captured and analyzed. as previously mentioned, (‘image analysis’ subsection in ‘materials and methods’), the analysis variable chosen for the receptors was IOD, which shows the area labeled multiplied by the intensity of the labeling, thus giving us the best metric for the quantity of the protein in a specific area. For the compartments, we choose % Area, which is a variable that calculate the percentage of the area labeled by the Abs, to the total area, thus showing the exact area of the compartment, with no regard to the levels of the marker used to identify the compartment. For the colocalization between each receptor and compartment we choose the variable M1 (see detailed explanation in the image analysis section above).
The biochemical results that were obtained by biotinylation, ELISA or blots, were performed on three cohorts with each cohort containing a pool of neurons of at least two mice, and they are presented jointly after normalization of each of the experiments relative to the APOE3 control group. Similar results were obtained when the cohorts were analyzed separately, and thus no covariance was conducted.
RESULTS
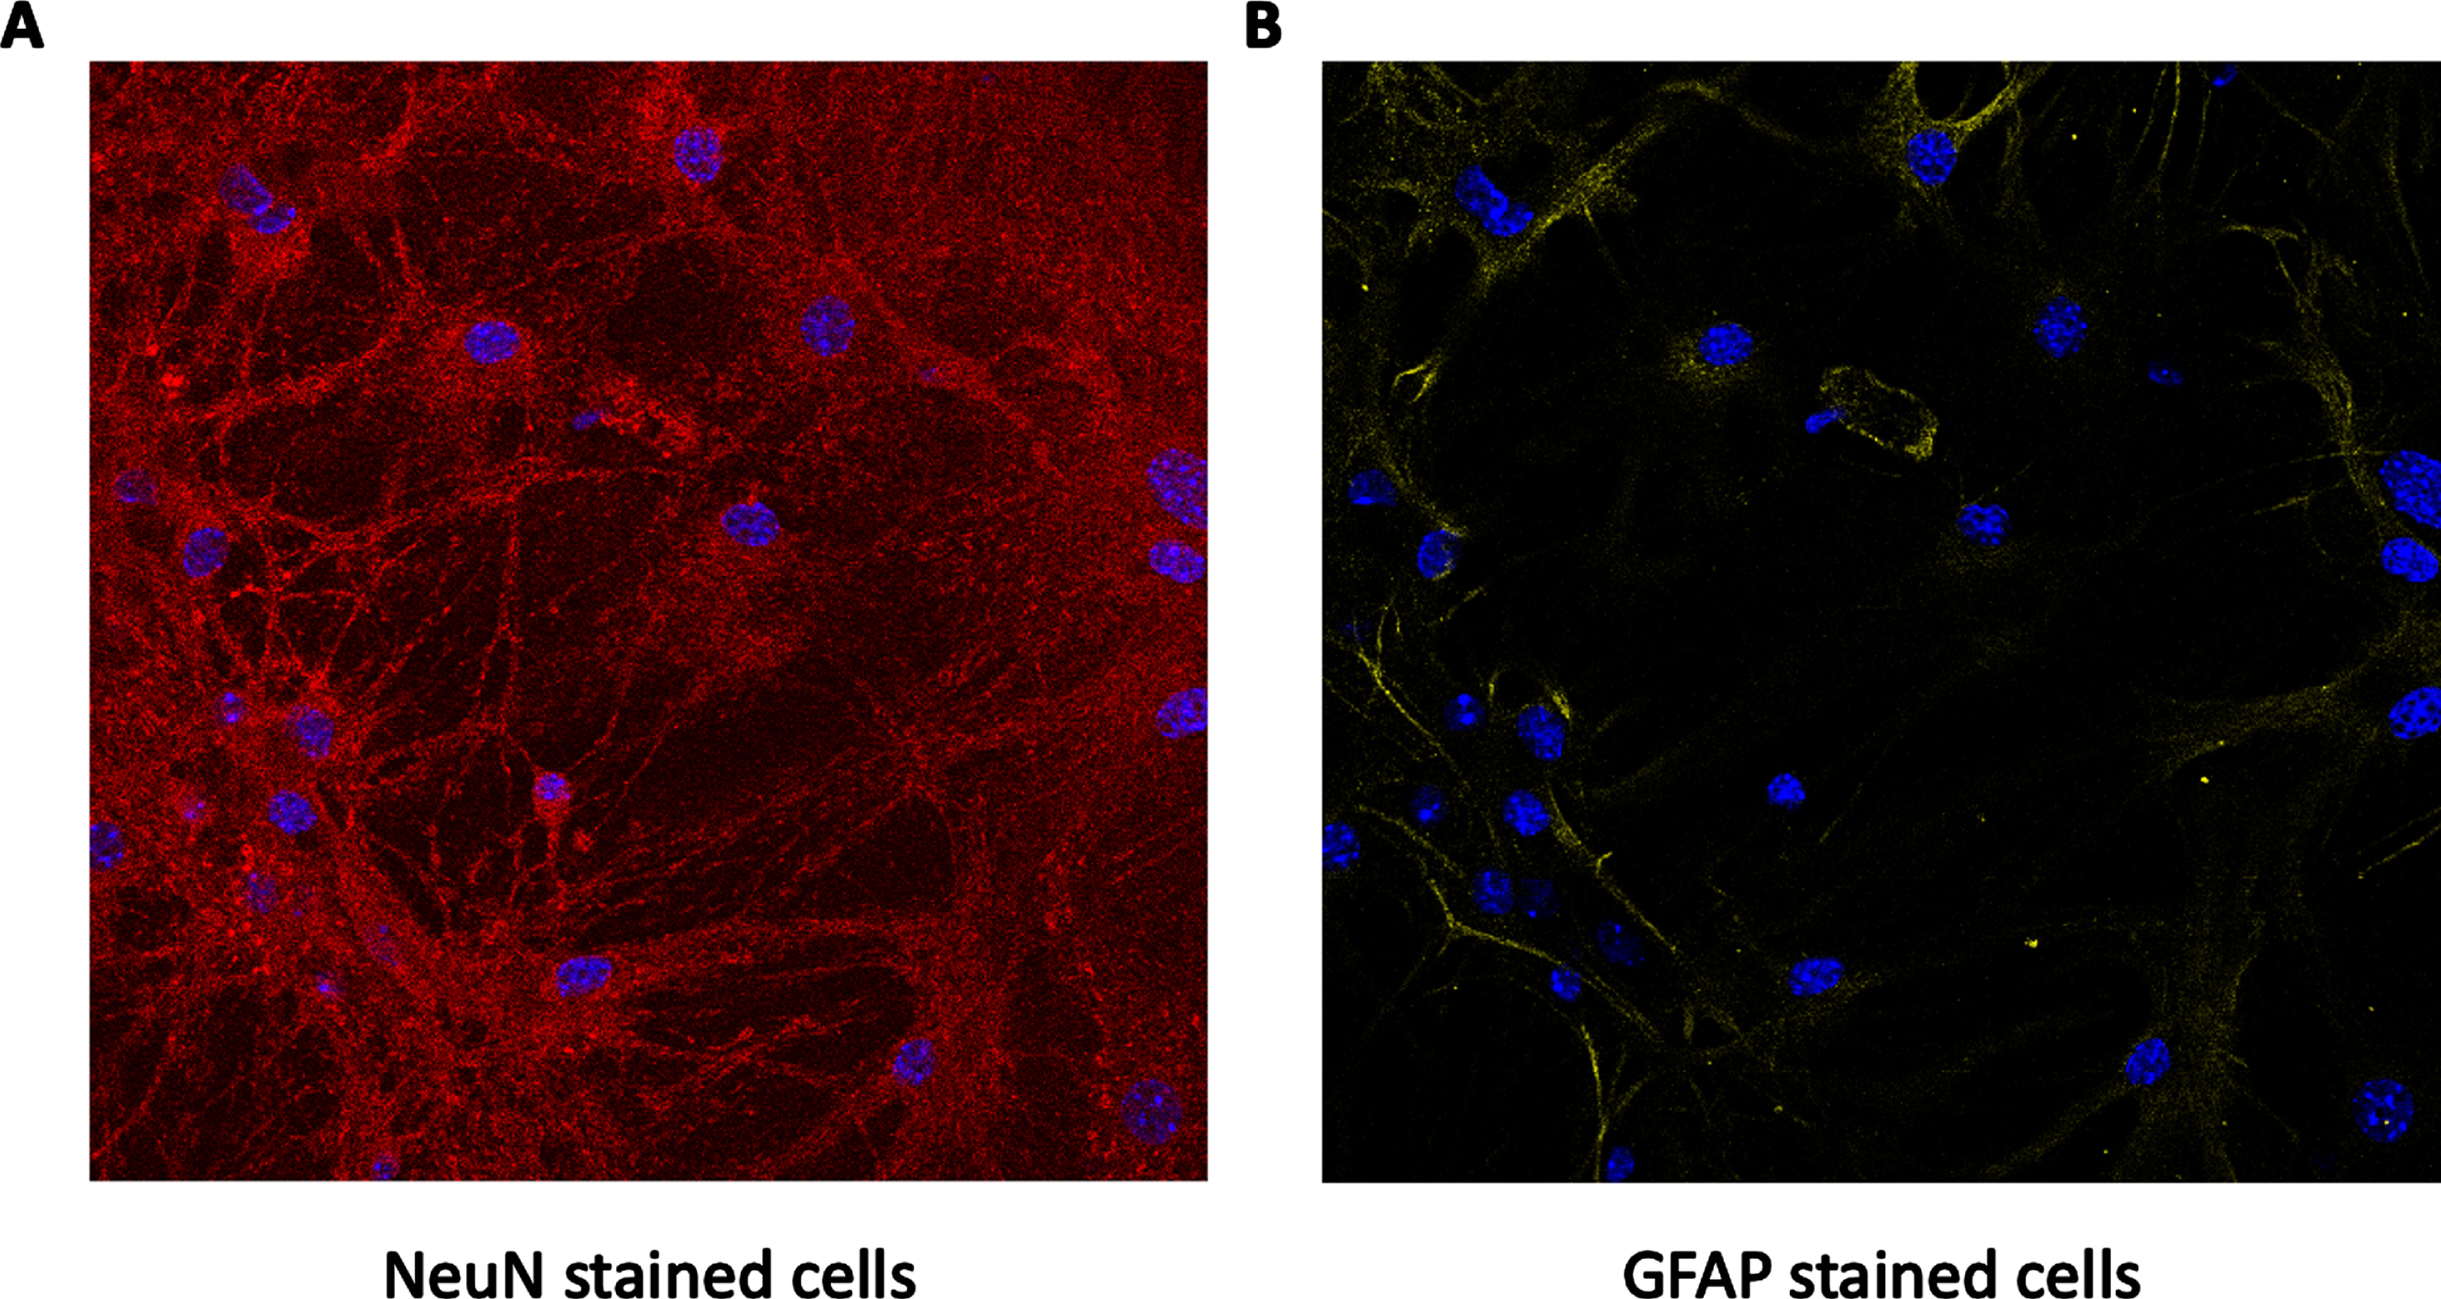
Primary cultures were prepared as detailed in the materials and methods section. To assess their neuronal specificity, we evaluated the neuronal/astrocytic ratio by staining them for both NeuN (a neuronal marker) and GFAP (an astrocytic marker). Utilizing confocal microscopy, 20 stacks (Z-stacks) were captured (1μm apart), and each section was analyzed individually. The stacks included the whole volume of the cultures. Analysis of the images revealed that GFAP staining was present only in the lower sections (close to the plate), and that NeuN staining was present in more sections, specifically, in the upper sections. Additionally, further staining of the cultures were analyzed for each cell individually, and those cells had the structure and shape of neurons. Based on this data, we can determine that the culture used was primarily neuronal, and the neurons were surrounded by astrocytic extensions. Representative images are shown in Fig. 1.
Fig. 1
Neurons/astrocytes ratio in primary cultures. Primary cultures were stained for both NeuN (marked in red in A) and GFAP (marked in yellow in B). DAPI staining for cells’ nucleus is marked in blue. As can be seen, the levels of NeuN were much higher than those of GFAP, and together with the DAPI staining indicate that the culture is mostly neuronal, as expected.
The effects of APOE genotype on the levels and surface distribution of ApoE and growth factor receptors
The effect of APOE genotype on the levels of LRP1 and APOER2
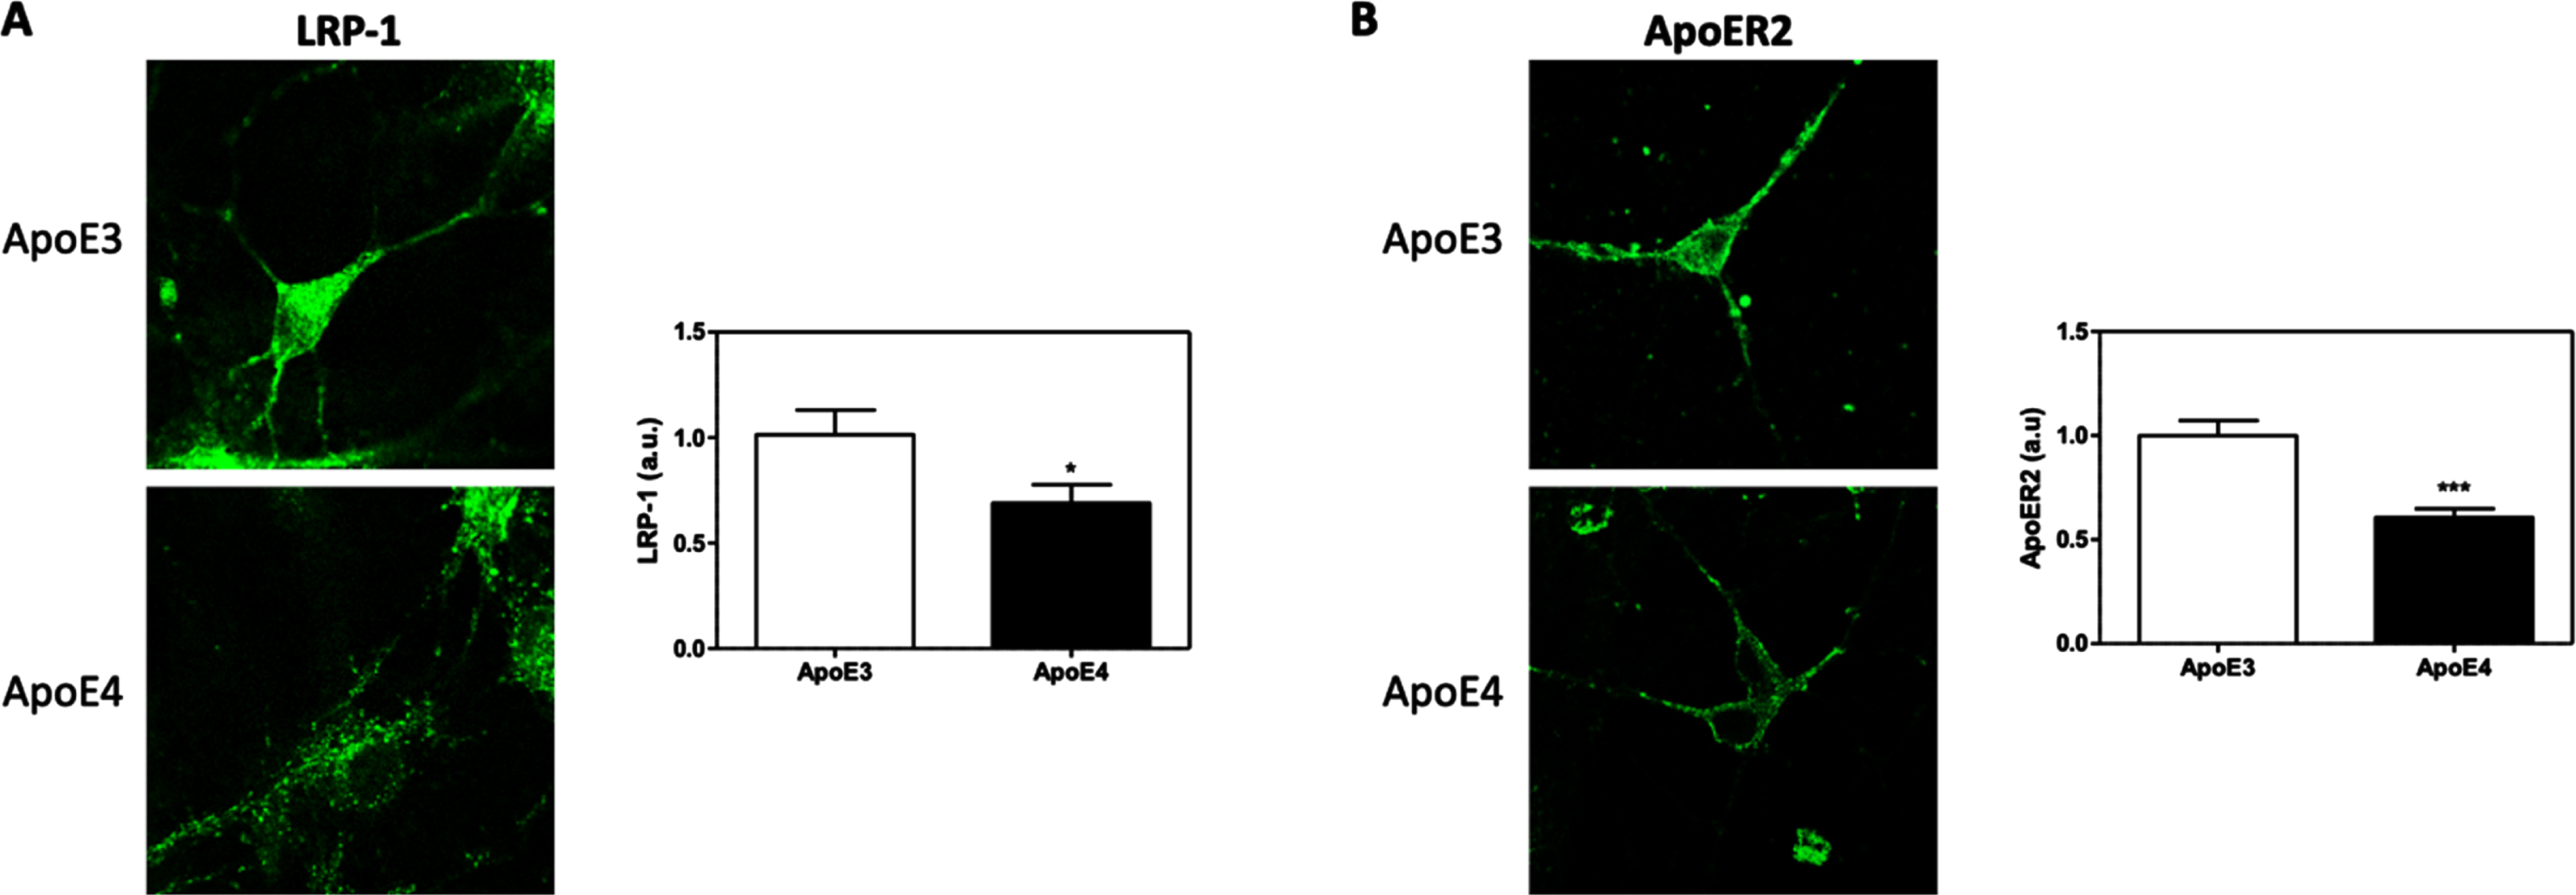
These experiments investigated the effects of the different APOE genotypes on the levels of the neuronal ApoE-receptors; LRP1 and APOER2. This was performed utilizing immunofluorescent staining of the primary APOE4 and APOE3 cultures with anti-LRP1 and anti-APOER2 antibodies. Utilizing an image processing program, the integrated optical density (IOD) of each parameter was evaluated. This analysis revealed significant decrease in the levels of both LRP1 (Fig. 2A) (32.05% reduction, p < 0.05) and APOER2 (Fig. 2B) (39.26% reduction, p < 0.0001) in the APOE4 neurons, in comparison to APOE3 neurons.
Fig. 2
The effects of APOE genotypes on the total levels of APOER2 and LRP1 in APOE3 and APOE4 primary neurons. APOE3 and APOE4 primary neurons were stained for LRP1 (A) and APOER2 (B). Representative images are shown on the left, whereas quantifications of the results are shown on the right. The results show a significant downregulation, in APOE4 neurons, of the levels of both LRP1 (APOE3 = 1.00±0.11, APOE4 = 0.68±0.086, p < 0.05, N = 53–58 cells from 4 different preparations) and APOER2 (APOE3 = 1.00±0.071, APOE4 = 0.60±0.040, p < 0.0001, N = 86–101 cells from 6 different preparations). The scalebar on the images indicate 10μm. *indicates p < 0.05, ***indicates<0.001.
The effects of APOE genotype on growth factor receptors, IR and VEGFR
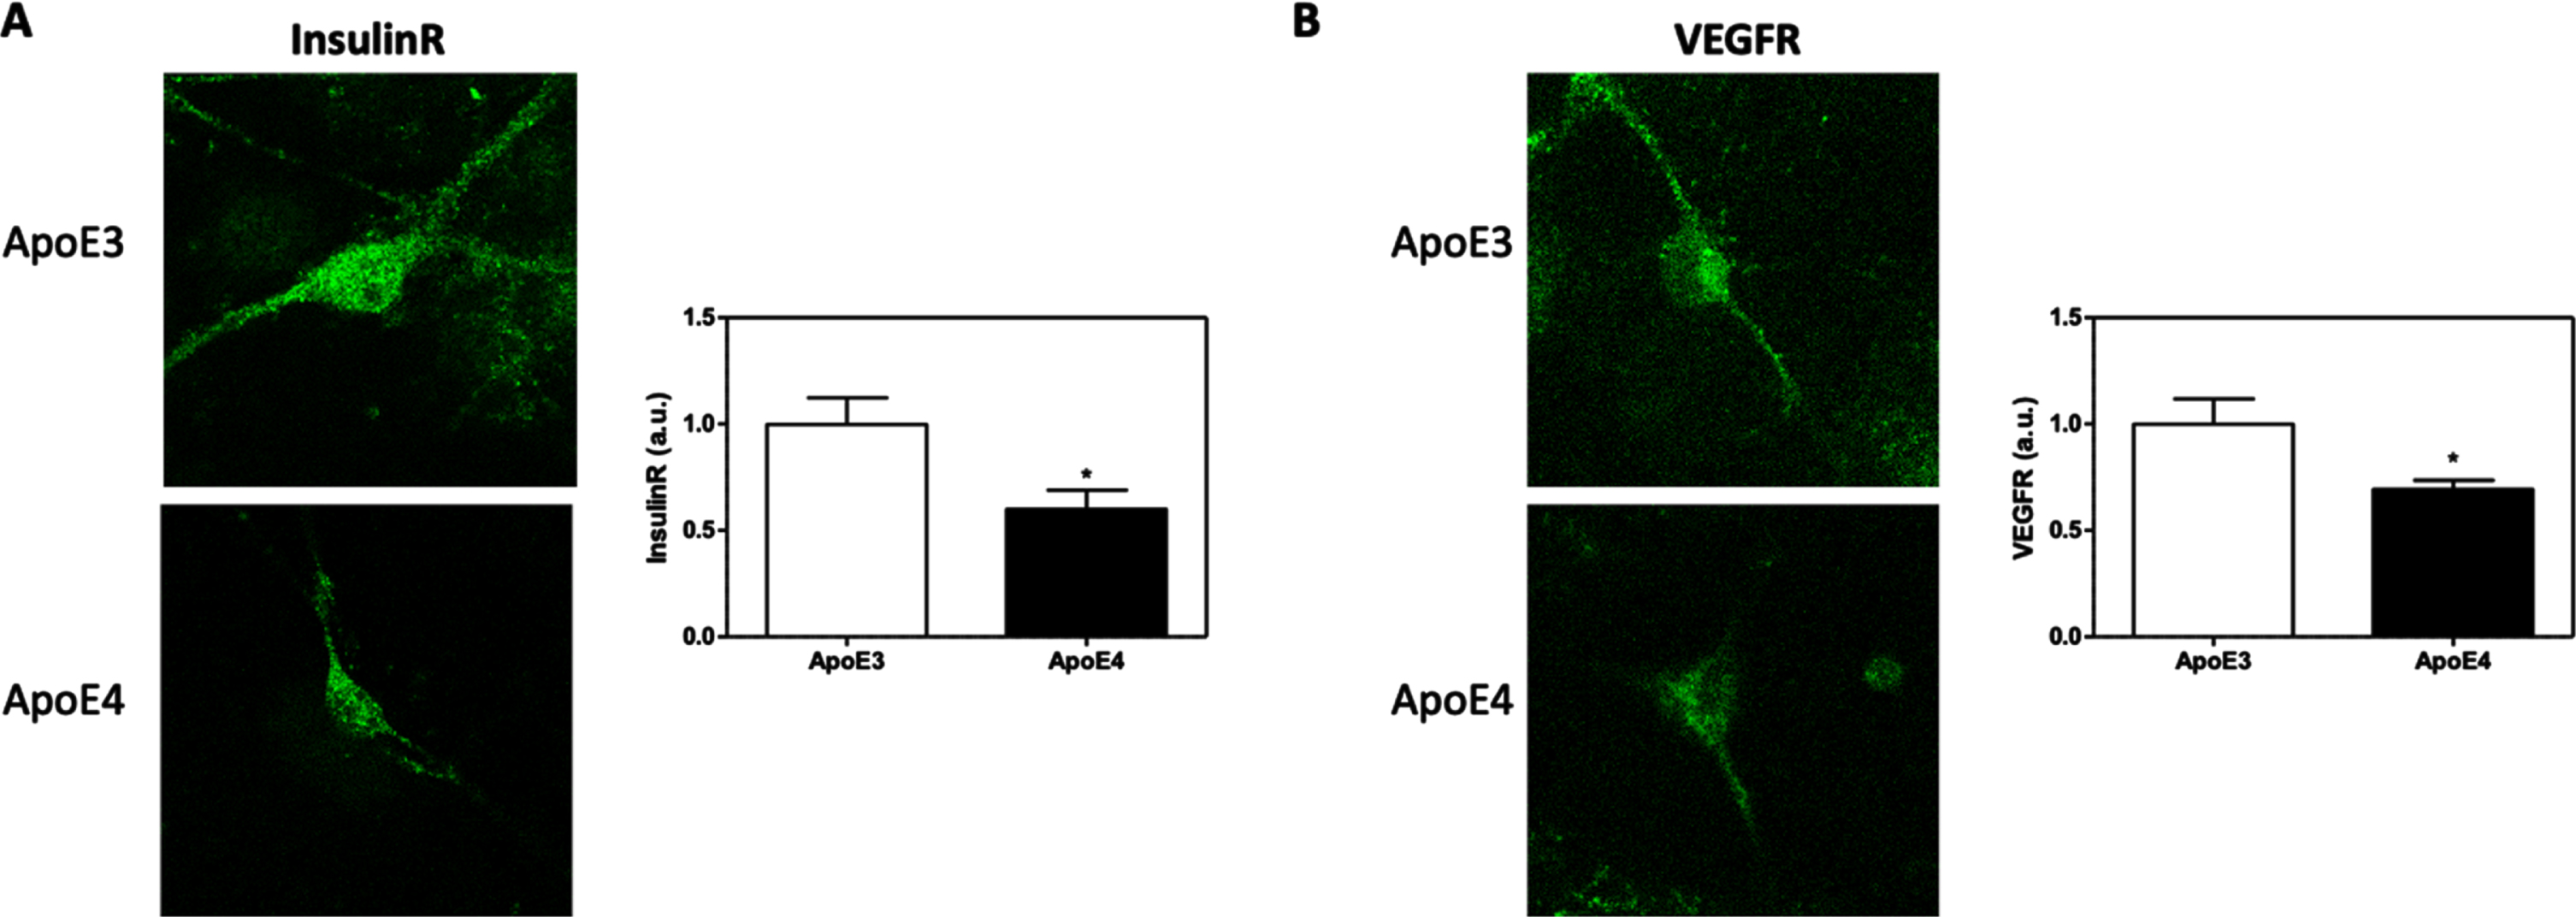
The effects of APOE genotype on the levels of IR and VEGFR were evaluated using immunofluorescent staining. The results thus obtained are presented in Fig. 3. These results indicate that the levels of both IR and VEGFR are lower in APOE4 neurons when compared to APOE3 neurons (IR: 40% decrease, p < 0.05. VEGFR:30.73% decrease, p < 0.05).
Fig. 3
The effects of APOE genotype on the total levels of IR and VEGFR. APOE3 and APOE4 primary neurons were stained for IR (A) and VEGFR (B). Representative images are shown on the left, whereas quantifications of the results are shown on the right. The results show that both IR (APOE3 = 1.00±0.12, APOE4 = 0.59±0.08, p < 0.05, N = 48–68 cells from 4 different preparations), and VEGFR (APOE3 = 1.00±0.11, APOE4 = 0.69±0.04, p < 0.05, N = 41–46 cells from 4 different preparations) are downregulated in APOE4 primary neurons. The scalebar on the images indicate 10μm. *p < 0.05.
The effect of APOE genotype on the external membranal expression of the receptors
To measure the percentage of the receptors which are localized on the external surface of the plasma membrane, we used the surface biotinylation assay. The corresponding total levels were obtained using lysates of corresponding cultures. Total and biotinylated levels of the receptors were then obtained by ELISA. The resulting surface/total ratios of the different receptors are presented in Fig. 4. The results obtained show that the ratio of the externally oriented receptors to the total, was significantly lower in APOE4 neurons of APOER2 (Fig. 4A, 53% reduction, p < 0.05) and LRP1 (Fig. 4B, 48.03% reduction, p < 0.05) than those of the corresponding APOE3 cells. Similar, though less prominent, pattern was evident in IR (Fig. 4 C, 28.77% reduction, p = 0.07), and VEGFR (Fig. 4D, 9.90% reduction, p = 0.15).
Fig. 4
The APOE genotype’s effects on the surface-to-total ratio of APOER2, LRP1, IR, and VEGFR. External membranal proteins were labelled using a biotinylating kit. Subsequently, using commercial ELISA kits directed at the specific receptors investigated, both the biotinylated extract and the total lysates were evaluated and the surface to total ratio was calculated. The results obtained show that APOE3 cells whose levels were set as 100%, while APOE4 cells had significantly lower surface levels of APOER2 (APOE3 = 100% ±11.08, APOE4 = 47.02% ±8.54, p < 0.05, N = 3) and LRP1 (APOE3 = 100% ±4.88, APOE4 = 51.97% ±15.50, p < 0.05, N = 3). A similar trend was seen in IR (APOE3 = 100% ±8.26, APOE4 = 71.23% ±13.75, p < 0.05, N = 3, p = 0.07, N = 3), and VEGFR (APOE3 = 100% ±1.34, APOE4 = 91.10% ±2.82, p < 0.05, N = 3, p = 0.15, N = 3). *p < 0.05.
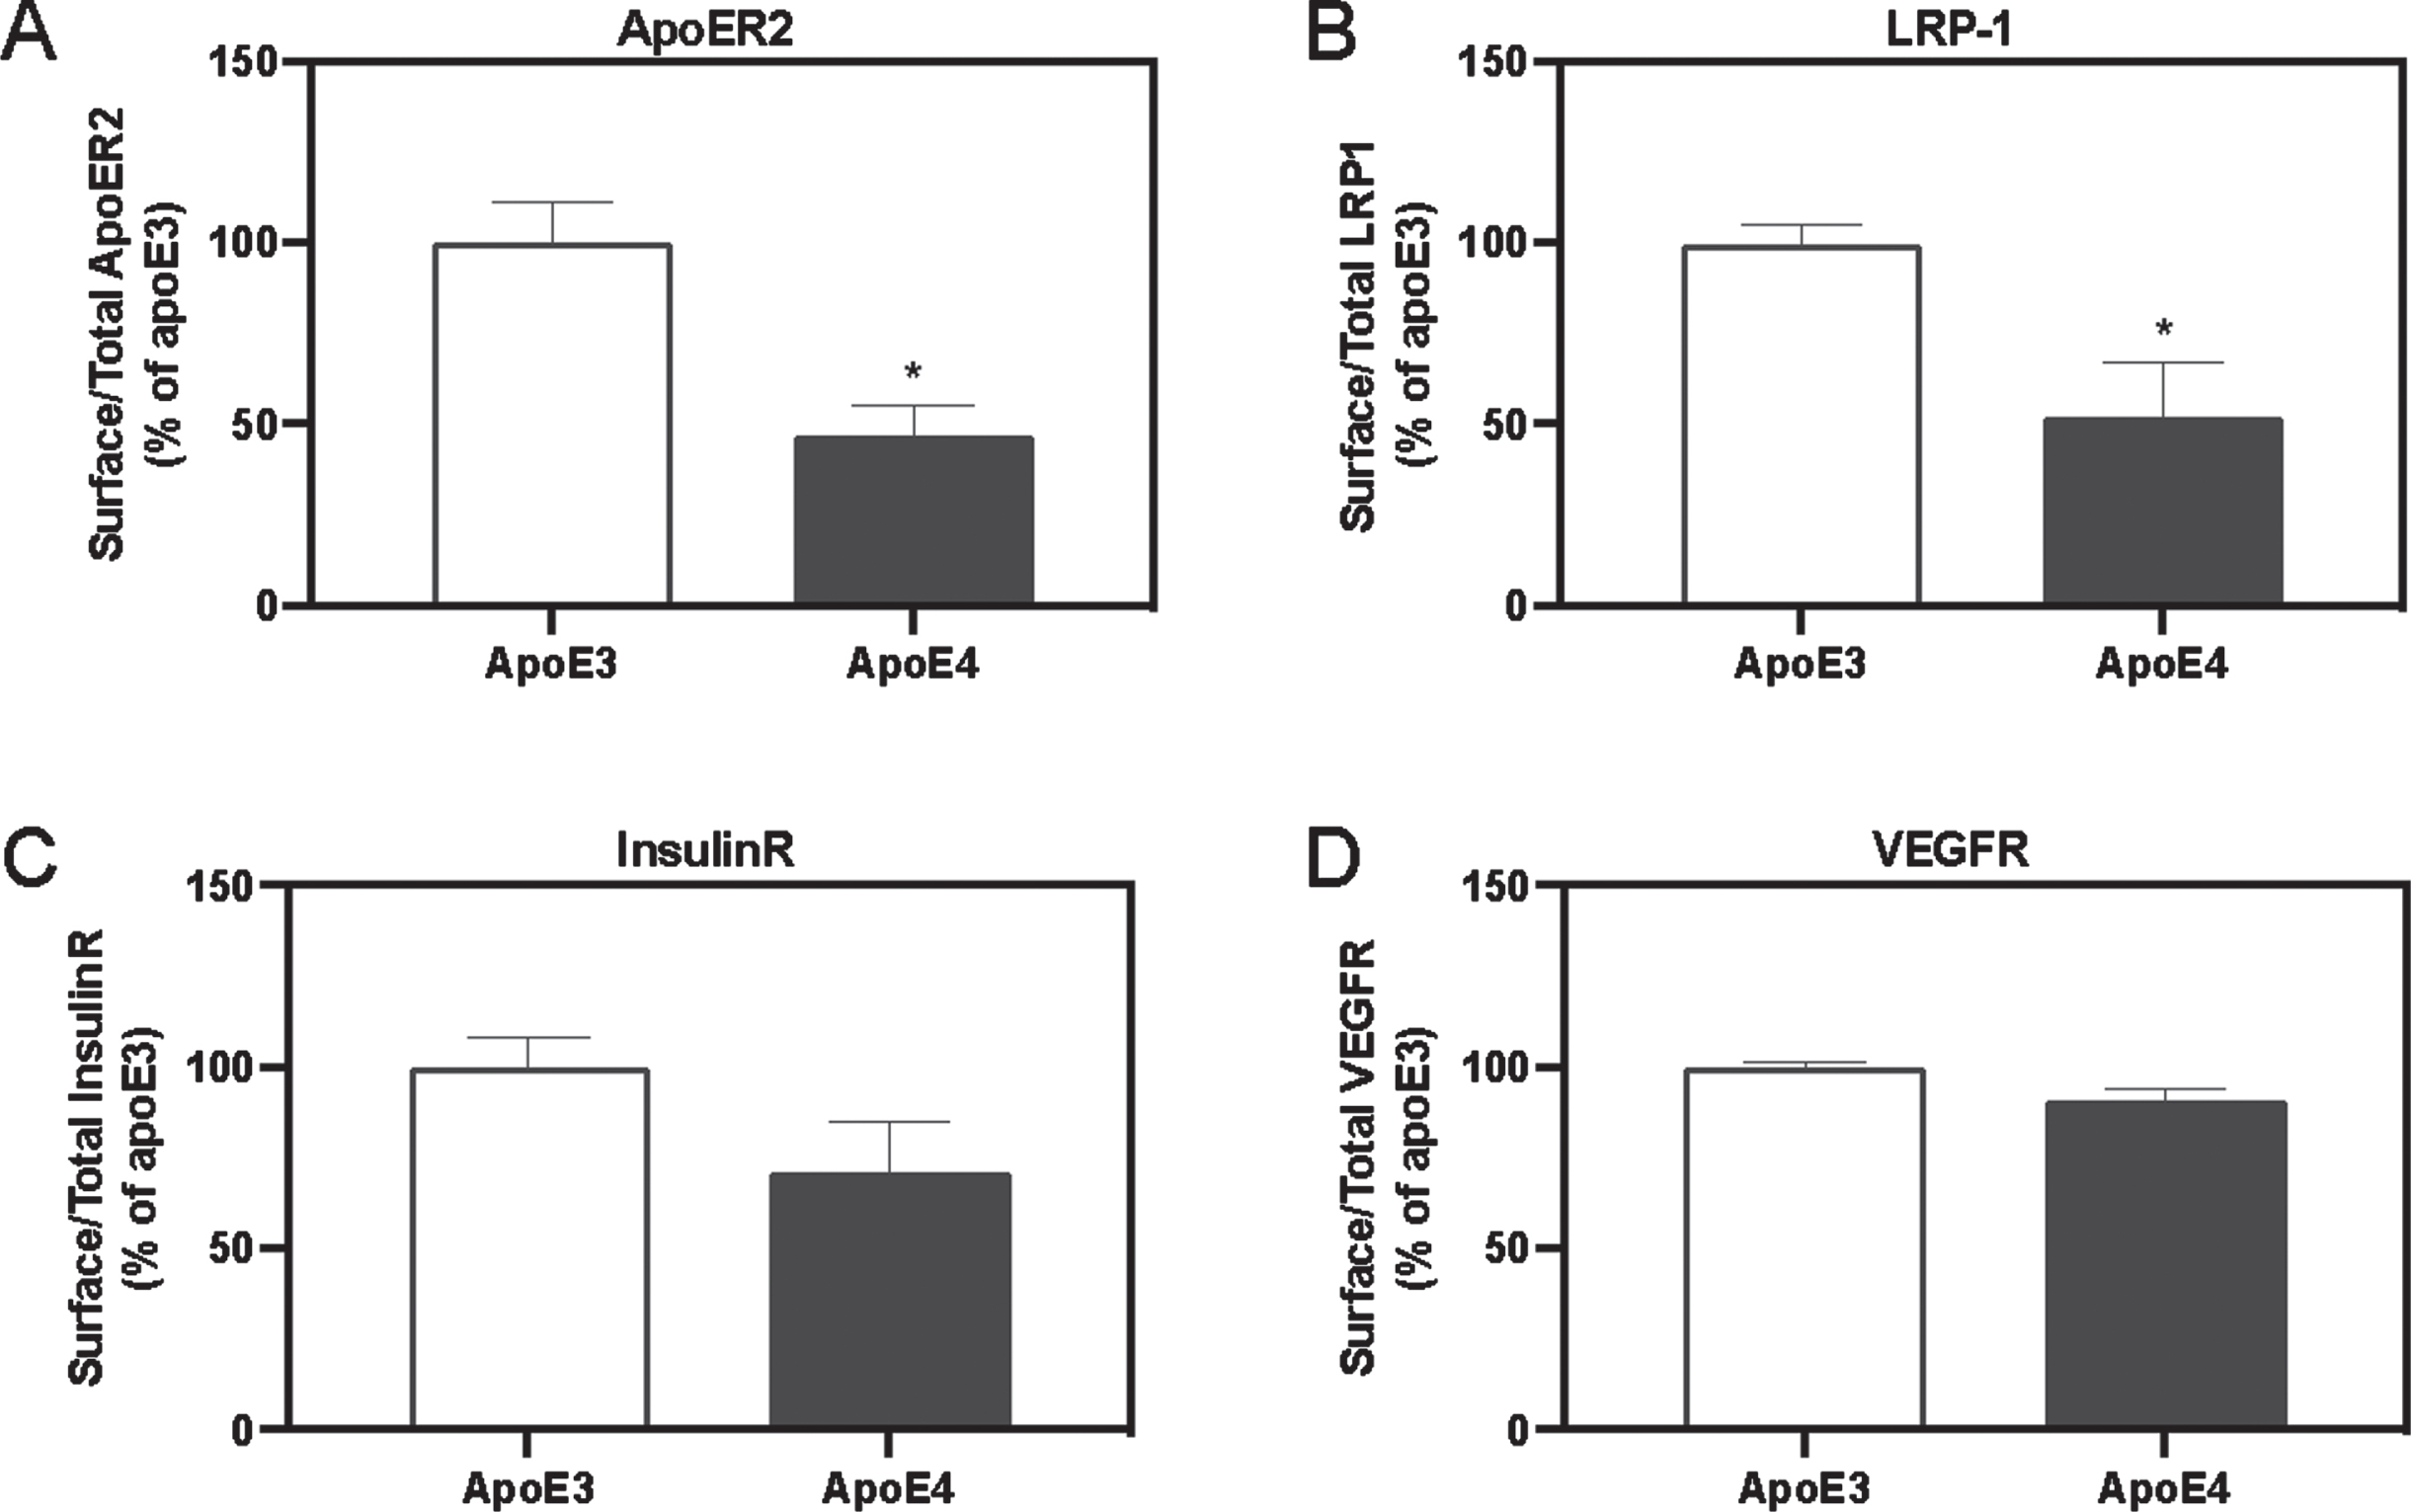
These results indicate that in addition to the decrease in the total levels of APOER2, LRP1, IR and VEGFR in APOE4 neurons, their relative presentation on the external membrane, is also decreased.
The effects of APOE genotype on the intracellular compartmentation of the receptors
Next, we investigated the extent to which the surface reduction of the four receptors is associated with changes in their intracellular compartmentation. Accordingly, neuronal cultures were stained simultaneously with two labels; an anti-receptor antibody and an anti-intracellular compartment antibody, and then analyzed by confocal microscopy. The images were analyzed as described in the materials and methods section, for each label separately, as well as for the colocalization of the labels.
In the following section, the results of the colocalization analysis of all four receptors with early endosome (marked by Rab5), late endosomes (marked by Rab7), lysosomes (marked by CatD) and recycling endosomes (marked by Rab11) are presented.
Colocalization of ApoE receptors with early endosomes
Figure 5 presents the effects of the APOE genotype on the levels of LRP1 and APOER2 in early endosomes, as well as their colocalization. This experiment revealed that the levels of the ApoE receptors in APOE4 neurons was lower than those of APOE3 neurons, a result that is consistent with the results shown in Fig. 2. On the other hand, the APOE genotype had no significant effect on the levels of Rab5, which is a marker for early endosomes (see Fig. 7 for the quantification of the early endosomes area).
Fig. 5
Colocalization of ApoE receptors with early endosomes. The total levels of both LRP1 and APOER2 were downregulated in APOE4 neurons when compared to APOE3 neurons (see representative figures on the left and in Fig. 2) In contrast, the area covered by the early endosomes staining was not affected by the APOE genotype (see Fig. 7). The extent of colocalization of LRP1 (A) and APOER2 (B) with the early endosomes were determined utilizing double staining and confocal microscopy, followed by M1 colocalization analysis. Representative images, shown on the left side of the figure whereas the quantified results are shown on the right. The results revealed that LRP1 was significantly more localized to the early endosomes in APOE3 neurons (0.24±0.02) than the APOE4 neurons (0.11±0.01, p < 0.001), while APOER2 showed an opposite effect where the receptors were significantly more localized with the early endosomes in APOE4 (0.50±0.04) than the APOE3 neurons (0.37±0.037, p < 0.05). The scalebar on the images indicate 10μm. *p < 0.05, ***p < 0.001.
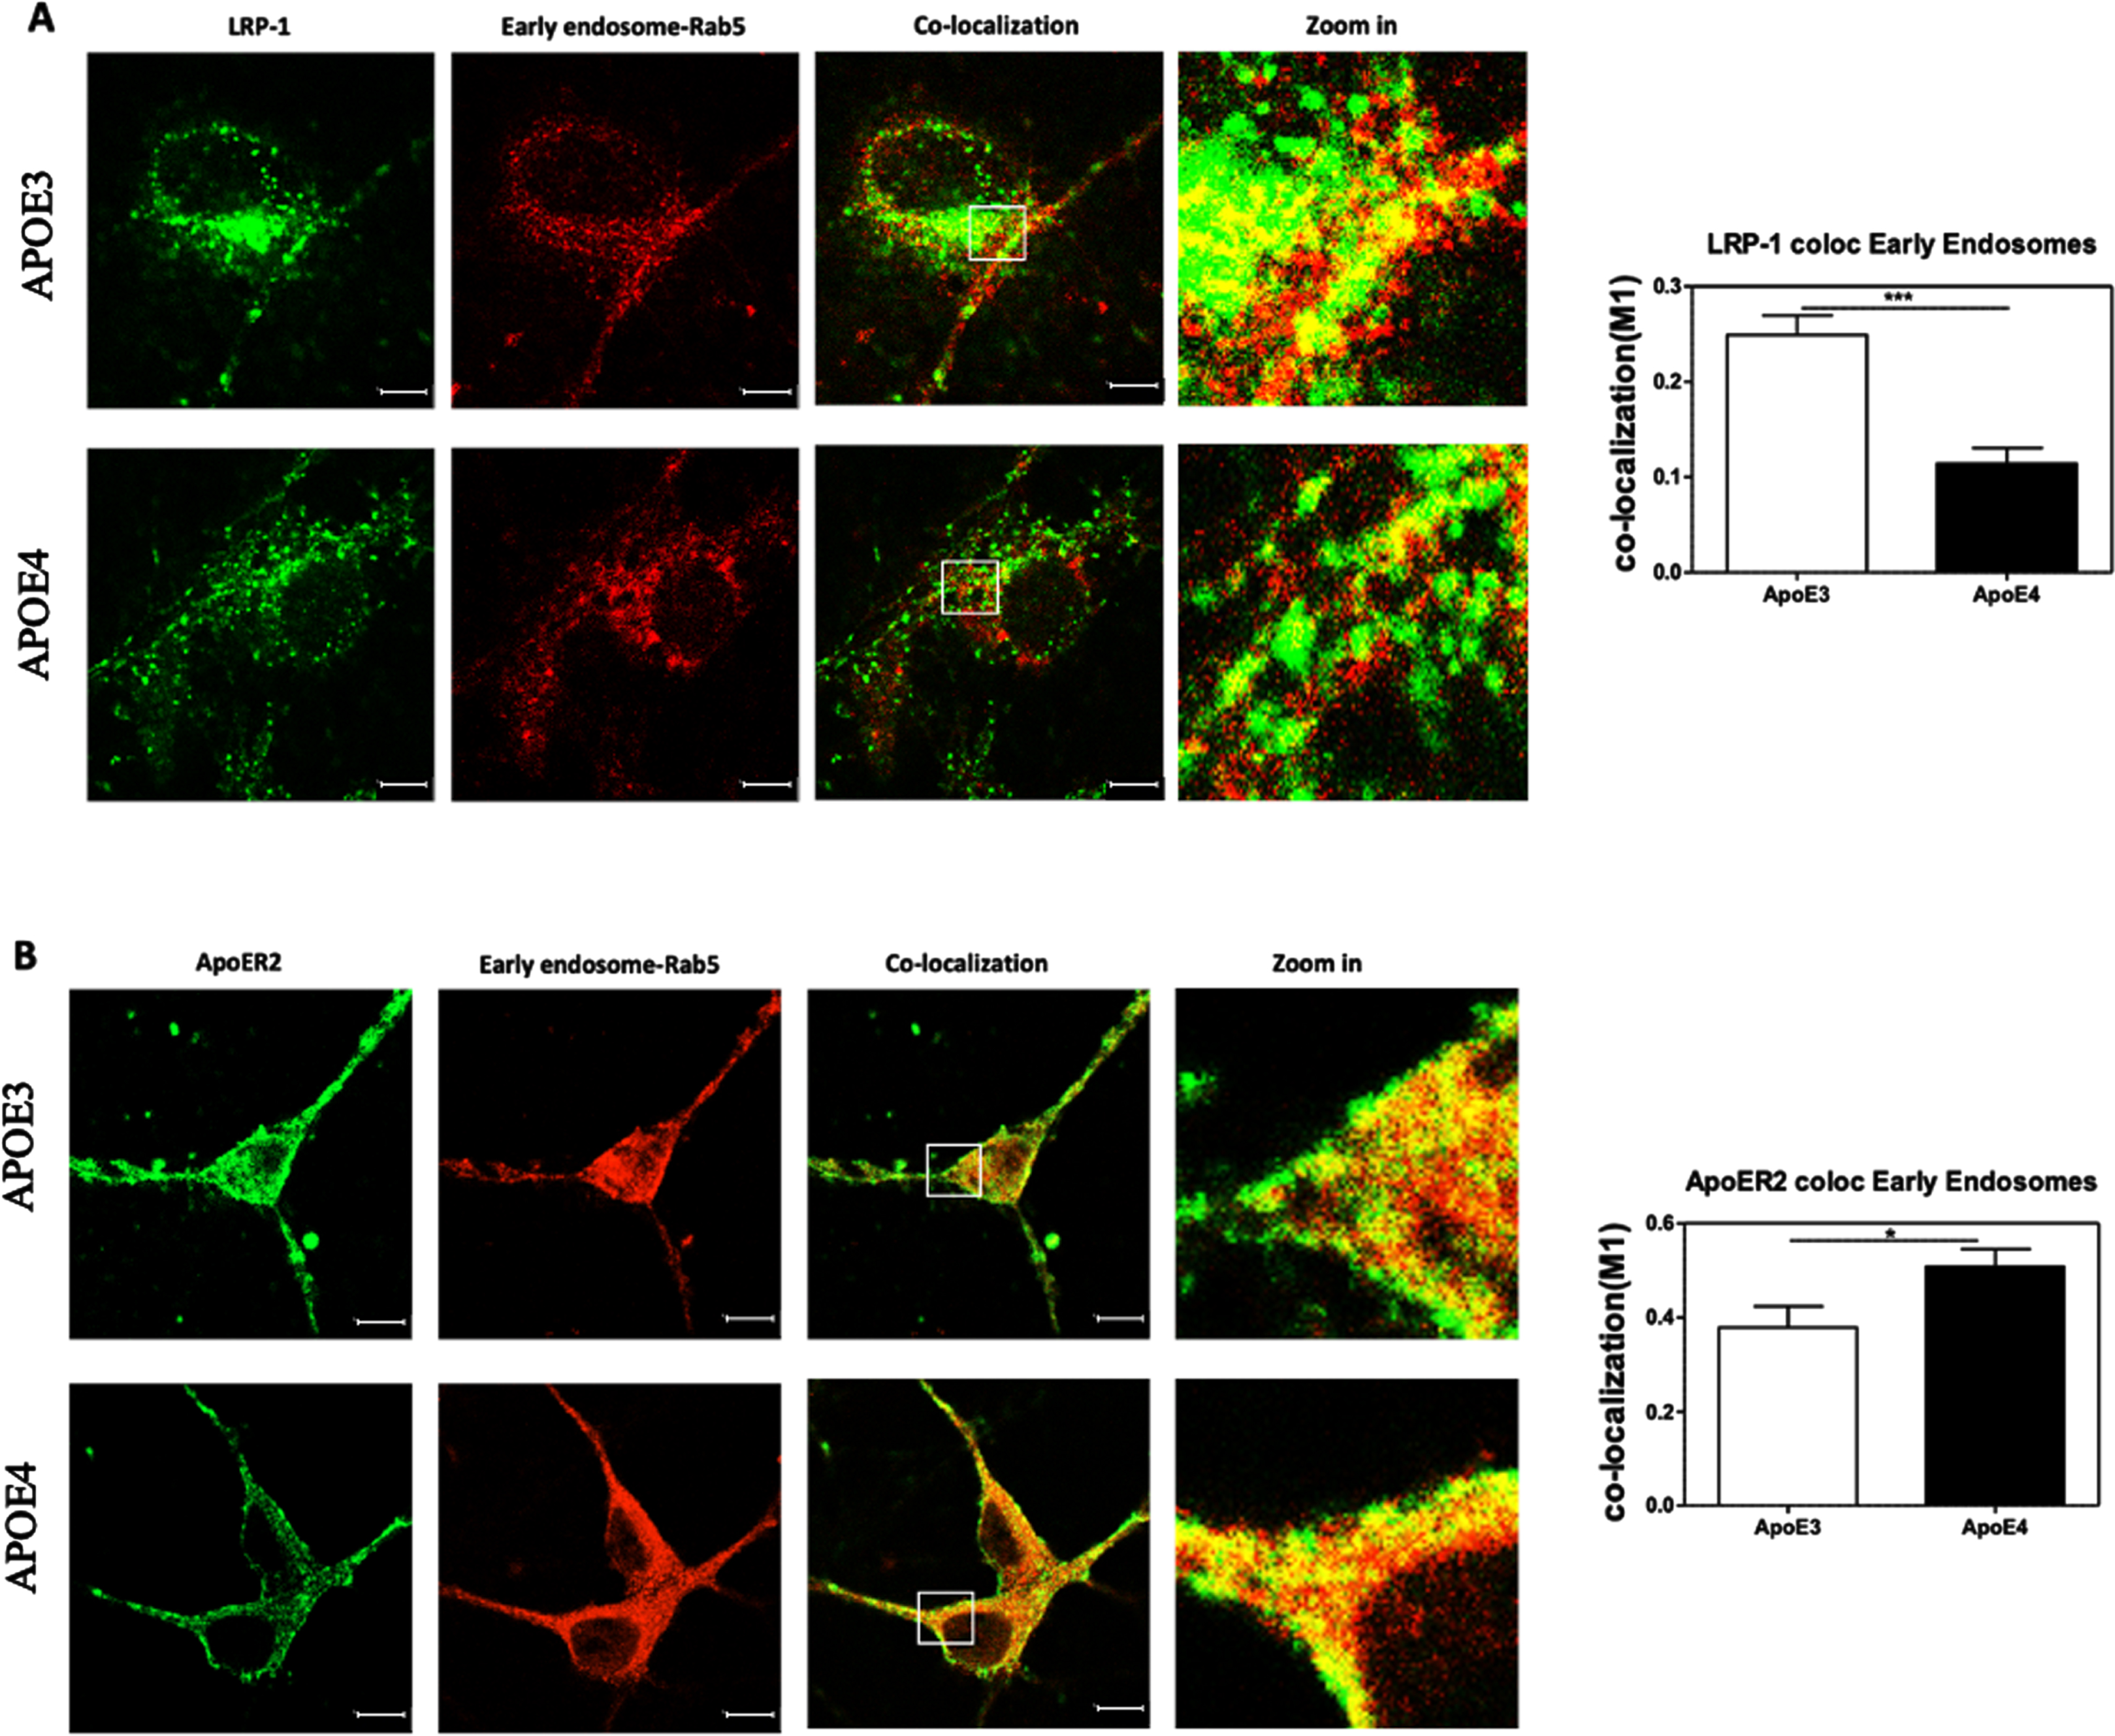
Evaluation of the extent of colocalization of the ApoE receptors with the early endosomes (marked in yellow pixels in Fig. 5) revealed that there is a greater localization of LRP1 in early endosomes in APOE3 neurons (0.24±0.02, N = 21 from 2 different preparations) compared to APOE4 (0.11±0.016, N = 27 from 2 different preparations). This difference between the APOE4 and the APOE3 cells is highly significant (p < 0.001). Similar analysis of the effect of the APOE genotype on the colocalization of APOER2 with the early endosomes revealed an opposite effect to that seen with LRP1; Accordingly, more APOER2 is localized in the early endosomes in APOE4 cells as indicated by the M1 colocalization variable described in the material and methods section (0.50±0.03, N = 31 from 3 different preparations) than in the APOE3 cells (0.37±0.04, N = 20 from 3 different preparations) neurons (p < 0.05). Taken together these results show that localization of the ApoE receptors to the early endosome is dependent on APOE genotype, and that this effect differs between LRP1 and APOER2.
Evaluating the extent of colocalization of growth factor receptors with early endosomes
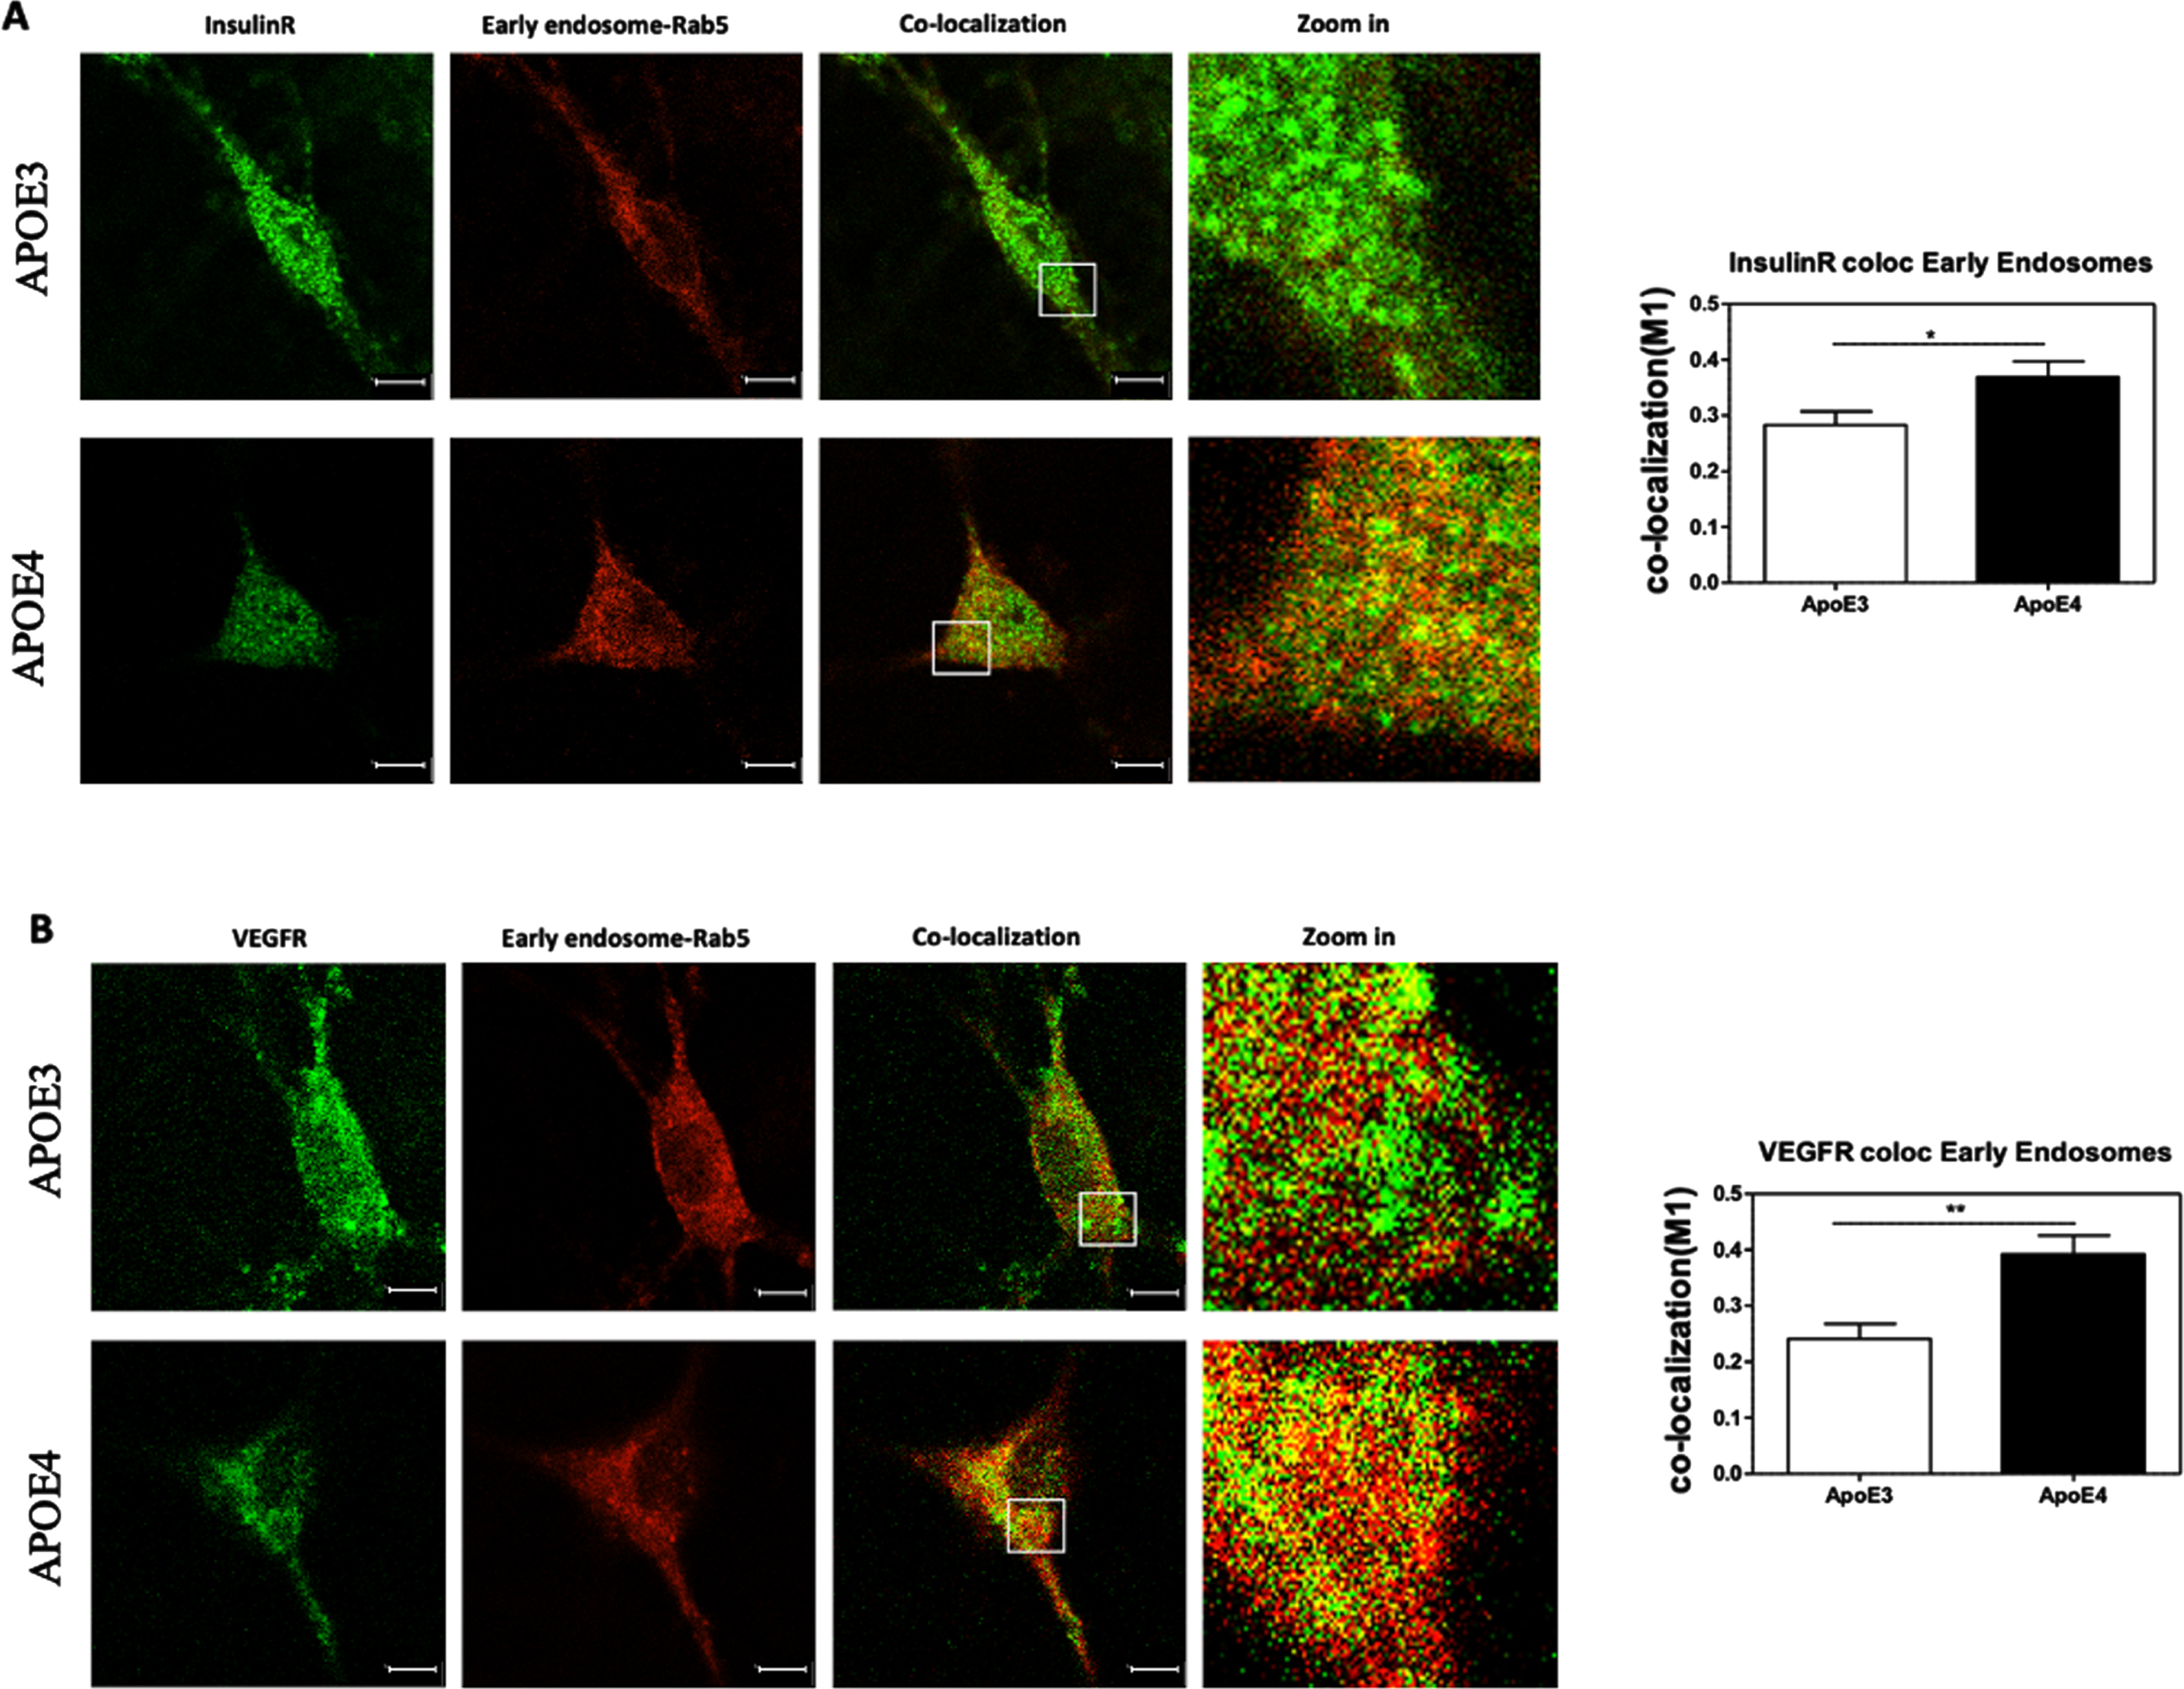
The extent of colocalization of the growth factor receptors, IR and VRGFR, with early endosomes were next determined. similar to the results previously presented in Fig. 3, the levels of IR and VEGFR were found to be downregulated in APOE4 neurons in these experiments as well, whereas the levels of early endosomes showed no significant difference between the genotypes (see Fig. 7 for the quantification). The extent of colocalization of these receptors with the early endosomes was affected by the APOE genotype and was higher in the APOE4 cells. Quantification of these results revealed that the colocalization of IR with early endosomes was significantly higher in APOE4 neurons (0.36±0.02, N = 34 from 4 different preparations) than in the APOE3 neurons (0.28±0.02, N = 48, from 4 different preparations, p < 0.05), as was the colocalization of VEGFR with early endosomes which was higher in APOE4 neurons (0.39±0.03, N = 19 from 2 different preparations) than and in APOE3 neurons (0.24±0.02, N = 20, from 2 different preparations, p < 0.01).
These results, when combined with previously presented results, indicate that in APOER2, VEGFR and IR, the downregulation of both the externally oriented and total levels of the receptors is accompanied with their accumulation in the early endosomes. In contrast for LRP1, who’s total and surface areas levels are also downregulated in the APOE4 cells, the extent of their colocalization with early endosomes is lower in the APOE4 than the APOE3 neurons.
The effects of APOE genotype on distinct endosomal and lysosomal compartments
The following experiments examined the effects of APOE genotype on the intracellular compartments: early endosomes, late endosomes, lysosomes, and recycling endosomes.
The results show that the area of the early endosomes (as indicated by the staining of Rab5) and the recycling endosomes (Rab11) were similar in both APOE3 and APOE4 neurons. On the other hand, the area of late endosomes (Rab7) and lysosomes (catD) were reduced in the APOE4 relative to the APOE3 neurons. Quantifications of the results revealed that, APOE4 neurons present a significant decrease in the areas of both the late endosomes (13% decrease, p < 0.05, N = 69 from 7 different preparations) and lysosomes (23.6% decrease, p < 0.0001, N = 62 from 6 different preparations), while no significant differences were obtained with the early and recycling endosomes (N = 65–86 from 6 to 8 different preparations).
Colocalization of the receptors with distinct endosomal compartments and with lysosomes
These experiments focused on assessment of the colocalization of the different receptors with early, late, and recycling endosomes, as well as with lysosomes (Fig. 8). The analysis of these experiments revealed two main patterns of intracellular distributions of the receptors were observed. The first pattern which was observed with LRP1, shows that lower levels of colocalization of this receptor in the early endosomes in APOE4 neurons (seen also in Fig. 5) was accompanied by lower levels of their colocalization with late endosomes (46.7% decrease, p < 0.01) and lysosomes (20.2% decrease, p < 0.05), while no difference between the genotypes was seen in the corresponding recycling endosomes.
A different colocalization pattern was seen in APOER2, IR, and VEGFR, where the accumulation of these receptors in the early endosomes in APOE4 neurons (see also Figs. 5 and 6) is accompanied with lower levels of colocalization in late endosomes relative to those obtained with APOE3 cells. This decrease in late endosomes was significant for both IR and VEGFR with a similar trend observed in APOER2 (IR: 25.80% decrease, p < 0.05; VEGFR: 47.74% decrease, p < 0.05; APOER2 : 22.09% decrease, p = 0.156).
Fig. 6
Colocalization of growth factor receptors with early endosomes. The levels of IR (A) and VEGFR (B) that are localized with the early endosomes were evaluated utilizing double staining and confocal microscopy, followed by M1 colocalization analysis. The representative images presented on the left show that the intensity of both IR and VEGFR is lower in APOE4 neurons when compared to APOE3 neurons, and no significant effects of APOE genotype is evident in the staining areas of the early endosomes. On the other hand, the extent of colocalization of these receptors (marked with yellow pixels) was higher in APOE4 neurons in both IR and VEGFR. Quantification of the results show that APOE4 neurons exhibit significantly higher colocalization than APOE3 in both IR (APOE3 = 0.28±0.02, APOE4 = 0.36±0.02, p < 0.05) and VEGFR (APOE3 = 0.24±0.02, APOE4 = 0.39±0.03, p < 0.001). The scalebar on the images indicate 10μm. *p < 0.05, **p < 0.001.
Additionally, there was also a decrease in the colocalization of the receptors with the lysosomes in APOE4 neurons that was significant in APOER2 and VEGFR but not in the IR (APOER2 : 35.89% decrease, p < 0.0001; VEGFR: 31.30% decrease, p < 0.05), and in the recycling endosomes in all three receptors (APOER2 : 11.16% decrease, p = 0.5154; IR: 30.88% decrease, p < 0.05; VEGFR: 29.02% decrease, p < 0.05) when compared to APOE3 neurons.
The role of ApoE levels in mediating the effects of APOE genotype on the receptors
The extent to which the observed effects of APOE4 on the levels and intracellular distribution of the receptors, is due to differences in the intrinsic properties of APOE4 and APOE3 or to differences in the concentration of the different APOE isoforms was next examined.
The levels of secreted ApoE in the primary neuronal culture were measured by western blot analysis. Representative blots thus obtained are presented in Fig. 9A. The blots show that APOE4 cultures are associated with significantly lower levels of ApoE. Quantification of the blots (Fig. 9B) show that in the APOE4 primary neuronal cultures the levels of ApoE are significantly lower than those of the APOE3 cultures (52.1% decrease, p < 0.05, N = 3).
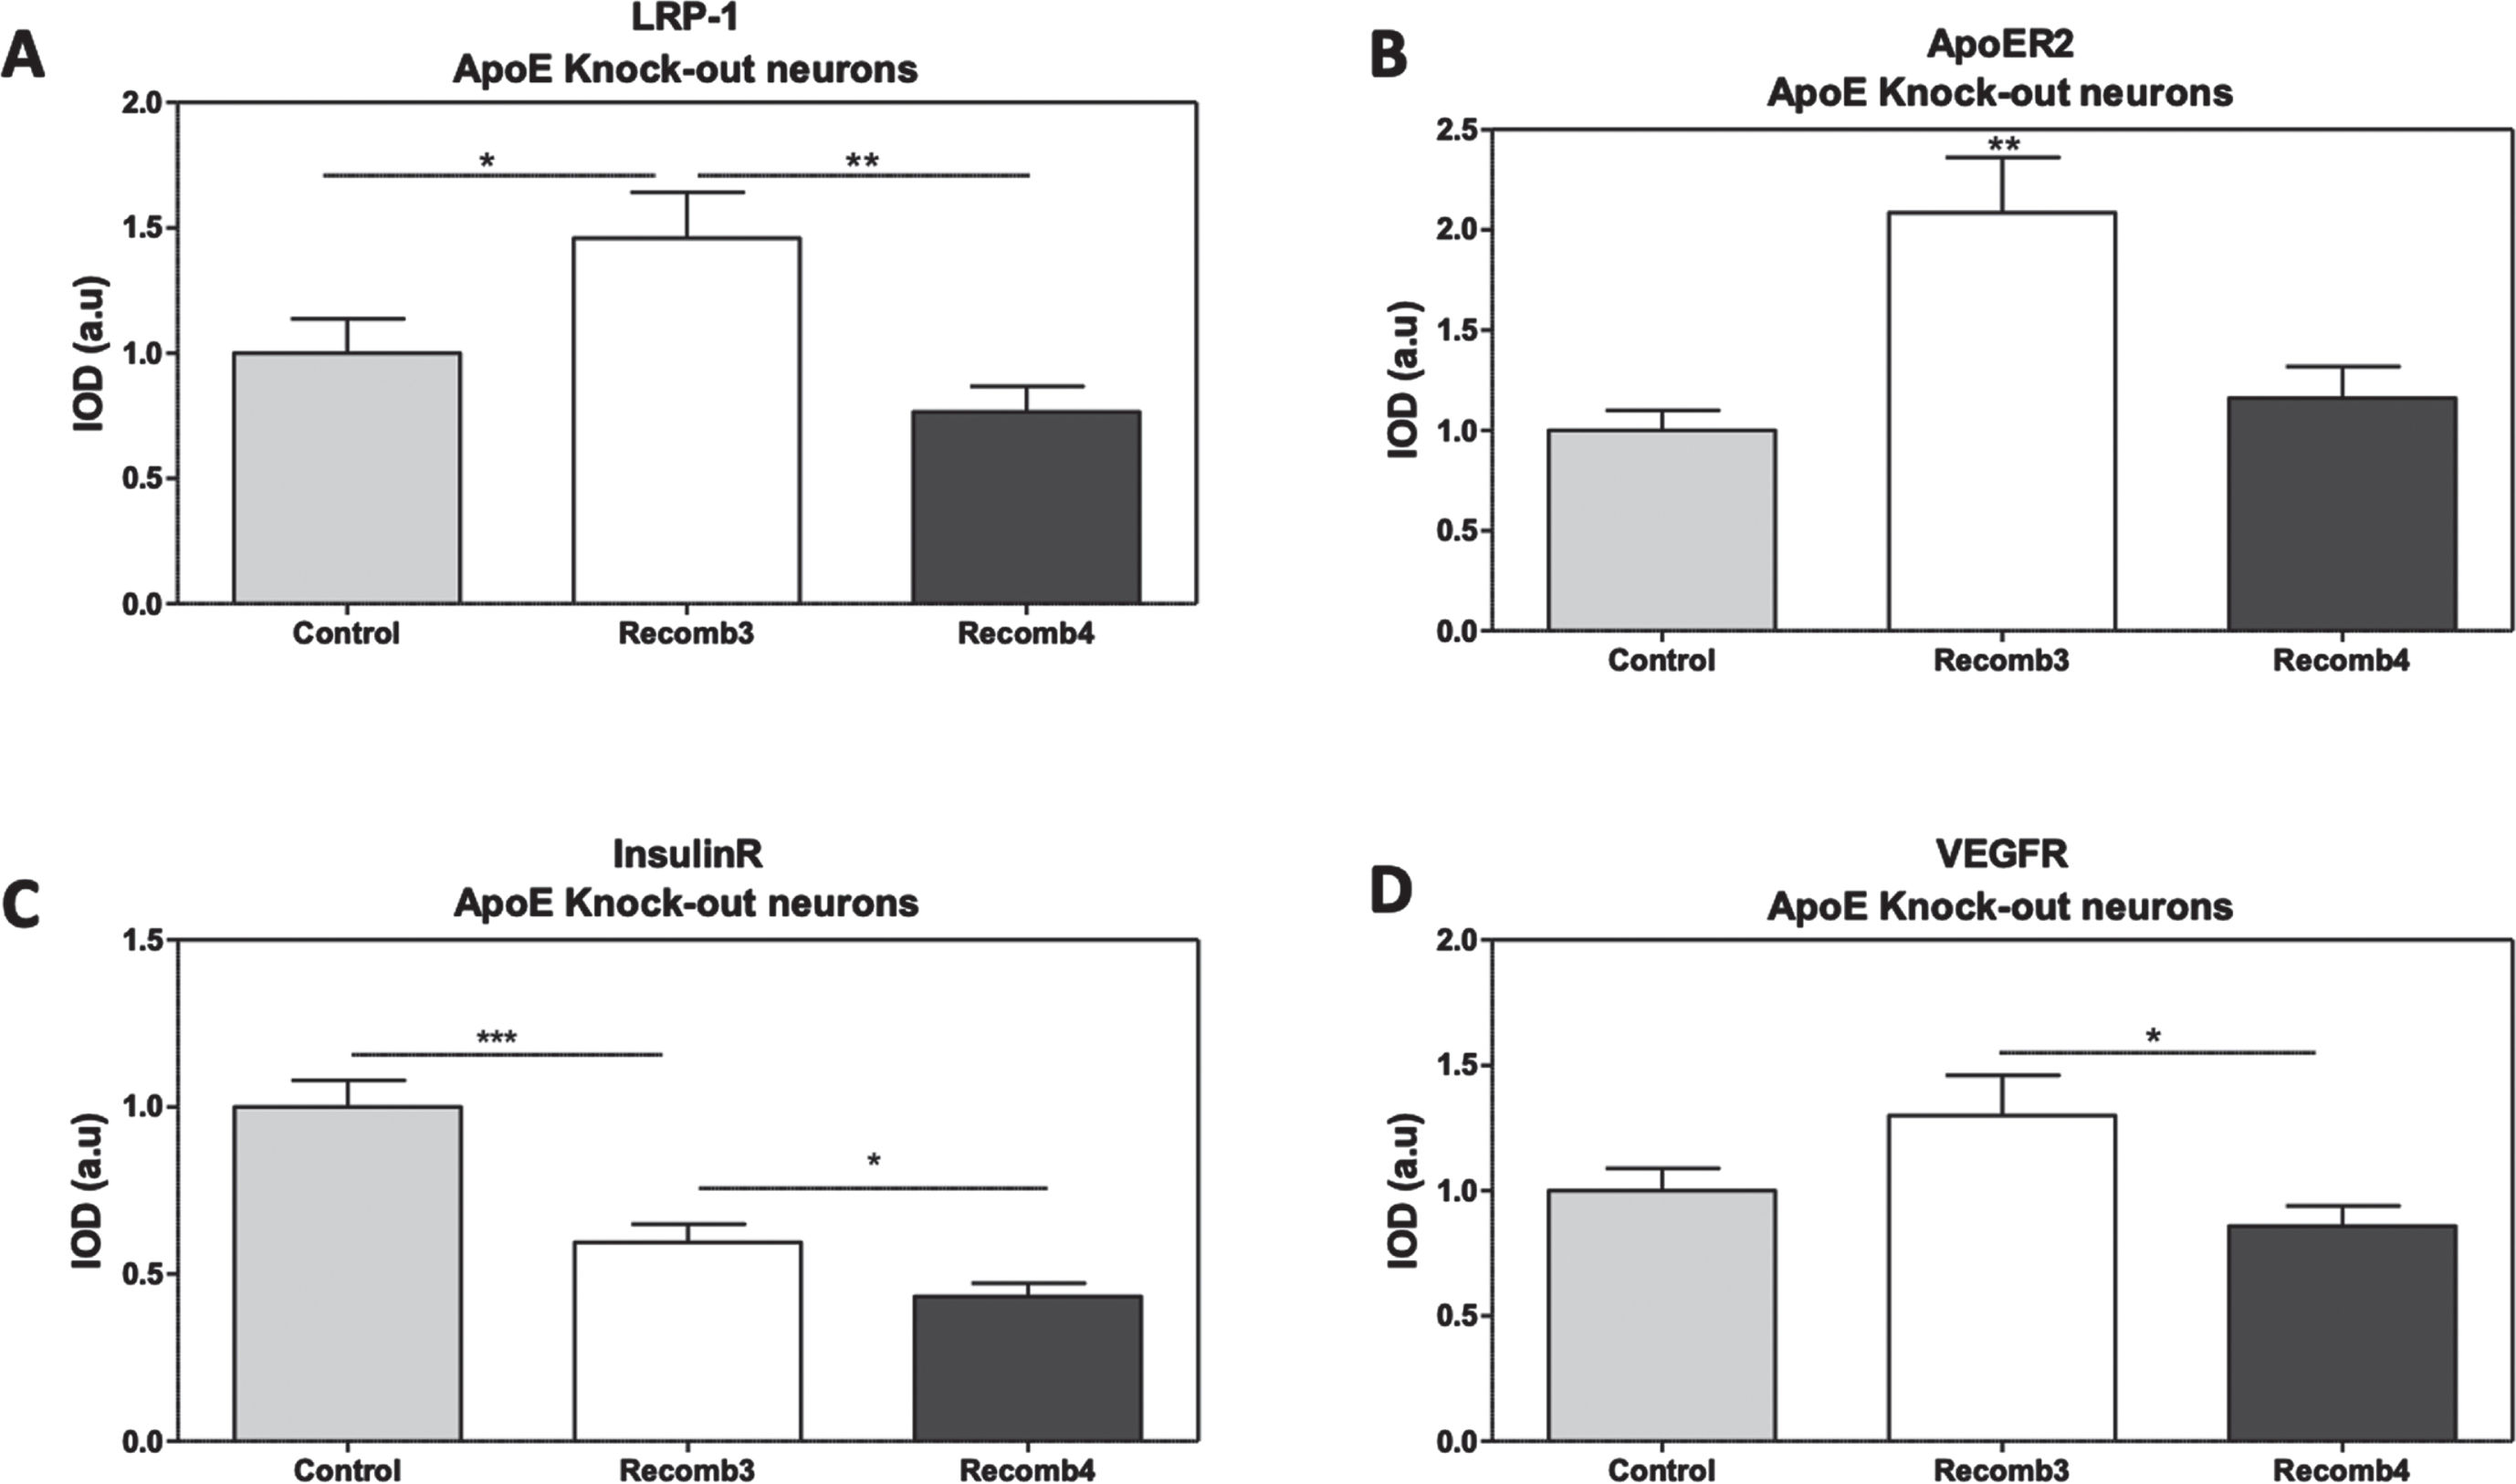
To assess the extent to which the presently observed effects of APOE4 are due to its lower levels, we turned to primary neurons prepared from APOE-deficient mice and studied the effects of the addition of similar levels of exogenous APOE3 and APOE4 on the receptors. The levels of the LRP1, APOER2, VEGFR, and the IR in APOE deficient neurons in the presence and absence of 100 nM of recombinant APOE3 or APOE4, are presented in Fig. 10. This concentration was chosen following a thorough literature review and based on the study conducted by Zhao et al. (2017) [56].
This revealed that the levels of LRP1 were higher in APOE3 treated neurons when compared to control, in the absence of exogenous ApoE (45.8% increase when compared to control, p < 0.05), with no change in the levels of LRP1 in APOE4 treated neurons. Similarly, APOER2 and VEGFR showed an increase in APOE3 treated neurons (108.5%, p < 0.01 and 29.9%, p = 0.09 respectively) relative to control, while no difference was seen in APOE4 treated neurons. On the other hand, in IR, both APOE3 and APOE4 treated neurons expressed lower levels of the receptor compared to control (37.5% decrease in APOE3 treated neurons and 55.2% decrease in the APOE4 treated neurons relative to control in the absence of exogenous ApoE).
Although APOE deficient neuronal cultures in the presence of exogenous APOE4 or APOE3 may not be identical to corresponding cultures prepared from APOE4 and APOE3 mice, the data presented support the suggestion that the observed effects of APOE4 on the receptors in the APOE4 and APOE3 cultures is not due to the lower levels of APOE4 but rather to intrinsic differences between the two isoforms.
Unraveling the role of LRP1 and APOER2 in mediating the genotype specific effects of ApoE on the receptors
We next examined the extent to which the ApoE receptors might mediate the effects of APOE3 and APOE4 on other receptors. This was determined by treating APOE3 and APOE4 primary cultures with CRISPR/Cas9 system directed at knocking down the expression of either LRP1 or APOER2 and examining the effects of the resulting knock-down of these receptors, on the levels of IR and VEGFR, as well as on the colocalization of these receptors with the early endosomes. We chose to focus on the compartmentation of IR and VEGFR with the early endosomes due to the interesting pattern we established previously; trapping of APOER2, IR and VEGFR in APOE4 neurons on one hand, and low levels of LRP1 on the other hand (as detailed in Fig. 8).
Fig. 7
The effects of APOE genotype on distinct endosomal and lysosomal compartments. APOE3 and APOE4 primary neurons were stained for markers of early endosomes (Rab5; A), late endosomes (Rab7; B), lysosomes (CatD; C), and recycling endosomes (RAb11; D). The intracellular areas of these compartments were then analyzed as described in the Materials and Methods. This revealed that the areas of both late endosomes (APOE3 = 1.00±0.03, APOE4 = 0.87±0.05, p≤0.05) and lysosome (APOE3 = 1.00±0.04, APOE4 = 0.76±0.03, p < 0.0001) are downregulated in APOE4 primary neurons. In contrast, the levels of the early endosomes (APOE3 = 1.00±0.03, APOE4 = 1.1±0.05, p = 0.30) and recycling endosomes (APOE3 = 1.00±0.06, APOE4 = 0.94±0.07, p = 0.56) were not affected by APOE4. *p < 0.05, ***p < 0.0001.
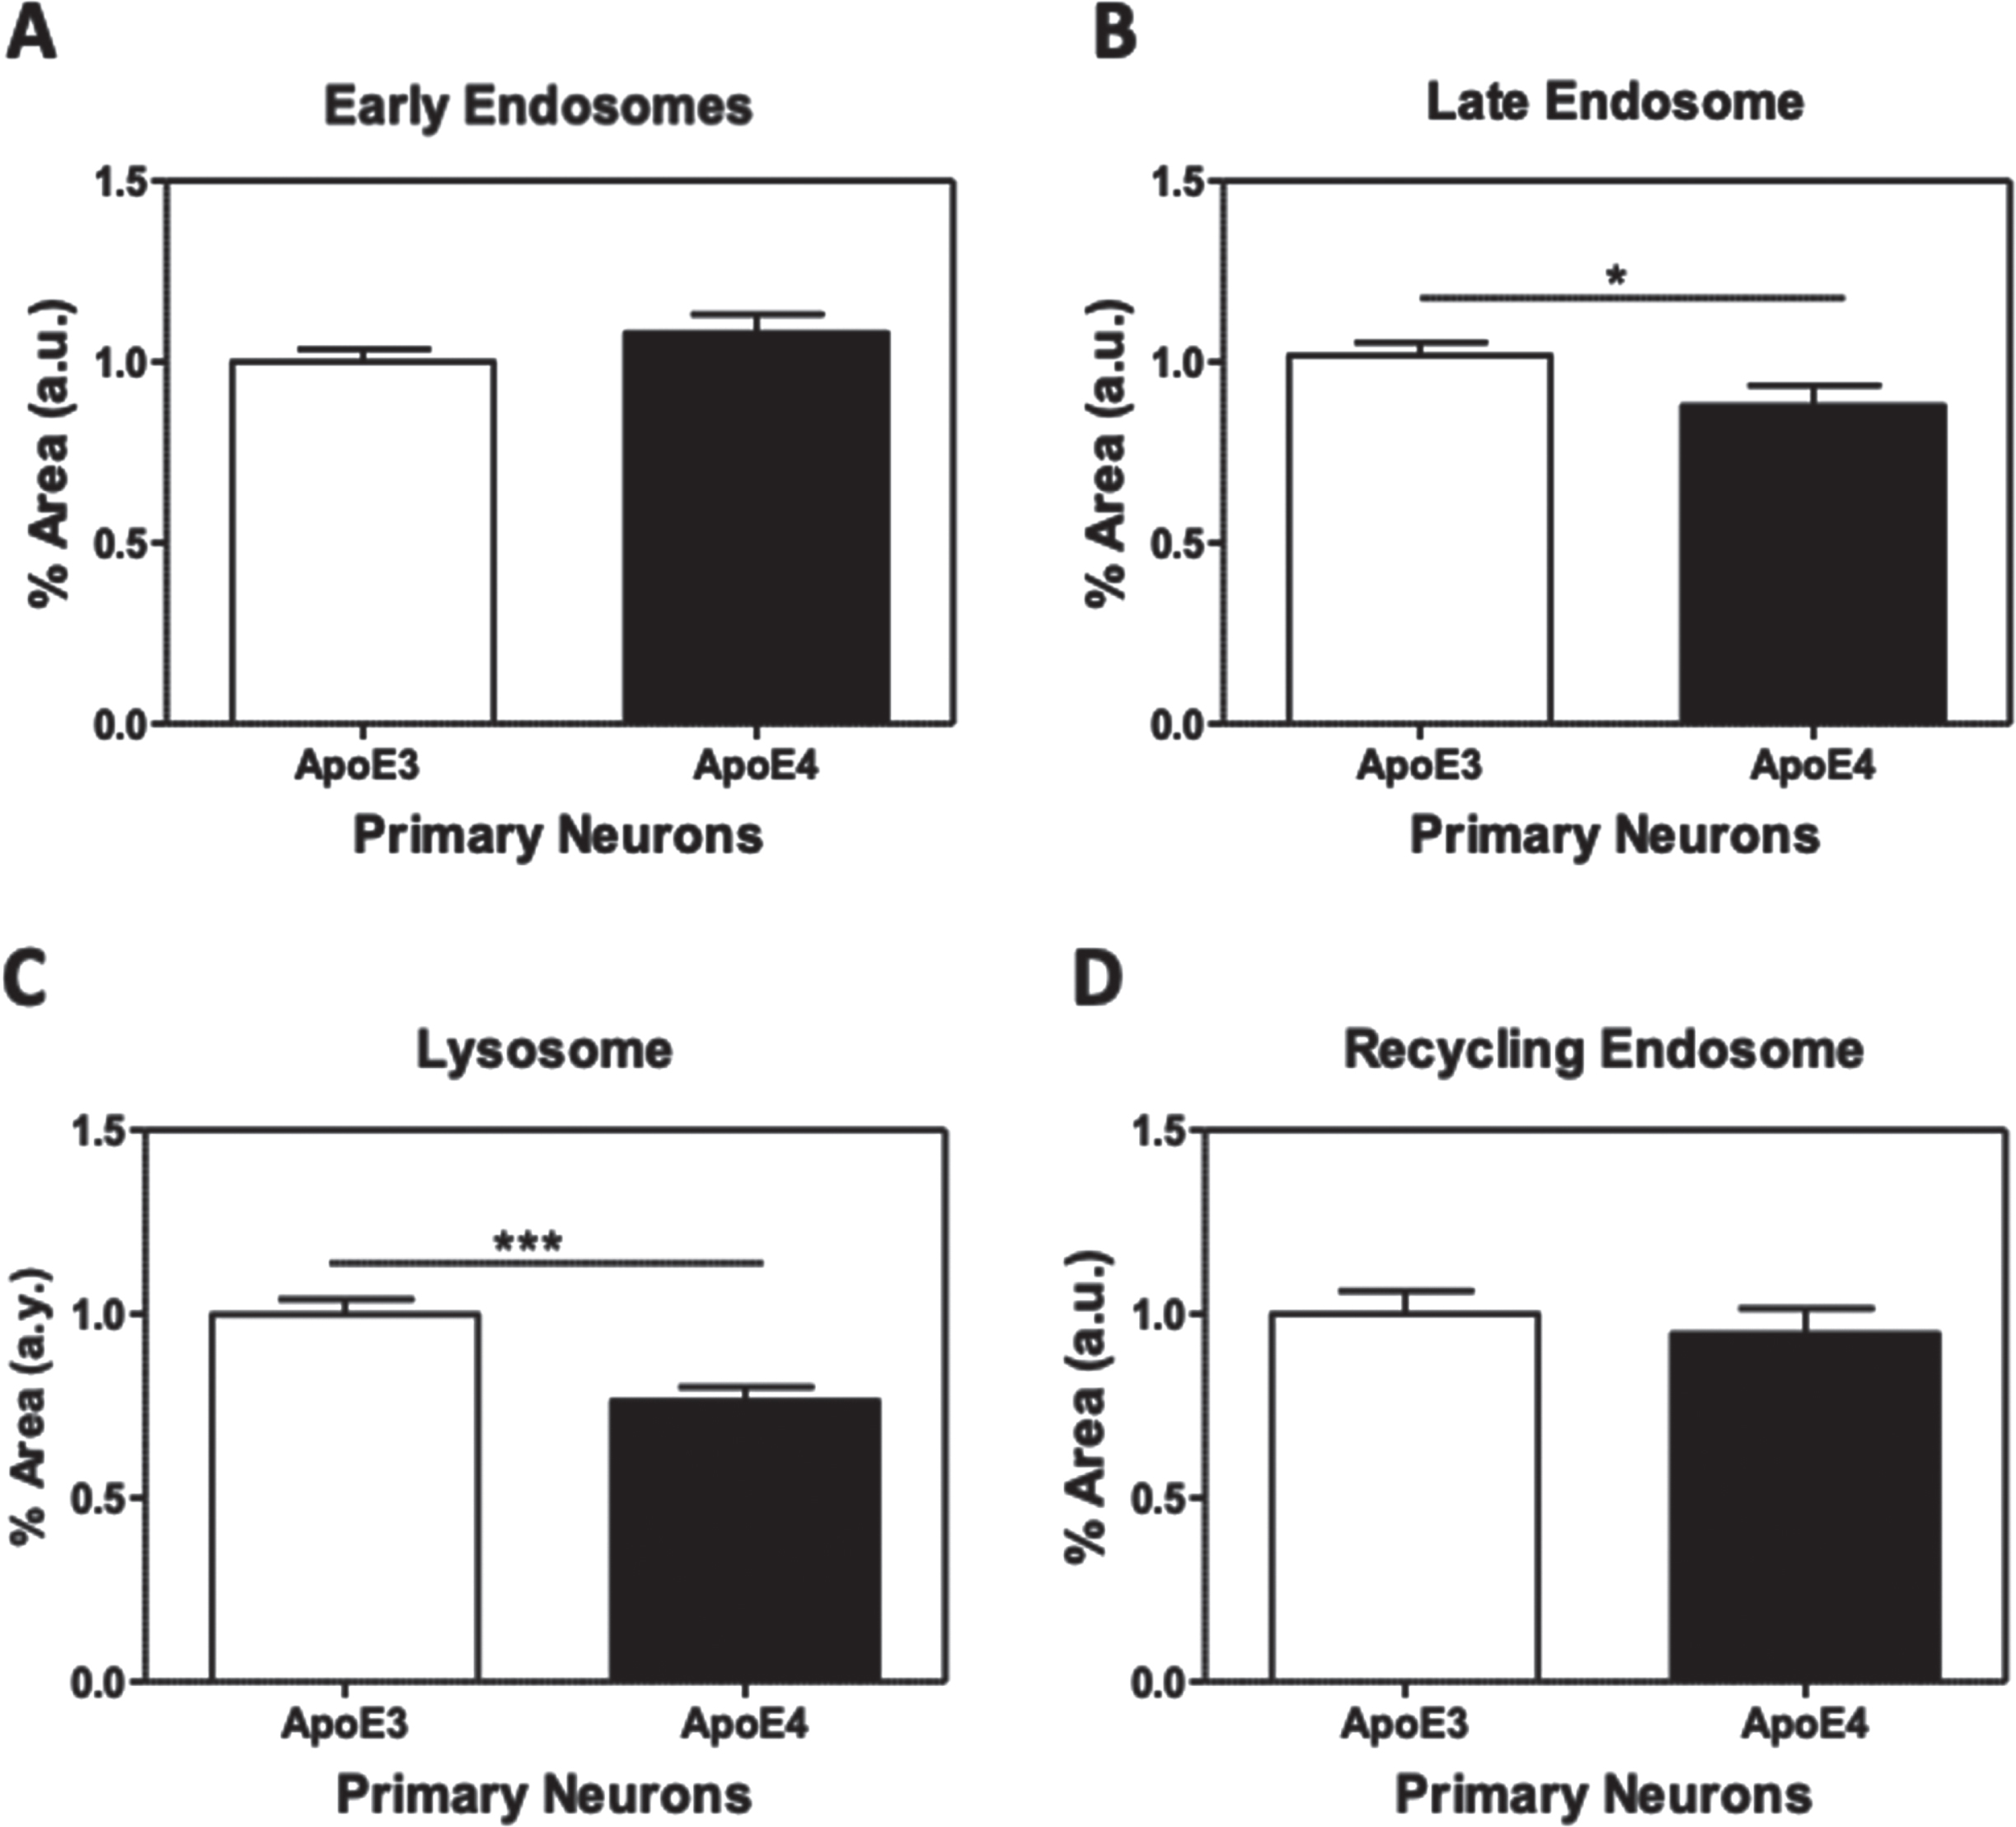
Fig. 8
Intracellular distribution of the receptors. The extent of colocalization of LRP1 (A), APOER2 (B), IR (C), and VEGFR (D) with early, late, and recycling endosomes, as well as with lysosomes, was determined by double staining confocal microscopy, as described in the Materials and Methods. The results shown correspond to 25–37 cells from 2-3 different preparations for each of the receptors and compartment colocalization. The results obtained revealed two patterns: The first, exemplified by LRP1, shows that the levels of this receptor in APOE4 neurons are lower in the early and late endosomes and unchanged in lysosomes and recycling endosomes. (Early endosomes: APOE3 = 0.22±0.022, APOE4 = 0.16±0.015, p < 0.001. Late endosomes: APOE3 = 0.24±0.023, APOE4 = 0.127±0.031, p < 0.001. Lysosomes: APOE3 = 0.36±0.031, APOE4 = 0.29±0.027, p < 0.05. Recycling endosomes: APOE3 = 0.12±0.024, APOE4 = 0.12±0.023). The second pattern is common to the APOER2, IR, and VEGFR where the elevation in the colocalization in the early endosomes in APOE4 was accompanied by a decrease in localization to the other compartments, mainly, late endosome (APOER2- early endosomes: APOE3 = 0.37±0.044, APOE4 = 0.51±0.037, p < 0.05. Late endosomes: APOE3 = 0.49±0.024, APOE4 = 0.38±0.059, p = 0.15. Lysosomes: APOE3 = 0.41±0.024, APOE4 = 0.26±0.019, p < 0.0001. Recycling endosomes: APOE3 = 0.17±0.025, APOE4 = 0.15±0.017, p = 0.51. IR- early endosomes: APOE3 = 0.28±0.02, APOE4 = 0.36±0.02, p < 0.05. Late endosomes: APOE3 = 0.41±0.042, APOE4 = 0.31±0.028, p < 0.05. Lysosomes: APOE3 = 0.33±0.017, APOE4 = 0.33±0.034, p = 0.19. Recycling endosomes: APOE3 = 0.18±0.015, APOE4 = 0.13±0.022, p < 0.05. VEGFR- early endosomes: APOE3 = 0.22±0.03, APOE4 = 0.36±0.04, p < 0.05. Late endosomes: APOE3 = 0.29±0.04, APOE4 = 0.15±0.03, p < 0.05. Lysosomes: APOE3 = 0.20±0.02, APOE4 = 0.14±0.01, p < 0.05. Recycling endosomes: APOE3 = 0.27±0.02, APOE4 = 0.19±0.02, p < 0.05).
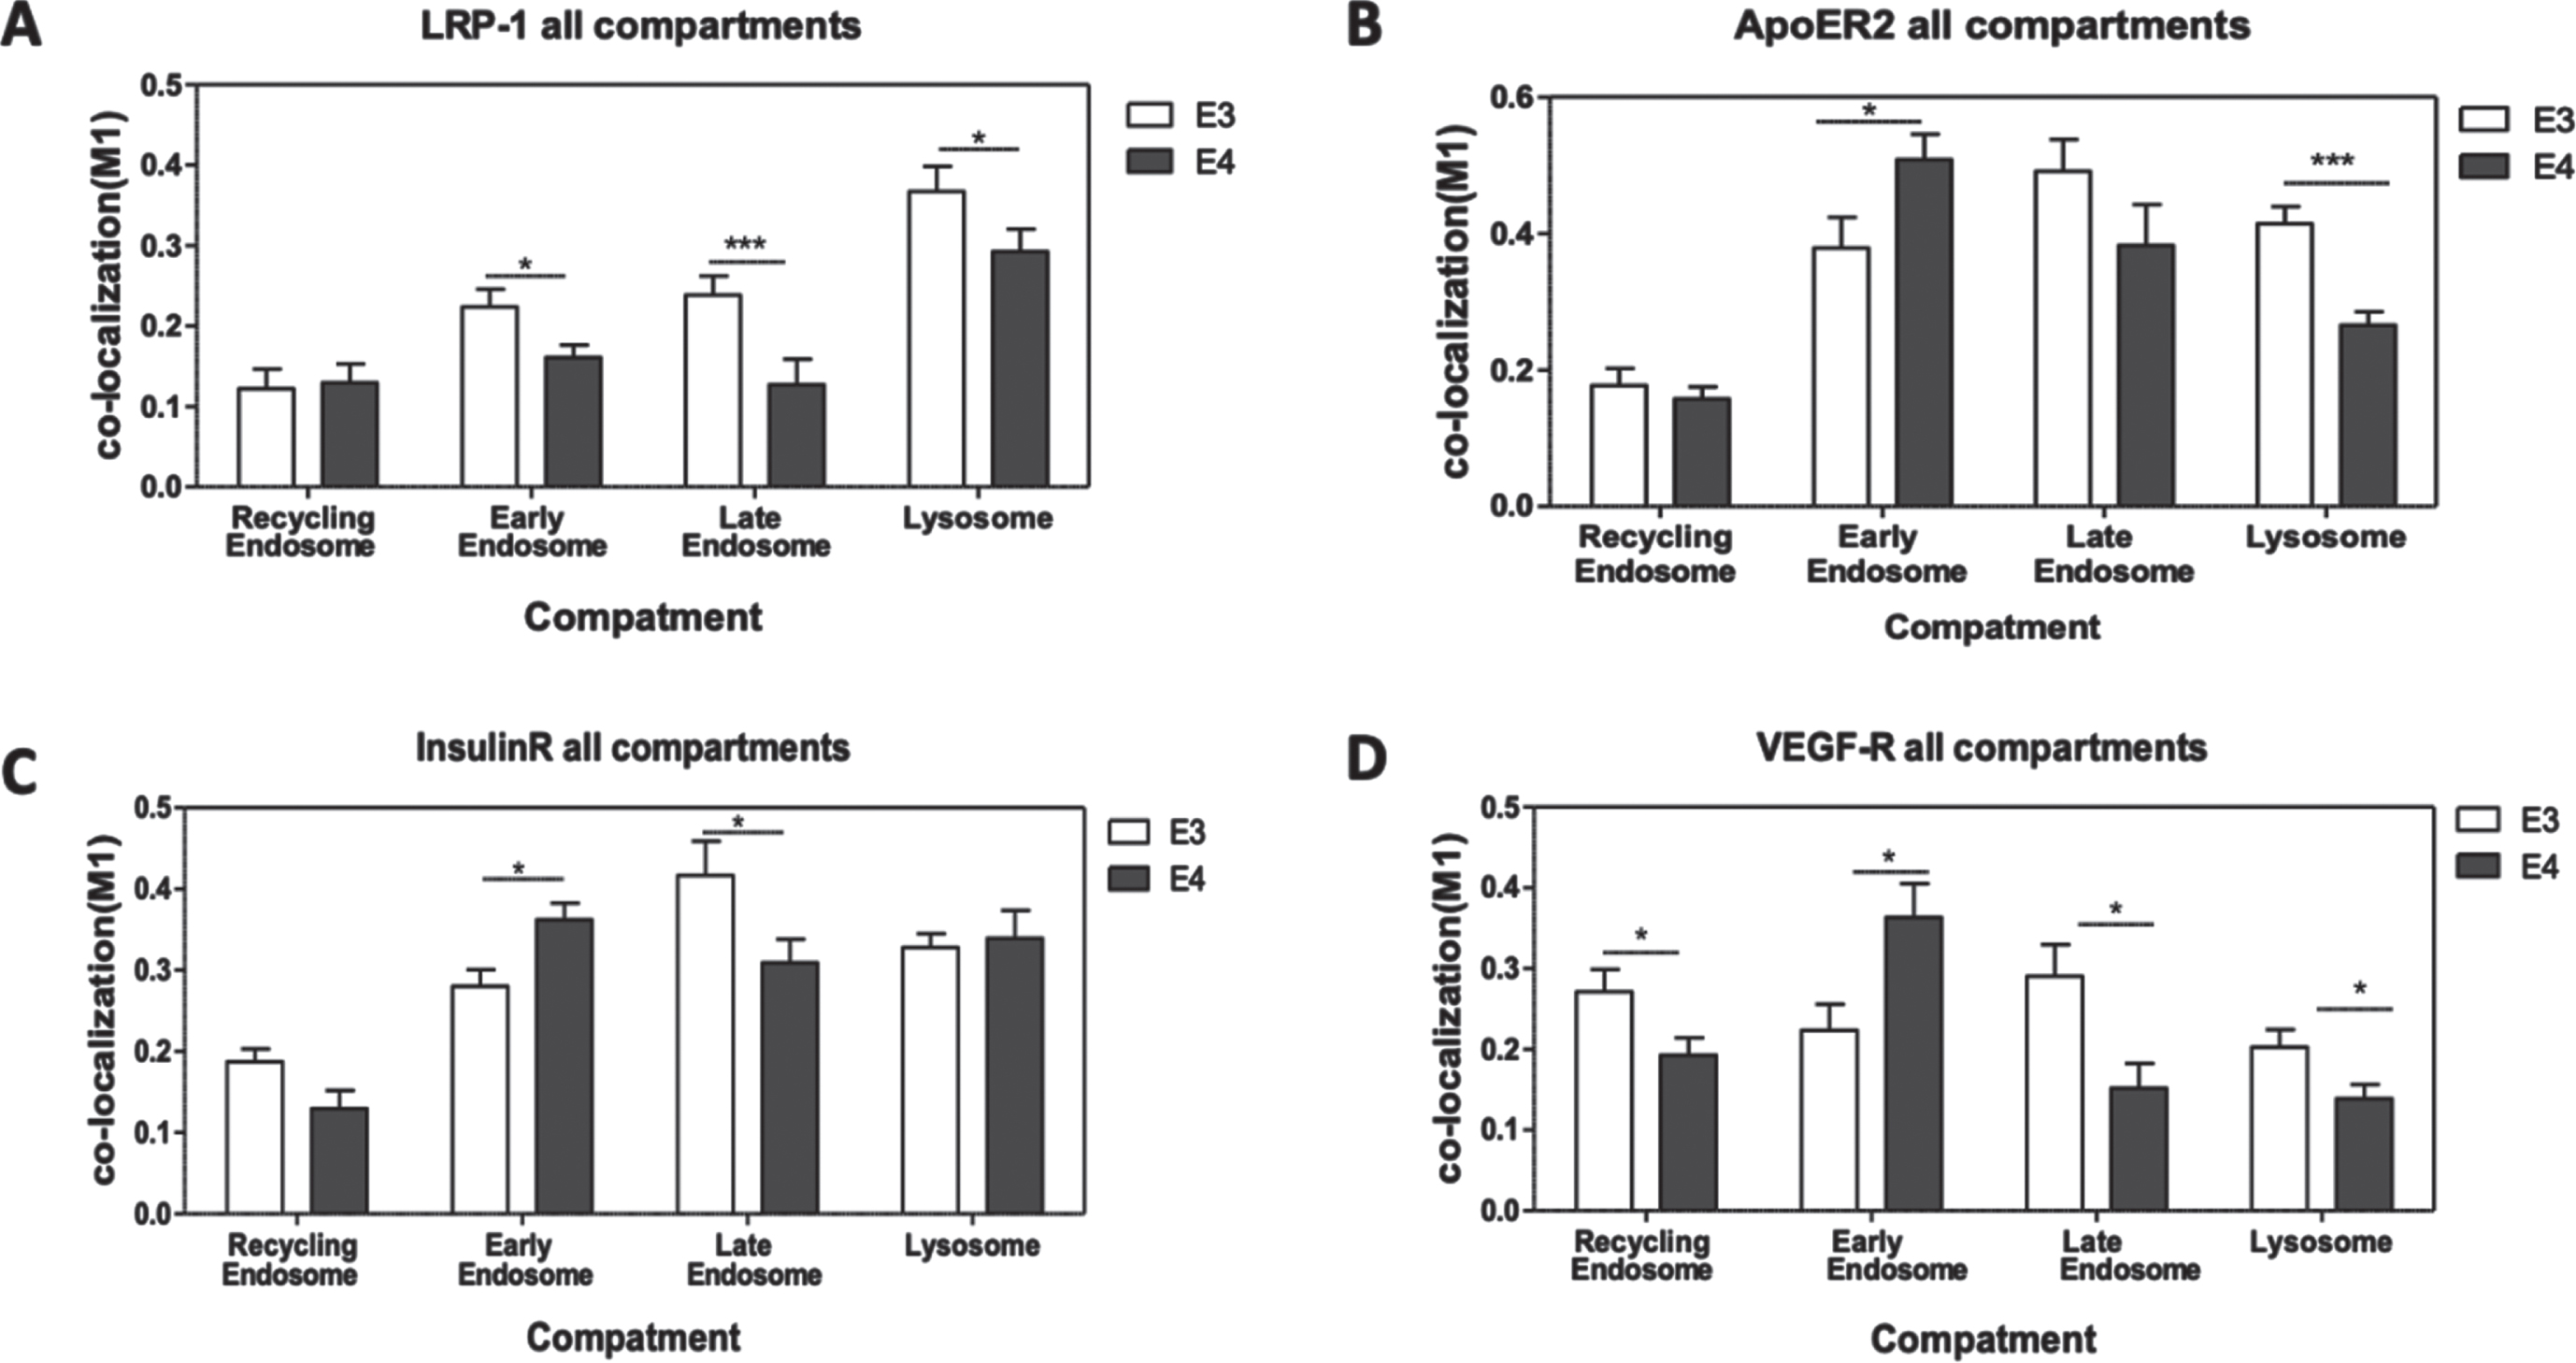
Fig. 9
ApoE levels in conditioned media of APOE3 and APOE4 primary neurons. The levels of ApoE in conditioned media of APOE3 and APOE4 neuronal cultures were determined by western blot analysis as described in the Materials and Methods. Representative image of the blot is presented in A; whereas, quantification of the blots is shown in B. The results show that the levels of ApoE in the APOE4 cultures, were significantly lower than those of the APOE3 cultures (APOE3 = 1.00±0.14, APOE4 = 0.40±0.12, p < 0.05, N = 4). *p < 0.05.
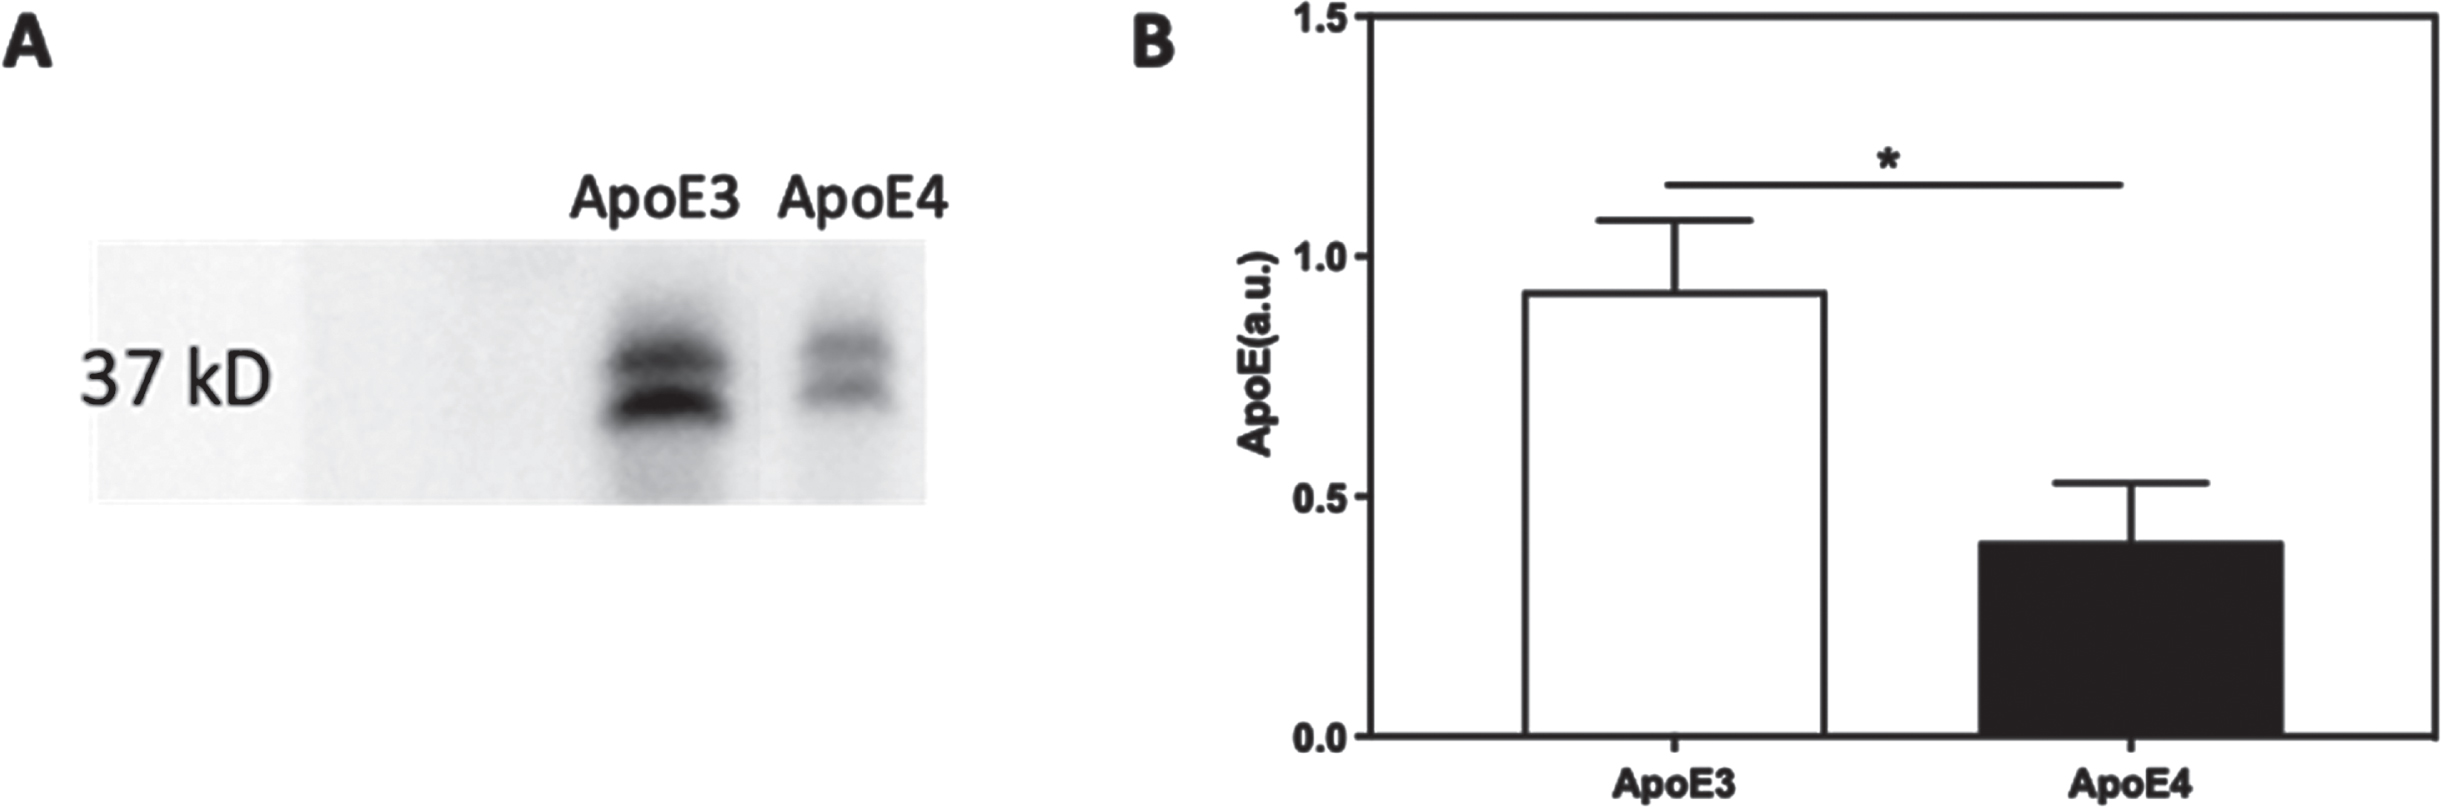
Fig. 10
The effects of recombinant APOE3 and APOE4 on the levels of the receptors in APOE-KO derived primary neurons. APOE-KO neurons were prepared as described in the Materials and Methods section. On day 14 of the cultures, the neurons were treated with 100 nM of either recombinant APOE3 or APOE4 for 2 h. Following treatment, the neurons were stained for LRP1, APOER2, VEGFR, or IR, after which the images were captured and analyzed. Quantification of the results show that APOE3 induced an elevation in LRP1 (Control = 1.00±0.13, recombinant APOE3 = 1.45±0.18, recombinant APOE4 = 0.76±0.10, p-value recombinant3/control<0.05, p-value recombinant4/recombinant3 < 0.01, N = 28–31 from 3 different preparations), APOER2 (Control = 1.00±0.09, recombinant APOE3 = 2.08±0.27, recombinant APOE4 = 0.1.16±0.15, p < 0.01 when comparing recombinant3 with both control and recombinant4, N = 20 from 2 different preparations) and VEGFR (Control = 1.00±0.09, recombinant APOE3 = 1.30±0.16, recombinant APOE4 = 0.85±0.08, p-value recombinant3/control=0.09, p-value recombinant4/ recombinant3 < 0.01, N = 15–20 from 2 different preparations) when compared to control and APOE4. On the other hand, both recombinant APOE3 and APOE4 resulted in lower levels of IR when compared to control, more so in APOE4 treated neurons (Control = 1.00±0.08, recombinant APOE3 = 0.59±0.05, recombinant APOE4 = 0.43±0.04, p-value recombinant3/control<0.001, p-value recombinant4/recombinant4 < 0.05, N = 15–20 from 2 different preparations). *p < 0.05, **p < 0.001.
Validation of the CRISPR/Cas9 system
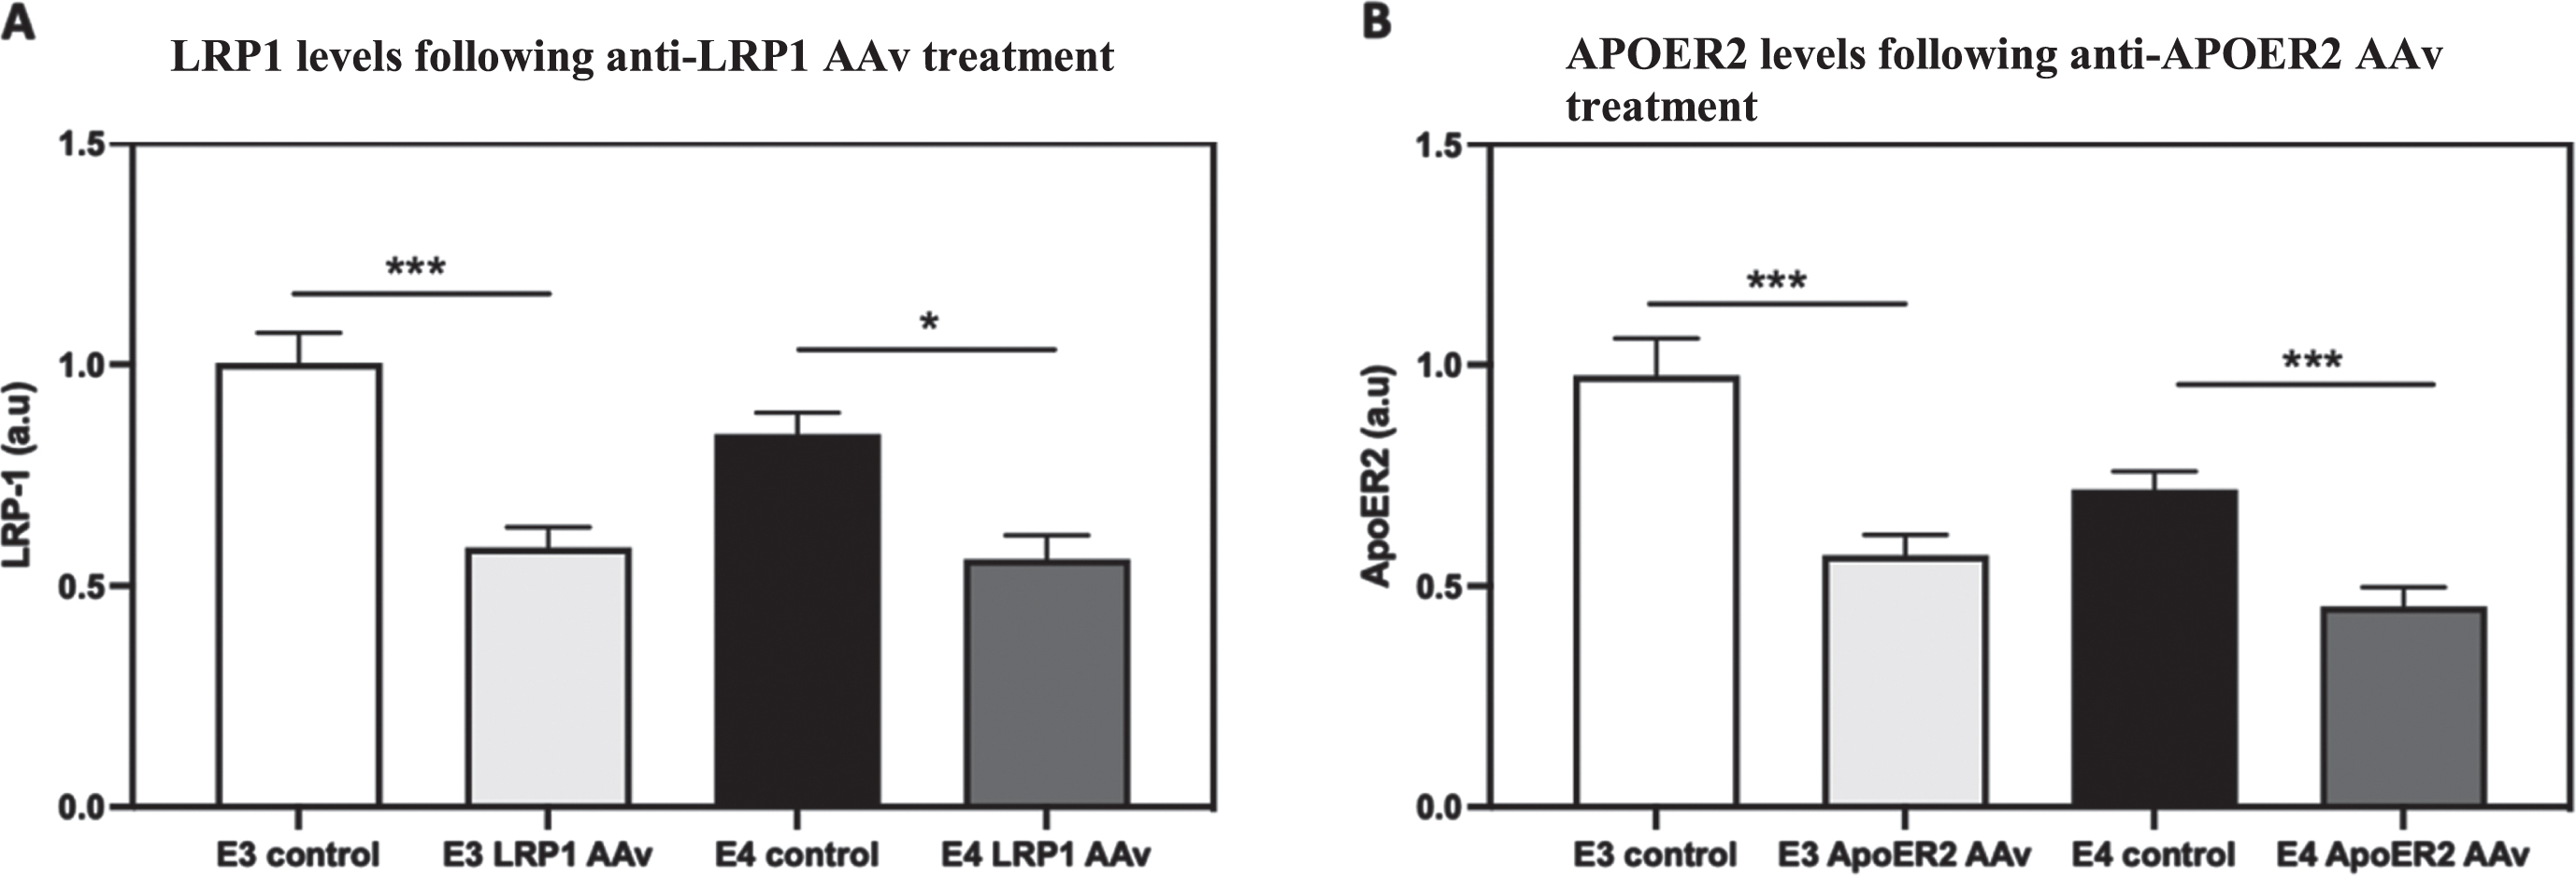
As shown in Fig. 11A., CRISPR/cas9 treatment directed at LRP1 decreased the levels of LRP1 in both APOE3 (41.4% decrease compared to APOE3 control) and APOE4 (33.6% decrease compared to APOE4 control) neurons and rendered them similar. Similar results were obtained in APOER2 (Fig. 11B), where corresponding CRISPR/Cas9 treatment, resulted in lower levels of APOER2 in both APOE3 (42.9% decrease compared to APOE3 control) and APOE4 (36.8% decrease compared to APOE4 control) resulting in similar levels.
Fig. 11
Knock-down of LRP1 and APOER2 in the APOE3 and APOE4 neuronal cultures by CRISPR/Cas9. The APOE3 and APOE4 neuronal primary cultures were treated by CRISPR/Cas9 system directed at either LRP1 (A) or APOER2 (B); Following this treatment, each culture was stained for the corresponding ApoE receptor, and the extent to which this treatment knocked down the targeted receptor was determined. A) CRISPR/Cas9 system directed at LRP1 resulted in the downregulation of LRP1 in both APOE3 neurons (APOE3 control = 1.00±0.06, APOE3- LRP1 AAv = 0.58±0.04, p < 0.0001, N = 83–89 from 9 different preparations) and APOE4 neurons (APOE4 control = 0.84±0.04, APOE4- LRP1 AAv = 0.56±0.05, p < 0.05, N = 84–89 from 9 different preparations). B) CRISPR/Cas9 system directed at APOER2 resulted in the downregulation of APOER2 in both APOE3 (APOE3 control = 1.00±0.08, APOE3- APOER2 AAv = 0.57±0.04, p < 0.0001, N = 60–105 from 7-8 different preparations) and APOE4 neurons (APOE4 control = 0.71±0.04, APOE4- APOER2 AAv = 0.45±0.04, p < 0.0001, N = 79–125 from 8-9 different preparations). *p < 0.05, ***p < 0.0001.
The role of LRP1 in mediating the effects of APOE genotypes on the receptors’ levels and compartmentation
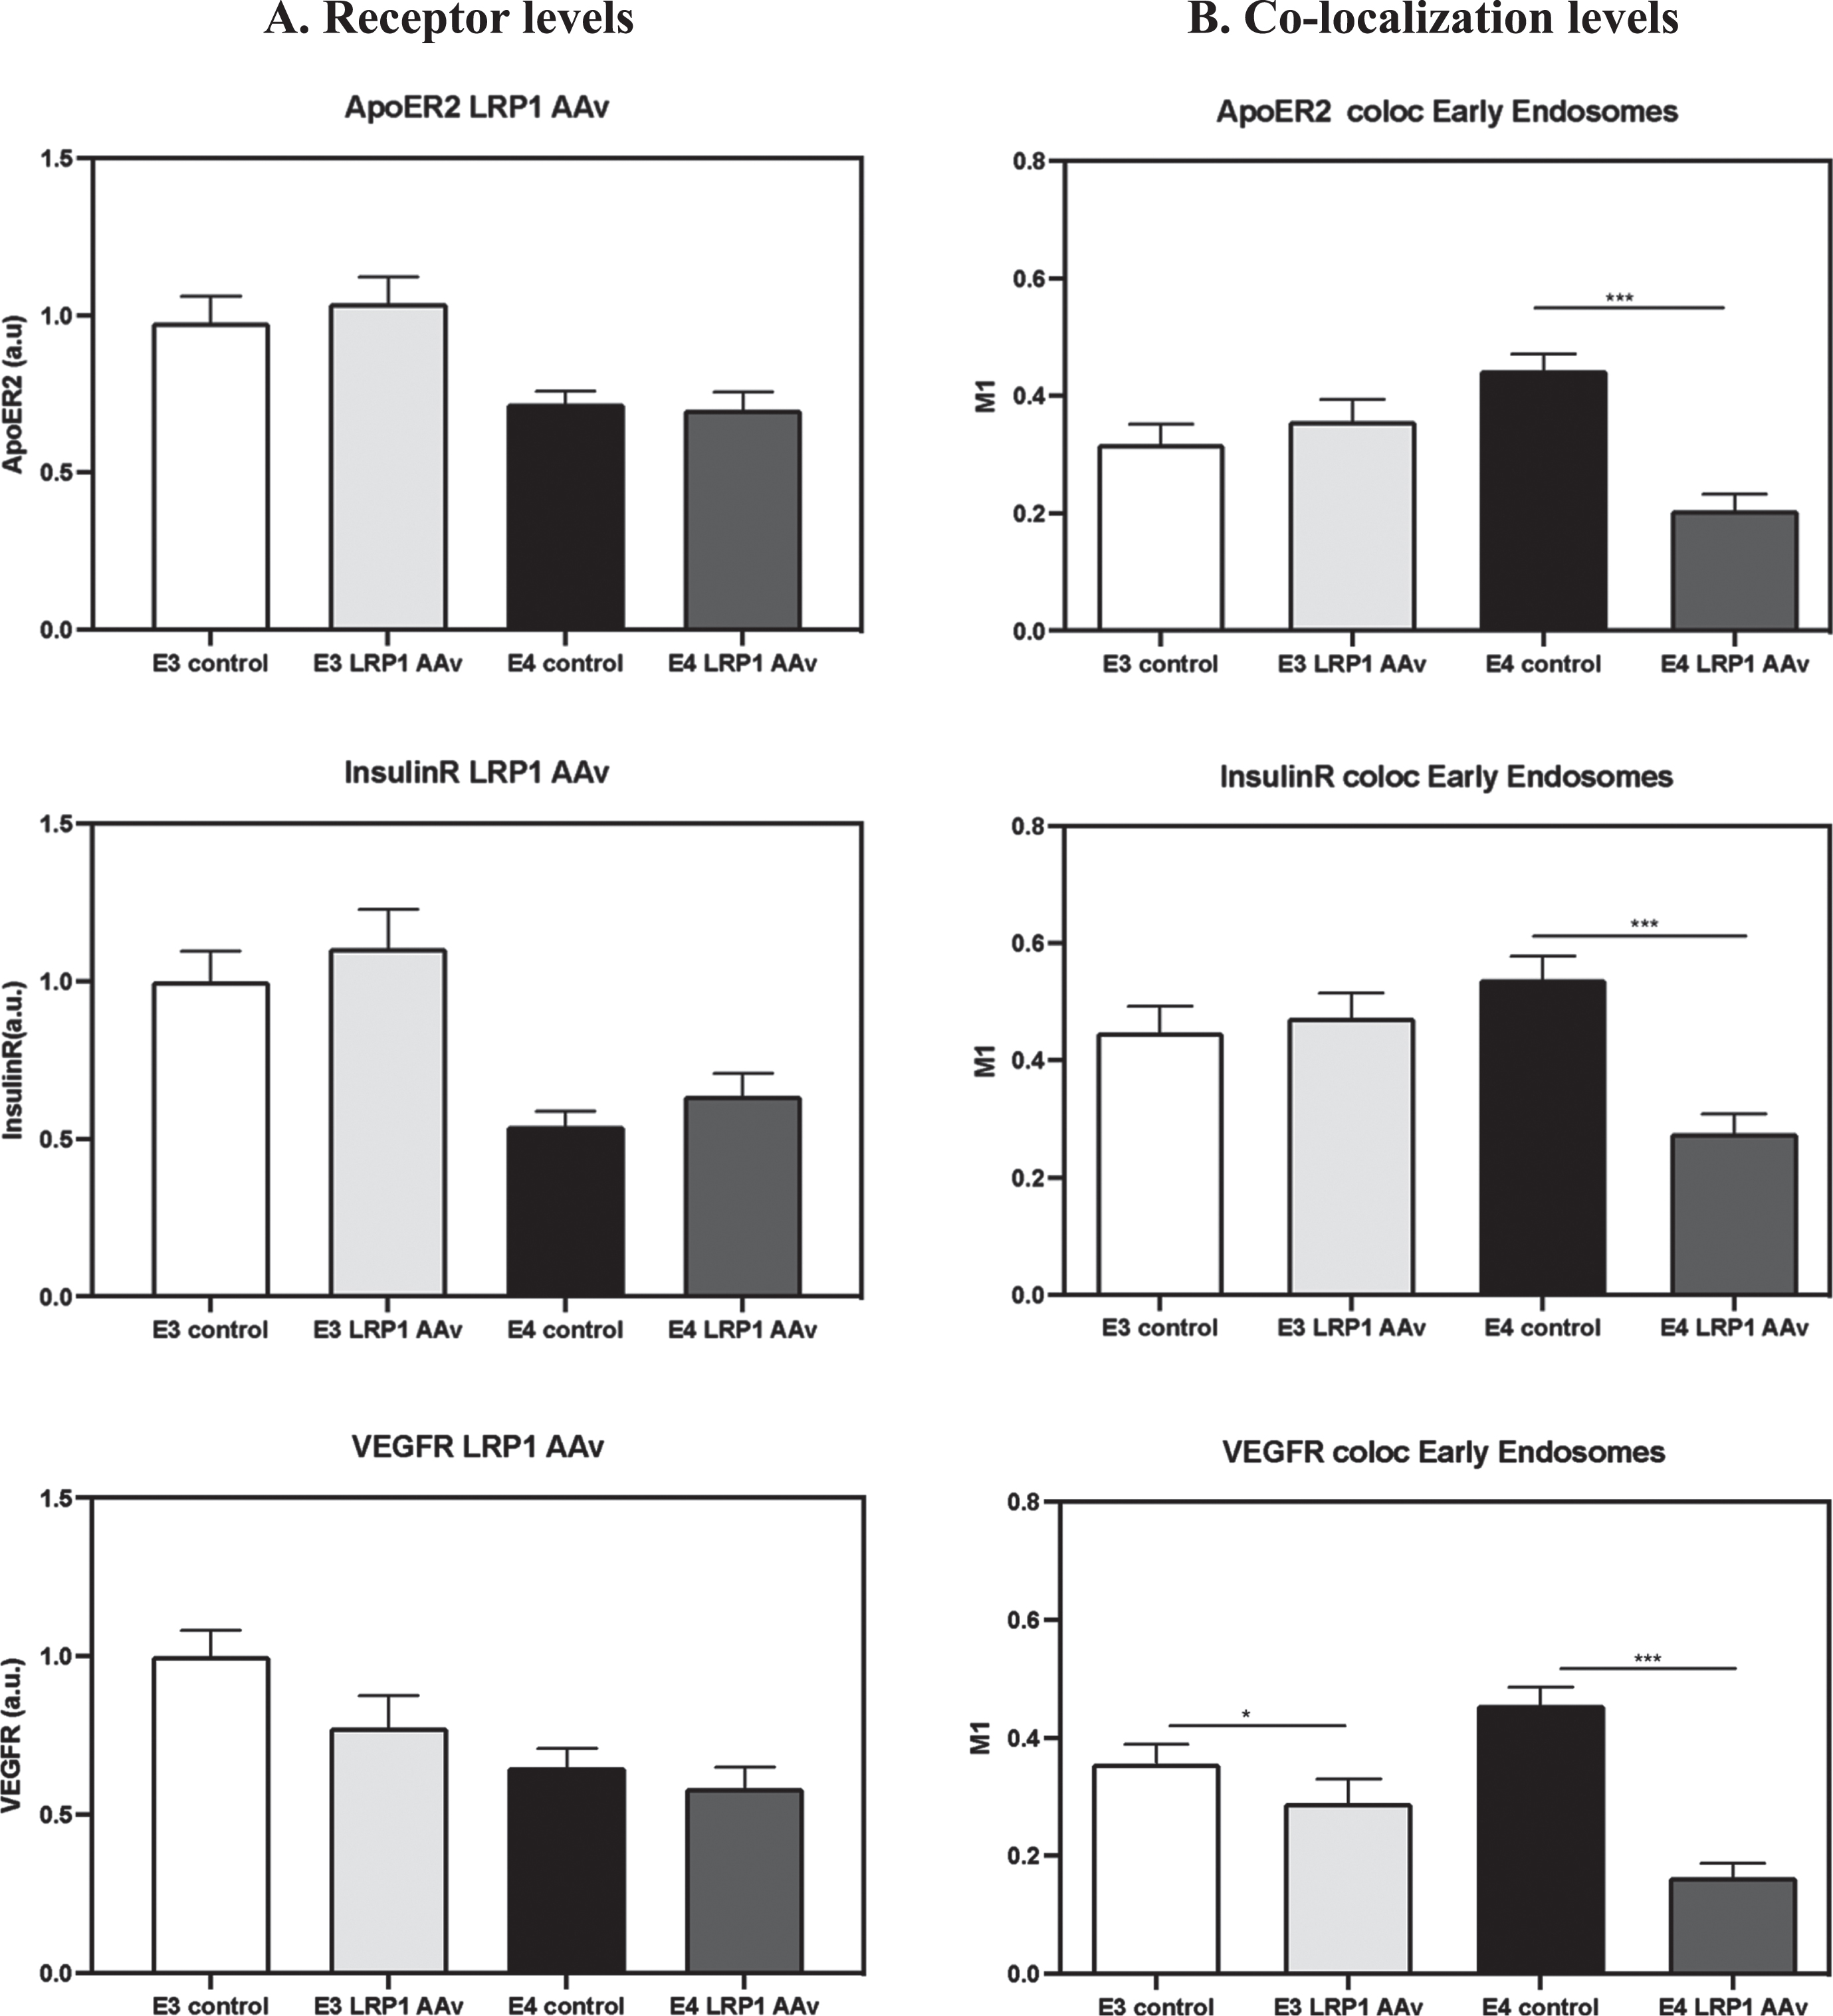
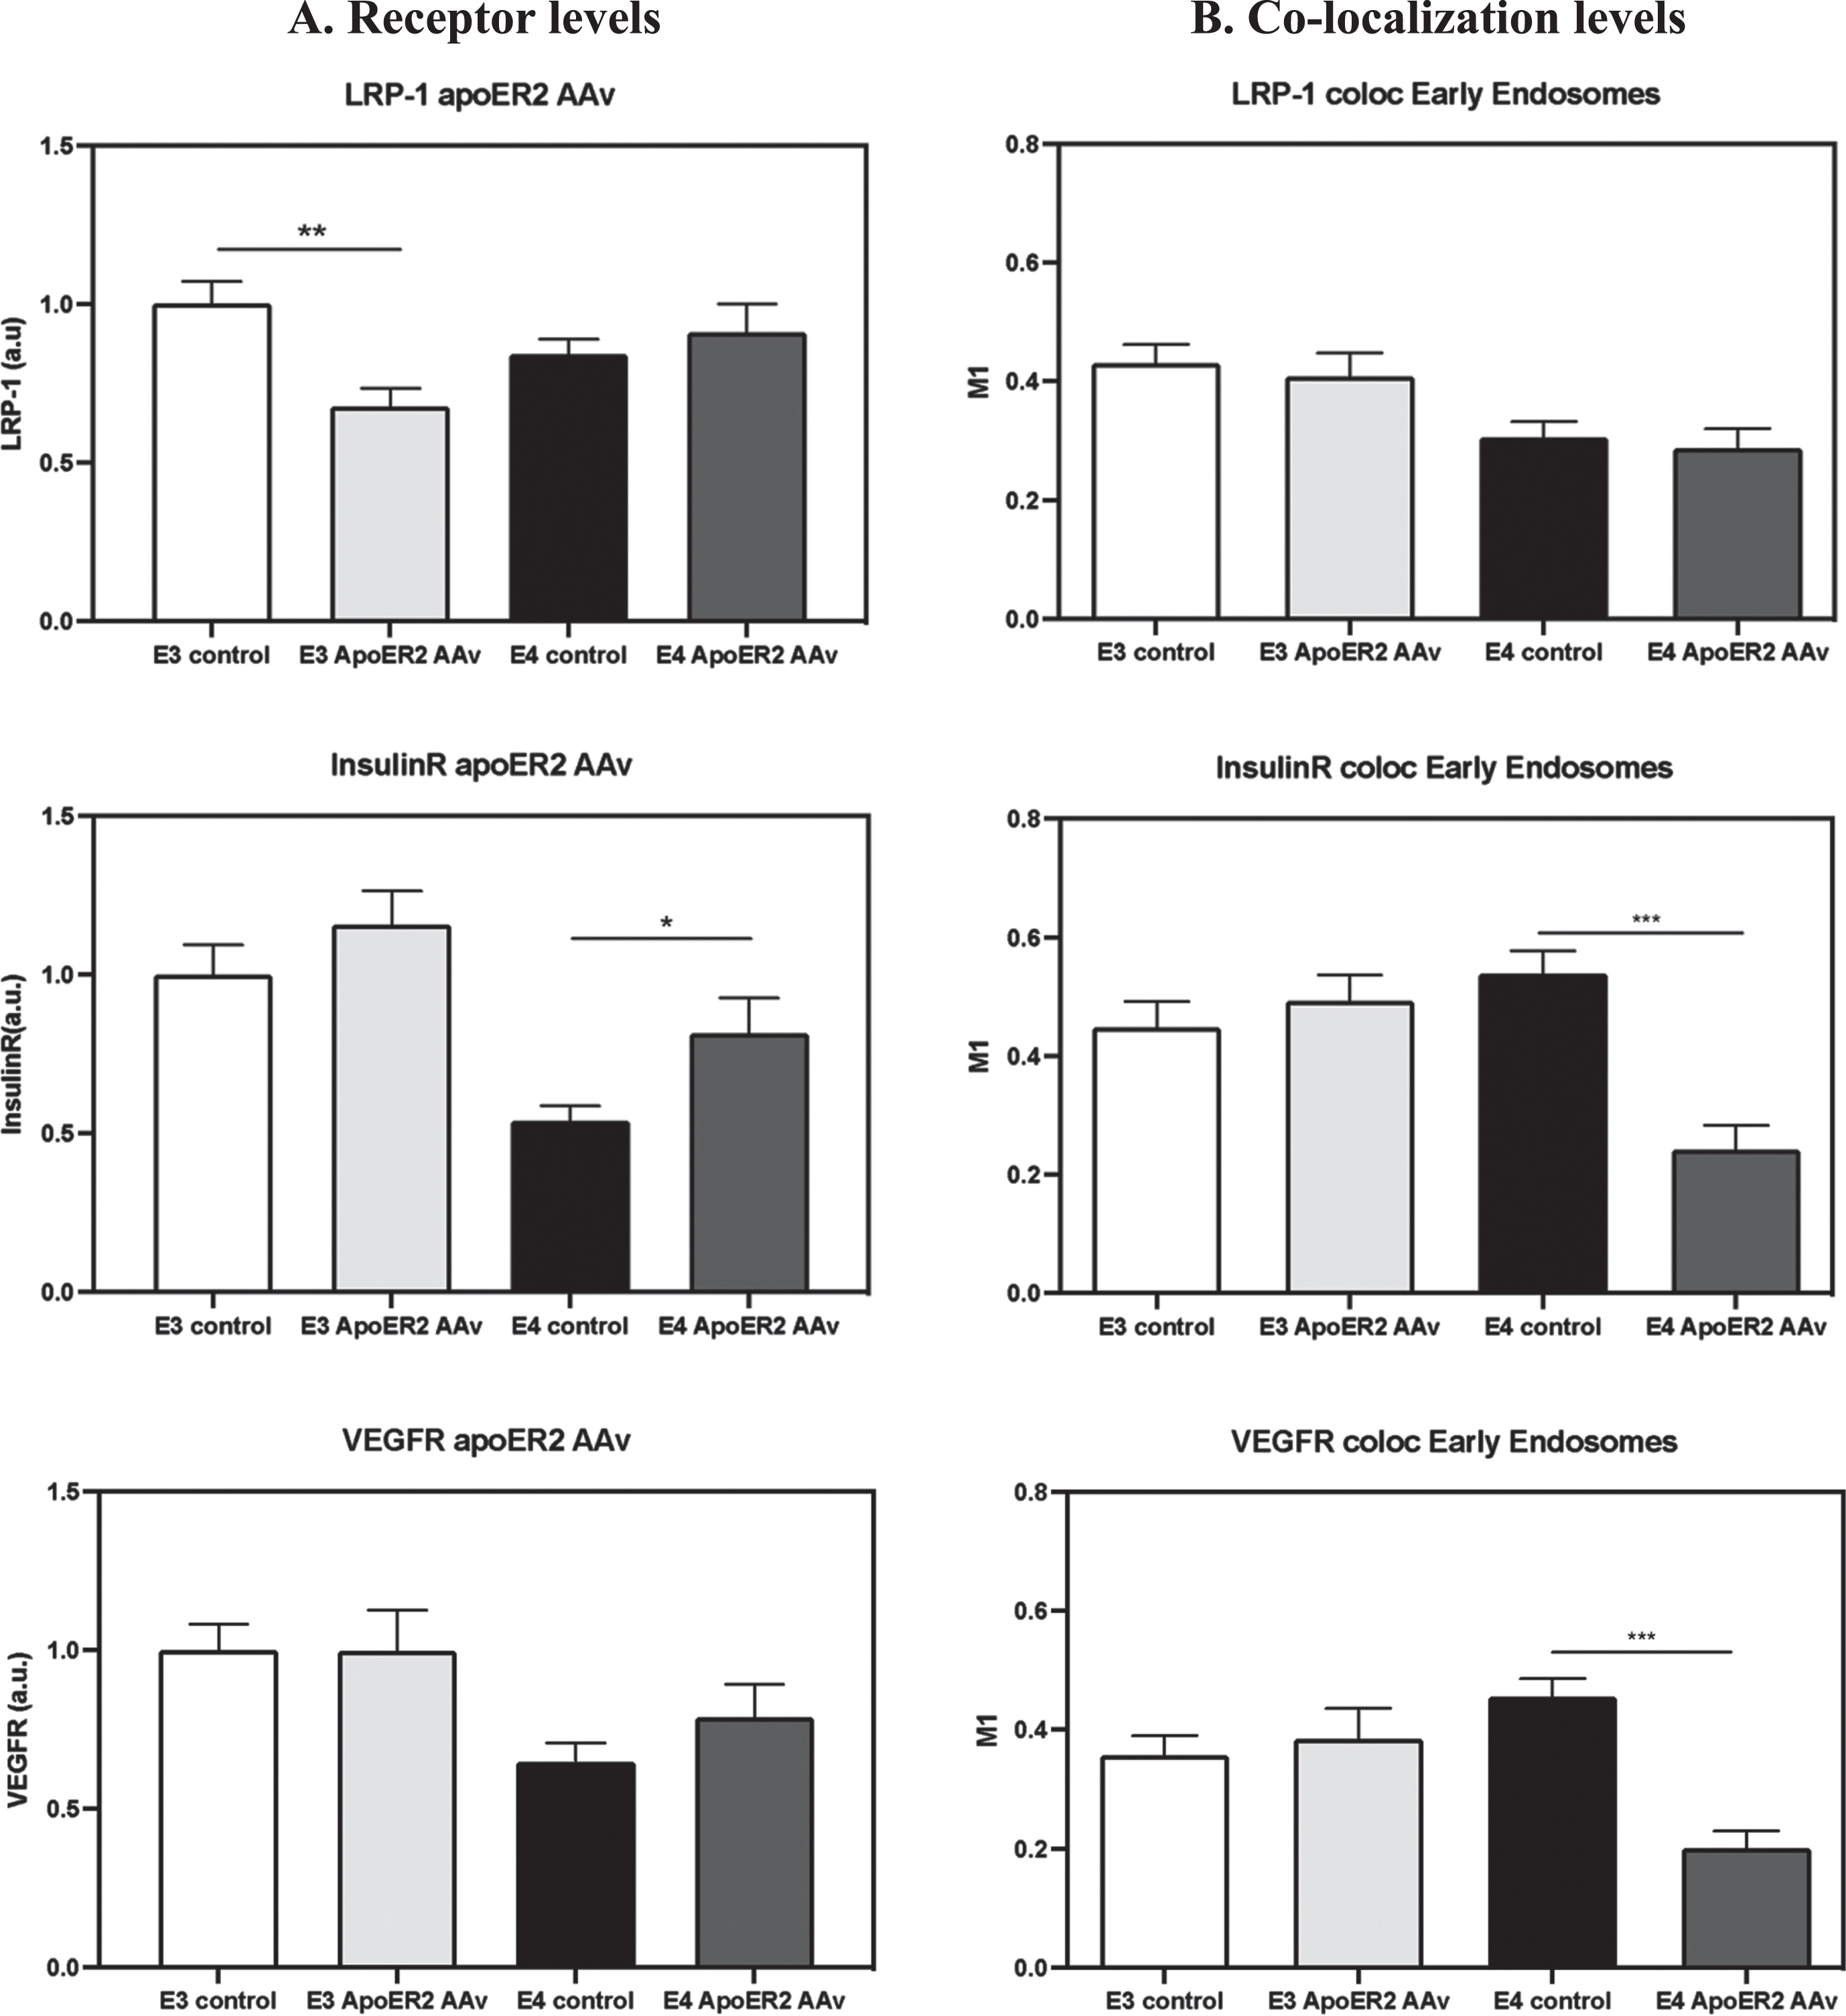
The effects of downregulating LRP1 by CRISPR/Cas9, on the levels of APOER2, IR, and VEGFR, and their colocalization with the early endosomes were measured, and the results are presented in Fig. 12. As can be seen, the downregulation of LRP1 had no significant effects on the total levels of the receptors, had no effect on the size of early endosomes (not shown), but did abolish the excess colocalization of these receptors with early endosomes in APOE4 neurons (the percent of reduction when compared to APOE4 control equals to 38.8% in APOER2, 48.9% in IR, and 64.1% in VEGFR). Whereas in APOE3 neurons, the knock-down of LRP1 resulted only in a small, but significant downregulation of the colocalization of VEGFR with the early endosomes (21.6% reduction), but it had no effect on the colocalization of IR.
Fig. 12
The effects of LRP1 knock-down on the receptors’ levels and their colocalization with early endosomes. APOE3 and APOE4 primary neurons were treated with CRISPR/Cas9 system utilizing guide RNA directed at LRP1. The results show that the downregulation of LRP1 (presented in Fig. 11) had no effect on the levels of the rest of the receptors APOER2, VEGFR, and IR (A) but it was, however, accompanied by downregulation in the levels of colocalization of the receptors with early endosomes in APOE4 neurons (B) (APOER2- APOE4 control = 0.44±0.02, APOE4-LRP1 AAv = 0.20±0.02, p < 0.0001, N = 50–53 from 5 different preparations. IR- APOE4 control = 0.53±0.03, APOE4-LRP1 AAv = 0.27±0.03, p < 0.0001, N = 34–40 from 4 different preparations. VEGFR- APOE4 control = 0.45±0.03, APOE4-LRP1 AAv = 0.16±0.02, p < 0.0001, N = 23–27 from 3 different preparations) LRP1 downregulation also resulted in reduction in the colocalization of VEGFR in the early endosomes of APOE3 neurons (APOE3 control = 0.35±0.03, APOE3-LRP1 AAv = 0.28±0.04, p < 0.05, N = 28–39 from 4 different preparations). *p < 0.05, ***p < 0.0001.
The role of APOER2 in mediating the effects of APOE genotypes on the receptors’ levels and compartmentation
The effect of APOER2 knock-down on the levels of the receptors (A) and of their colocalization with early endosomes (B) are presented in Fig. 13. Treatment with CRISPR/Cas9 directed at APOER2 resulted in the following pattern: it decreased the levels of LRP1 receptors in APOE3 neurons (32.1% reduction relative to APOE3 control) but had no effect on the levels of LRP1 in APOE4 neurons. Additionally, knock-down of APOER2 did not affect the intracellular localization of LRP1.
Fig. 13
The effect of APOER2 knock-down on the receptor’s levels and colocalization with early endosomes. APOE3 and APOE4 primary neurons were treated with CRISPR/Cas9 directed at APOER2, after which the levels and the extent of colocalization of the receptors with early endosomes were evaluated. The results show that knock-down of APOER2 results in lower levels of LRP1 in APOE3 neurons (APOE3 control = 1.00±0.06, APOE3- APOER2 AAv = 0.67±0.05, p < 0.001, N = 78–89 from 8 different preparations) while not affecting the levels in APOE4 neurons nor the extent of colocalization of LRP1 with early endosomes. On the other hand, knock-down of APOER2 resulted in elevated levels of IR and VEGFR in APOE4 neurons (IR- APOE4 control = 0.54±0.04, APOE4- APOER2 AAv = 0.82±0.11, p < 0.05, N = 32-35 from 3 different preparations. VEGFR- APOE4 control = 0.64±0.05, APOE4- APOER2 Aav = 0.79±0.11, p = 0.24, N = 27–29 from 3 different preparations) and in lower levels of colocalization of those receptors with early endosomes (IR- APOE4 control = 0.53±0.03, APOE4- APOER2 Aav = 0.24±0.04, p < 0.0001, N = 34–38 from 3 different preparations. VEGFR- APOE4 control = 0.45±0.03 APOE4- APOER2 Aav = 0.20±0.02, p < 0.0001, N = 24–28 from 3 different preparations), with no evident effect in APOE3 neurons. *p < 0.05, **p < 0.001, ***p < 0.0001.
A different pattern was observed with the growth factor receptors IR and VEGFR, where knocking down APOER2 increased the levels of IR (50.9% increase relative to APOE4 control) and VEGFR (21.3% increase relative to APOE4 control) in APOE4 neurons and decreased their colocalization with early endosomes (IR: 55.1% reduction, and VEGFR: 52.6% reduction relative to APOE4 control). In contrast, both the levels and the colocalization of IR and VEGFR in APOE3 neurons were not affected by APOER2 knock down.
Altogether, these findings suggest that the levels of all three receptors (APOER2, IR, and VEGFR) in both the APOE4 and APOE3 cells are not affected by LRP1 knock down whereas their colocalization with early endosomes decreases specifically in APOE4 neurons. Additionally, when APOER2 is knocked down, there’s an increase in the levels of VEGF and IR receptors and decrease in their colocalization with early endosomes. These findings suggest that the interaction between APOER2 and APOE4 plays a significant role in downregulating IR and VEGFR in APOE4 neurons. Knocking down APOER2 counteracts these effects. Additionally, these results indicate that both LRP1 and APOER2 are crucial for the accumulation of these receptors in early endosomes.
DISCUSSION
This study investigated the effects of APOE4 on the levels and cellular compartmentation of ApoE receptors: LRP1 and APOER2, as well as growth factor receptors: IR and VEGFR, in primary neuronal cultures. The results obtained revealed APOE-isoform-dependent differences in receptors’ levels, such that APOE4 was associated with lower levels of the four receptors when compared to APOE3. Additionally, the results show that APOE4 is associated with a decrease in the levels of the active, externally oriented membranal LRP1 and APOER2, and with a similar trend in IR and VEGFR. When examining intracellular compartments, our results showed that APOE4 does not affect the size of the early endosomes nor the recycling endosomes, yet it significantly decreases the late endosomes and the lysosomes when compared to APOE3. This could indicate that APOE4s’ effects on intracellular trafficking are mediated by interfering with the degradation pathway rather than the recycling pathway.
APOE4 also affected the trafficking and intracellular compartmentation of these receptors. Two general patterns were observed; the first, which includes APOER2, VEGFR, and the IR, is associated with increased localization of these receptors to early endosomes, and with a parallel decrease in their colocalization with late endosomes. APOER2 and VEGFR but not the IR were also associated with decreased colocalization to lysosomes. The second pattern was observed with LRP1, which showed lower colocalization with early endosome, as well as with late endosomes and with lysosomes in the APOE4 neurons.
The observed effects of APOE4 on these receptors were accompanied by lower levels of ApoE in APOE4 neurons when compared to the APOE3 neurons (Fig. 9), bringing forward the possibility that the observed effects of APOE4 on the receptors, are driven by the lower levels of the ApoE protein, and not by differential properties of APOE4 and APOE3. It is important to note that the source of ApoE in our cultures was not determined directly. Since ApoE is mostly produced in astrocytes, we believe that the main source of ApoE in our cultures is astrocytic. However, since our culture consists of a majority of neurons, and we know that ApoE can also be produced in neurons in specific conditions [68], it is possible that neurons also contribute significantly to the secreted ApoE. This differentiation is known to be important [69, 70], and differences in the effects of neuronal ApoE and astrocytic ApoE on various systems have been thoroughly studied [68–71]. The extent to which ApoE from astrocyte or from neurons may differ in their activity and effects on the receptors is beyond the scope of this article and it merits further investigation.
Regardless of the source, examination of whether the quantity or the intrinsic qualities of the different APOE genotypes was examined utilizing APOE deficient primary neuronal cultures treated with the same levels of recombinant APOE4 or APOE3, revealed that the effects of APOE4 were also apparent under these conditions (Fig. 10), suggesting that the effects observed on the receptors, are due to intrinsic differences between the genotypes, and not to differences in the levels of APOE3 and APOE4. These APOE knockout experiments also revealed that the isoform specific effects of APOE on the levels of LRP1, APOER2, and VEGFR, are driven by an APOE3 gain of function relative to APOE deficiency, whereas the corresponding effect on the IR was associated with loss of function, which was more pronounced in the APOE4 treated samples (Fig. 10). This is important, specifically for the development of novel ApoE related anti-AD treatments, since it suggests that to correct for APOE4, you need to have more of it, or to change it to a more APOE3-like activity, and not to block it.
Our results are consistent with, and further extends previous in vivo and in vitro studies which showed that neuronal APOE4 is associated with decreased levels of APOER2 [47, 49] and IR [56, 72] and with their increased localization to early endosomes [37, 48]. The present results are also in accordance with previous findings that the levels of LRP1 [73] and VEGFR [36, 74] are down regulated by APOE4. However, the effects of APOE4 on the intracellular localization of these receptors in different intracellular compartments is novel and has not been previously investigated. These findings are essential to unraveling the molecular basis of the pathological features of APOE4, and their underlying mechanisms. It should be noted that the current study measured colocalization of the receptors with intracellular compartments, and the findings suggest a dysfunction in intracellular trafficking in APOE4 neurons when compared to APOE3 neurons. However, further kinetic studies are necessary to fully unravel the molecular mechanism by which ApoE affects intracellular trafficking.
APOE4 is known to be structurally labile and undergoes transformation to a molten globule state at low pH values, while APOE3 is far more resistant to low pH unfolding [74]. Accordingly, since the isoelectric point of APOE4 is 6.4, which is similar to the pH of the early endosomes [75], it was hypothesized that the structural lability of APOE4, the tendency of proteins to aggregate at their isoelectric pH, and the binding of APOE4 to APOER2, provide the driving force for the observed decreased levels of APOER2 and its recycling block in early endosomes [46, 48]. The observed decreased level of APOER2 in late endosomes of the APOE4 neurons is most likely due to their trafficking block in early endosome. Since APOE4 can bind to IR [76], it is tempting to suggest that the effects of APOE4 on the total levels of IR and their colocalization with early and late endosomes are mediated by a mechanism that is similar to that observed with APOER2. Although direct binding of APOE4 to VEGFR has not been reported, it has been previously suggested that VEGFR binds to APOER2 [47, 77]. It is thus possible that the effects of APOE4 on the levels and intracellular trafficking of VEGFR are mediated via a tertiary complex which includes VEGFR and APOE4 bound to APOER2.
Whereas APOER2, like other ApoE receptors, contains the endocytotic motif NpxY, LRP1 also contains the motive YxxL [78]. This renders LRP1 as a very fast endocytotic receptor and could be the reason why, unlike the other receptors, APOE4 does not affect LRP1, and its trafficking to specific compartments. Alternatively, since LRP1 has a very large number of ligands [79], it is possible that other ligands mask the pathological effects of APOE4 on LRP1, by their interactions with it. Interestingly, studies of LRP1 in astrocytes revealed that unlike in neurons, LRP1 is trapped in endosomes following acidification of the endosomal compartments [80], suggesting that additional cell-specific mechanism may affect the rate and extent of intracellular trafficking of LRP1.
To further unveil the mechanisms underlying the effects of APOE4 on the receptors, we wanted to examine the involvement of APOER2 and LRP1 in the APOE4 derived effects on the receptors’ levels and localization, by knocking them down utilizing CRISPR/Cas9. Knock-down of the LRP1 receptor utilizing CRISPR/Cas9 methodology revealed no effects on the total levels of APOER2, VEGFR and IR, but resulted in reduction of their colocalization with early endosomes. This suggests that LRP1 plays a role in the trapping of the receptors in early endosomes, which is lost following downregulation of LRP1, and do not take part in controlling receptors’ levels. In contrast, downregulation of APOER2, resulted in reversal of the APOE4 driven decrease in the levels of IR and VEGFR, as well as in their decreased colocalization with early endosomes. Neither the level of LRP1, nor their colocalization with early endosomes were affected by the knock-down of APOER2. Taken together, these findings show that APOER2 plays an important role in the APOE4 driven down regulation and endosomal trapping of IR and VEGFR and have no effect on the levels and extent of endosomal localization of LRP1, suggesting that LRP1 is upstream to APOER2, and that its effects are limited to receptors’ localization, while APOER2 is affecting the other receptors in both their levels, and their localization. Taken together, the CRISPR/Cas9 experiments showed that LRP1 and APOER2 are not only affected by APOE4 pathology, but also serve as enhancers and collaborators in inducing these APOE4 related pathologies. It has previously been shown that the internalization of APOER2 results in the sequestration of NMDA and AMPA receptors in intracellular compartments, and that this effect is driven by reduction in APOER2 driven phosphorylation of the glutamate receptors [46]. This effect can induce robust effects on neuronal and excitatory synaptic activity and might be involved in various synaptic and neuronal deficits in APOE4 positive brains, as well as the cognitive deficits, and the development of AD. The extent to which such phosphorylation mediates the APOE4-driven APOER2-mediated effects on IR and VEGFR, or the possibility that these effects are mediated by a different mechanism remains to be determined. The observation that neither LRP1, nor APOER2 are markedly affected by knock-down of the other receptor, suggest that these receptors are internalized and colocalized intracellularly by different routes. This is also supported by the finding that APOER2, but bot LRP1, accumulate specifically in early endosomes of APOE4 neurons.
APOE4 is associated with increased diabetic phenotype [56, 81, 82], with increased vascular pathology [36, 83–85], and impaired plasticity and synaptic transmission [46, 86, 87]. The present findings, that APOE4 is associated with downregulation of IR and VEGFR, together with the previous observation that glutamatergic receptors are downregulated by APOE4 [46, 48] suggest that these varying APOE4 phenotypes are driven by a single mechanism, whereby APOE4 decreases the levels of these externally oriented receptors and affects their intracellular trafficking, thus leading to a large and varied spectrum of APOE4 driven pathologies. These findings have important therapeutic implications, it suggests that instead of focusing on a given APOE4 phenotype (e.g., vascular, diabetic, and synaptic pathology), therapy should be directed upstream at correcting the APOE4-APOER2 interaction, which is expected to correct for all the other, downstream pathological effects of APOE4. One way of achieving this goal is to focus on structural differences between APOE4 and APOE3, such as correction of the impaired lipidation of APOE4 which has recently been shown to reverse the APOE4-driven downregulation of APOER2 [88, 89].
In conclusion, this study unraveled a general mechanism via which APOE4 decreases the levels of ApoE receptors, as well as growth factor receptors, and impairs their intracellular trafficking, which are crucial for their activity. The ApoE receptors APOER2 and LRP1 play an important role in these effects with APOER2 affecting mainly the levels of the receptors, and LRP1 their intracellular localization and trafficking. These finding provide a unifying mechanisms whereby different pathological effects of APOE4 are driven by a similar converging mechanism, in which APOE4 down regulates many distinct receptors, each of which plays important roles in triggering different metabolic pathways. This mechanism can serve both in the study of APOE4 and its pathology, and as a potential novel target for the development of anti-APOE4 treatments, which will abolish its pathological features (compared to APOE3), which render it more involved in various diseases, with AD as the most devastating of which.
ACKNOWLEDGMENTS
The authors have no acknowledgments to report.
FUNDING
This work was supported in part by grants from the Israel Science Foundation (grant No. 794/17), from the Joseph Sagol Foundation, from the Harold Eleanore Foonberg Foundation, and from the Joseph K. and Inez Eichenbaum Foundation.
CONFLICT OF INTEREST
The authors have no conflict of interest to report.
DATA AVAILABILITY
All the data supporting the findings of this study are available within the article.
REFERENCES
[1] | Safieh M , Korczyn AD , Michaelson DM ((2019) ) APOE4: An emerging therapeutic target for Alzheimer’s disease. BMC Med 17: , 64. |
[2] | Balin BJ , Hudson AP ((2014) ) Etiology and pathogenesis of late-onset Alzheimer’s disease. Curr Allergy Asthma Rep 14: , 1–10. |
[3] | Bertram L , Tanzi RE ((2012) ) The genetics of Alzheimer’s disease. Prog Mol Biol Transl Sci 107: , 79–100. |
[4] | Naj AC , Schellenberg GD ; Alzheimer’s Disease Genetics Consortium (ADGC) ((2017) ) Genomic variants, genes, and pathways of Alzheimer’s disease: An overview. Am J Med Genet B Neuropsychiatr Genet 174: , 5–26. |
[5] | Nikolac Perkovic M , Pivac N ((2019) ) Genetic markers of Alzheimer’s disease. Adv Exp Med Biol 1192: , 27–52. |
[6] | Ridge PG , Ebbert MTW , Kauwe JSK ((2013) ) Genetics of Alzheimer’s disease. Biomed Res Int 2013: , 254954. |
[7] | Rossor MN , Iversen LL , Reynolds GP , Mountjoy CQ , Roth M ((1984) ) Neurochemical characteristics of early and late onset types of Alzheimer’s disease. Br Med J (Clin Res Ed) 288: , 961–964. |
[8] | Strittmatter WJ , Roses AD ((1996) ) Apolipoprotein E and Alzheimer’s disease. Ann Rev Neurosci 19: , 53–77. |
[9] | Roses AD ((1994) ) Apolipoprotein E affects the rate of Alzheimer disease expression: Beta-amyloid burden is a secondary consequence dependent on APOE genotype and duration of disease. J Neuropathol Exp Neurol 53: , 429–437. |
[10] | Feingold KR (2021) Introduction to lipids and lipoproteins. In Endotext [Internet], Feingold KR, Anawalt B, Blackman MR, Boyce A, Chrousos G, Corpas E, de HerderWW, Dhatariya K, Dungan K, Hofland J, Kalra S, Kaltsas G, Kapoor N, Koch C, Kopp P, Korbonits M, Kovacs CS, Kuohung W, Laferr`ere B, Levy M, McGee EA, McLachlan R, New M, Purnell J, Sahay R, Shah AS, Singer F, Sperling MA, Stratakis CA, Trence DL, Wilson DP, eds. MDText.com, Inc., South Dartmouth, MA. |
[11] | Getz GS , Reardon CA ((2018) ) Apoprotein E and reverse cholesterol transport. Int J Mol Sci 19: , 3479. |
[12] | Mahley RW ((2016) ) Central nervous system lipoproteins: ApoE and regulation of cholesterol metabolism. Arterioscler Thromb Vasc Biol 36: , 1305–1315. |
[13] | Rebeck GW ((2004) ) Cholesterol efflux as a critical component of Alzheimer’s disease pathogenesis. J Mol Neurosci 23: , 219–224. |
[14] | Kanekiyo T , Xu H , Bu G ((2014) ) ApoE and Aβ in Alzheimer’s disease: Accidental encounters or partners? Neuron 81: , 740–754. |
[15] | Kim J , Yoon H , Basak J , Kim J ((2014) ) Apolipoprotein E in synaptic plasticity and Alzheimer’s disease: Potential cellular and molecular mechanisms. Mol Cells 37: , 767–776. |
[16] | Liao F , Yoon H , Kim J ((2017) ) Apolipoprotein E metabolism and functions in brain and its role in Alzheimer’s disease. Curr Opin Lipidol 28: , 60–67. |
[17] | Poirier J , Miron J , Picard C , Gormley P , Theroux L , Breitner J , Dea D ((2014) ) Apolipoprotein E and lipid homeostasis in the etiology and treatment of sporadic Alzheimer’s disease. Neurobiol Aging 35 Suppl 2: , S3–10. |
[18] | Yamazaki Y , Zhao N , Caulfield TR , Liu CC , Bu G ((2019) ) Apolipoprotein E and Alzheimer disease: Pathobiology and targeting strategies. Nat Rev Neurol 15: , 501–518. |
[19] | Hampel H , Blennow K , Shaw LM , Hoessler YC , Zetterberg H , Trojanowski JQ ((2010) ) Total and phosphorylated tau protein as biological markers of Alzheimer’s disease. Exp Gerontol 45: , 30–40. |
[20] | Koch G , Di Lorenzo F , Loizzo S , Motta C , Travaglione S , Baiula M , Rimondini R , Ponzo V , Bonnì S , Toniolo S , Sallustio F , Bozzali M , Caltagirone C , Campana G , Martorana A ((2017) ) CSF tau is associated with impaired cortical plasticity, cognitive decline and astrocyte survival only in-positive Alzheimer’s disease. Sci Rep 7: , 13728. |
[21] | Leoni V ((2011) ) The effect of apolipoprotein E (ApoE) genotype on biomarkers of amyloidogenesis, tau pathology and neurodegeneration in Alzheimer’s disease. Clin Chem Lab Med 49: , 375–383. |
[22] | Friedland-Leuner K , Stockburger C , Denzer I , Eckert GP , Müller WE ((2014) ) Mitochondrial dysfunction: Cause and consequence of Alzheimer’s disease. Prog Mol Biol Transl Sci 127: , 183–210. |
[23] | Liraz O , Boehm-Cagan A , Michaelson DM ((2013) ) induces Aβ42, tau, and neuronal pathology in the hippocampus of young targeted replacementmice. Mol Neurodegener 8: , 16. |
[24] | Zhou M , Huang T , Collins N , Zhang J , Shen H , Dai X , Xiao N , Wu X , Wei Z , York J , Lin L , Zhu Y , LaDu MJ , Chen X ((2016) ) induces site-specific tau phosphorylation through calpain-CDK5 signaling pathway in EFAD-Tg mice. Curr Alzheimer Res 13: , 1048–1055. |
[25] | Cash JG , Kuhel DG , Basford JE , Jaeschke A , Chatterjee TK , Weintraub NL , Hui DY ((2012) ) Apolipoprotein E4 impairs macrophage efferocytosis and potentiates apoptosis by accelerating endoplasmic reticulum stress. JBiol Chem 287: , 27876–27884. |
[26] | Dorey E , Chang N , Liu QY , Yang Z , Zhang W ((2014) ) Apolipoprotein E, amyloid-beta, and neuroinflammation in Alzheimer’s disease. Neurosci Bull 30: , 317–330. |
[27] | Du Z , Jia H , Liu J , Zhao X , Xu W ((2015) ) Effects of three hydrogen-rich liquids on hemorrhagic shock in rats. J Surg Res 193: , 377–382. |
[28] | Ophir G , Amariglio N , Jacob-Hirsch J , Elkon R , Rechavi G , Michaelson DM ((2005) ) Apolipoprotein E4 enhances brain inflammation by modulation of the NF-kappaB signaling cascade. Neurobiol Dis 20: , 709–718. |
[29] | Liehn EA , Ponomariov V , Diaconu R , Streata I , Ioana M , Crespo-Avilan GE , Hernéndez-Resendiz S , Cabrera-Fuentes HA ((2018) ) Apolipoprotein E in cardiovascular diseases: Novel aspects ofan old-fashioned enigma. Arch Med Res 49: , 522–529. |
[30] | Raffai RL , Weisgraber KH ((2003) ) Cholesterol: From heart attacks to Alzheimer’s disease. J Lipid Res 44: , 1423–1430. |
[31] | Rannikmae K , Kalaria RN , Greenberg SM , Chui HC , Schmitt FA , Samarasekera N , Al-Shahi Salman R , Sudlow CLM ((2014) ) APOE associations with severe CAA-associated vasculopathic changes: Collaborative meta-analysis. J Neurol Neurosurg Psychiatry 85: , 300–305. |
[32] | Steen E , Terry BM , Rivera EJ , Cannon JL , Neely TR , Tavares R , Xu XJ , Wands JR , de la Monte SM ((2005) ) Impaired insulin and insulin-like growth factor expression and signaling mechanisms in Alzheimer’s disease–is this type 3 diabetes? . J Alzheimers Dis 7: , 63–80. |
[33] | Yarchoan M , Toledo JB , Lee EB , Arvanitakis Z , Kazi H , Han L-Y , Louneva N , Lee VM-Y , Kim SF , Trojanowski JQ , Arnold SE ((2014) ) Abnormal serine phosphorylation of insulin receptor substrate 1 is associated with tau pathology in Alzheimer’s disease and tauopathies. Acta Neuropathol 128: , 679–689. |
[34] | Moloney AM , Griffin RJ , Timmons S , O’Connor R , Ravid R , O’Neill C ((2010) ) Defects in IGF-1 receptor, insulin receptor and IRS-1/2 in Alzheimer’s disease indicate possible resistance to IGF-1 and insulin signalling. Neurobiol Aging 31: , 224–243. |
[35] | Mateo I , Llorca J , Infante J , Rodríguez-Rodríguez E , Fernéndez-Viadero C , Peña N , Berciano J , Combarros O ((2007) ) Low serum VEGF levels are associated with Alzheimer’s disease. Acta Neurol Scand 116: , 56–58. |
[36] | Salomon-Zimri S , Glat MJ , Barhum Y , Luz I , Boehm-Cagan A , Liraz O , Ben-Zur T , Offen D , Michaelson DM ((2016) ) Reversal of-driven brain pathology by vascular endothelial growth factor treatment. J Alzheimers Dis 53: , 1443–1458. |
[37] | Lane-Donovan C , Herz J ((2017) ) The ApoE receptors Vldlr and Apoer2 in central nervous system function and disease. J Lipid Res 58: , 1036–1043. |
[38] | Zhao N , Liu C-C , Qiao W , Bu G ((2018) ) Apolipoprotein E, receptors, and modulation of Alzheimer’s disease. Biol Psychiatry 83: , 347–357. |
[39] | Bu G ((2009) ) Apolipoprotein E and its receptors in Alzheimer’s disease: Pathways, pathogenesis and therapy. Nat Rev Neurosci 10: , 333–344. |
[40] | Holtzman DM , Herz J , Bu G ((2012) ) Apolipoprotein E and apolipoprotein E receptors: Normal biology and roles in Alzheimer disease. Cold Spring Harb Perspect Med 2: , a006312. |
[41] | Cam JA , Zerbinatti CV , Li Y , Bu G ((2005) ) Rapid endocytosis of the low density lipoprotein receptor-related protein modulates cell surface distribution and processing of the beta-amyloid precursor protein. J Biol Chem 280: , 15464–15470. |
[42] | Dlugosz P , Nimpf J ((2018) ) The Reelin receptors Apolipoprotein E receptor 2 (ApoER2) and VLDL receptor. Int J Mol Sci 19: , 3090. |
[43] | Nakajima C , Kulik A , Frotscher M , Herz J , Schäfer M , Bock HH , May P ((2013) ) Low density lipoprotein receptor-related protein 1 (LRP1) modulates N-methyl-D-aspartate (NMDA) receptor-dependent intracellular signaling and NMDA-induced regulation of postsynaptic protein complexes. J Biol Chem 288: , 21909–21923. |
[44] | Muratoglu SC , Mikhailenko I , Newton C , Migliorini M , Strickland DK ((2010) ) Low density lipoprotein receptor-related protein 1 (LRP1) forms a signaling complex with platelet-derived growth factor receptor-beta in endosomes and regulates activation of the MAPK pathway. J Biol Chem 285: , 14308–14317. |
[45] | Gan M , Jiang P , McLean P , Kanekiyo T , Bu G ((2014) ) Low-density lipoprotein receptor-related protein 1 (LRP1) regulates the stability and function of GluA1 α-amino-3-hydroxy-5-methyl-4-isoxazole propionic acid (AMPA) receptor in neurons. PLoS One 9: , e113237. |
[46] | Chen Y , Durakoglugil MS , Xian X , Herz J ((2010) ) reduces glutamate receptor function and synaptic plasticity by selectively impairing ApoE receptor recycling. Proc Natl Acad Sci U S A 107: , 12011–12016. |
[47] | Feng M , Cui D , Li Y , Shi J , Xiang L , Bian H , Ma Z , Xia W , Wei G ((2020) ) Carnosic acid reverses the inhibition ofon cell surface level of ApoER2 and Reelin signaling pathway. J Alzheimers Dis 73: , 517–528. |
[48] | Xian X , Pohlkamp T , Durakoglugil MS , Beck K , Lane-donovan C , Plattner F , Wong CH , Herz J ((2018) ) Reversal of-induced recycling block as a novel prevention approach for Alzheimer’s disease. Elife 7: , e40048. |
[49] | Gilat-Frenkel M , Boehm-Cagan A , Liraz O , Xian X , Herz J , Michaelson DM ((2014) ) Involvement of the Apoer2 and Lrp1 receptors in mediating the pathological effects of APOE4 in vivo. Curr Alzheimer Res 11: , 549–557. |
[50] | Laatsch A , Panteli M , Sornsakrin M , Hoffzimmer B , Grewal T , Heeren J ((2012) ) Low density lipoprotein receptor-related protein 1 dependent endosomal trapping and recycling of Apolipoprotein E. PLoS One 7: , e29385. |
[51] | Kanekiyo T , Bu G ((2014) ) The low-density lipoprotein receptor-related protein 1 and amyloid-β clearance in Alzheimer’s disease. Front Aging Neurosci 6: , 93. |
[52] | Biessels GJ , Staekenborg S , Brunner E , Brayne C , Scheltens P ((2006) ) Risk of dementia in diabetes mellitus: A systematic review. Lancet Neurol 5: , 64–74. |
[53] | Bomfim TR , Forny-Germano L , Sathler LB , Brito-Moreira J , Houzel J-C , Decker H , Silverman MA , Kazi H , Melo HM , McClean PL , Holscher C , Arnold SE , Talbot K , Klein WL , Munoz DP , Ferreira ST , De Felice FG ((2012) ) An anti-diabetes agent protects the mouse brain from defective insulin signaling caused by Alzheimer’s disease- associated Aβ oligomers. J Clin Invest 122: , 1339–1353. |
[54] | Talbot K , Wang HY , Kazi H , Han LY , Bakshi KP , Stucky A , Fuino RL , Kawaguchi KR , Samoyedny AJ , Wilson RS , Arvanitakis Z , Schneider JA , Wolf BA , Bennett DA , Trojanowski JQ , Arnold SE ((2012) ) Demonstrated brain insulin resistance in Alzheimer’s disease patients is associated with IGF-1 resistance, IRS-1 dysregulation, and cognitive decline. J Clin Invest 122: , 1316–1338. |
[55] | Keeney JT-R , Ibrahimi S , Zhao L ((2015) ) Human ApoE isoforms differentially modulate glucose and amyloid metabolic pathways in female brain: Evidence of the mechanism of neuroprotection by ApoE2 and implications for Alzheimer’s disease prevention and early intervention. Alzheimers Dis 48: , 411–424. |
[56] | Zhao N , Liu C-C , Van Ingelgom AJ , Martens YA , Linares C , Knight JA , Painter MM , Sullivan PM , Bu G ((2017) ) Apolipoprotein E4 impairs neuronal insulin signaling by trapping insulin receptor in the endosomes. Neuron 96: , 115–129.e115. |
[57] | Liu CC , Hu J , Tsai CW , Yue M , Melrose HL , Kanekiyo T , Bu G ((2015) ) Neuronal LRP1 regulates glucose metabolism and insulin signaling in the brain. J Neurosci 35: , 5851–5859. |
[58] | Simons M ((2012) ) An inside view: VEGF receptor trafficking and signaling. Physiology (Bethesda) 27: , 213–222. |
[59] | Licht T , Keshet E ((2013) ) Delineating multiple functions of VEGF-A in the adult brain. Cell Mol Life Sci 70: , 1727–1737. |
[60] | Jopling HM , Odell AF , Pellet-Many C , Latham AM , Frankel P , Sivaprasadarao A , Walker JH , Zachary IC , Ponnambalam S ((2014) ) Endosome-to-plasma membrane recycling of VEGFR2 receptor tyrosine kinase regulates endothelial function and blood vessel formation. Cells 3: , 363–385. |
[61] | Belinson H , Lev D , Masliah E , Michaelson DM ((2008) ) Activation of the amyloid cascade in apolipoprotein E4 transgenic mice induces lysosomal activation and neurodegeneration resulting in marked cognitive deficits. J Neurosci 28: , 4690–4701. |
[62] | Bar R , Boehm-Cagan A , Luz I , Kleper-Wall Y , Michaelson DM ((2017) ) The effects of apolipoprotein E genotype, α-synuclein deficiency, and sex on brain synaptic and Alzheimer’s disease-related pathology. Alzheimers Dement (Amst) 10: , 1–11. |
[63] | Katzenell S , Cabrera JR , North BJ , Leib DA ((2017) ) Isolation, purification, and culture of primary murine sensory neurons. Methods Mol Biol 1656: , 229–251. |
[64] | Zinchuk V , Zinchuk O , Okada T ((2007) ) Quantitative colocalization analysis of multicolor confocal immunofluorescence microscopy images: Pushing pixels to explore biological phenomena. Acta Histochem Cytochem 40: , 101–111. |
[65] | Adler J , Parmryd I ((2010) ) Quantifying colocalization by correlation: The pearson correlation coefficient is superior to the Mander’s overlap coefficient. Cytometry A 77: , 733–742. |
[66] | Doudna JA , Charpentier E ((2014) ) Genome editing. The new frontier of genome engineering with CRISPR-Cas9. Science 346: , 1258096. |
[67] | Hanlon KS , Kleinstiver BP , Garcia SP , Zaborowski MP , Volak A , Spirig SE , Muller A , Sousa AA , Tsai SQ , Bengtsson NE , Lööv C , Ingelsson M , Chamberlain JS , Corey DP , Aryee MJ , Joung JK , Breakefield XO , Maguire CA , György B ((2019) ) High levels of AAV vector integration into CRISPR-induced DNA breaks. Nat Commun 10: , 4439. |
[68] | Mahley RW ((2016) ) Central nervous system lipoproteins. Arterioscler Thromb Vasc Biol 36: , 1305–1315. |
[69] | Li X , Zhang J , Li D , He C , He K , Xue T , Wan L , Zhang C , Liu Q ((2021) ) Astrocytic ApoE reprograms neuronal cholesterol metabolism and histone-acetylation-mediated memory. Neuron 109: , 957–970.e958. |
[70] | Konings SC , Torres-Garcia L , Martinsson I , Gouras GK ((2021) ) Astrocytic and neuronal apolipoprotein E isoforms differentially affect neuronal excitability. Front Neurosci 15: , 734001. |
[71] | Huang S , Zhang Z , Cao J , Yu Y , Pei G ((2022) ) Chimeric cerebral organoids reveal the essentials of neuronal and astrocyticfor Alzheimer’s tau pathology. Signal Transduct Target Ther 7: , 176. |
[72] | Chan ES , Chen C , Soong TW , Wong BS ((2018) ) Differential binding of human ApoE isoforms to insulin receptor is associated with aberrant insulin signaling in AD brain samples. Neuromol Med 20: , 124–132. |
[73] | Rapp A , Gmeiner B , Hüttinger M ((2006) ) Implication of apoE isoforms in cholesterol metabolism by primary rat hippocampal neurons and astrocytes. Biochimie 88: , 473–483. |
[74] | Morrow JA , Hatters DM , Lu B , Höchtl P , Oberg KA , Rupp B , Weisgraber KH ((2002) ) Apolipoprotein E4 forms a molten globule: A potential basis for its association with disease. J Biol Chem 277: , 50380–50385. |
[75] | Pohlkamp T , Xian X , Wong CH , Durakoglugil MS , Werthmann GC , Saido TC , Evers BM , White CL , Connor J , Hammer RE , Herz J ((2021) ) NHE6 depletion corrects-mediated synaptic impairments and reduces amyloid plaque load. eLife 10: , e72034. |
[76] | Chan ES , Chen C , Cole GM , Wong B-S ((2015) ) Differential interaction of Apolipoprotein-E isoforms with insulin receptors modulates brain insulin signaling in mutant human amyloid precursor protein transgenic mice. Sci Rep 5: , 13842. |
[77] | Howell KR , Hoda MN , Pillai A ((2013) ) VEGF activates NR2B phosphorylation through Dab1 pathway. Neurosci Lett 552: , 30–34. |
[78] | Roebroek AJM , Reekmans S , Lauwers A , Feyaerts N , Smeijers L , Hartmann D ((2006) ) Mutant Lrp1 knock-in mice generated by recombinase-mediated cassette exchange reveal differential importance of the NPXY motifs in the intracellular domain of LRP1 for normal Fetal development. Mol Cell Biol 26: , 605. |
[79] | LHerz J , Strickland DK ((2001) ) LRP: A multifunctional scavenger and signaling receptor. J Clin Invest 108: , 779–784. |
[80] | Prasad H , Rao R ((2018) ) Amyloid clearance defect inastrocytes is reversed by epigenetic correction of endosomal pH. , . Proc Natl Acad Sci U S A 115: , E6640–E6649. |
[81] | Koren-Iton A , Salomon-Zimri S , Smolar A , Shavit-Stein E , Dori A , Chapman J , Michaelson DM ((2020) ) Central and peripheral mechanisms in-driven diabetic pathology. Int J Mol Sci 21: , 1289. |
[82] | Li L , Cavuoto M , Biddiscombe K , Pike KE , Ravona-Springer R ((2020) ) Diabetes mellitus increases risk of incident dementia inAPOEɛ4 carriers: A meta-analysis. J AlzheimersDis 74: , 1295–1308. |
[83] | Tai LM , Thomas R , Marottoli FM , Koster KP , Kanekiyo T , Morris AWJ , Bu G ((2016) ) The role of APOE in cerebrovascular dysfunction. Acta Neuropathol 131: , 709–723. |
[84] | Zlokovic BV ((2013) ) Cerebrovascular effects of apolipoprotein E: Implications for Alzheimer disease. JAMA Neurol 70: , 440–444. |
[85] | Rohn TT ((2014) ) Is apolipoprotein E4 an important risk factor for vascular dementia? . Int J Clin Exp Pathol 7: , 3504–3511. |
[86] | Kerr ME , Kamboh MI , Yookyung K , Kraus MF , Puccio AM , DeKosky ST , Marion DW ((2003) ) Relationship betweenallele and excitatory amino acid levels after traumatic brain injury. Crit Care Med 31: , 2371–2379. |
[87] | Sweet RA , MacDonald ML , Kirkwood CM , Ding Y , Schempf T , Jones-Laughner J , Kofler J , Ikonomovic MD , Lopez OL , Garver ME , Fitz NF , Koldamova R , Yates NA ((2016) ) Apolipoprotein E*4 (APOE*4) genotype is associated with altered levels of glutamate signaling proteins and synaptic coexpression networks in the prefrontal cortex in mild to moderate Alzheimer disease. Mol Cell Proteomics 15: , 2252–2262. |
[88] | Boehm-Cagan A , Michaelson DM ((2014) ) Reversal of-driven brain pathology and behavioral deficits by bexarotene. J Neurosci 34: , 7293–7301. |
[89] | Boehm-Cagan A , Bar R , Liraz O , Bielicki JK , Johansson JO , Michaelson DM ((2016) ) ABCA1 agonist reverses the-driven cognitive and brain pathologies. J Alzheimers Dis 54: , 1219–1233. |

