
Knowledge graphs for enhancing transparency in health data ecosystems1
Abstract
Tailoring personalized treatments demands the analysis of a patient’s characteristics, which may be scattered over a wide variety of sources. These features include family history, life habits, comorbidities, and potential treatment side effects. Moreover, the analysis of the services visited the most by a patient before a new diagnosis, as well as the type of requested tests, may uncover patterns that contribute to earlier disease detection and treatment effectiveness. Built on knowledge-driven ecosystems, we devise DE4LungCancer, a health data ecosystem of data sources for lung cancer. In this data ecosystem, knowledge extracted from heterogeneous sources, e.g., clinical records, scientific publications, and pharmacological data, is integrated into knowledge graphs. Ontologies describe the meaning of the combined data, and mapping rules enable the declarative definition of the transformation and integration processes. DE4LungCancer is assessed regarding the methods followed for data quality assessment and curation. Lastly, the role of controlled vocabularies and ontologies in health data management is discussed, as well as their impact on transparent knowledge extraction and analytics. This paper presents the lessons learned in the DE4LungCancer development. It demonstrates the transparency level supported by the proposed knowledge-driven ecosystem, in the context of the lung cancer pilots of the EU H2020-funded project BigMedilytic, the ERA PerMed funded project P4-LUCAT, and the EU H2020 projects CLARIFY and iASiS.
1.Introduction
Lung cancer (LC) is Europe’s most common cause of cancer death, with an estimated 353,000 deaths yearly. LC has the highest economic cost in Europe, with direct costs of caring for patients with the disease amounting to more than €3 billion per year [57]. Although costly, lung cancer therapies can be more effective, and the chances to respond are higher when diagnosed in the early stages [42].
Biomedical data have experienced exponential growth in the last decade; they encode valuable knowledge which can be exploited for accurate disease diagnostics and personalized treatments [51,53]. Nevertheless, lung cancer is a heterogeneous disease whose precise diagnosis requires a holistic analysis of multiple variables, usually collected from data sources represented in myriad formats. Some examples of these heterogeneous data sources include electronic health records (EHRs) comprising unstructured clinical notes expressed in a particular language (e.g., Spanish, English, or German); EHRs offering structured data annotated with controlled vocabularies (e.g., SNOMED/LOINC22); unstructured scientific publications; and scientific databases with data collections in semi-structured formats.
Various computational tasks must be implemented to ensure interoperability across heterogeneous data sources. In the case of unstructured datasets, Natural Language Processing (NLP) techniques are required to recognize biomedical entities and link them to biomedical-controlled vocabularies or ontologies in all these data sources. Additionally, data exchange, sharing, and processing need to respect data privacy and access regulations imposed by the data providers and ethical and legal committees. Lastly, the decisions made during data processing need to be interpretable and verifiable. These data complexities impose requirements that must be solved toward a meaningful analysis of knowledge encoded by integrating these data sources.
To put the role of data integration into perspective, this paper presents patterns between lung cancer treatments and the interactions among the drugs that compose each treatment. The studied therapies are collected from clinical records, while drug–drug interactions are extracted from DrugBank and the scientific literature, and inferred using a deductive system. They represent use cases where analytics on top of integrated data can support a better understanding of the factors that may impact treatment effectiveness.
Research Goal: The main objective is two-fold: first, we aim to overcome interoperability and data quality issues in lung cancer data and provide a knowledge-driven framework where analytical methods provide the basis for answering clinical research questions. Second, tasks and decisions implemented in the knowledge-driven framework should be traceable to enhance the framework’s transparency and trustability of the analytical results.
Proposed Solution: Built on recent results from the literature [20], we devise a knowledge-driven data ecosystem (DE) named DE4LungCancer, and provide a computational framework to exchange and integrate data while preserving personal data privacy, data security, and ethical and legal regulations. DE4LungCancer is a nested framework that incorporates three DEs: (i) Clinical DE: receives unstructured EHRs in Spanish and transforms them into structured databases in tabular (i.e., relational database). (ii) Scholarly DE: processes scientific publications related to lung cancer and provides a fine-grained representation of the topics and relations mentioned in a scientific article. (iii) Scientific Open DE: extracts from scientific databases main properties of biomedical entities (e.g., drugs, enzymes, disorders) and their relations or interactions among them (e.g., drug–drug and drug–side effect interactions).
Contributions: DE4LungCancer integrates the data processed by each of these DEs and creates a knowledge graph (KG) where data and their meaning coexist. The KG comprises entities (modeled as nodes) and their properties and relationships (modeled as edges). Biomedical ontologies and controlled vocabularies are also part of the KG; they are utilized to annotate the entities in the KG. These annotations result from the various NLP methods implemented at each basic DE or at the overall DE4LungCancer DE level. They provide the basis for aligning equivalent entities in the KG. The World Wide Web Consortium (W3C) standard Resource Description Framework (RDF) is used to represent the KG, while the Shapes Constraint Language (SHACL) expresses the integrity constraints over the KG. The KG relies on a unified schema to provide an integrated view of the concepts and properties merged in the KG.
The process of data integration is also defined using declarative languages R2RML (a W3C standard), RML (the RDF Mapping Language), and FnO (the Function Ontology). The data integration process is declaratively defined as mapping rules in RML + FnO; they express correspondences between data sources, and classes and properties from the unified schema. Transformation functions are expressed in FnO and included as part of the mapping rules. This integrated view of data pre-processing and integration results in a modular and reusable specification of the KG creation process, which can be easily verifiable and traceable. Web APIs have been implemented over the KG and the data processed by each basic DE. The goal is to uncover patterns in the hospital services visited by lung cancer patients that provide insights into the conditions of these patients before the lung cancer diagnosis. The results of these analyses have driven the design of five clinical interventions to identify which of the hospital services visited by lung cancer patients have more potential for diagnosis and may contribute to earlier detection. The reported results uncover patterns in the visited services that provide insights into the potential clinical conditions of patients diagnosed with lung cancer. Although further analyses are required, these patterns can support early diagnosis and prognosis. More importantly, if validated, they will allow clinicians to detect the disease in an asymptomatic phase, reducing complications, which usually increase the complexity of these patients and their response.
DE4LungCancer has been applied in the context of iASiS,33 BigMedilytics,44 P4-LUCAT,55 and EU H2020 CLARIFY.66 iASiS is a European Union Horizon 2020-funded project that seeks to pave the way for precision medicine by utilizing patient data insights. iASiS focuses on two disease use cases: lung cancer and dementia. BigMedilytics is an H2020 project aiming to develop innovative data-driven solutions to improve the healthcare system in Europe. BigMedilytics covers many chronic diseases and frequent cancers (e.g., prostate, lung, and breast). Specifically, in the lung cancer pilot, the goal is to process biomedical data sources and uncover patterns that enhance the understanding of the risk of suffering lung cancer or the effectiveness of treatment. Data sources are in different formats. P4-LUCAT is an ERA-NET project in Personalized Medicine to support oncologists prescribing lung cancer treatments. CLARIFY is a European Union Horizon 2020 research and innovation project funded to exploit biomedical data and Artificial Intelligence techniques to identify risk factors that may deteriorate a patient’s condition after oncological treatment. CLARIFY covers lymphoma as well as lung and breast cancer. DE4LungCancer is integrated into the whole data ecosystem of the CLARIFY framework to enable the management of lung cancer clinical records from the Puerta del Hierro University Hospital in Madrid.
In these projects, DE4LungCancer enables the integration of biomedical data sources and provides a knowledge graph from where analytical methods are performed. As a proof of concept, this paper presents some of these methods and reports on the outcomes that have motivated the execution of clinical interventions to enhance treatment effectiveness and lung cancer patients’ quality of life. The portion of the DE4LungCancer KG that comprises open data is publicly available and accessible via a SPARQL endpoint.77 This KG includes drugs, treatments, and drug–drug interactions among the drugs of these treatments. It also integrates aggregated data about the number of lung cancer patients that observed a particular outcome when a therapy was administrated. This KG could be the basis for future analysis and benchmarking analytical methods to discover drug–drug interactions in treatments.
Structure of the Document. This article comprises six additional sections. Section 2 presents requirements to be satisfied at data management, clinical, and ethical and legal levels in the context of lung cancer. DE4LungCancer is defined in Section 3, and Section 4 describes the data quality issues assessed in the data ecosystems that compose DE4LungCancer. Section 5 presents the evaluation of DE4LungCancer, and Section 6 summarizes the state of the art. Lastly, Section 7 wraps up and outlines future work.
2.Challenges in health data ecosystems
European Health Data Ecosystems target to strengthen the sustainability of health systems across Europe by reducing costs while improving quality and access to care.88 They aim to broaden the repertoire of computational methods that bolster conscientious diagnosis and treatments. Moreover, they require the definition of best practices for data sharing and integration and preserving privacy and ethical regulations.
2.1.Requirements in health data ecosystems
Requirements can be classified into three categories: Data Management: includes all the needs to be satisfied during sharing, curation, management, processing, and data and metadata analysis. Clinical: the requirements in this category correspond to requests stated by the oncologists to support the design of clinical interventions. Ethical & Legal: this category comprises the requirements for preserving personal data privacy and security, and ensuring that ethical and legal regulations are fulfilled.
Data Management Requirements (DRs). The requirements in this group are aligned with the needs for data management in data ecosystems proposed by Geisler and Vidal et al. [20]. DR1 Management of data in various formats, e.g., unstructured clinical records and scientific publications, and semi-structured data in scientific databases like DrugBank. DR2 Data and metadata must satisfy the integrity constraints defined by clinicians. Moreover, all the decisions made for data quality assessment and curation must be interpretable and verifiable. DR3 The data management processes need to be transparent. In addition, stakeholders should be able to trace the steps implemented to transform data from different formats and integrate them into a unified knowledge base (a.k.a. knowledge graph). Specifically, to satisfy DR3, we consider DR4 and state that the data sources should be defined in terms of a unified schema that describe all the properties of the entities collected in the data sources. The correspondences or mappings among data sources and the unified schema should be declarative and available to be checked and verified.
Clinical Requirements. These requirements are specified in key performance indicators (KPIs). As a proof of concept, we present five KPIs that have guided the development of DE4LungCancer; however, the techniques presented in this paper are generic and can be applied to satisfy other KPIs. These five KPIs aim to discover the factors that impact the patients’ quality of life and the usage of healthcare services. The data ecosystem should offer services on top of the integrated data to check these KPIs. The validation of these KPIs is through medical interventions to optimize them. KPI1: Duration in days of the hospital stays of the lung cancer patients. KPI2: Identification of patients at risk of developing lung-cancer. KPI3: Number of admissions to the emergency room in a given time period. KPI4: Toxicities observed in lung cancer patients who suffer from comorbidities, and receive oncological and non-oncological drugs. KPI5: Degree of satisfaction of the lung cancer patients treated by oncologists supported by the DE4LungCancer services.
Ethical Requirements (ERs). The requests in this category are also aligned with the Ethical and Legal requirements proposed by Geisler and Vidal et al. [20], the European Union guidelines for Trustworthy AI [16], and the regulations of the Spanish Law of Personal Data Access99 (Leyes 15/1999 and 41/2002). ER1 Follow a legal framework where patient privacy is respected and clinical records are utilized as indicated in the consent granted by lung cancer patients. ER2 Accounting bias and fairness to guarantee that none of the recommendations given by data ecosystem analytical tools is affected by sensitive attributes (e.g., age or ethnicity). ER3 Traceability of the satisfaction of data privacy regulations during data ingestion, processing, integration, and analysis. ER4 Documenting and explaining quality issues.
2.2.A lung cancer data ecosystem
The main goal of a lung cancer data ecosystem is to develop analytical tools that give oncologists insights to improve the management of patients with lung cancer during their treatment, follow-up, and last period of life through data-driven techniques. Additionally, they aim to improve patients’ experience, satisfaction, and primary outcomes and save substantial health costs. Moreover, admissions and readmissions due to toxicities and comorbidities present in lung cancer patients need to be traced to reduce visits to emergency care and hospitalizations. A lung cancer data ecosystem should provide the basis to identify the potential side effects of a lung cancer treatment and the adverse events generated by the interactions among the treatment drugs.
There are four different categories of stakeholders in a Lung Cancer data ecosystem. Data are exchanged across these stakeholders, preserving data access and privacy regulations. Oncologists: clinical partners responsible for treating lung cancer patients, collecting the clinical data, defining the clinical goals, and designing and running the clinical interventions. Data Scientists: technical partners who develop all the techniques to ingest, process, integrate, and analyze the pilot data. They are also responsible for devising all the methods to preserve data privacy and respect what is stated in the patients’ consent. Ethical & Legal Boards: experts in ethical and legal regulations to preserve data privacy. Software Developers: technical partners who develop the computational framework and implement the data ecosystem.
3.DE4LungCancer
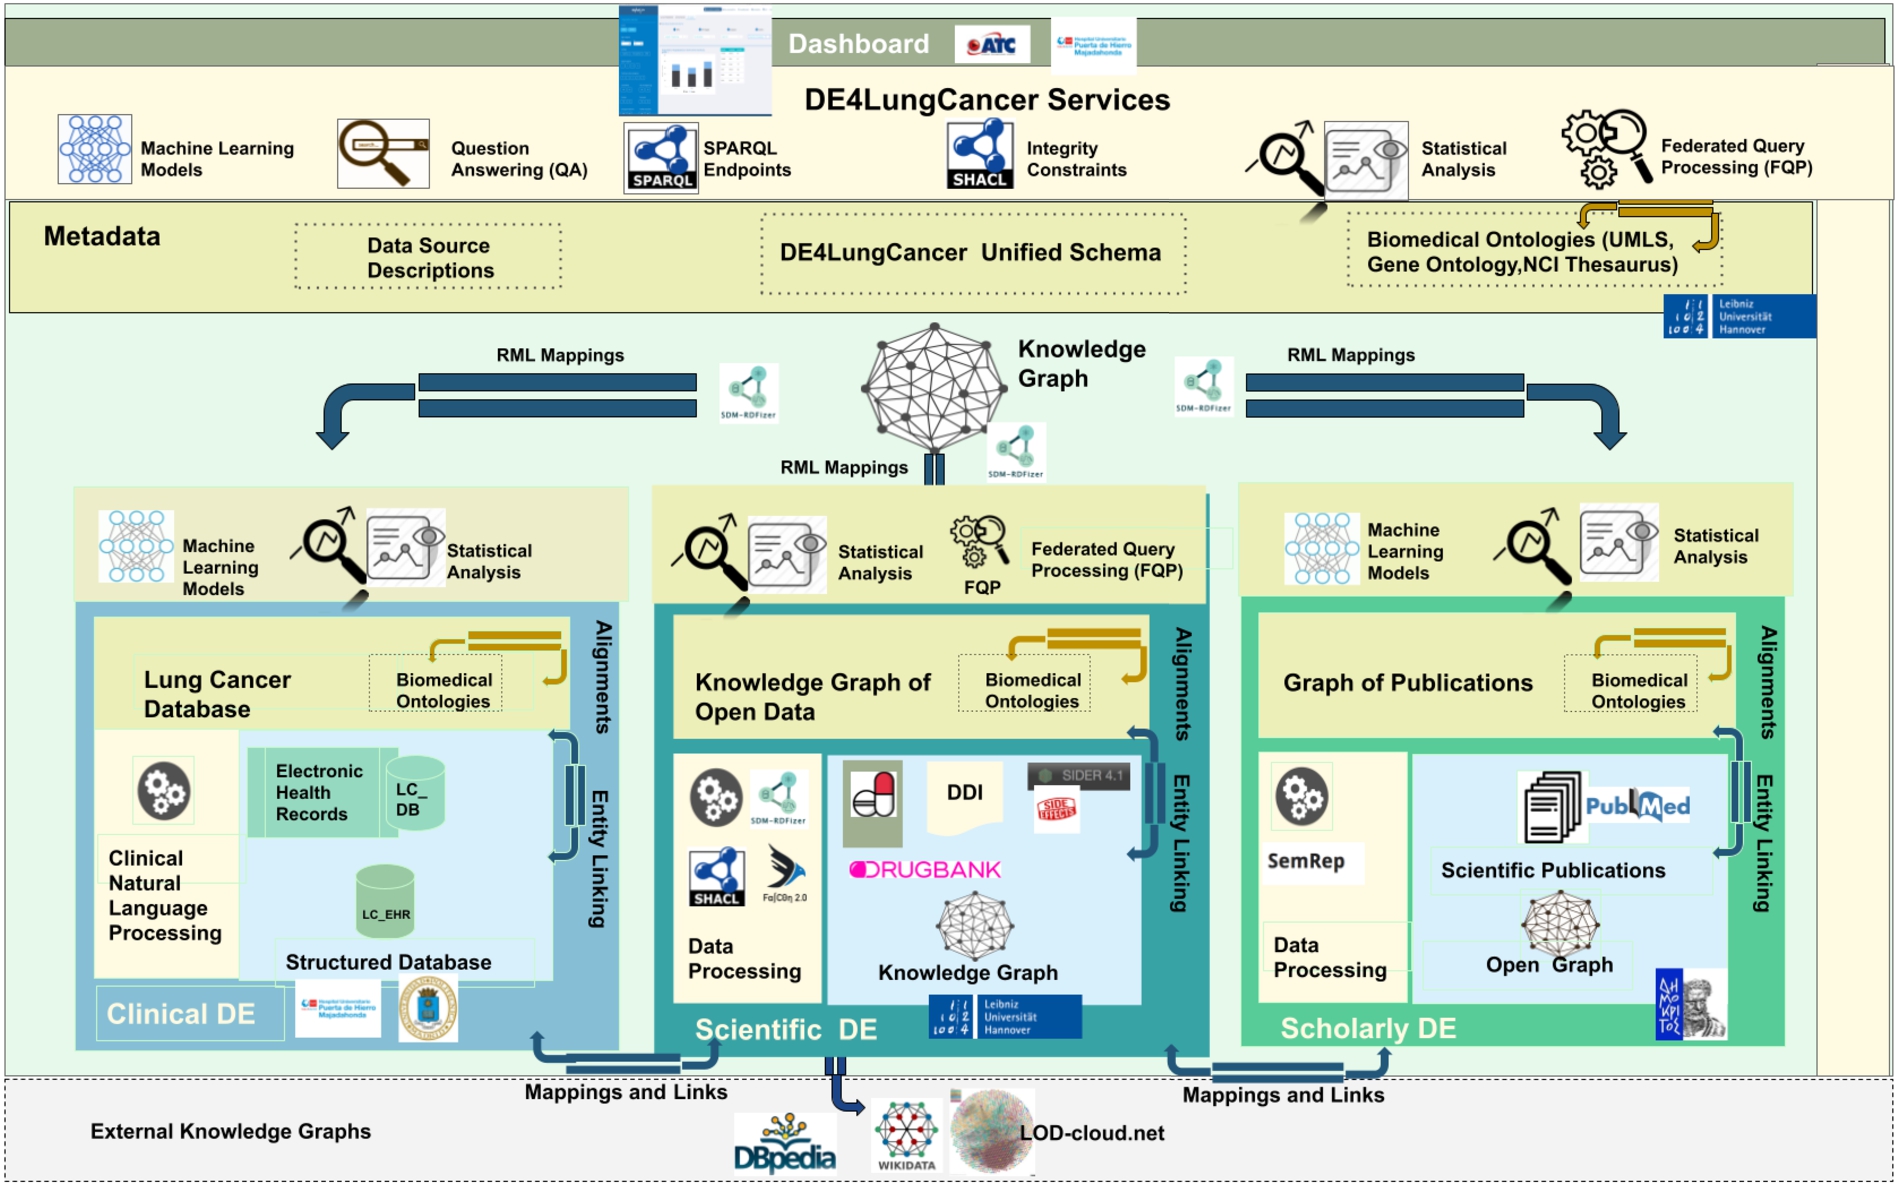
The DE4LungCancer framework is devised as a network of data ecosystems (DEs) [20]; it aligns data and metadata to describe the network and its components. Heterogeneity issues across the different datasets are overcome by various data curation and integration methods. Each DE comprises datasets and programs for accessing, managing, and analyzing their data. Interoperability issues across the datasets of the DEs are solved in a unified schema. Mapping rules between the datasets and the unified schema describe the meaning of the datasets. Figure 1 illustrates the components of the DE4LungCancer Data Ecosystem. The metadata layer specifies biomedical vocabularies (e.g., Unified Medical Language System-UMLS1010 or Human Phenotype Ontology-HPO1111). The DE4LungCancer DE is a nested framework that is also composed of three basic DEs: Clinical, Scholarly, and Scientific Open. These basic DEs are described in terms of datasets, metadata, and methods; they enable each basic DE to conduct individual analyses based on locally collected data. These DEs are described in Section 3.1. On the other hand, the nested DE4LungCancer DE comprises the basic DEs and integrates the data processed by each. As a result, the nested DE4LungCancer DE provides a holistic profile of a lung cancer patient composed of the data process by Clinical, Scholarly, and Scientific Open DEs; these profiles are represented in the DE4LungCancer knowledge graph (KG). Section 3.2 describes the nested DE4LungCancer DE in terms of the datasets of the basic DEs, and the operators, metadata, mappings, integrity constraints, and service executed on top of them.
Fig. 1.
The DE4LungCancer data ecosystem.
3.1.Basic data ecosystems
3.1.1.Clinical data ecosystem
Clinical data is collected from electronic health records from more than 1,242 lung cancer patients registered in the Electronic Health Record (EHR) system at the Puerta del Hierro University Hospital in Madrid from 2008 to January 2020. The data is extracted from 315,891 notes and 16,550 reports; it represents clinical variables of lung cancer patients and the services consulted by those patients before and after diagnosis. A pseudonymization process maps each patient with a local identifier in the Clinical DE. This way, all the clinical notes and examinations of the same person are integrated. The clinical data providers generate and keep alignments between the actual identifiers and the pseudonymized ones. The statistical analysis performed on EHR follows a stage of Natural Language Processing of raw data to extract patient characteristics and visited medical services at the hospital. The (statistical) analysis performed on EHR concerned KPI-1: Length of hospital stay; and KPI-2: Identification of people at risk of developing lung cancer.
Raw data: 1,242 EHR of patients from 2008–2020, 416 patients were hospitalized 942 times. Out of these 416 patients, 166 had one hospitalization in the first three months after diagnosis. The remaining 250 did not have a hospitalization in the first three months after diagnosis, but they had at least one hospitalization up to six months after the diagnosis.
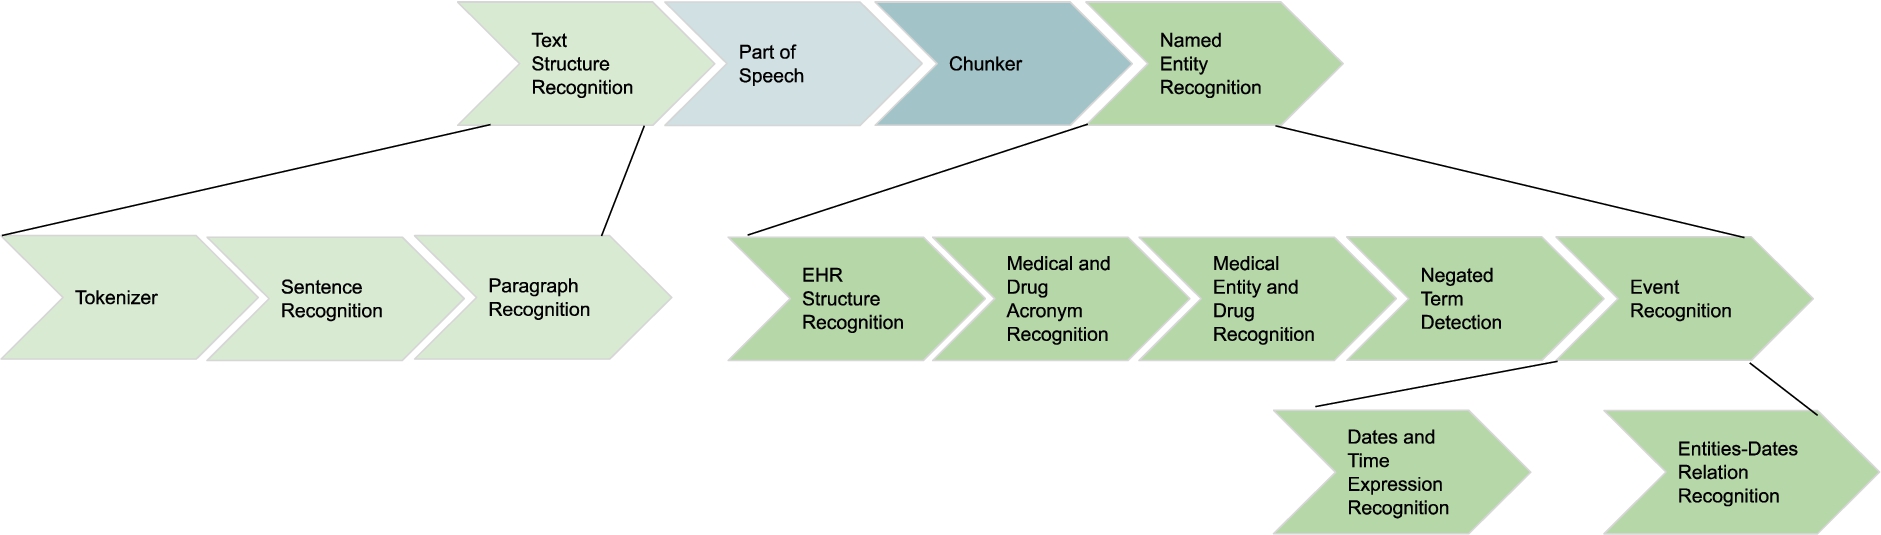
NLP processing on EHR: Natural Language Processing (NLP) techniques are applied to EHR to extract relevant entities from unstructured fields, i.e., clinical notes or lab test results. The NLP techniques rely on medical vocabularies and rules to perform lemmatization, Named Entity Recognition (NER). The final result is annotating the extracted concepts (i.e., Named Entities) with terms from medical vocabularies. Figure 2 depicts the NLP pipeline that transforms unstructured EHRs into structured data.
Fig. 2.
NLP pipeline for knowledge extraction in the clinical data ecosystem.
3.1.2.Scholarly data ecosystem
Scholarly data are obtained by harvesting scientific publications from PubMed (i.e., article abstracts) and PubMed Central (i.e., article full-texts), along with scholarly metadata such as the author list, journal, and publication year. To retrieve publications only related to lung cancer, the Entrez Programming Utilities API1212 available by PubMed is queried with the MeSH topic “Lung Neoplasms”, collecting also the rest of the MeSH topics related to each article. Except from the scholarly metadata available in PubMed, other meta-information are also retrieved, such as the citations of each publication by querying the Scopus Citations Count API,1313 as well as the Hirsch index (h-index) and SCImago Journal Rank (SJR) indicator of each journal, available from the SCImago Lab1414 in the context of the Scimago Journal & Country Rank project.1515
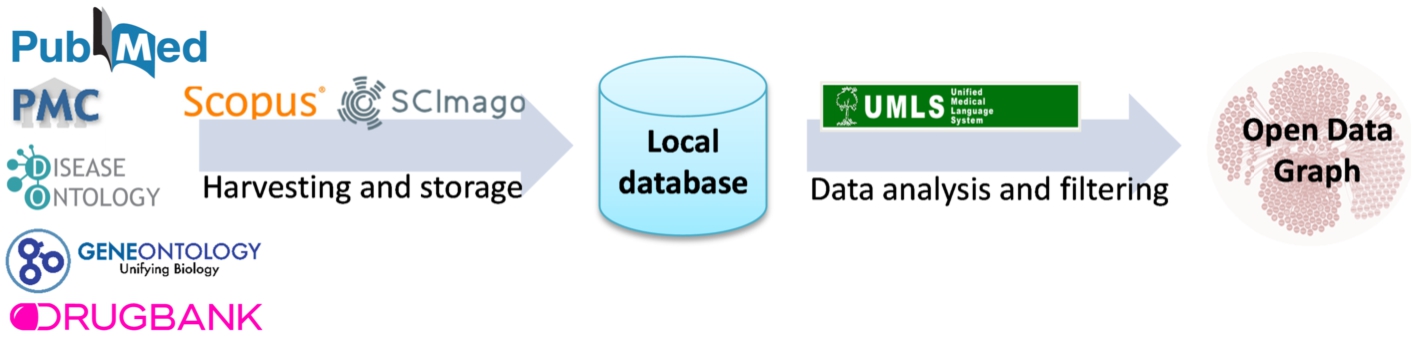
Natural Language Processing is applied to the article abstracts or the whole text of the article, where it is freely available. Analyzing scientific publications’ text, triplets consisting of two entities connected by a relation (e.g., Hemofiltration-TREATS-Patients) are being produced. The process is performed with industry-standard software. Metamap1616 performs named entity recognition, returning the named entities and a confidence factor. SemRep1717 performs relation extraction while relying on MetaMap. The result of this NLP process is an open data graph. The NLP pipeline is depicted in Fig. 3. In addition, the original articles are annotated with MeSH terms, and UMLS annotates the resulting triplets. This data mining task with a drug–drug interaction discovery process. Specifically, we utilize the open data graph to address the problem of predicting new drug–drug interactions (DDIs) as a binary classification problem for interacting/non-interacting drug pairs. To this end, we employ a machine learning technique analyzing the undirected semantic paths connecting different pairs of drugs in the open data graph [8]. The sequences of relations in semantic paths are used to create a set of features for many drug pairs related to lung cancer. Those features are then used to train a Random Forest classifier that can effectively discriminate between interacting and non-interacting pairs, using the Drugbank database as a gold standard. This classifier has produced 22,346 drug–drug interaction predictions with a certain confidence score based on the drug pairs’ semantic paths. Section 5.1 reports on evaluating the impact of DDIs in response to a lung cancer treatment. This method is denoted as Literature prediction.
Fig. 3.
NLP pipeline for knowledge extraction implemented in the scholarly data ecosystem.
3.1.3.Scientific open data ecosystem
Scientific databases (e.g., DrugBank and SIDER) and encyclopedic knowledge bases (e.g., Wikidata and DBpedia) are the main sources of open data. These sources encode knowledge about drugs, their approved indications, the side effects, and the drug–drug interactions and effects. All these features are present as short textual descriptions. In the provided version of the Scientific Open DE, we have collected data from DrugBank1818 (version 5.1.8 in XML), SIDER1919 (2018 tabular), KEGG2020 (release 99, in JSON), TTD [60] (version 7.1.01, tabular) and DGIdb [19] (version 4.2.0, tabular). In specific, we have downloaded 1,550,586 drug–drug interactions, 60,177 side effects of drugs, 2,333 drug indications, 10,150 drug-target, 4,523 drug-enzyme, and 44,166 drug-gene interactions. These data collections enable the understanding of the impact on toxicities and drug effectiveness of the drugs of oncological treatments.
The techniques of named entity recognition (NER) and named entity linking (NEL) enable the identification of biomedical entities from textual attributes. The rule-based entity linking engine, FALCON [49], performs NER and NEL on this data ecosystem. FALCON is configurable for linking entities to diverse controlled vocabularies or knowledge graphs (KG), e.g., UMLS, DBpedia, or Bio2RDF. FALCON recognizes entities by mapping instances of a word within a short text, i.e., surface forms into the textual representation of entities in a controlled vocabulary or KG. FALCON resorts to a knowledge base and a catalog of rules for recognizing and linking entities. The knowledge base integrates various sources, e.g., DBpedia, Wikidata, Oxford Dictionary, and Wordnet. Additionally, it comprises alignments between nouns and entities in these sources. Alignments are stored in a text search engine, e.g., ElasticSearch, while the knowledge sources are maintained in an RDF triple store accessible via SPARQL endpoints. Moreover, the catalog of rules encodes the English morphology; they are represented as conjunctive rules and provide a forward chaining inference process for entity recognition in English short texts. The main feature of FALCON is the ability to split a short input text into a minimal number of entities that more precisely represent the words in the text. Thus, FALCON is devised to solve the optimization problem of maximizing the number of words linked to an entity/relation while minimizing the number of recognized entities/relations. This feature is extremely relevant for the scientific open data ecosystem entity, e.g., a drug or a disease can be expressed with several words, e.g., thoracic aortic aneurysms. In Section 5.1, we report the results of analyzing the effects of DDIs in a treatment’s response; the NER and NEL method performed by FALCON is named DrugBank because DDIs are extracted from this database. Additionally, the deductive system (DS) proposed by Rivas and Vidal [46] uncovers DDIs resulting from combining several drugs. The extensional database comprises the DDIs extracted by FALCON from DrugBank. At the same time, the intensional rules state the conditions to be met, among the interactions of a group of drugs, to generate new DDIs. We name this method DS prediction in the evaluation reported in Section 5.1.
3.2.The nested DE4LungCancer data ecosystem
As proposed by Geisler and Vidal et al. [20], the nested DE4LungCancer Data Ecosystem is defined as a 6-tuple
3.2.1.Datasets
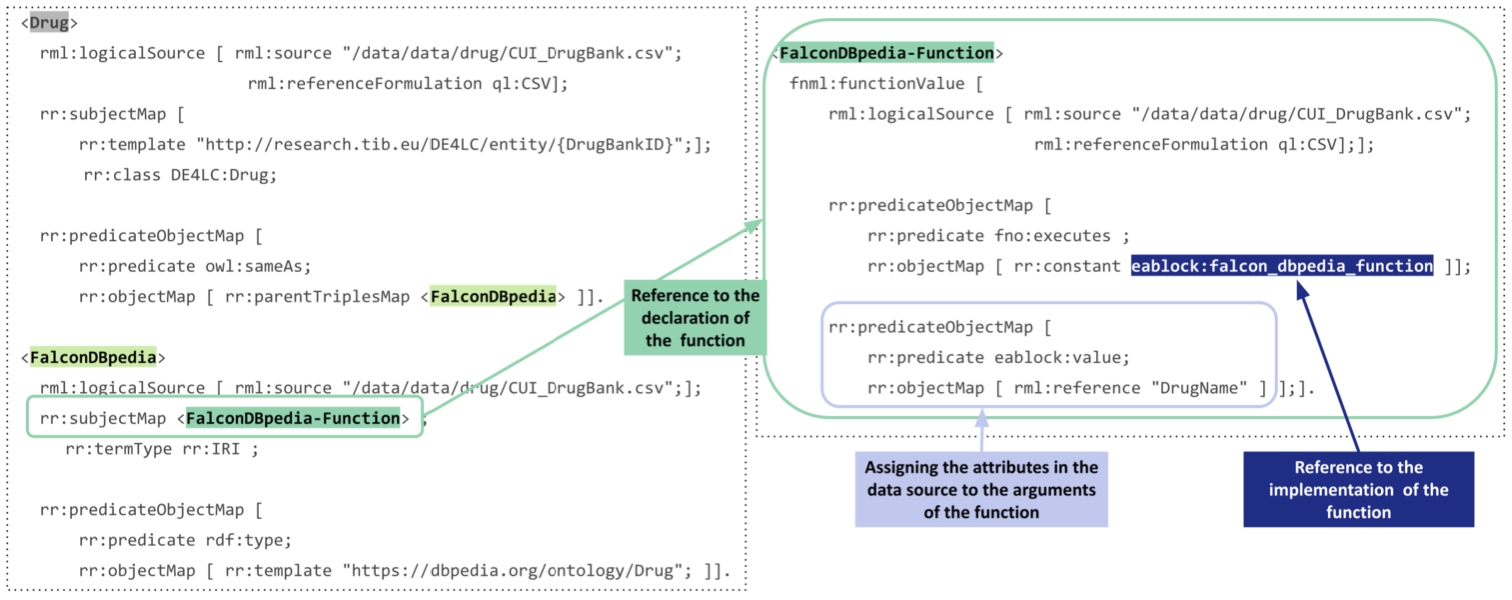
The DE4LungCancer Data Ecosystem integrates three categories of data sources collected from the basic data ecosystems: Processed Clinical Data Database produced by the Clinical Data DE as the result of the EHR NLP; 1,242 EHRs are described in terms of 320 attributes. The data is structured and presented in a relational database. Additionally, the information about the hospital services visited by the patients is shared in a relational database. The values of the attributes are in English and Spanish, and attributes like treatments are diagnostics annotated with terms from UMLS. Scholarly Data A data graph – in Neo4J2121 – representing 162,394 scientific publications in a graph with 402,020 nodes and 12,256,983 edges. Each publication is described with a PubMed identifier, title, year, journal, authors, SCImago Journal rank indicator (sjr), H-index, number of citations, and the link to SCOPUS with all the information of the article. Moreover, publications are annotated with 4,821,501 associations describing the relationship has topic, 7,368,157 associations for the relationship mention in, and 166,219 associations between UMLS terms. Scientific Open Data 11,292 drugs described in terms of the conditions for which the drug can be prescribed and its interactions with targets and enzymes. There are also 60,177 relations between drugs and side effects, 1,550,586 drug–drug interactions extracted from the Literature and DrugBank, and 502,839 predicted drug–drug interactions discovered by various predictive methods. RML allows for the specification of mapping rules against data sources in JSON, XML, CSV, and relational tables. However, as described above, the datasets collected by the three DEs are in different formats, i.e., tabular, property graphs, and semi-structured data. To overcome the structural interoperability issues across all the data sources, a pre-processing step has been added to the pipeline of KG creation. It extracts data from the property graphs, related to publications and DDIs predicted by the Literature method. As a result, data from Neo4j property graphs are transformed into tabular data whose schema preserves the Third Normal Form (3NF). Albeit not required for RML, 3NF tabular data enables a more efficient evaluation of RML rules because duplicates are reduced. Additionally, the FnO functions included in the RML mapping rules enable the execution of NER and NEL task while the mapping rules are executed. These rules define declaratively the transformations required to overcome heterogeneity issues in semi-structured data in the surface forms of short text. Figure 4 presents an exemplary RML, where data is collected from a logical source in the tabular format CSV (represented with the statement rml:referenceFormulation ql:CSV). This rule defines the instances of the class DE4LC:Drug and establishes the alignments of these drugs with resources in DBpedia.
Fig. 4.
An exemplary RML mapping rule calling one FnO function named FalconDBpedia-Function. This function performs NER and EL to link drug names to resources in DBpedia.
3.2.2.Metadata
Biomedical ontologies and controlled vocabularies describe the data and provide a unified description and annotation. These annotations represent the basis of the data integration methods to merge the data into a KG. The values in the datasets are annotated with terms from the Unified Medical Language System. These annotations enable entity alignment and provide the basis for integrating the datasets into the KG. The KG includes 3,862,429 terms from the semantic groups “Anatomy”, “Disorders”, “Physiology”, “Procedures”, “Concepts & Ideas”, “Chemicals & Drugs”, “Living Beings”, “Activities & Behaviors”, “Objects”, “Devices”, “Phenomena”, “Occupations”, “Organizations”, “Geographic Areas”, and “Genes & Molecular Sequences”. A unified schema provides an integrated view of the data sources. The DE4LungCancer unified schema is expressed in the W3C standard data model RDF. This increases interoperability and facilitates reusability of existing vocabularies and ontologies, e.g., the RDF Schema2222 (RDFS), the Web Ontology Language2323 (OWL), and PROV-O2424 (Provenance Ontology). The unified schema comprises 80 classes, 64 object properties, and 110 datatypes. To ensure findability and availability, the unified schema is published2525 in VoCol [23] at the TIB-Leibniz Information Centre for Science and Technology. VoCol is a collaborative platform for ontology development that enables the development of vocabularies using Version Control Systems. VoCol brings the following advantages: Collaborative Support: Several users can work simultaneously in the development of the ontology, and changes are synchronized automatically. Quality Assurance: Syntactic validation of the unified schema to comply with RDF, RDFS, and OWL, and semantic validation for consistency checking. Analysis: VoCoL provides ontology management features that enable the visualization and exploration of the ontology. VoCoL also provides an interface for specifying queries against the unified schema and its classes and properties. The documentation describing each class and property metadata can be consulted, as well as, a basic analysis summarizing the number of classes and properties that compose the unified schema. Moreover, the unified schema can be traversed using the graph depicted as a ForceGraph. Thus, FAIR principles (Findability, Availability, Interoperability, and Reusability) [21] are respected; they represent the basis of a transparent plan for data management in DE4LungCancer.
3.2.3.Mappings
The correspondences between the data sources and the unified schema are defined using the W3C standards RDF Mapping Language (RML) [13] and R2RML. R2RML and RML mapping rules can comprise transformation functions expressed in existing ontologies (e.g., the Function Ontology-FnO). These mappings are expressed in RDF and can be stored in a triplestore (e.g., Virtuoso or GraphDB). Exemplar SPARQL queries are presented in Section A. Query in Listing 1 retrieves metadata about the RML mapping rules that define a particular class, while query in Listing 2 collects the functions included in the RML mapping rules. These functions are expressed in FnO and are part of the toolbox EABlock2626 [28,29]. This toolbox includes functions that solve entity alignment over biomedical textual attributes. They are built on top of FALCON [49] for solving the tasks of Named Entity Recognition (NER) and Entity Linking (EL). Specifically, three functions are used; they enhance data quality by aligning the recognized biomedical entities to terms in UMLS, Wikipedia [54], and DBpedia [5]. More importantly, the specification in RDF and the semantic description using FnO provide standard documentation of entity alignment and establish the basis for tracking down the data integration process. In the DE4LungCancer DE, the combination of R2RML, RML, and FnO represents a powerful formalism to specify the pipeline for integrating data into the KG declaratively. Moreover, as observed in Listings 1 and 2, this specification enhances transparency and facilitates the traceability of the decisions taken during KG creation. The DE4LungCancer KG is defined in terms of 524 RML mappings that include 20 calls to five of EABlock functions. A SPARQL endpoint with the unified schema and the triples maps is publicly available;2727 the execution of the SPARQL queries in Listings 1 and 2 provides a view of the metadata that describes the management processes implemented on top of the datasets. Figure 4 presents an RML where the FnO FalconDBpedia-Function enables the linking of drug names into resources of DBpedia. The number of links added by this method is reported in Table 4. The mapping rules have been defined by two knowledge engineers and reviewed by another two knowledge engineers, clinicians, and technical partners. These rules have been devised considering the concepts in the DE4LungCancer unified schema, the metadata describing the concepts in the DE4LungCancer data sources, and communications with the domain experts. Figure 5 reports on the number of RML mapping rules per class and their properties in the unified schema. On average, a class is defined by 9.4 mapping rules (standard deviation 16.4). In particular, DE4LC:Annotation and DE4LC:LCPatient are defined using 116 and 40 mappings, respectively.
Fig. 5.
RML mapping rules per RDF class in the DE4LungCancer unified schema.
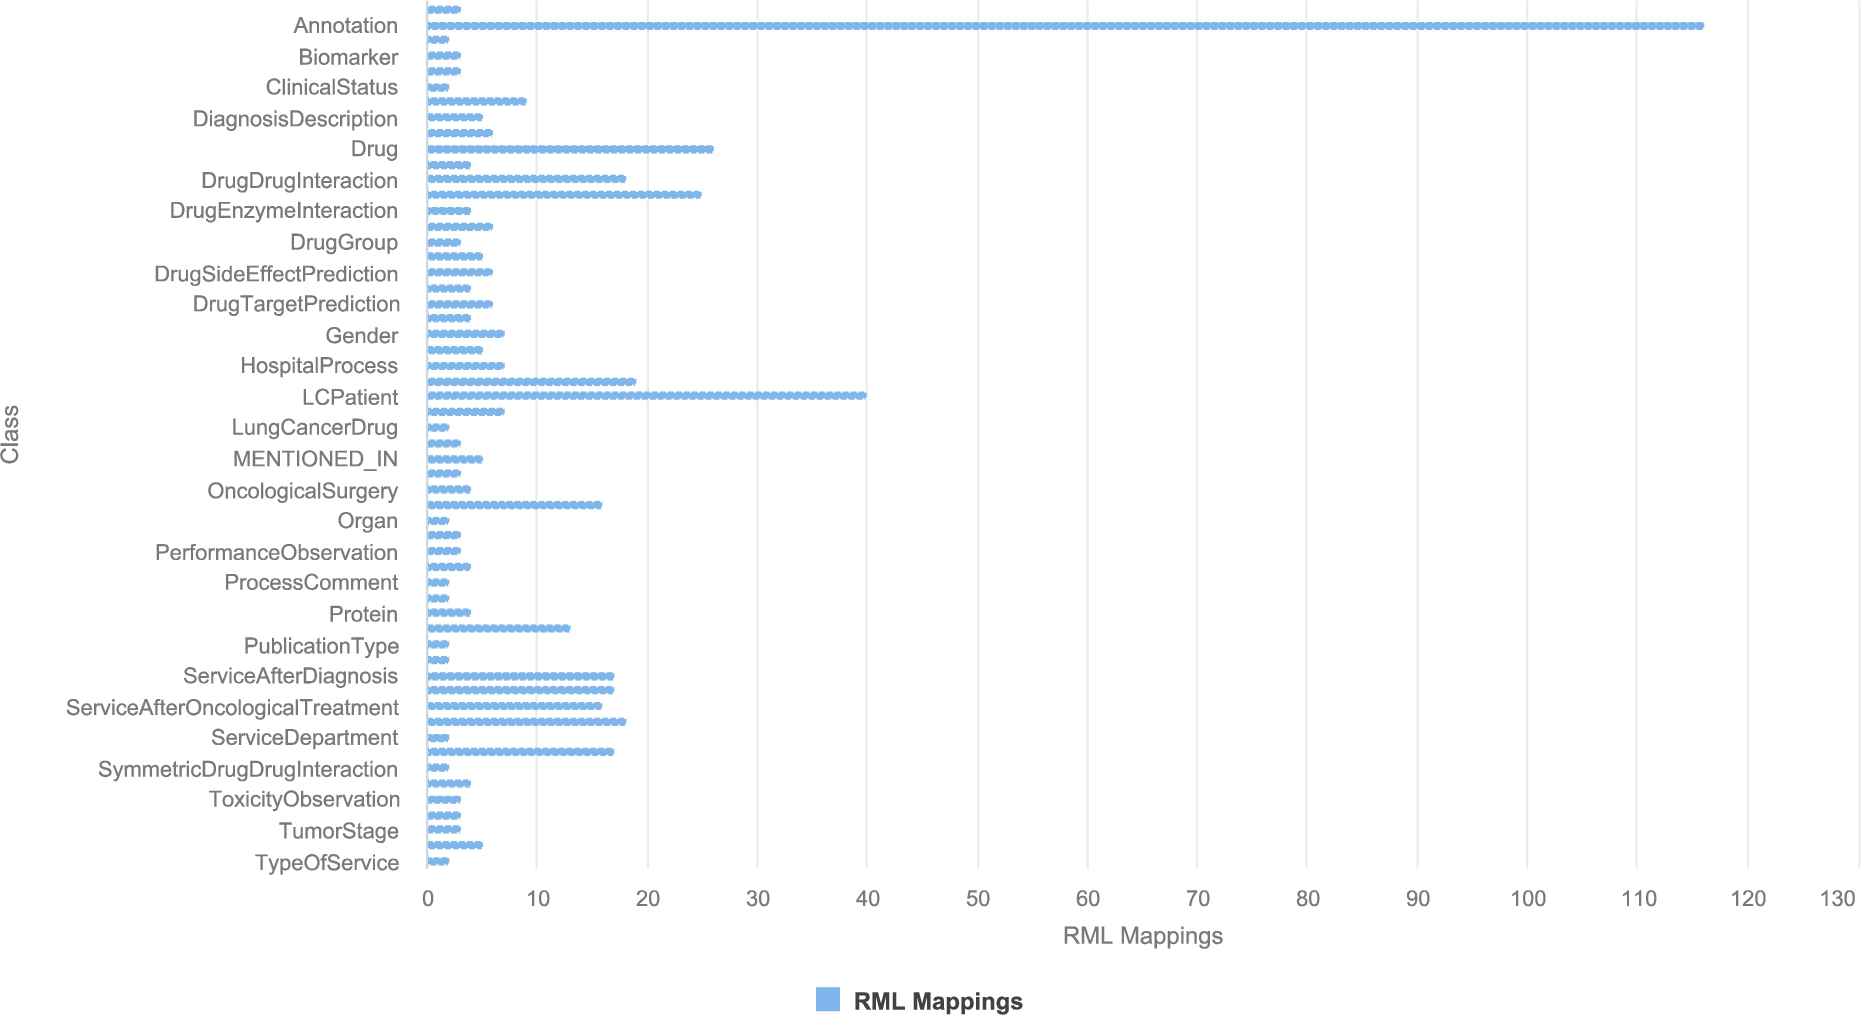
Fig. 6.
RDF classes in the KG. Annotations of entities extracted from publications (DE4LC:MENTION_IN and DE4LC:HAS_TOPIC), clinical records and scientific open data (DE4LC:Annotation) are the most populated. DE4LC:MENTION_IN, DE4LC:HAS_TOPIC, and DE4LC:Annotation have 7,368,157; 4,821,501; and 3,862,414 entities.
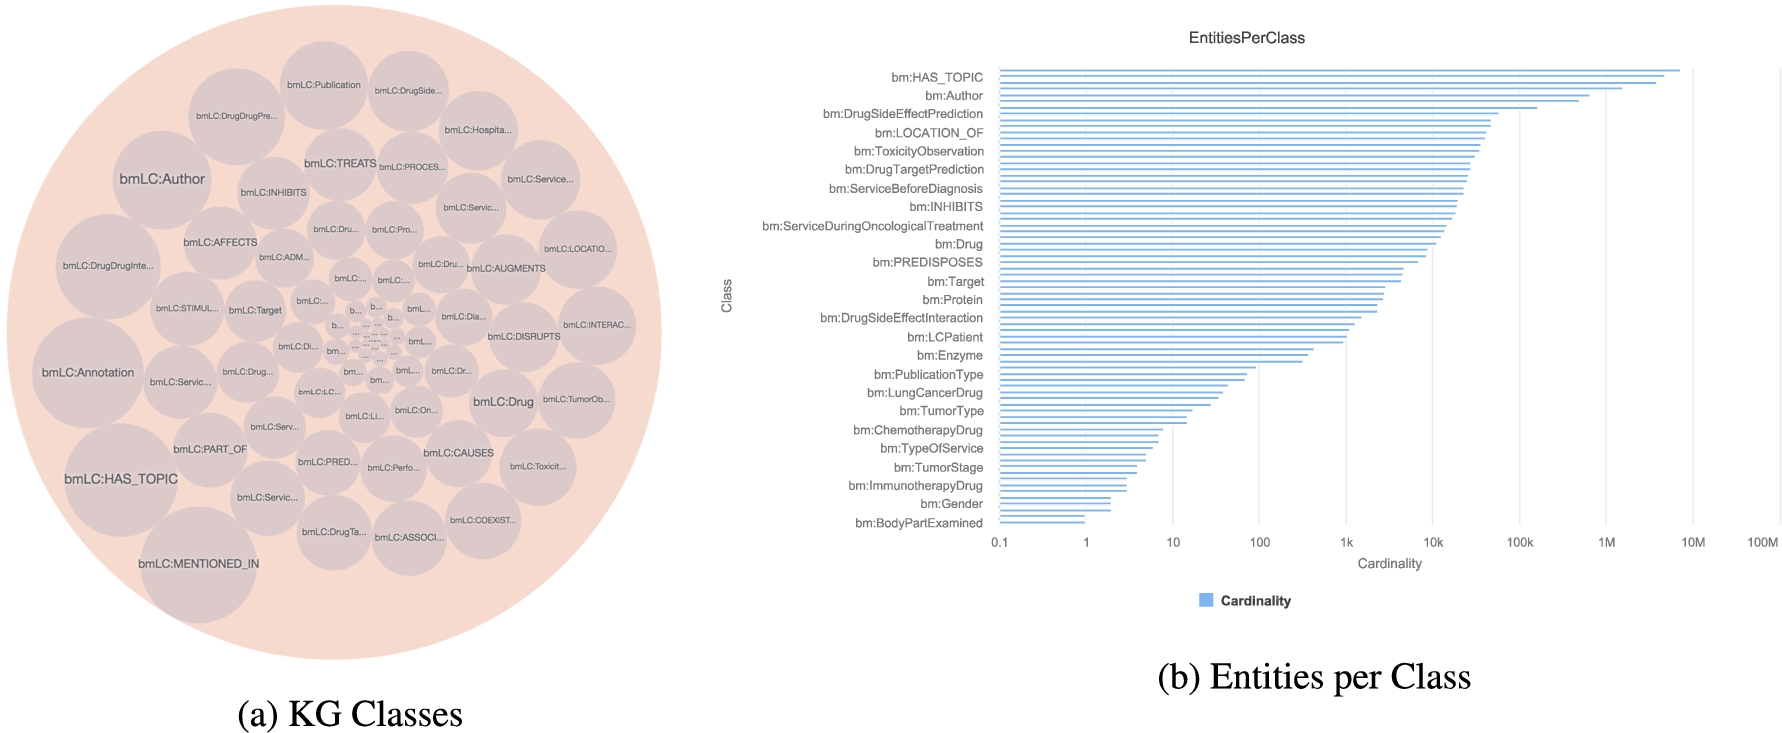
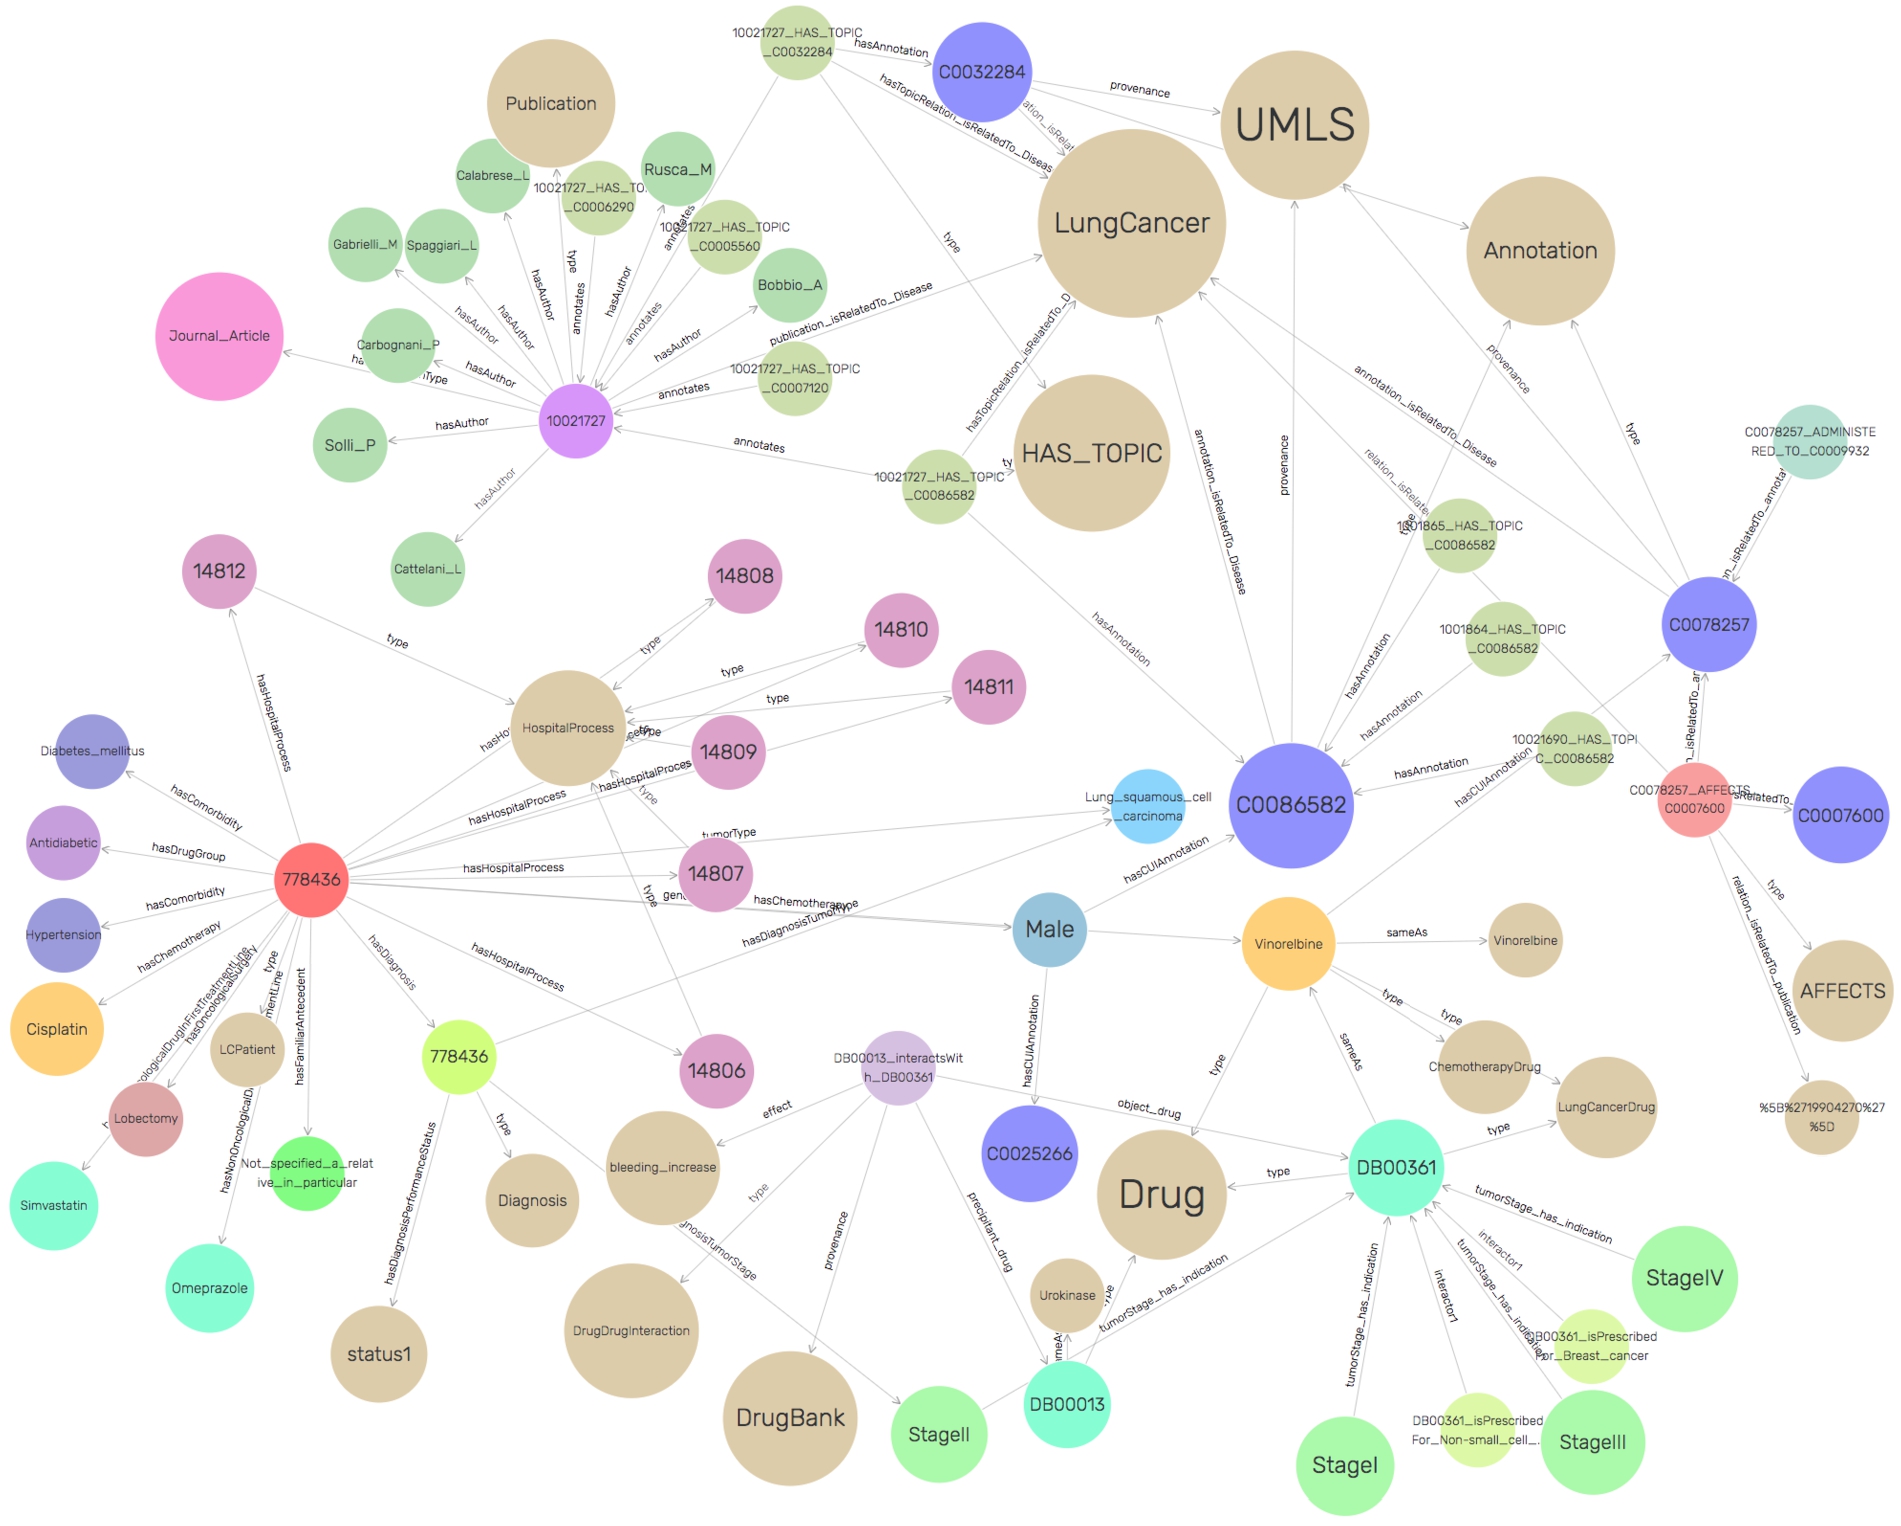
SDM-RDFizer [26], an in-house RML-compliant engine, is utilized to integrate data from the data sources into the KG following the mapping rules. As a result, a KG of 19,602,972 biomedical entities described in terms of 110,788,660 RDF triples is created. Moreover, 3,900,764 links to DBpedia, Wikidata, and UMLS are part of the KG; they are discovered by the tasks of NER and NEL executed by the FnO function included in the mapping rules and by the NLP processes implemented in each DE. Figure 6 depicts the number of entities of the classes in the KG. The classes DE4LC:MENTION_IN, and DE4LC:HAS_TOPIC are populated with entities extracted from scientific publications, while DE4LC:Annotation comprises the UMLS terms that annotate the entities recognized by the NER implemented on top of the DE4LungCancer datasets. Figure 7 depicts a portion of the DE4LungCancer KG for an entity representing an anonymous lung cancer patient (a.k.a. DE4LC:LCPatient). As shown, an DE4LC:LCPatient entity is directly associated with properties that include lung cancer stage, performance status, oncological and non-oncological treatments, visited hospital services, observed toxicities, and surgeries. Moreover, through the UMLS annotations, an DE4LC:LCPatient entity is connected to (i) Publications whose topics are the values of the entity properties; (ii) Drug-drug interactions – reported or predicted – of the patient’s prescribed treatments; (iii) Effects of the patient’s prescribed treatment reported in the publications or scientific databases (e.g., DrugBank). The amount of data and knowledge associated with each of an DE4LC:LCPatient entity provides a holistic profile of DE4LC:LCPatient entities. The knowledge encoded in these profiles is extracted from scientific publications and databases, modeled in the unified schema, and annotated from controlled vocabularies (e.g., UMLS). As a result, these profiles enhance the interpretability of clinical records and provide the foundations for explainable predictions and discoveries. They can be easily traversed to validate the KPIs in an integrated fashion.
Fig. 7.
A portion of the DE4LungCancer KG.
3.2.4.Integrity constraints
The integrity constraints to be satisfied by the data sources are expressed in terms of rules validated with the clinical partners to ensure completeness and soundness. To enhance traceability, the integrity constraints are expressed declaratively using the Shapes Constraint Language (SHACL) [32] and SPARQL [43]. SHACL rules are defined over a class’ attributes (i.e., owl:DatatypeProperties) and constraints on incoming/outgoing arcs, cardinalities, RDF syntax, and extension mechanisms. Inter-class constraints induce a shape network used to validate the KG’s integrity and data quality properties. SHACL relies on validation errors and validation reports using a controlled vocabulary in RDF. A validation report includes explanations about the violations and their severity, and a message describing the violation. In total, there have been defined 67 rules to validate the integrity of the DE4LungCancer KG.
3.2.5.Services
The mapping rules are also utilized to validate the correctness of the process of KG creation. In the DE4LungCancer DE, a quality assessment process guided by the mapping rules is executed on top of the KG. It ensures that each class and predicate in the KG has the same number of instances as the data sources from where the data to populate these classes and properties are extracted. Moreover, different services have been implemented on top of the KG. Several statistical analyses derived from various parameters (e.g., hospitalization, emergency room visits, toxicities, medical tests performed, and oncological treatment types) are integrated as services of the DE4LungCancer dashboard. Additionally, services to traverse the scientific publications associated with a cohort of patients or the drug–drug interactions and side effects of these patients’ treatments can be explored. Thus, the KG acts as a knowledge repository of the DE4LungCancer DE, which empowers the interpretability of the conditions and treatments of the selected cohort. Lastly, DE4LungCancer resorts to a federated query engine to interoperate across the DE4LungCancer KG, DBpedia, and Wikidata; the query processing methods by Endris et al. [14] are implemented to ensure efficiency during query execution over these distributed KGs.
Table 1
Instances of the classes describing a lung cancer treatment in the open DE4LungCancer KG
| DE4LungCancer class | Instances |
| DE4LC:DDI-Literature | 224 |
| DE4LC:DDI-DrugBank | 246 |
| DE4LC:Drug | 11,368 |
| DE4LC:ClinicalTreatment | 548 |
| DE4LC:TreatmentResponse | 695 |
3.2.6.The open DE4LungCancer KG
Considering the data collected from the Scientific and Scholarly DEs, we have created a reduced version of the DE4LungCancer KG; it comprises 34,572,162 RDF triples and is publicly available via a SPARQL endpoint.7 This open version of the KG comprises 136 classes. These classes represent publications, drugs, drug–drug interactions, and UMLS annotations. Additionally, all the lung cancer treatments reported in the clinical data processed by the Clinical DE have been integrated into the KG. Treatments are documented in terms of the prescribed drugs and the drug–drug interactions (DDIs) among these drugs. Three types of DDIs are also part of the KG (i.e., Literature, DrugBank, and DS). Moreover, the KG also represents the number of patients that observed a particular response when a treatment was administrated. The numbers of instances of these classes are listed in Table 1. Thus, the Open DE4LungCancer KG makes publicly available all the data required to reproduce the analysis reported in Section 5.1. Appendix B presents some exemplary SPARQL queries that enable the exploration of the KG. The ontology and RML mappings required to generate this KG, as well as the SPARQL queries, are available in GitHub.2828
4.Data quality and ethics in the DE4LungCancer data ecosystem
Integrating various data sources and ecosystems realized by DE4LungCancer DE, many of which are a result of Natural Language Processing techniques, sets several challenges concerning the data quality (DQ). NLP processing of raw text, e.g., in Electronic Health Records, produces a number of ambiguities on medical terms, and imprecise Named Entity Recognition can result in noisy output information. In this context, we define numerous integrity constraints as part of the DE4LungCancer DE metadata and apply error detection techniques to identify erroneous triples in the ecosystem Knowledge Graph. Moreover, certain mapping rules enrich the DE4LungCancer KG interconnectivity of different sources. At the same time, the data provenance metadata enables the filtering of the information retrieved from the DE4LungCancer DE end-users via the corresponding dashboards. In the following paragraphs, we attempt to investigate the different quality aspects related to each data ecosystem introduced in Section 3.1 and present the data curation and noise detection approaches followed.
4.1.DQ in clinical data ecosystem
The data quality methodology is composed of four steps: (a) Definition of the constraints; (b) Validation of the constraints; (c) Human validation by the domain experts; and (d) Resolution of the ambiguities. First, the metadata describing the DE4LungCancer data sources and the description of the universe of discourse represented in these data sources are analyzed to identify integrity constraints. Clinical and technical partners were consulted to collect the main constraints to be satisfied. Moreover, the concepts and relations existing in the unified schema were utilized to guide the definition of the constraints. First, constraints describing the properties of the attributes of a class in the DE4LungCancer unified schema were identified, i.e., intra-concept constraints, and next, constraints regarding the relationships existing between these concepts or inter-concept constraints are determined. Intra-concept constraints include (a) data types of the attributes, (b) attribute dependencies, (c) cardinalities, and functional dependencies. Additionally, inter-concept constraints encompass referential integrity, cardinality and connectivity, and mandatory and optional relationships among the concepts in the unified schema. Once the constraints are recognized, they are formally specified as expressions of SQL, SHACL, and SPARQL, and evaluated both over the corresponding raw data and the data integrated into the KG; the SHACL validation engine Trav-SHACL [18] was used to validate the SHACL constraints against the KG.
Moreover, inconsistencies between the results obtained after evaluating the constraints over raw data and the KG reveal errors in the process of integration in the KG. On the other hand, equal numbers of ambiguities in the raw data and the KG evidence a data quality issue in the original dataset or in the extraction process. Finally, when all the issues had been detected and classified, the clinical and technical partners were consulted to find the most suitable way to curate either the raw data or the KG. This methodology implements techniques reported by Acosta et al. [3], Ruckhaus et al. [48], and Mihaila et al. [38]. For the class LCPatient, all the attributes were analyzed, as well as the concepts to which this concept is connected. Table 2 summarizes intra- and inter-concept constraints in the business domain of lung cancer. These constraints have been validated by four knowledge engineers, two experts in the NLP extraction process, and two experts in lung cancer; all these evaluators are partners of the consortium. As a result, 67 constraints are defined and a total of 3.120 ambiguities are detected in the NLP-processed clinical datasets and in their corresponding instances in the KG. Table 2 reports on the distribution of the constraints, attributes and concepts. As observed, most ambiguities are detected in the tumor stages, line of treatments, oncological surgeries, and biomarkers. All these ambiguities were discussed with the clinical partners and curated following their recommendations and directions. The integrity constraints are part of the metadata of the DE4LungCancer DE; they document the quality assessment and curation tasks and trace the changes made during data curation.
Table 2
Number of constraints and ambiguities in the class DE4LC:LCPatient
| Class | # constraints | # ambiguities detected |
| Biomarker | 8 | 134 |
| Smoking habit | 4 | 47 |
| Vital status | 3 | 0 |
| Familial antecedents | 2 | 0 |
| Oncological surgery | 5 | 303 |
| Biopsy | 3 | 52 |
| Performance Status | 4 | 75 |
| Tumor stage | 8 | 1,486 |
| Oncological drug | 6 | 177 |
| Oncological treatment line | 24 | 846 |
| Total | 67 | 3,120 |
4.2.DQ in the scholarly data ecosystem
In contrast to clinical data that have been manually filled by experts, the knowledge published in scholarly sources may usually be less reliable. Although being reviewed by field experts, published literature can still report preliminary results, observations, and unverified hypotheses. Moreover, given that any NLP software used to automatically extract knowledge from text is far from perfect, we expect a significant amount of inherent noise and unreliable information in the open data graph (i.e., the one resulting from the processing of the scientific publications). As mentioned, we employ two mainstream tools in the field of biomedical knowledge extraction, to perform entity recognition and relation extraction on literature text. MetaMap [4] and SemRep [45] tools have been evaluated on benchmark datasets achieving high precision (>76%) and moderate recall (36%–70%), on various datasets [10,12,31]. The quality of data in the open graph produced by those tools is addressed in two ways. First, each triplet is associated with a quality score, that is related to the confidence scores provided by MetaMap, representing the quality of each concept identification. In specific, a triple-extraction quality score ranging from 0 to 1 (i.e., the higher, the better) has been added, by averaging the concept identification score of the subject and object entities of each triple. These concept identification scores provide the average of the scores for all found instances of the entities in the specific relation, in order to consider the frequency of the concepts found in the scientific publications. Second, to assess the quality of the open graph as a whole, we have developed an error detection methodology [9] that is based on graph topology and theoretic measures to assess the quality of all edges in this graph. This method, called Path Ranking Guided Embeddings (PRGE), combines an extension of the Path Ranking Algorithm [34] (PaTyBRED [37]) with translational graph embeddings (TransE [7]). The aim is to generate confidence-guided graph embeddings identifying erroneous triples by providing global-confidence scores for all automatically generated relations. We evaluate PRGE using two benchmarks and one generated dataset. The AUC score ranges from 0.56 to 0.97, based on the quality of the dataset used, and the followed noise imputation approach, improving in most cases, simple PRA and embedding methods.
Besides the errors imputed by automatic NLP systems, the quality of the information provided by publications can also be dubious. From the end-user perspective, when exploring publications included in the Scholarly DE, it would be appropriate to be able to filter out unreliable publications or focus only on trustworthy institutes and journals. To this end, DE4LungCancer provides the ability to explore scientific literature, using various factors as filters for the information retrieved:
– Journal: Different journals have different standards in the review process and the completeness of the published work. As a measure of the quality of each journal, we provide the journal h-index, as well as the SCImago Journal Rank (SJR) indicator.
– Authors: An expert can be interested in publications by universities or specific authors that can be known for their overall contribution to the field. Thus, filtering can be applied by author name or affiliation.
– Publication type: Different types of articles are defined according to the different levels of evidence (e.g., scientific review or clinical trial) based on which the represented knowledge is derived. Accordingly, the type of publication is also provided to allow for relevant filtering.
– Publication year: The age of a publication allow an expert to decide if the results depicted in the publication are up-to-date. Therefore, the publication year, as another useful filter for the end-users, is also provided.
– Cited By Count: The number of citations for a specific publication can provide a good indication of its quality and trustworthiness.
Table 3
Number of UMLS annotations
| DE4LungCancer class | UMLS |
| DE4LC:CAUSES | 8,699 |
| DE4LC:PREDISPOSES | 7,017 |
| DE4LC:ADMINISTERED_TO | 2,910 |
| DE4LC:ASSOCIATED_WITH | 27,948 |
| DE4LC:DISRUPTS | 12,828 |
| DE4LC:TREATS | 18,820 |
| DE4LC:INTERACTS_WITH | 40,331 |
| DE4LC:MANIFESTATION_OF | 319 |
| DE4LC:LOCATION_OF | 45,523 |
| DE4LC:PROCESS_OF | 17,005 |
| DE4LC:AUGMENTS | 13,873 |
| DE4LC:HAS_TOPIC | 4,821,501 |
| DE4LC:COEXISTS_WITH | 31,549 |
| DE4LC:STIMULATES | 23,317 |
| DE4LC:INHIBITS | 19,260 |
| DE4LC:AFFECTS | 19,849 |
| DE4LC:MENTIONED_IN | 7,368,157 |
| DE4LC:PART_OF | 25,486 |
| Total distinct links | 12,485,564 |
4.3.DQ in scientific open data ecosystem
Out of 1,550,586 drug–drug interactions (DDI) collected from DrugBank, 320 patterns were recognized to evaluate the performance of FALCON in this use case, twelve annotators manually annotated 1,198 DDI descriptions; annotations correspond to Concept Unique Identifiers (CUIs) from UMLS and constitute the gold standard of the evaluation. For example, for the DDI description: “The serum concentration of Lepirudin can be decreased when it is combined with Tipranavir”; Lepirudin and Tipranavir correspond to the extracted entities from the above record, while decrease and serum concentration represent, respectively, the effect and impact of the interaction of Tipranavir with Lepirudin. A 2-fold cross-validation was followed while building the gold standard, and a majority voting solved disagreement. The evaluation indicates a precision of 98%. The 2% where FALCON failed to extract and link the terms correctly are interactions that contain more than one interaction in the same sentence, where FALCON was only considering one interaction. Additionally, the EABlock toolbox has been assessed in Baseline and EABlock pipelines. Three sets of RML mapping rules were evaluated on two datasets of biomedical concepts composed of 10K and 20K entities, respectively. Both pipelines generate the same KGs. However, in Baseline, NER and EL are performed in a pre-processing stage of KG creation, while EABlock functions were executed with the RML rules in the EABlock pipeline. Observed execution time suggests that using the EABlock functions speeds up the KG creation process by up to 40%. Moreover, we created five gold standard datasets considering textual values with frequent quality issues that frequently exist in textual values datasets (e.g., character capitalization, elimination, insertion, and replacement). These datasets are built from DBpedia, Wikidata, and UMLS. The errors are introduced with a certain percentage of the records (i.e., 50% and 80%). The EABlock functions exhibited a F1 score that varied from 0.78 in DBpedia, 0.88 in UMLS, and 0.99 in Wikidata. Table 4 reports on the number of links recognized by EABlock during the execution of the RML + FnO mapping rules that define the DE4LungCancer KG. In total, 12,961, 11,679, and 8,172 distinct DE4LungCancer entities are connected to UMLS, DBpedia, and Wikidata3030 respectively. The DE4LungCancer knowledge engineers have manually curated these links. These results indicate that the named entity recognizer and linker used in the EABlock toolbox (i.e., FALCON) cannot completely recognize and link medical terms and exhibit better performance in UMLS and DBpedia than in Wikidata. They corroborate the outcomes reported by Sakor et al. [50] and indicate that further research is required to enhance the completeness of the named entity linking task over Wikidata. Finally, in terms of DS, we have evaluated the quality of the DDIs inferred by the deductive database. Treatments for three different diseases have been evaluated. They include treatments for COVID-19, Alzheimer, and Hypertension collected from scientific literature [2,24,30]; also, drugs for frequent comorbidities are part of these treatments. Four drug–drug interaction checker tools are used to assess the quality of deduced DDIs: COVID-19,3131 WebMD,3232 Medscape,3333 and DrugBank.3434 The goal of the study is to validate if the drugs in a treatment that participate in more DDIs increase the number of DDIs in the treatment. The observed outcomes indicate that drugs with a high frequency of DDIs may produce more toxicities, in line with the four tools.
Table 4
Number of links from the DE4LungCancer KG to UMLS, DBpedia, and Wikidata
| DE4LungCancer Class | UMLS | DBpedia | Wikidata |
| DE4LC:BodyPartExamined | 1 | 0 | 0 |
| DE4LC:LungLaterality | 2 | 0 | 0 |
| DE4LC:ProcessStatus | 4 | 0 | 0 |
| DE4LC:FamilialAntecedent | 7 | 7 | 0 |
| DE4LC:Biomarker | 3 | 0 | 0 |
| DE4LC:Gender | 2 | 2 | 0 |
| DE4LC:Phenotype | 77 | 76 | 61 |
| DE4LC:Enzyme | 373 | 368 | 353 |
| DE4LC:Disorder | 435 | 425 | 403 |
| DE4LC:ClinicalStatus | 2 | 0 | 0 |
| DE4LC:OncologicalSurgery | 5 | 5 | 0 |
| DE4LC:Modality | 2 | 0 | 0 |
| DE4LC:PatientPosition | 1 | 0 | 0 |
| DE4LC:Target | 4,364 | 4,299 | 4,180 |
| DE4LC:ImmunotherapyDrug | 3 | 3 | 0 |
| DE4LC:TypeOfService | 3 | 0 | 0 |
| DE4LC:ServiceDepartment | 43 | 0 | 0 |
| DE4LC:TumorStage | 4 | 0 | 0 |
| DE4LC:ProcessComment | 3 | 0 | 0 |
| DE4LC:NonOncologicalDrug | 44 | 43 | 0 |
| DE4LC:LungCancerDrug | 39 | 38 | 2 |
| DE4LC:Diagnosis | 5 | 0 | 0 |
| DE4LC:TkiDrug | 7 | 7 | 0 |
| DE4LC:Drug | 7,323 | 6,457 | 3,175 |
| DE4LC:DiagnosisDescription | 273 | 0 | 0 |
| DE4LC:TumorType | 17 | 17 | 0 |
| DE4LC:ChemotherapyDrug | 8 | 8 | 0 |
| Total Distinct Links | 12,961 | 11,679 | 8,172 |
4.4.DQ in the nested DE4LungCancer data ecosystem
Fig. 8.
Network analysis to assess connectivity of
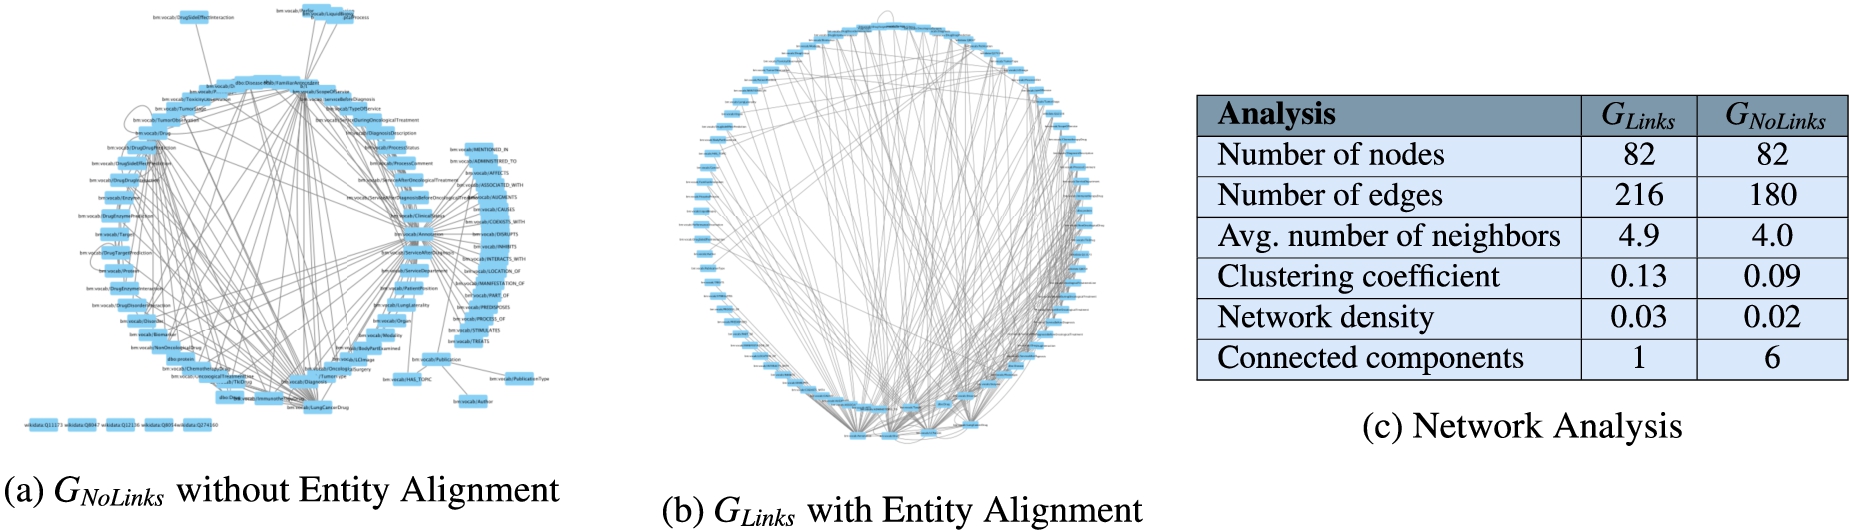
The annotations from UMLS, DBpedia, and Wikidata extracted by the NLP techniques implemented in DE4LungCancer enable the creation of entity alignments that define the semantic data integration process executed during the creation of the DE4LungCancer KG. This section presents the impact that these annotations have on semantic data integration. This impact is measured in terms of connectivity or the number of alignments they enable to establish in the DE4LungCancer KG. Two versions of KGs are created:
5.The DE4LungCancer assessment
5.1.Assessment of the impact of interaction between drugs in the effectiveness of the lung cancer treatments
The knowledge represented in the DE4LungCancer KG is exploited to understand the impact of the interactions between a treatment’s drugs on the effectiveness of the treatment. The evaluation of treatments’ effectiveness is performed based on the number of toxicities observed in the lung cancer patients and the assessment of a treatment’s response provided by the patients’ oncologists; these results are part of the clinical records processed by the Clinical DE and integrated into the DE4LungCancer KG. The DDIs in a treatment are computed based on three computational methods. The first method (DrugBank) computes the number of DDIs in treatment based on the DDIs reported on DrugBank. We extracted the DDIs from DrugBank and included them in our DE4LungCancer KG. The second method (DS) proposed by Rivas and Vidal [46] deduces new DDIs based on a deductive system implemented in Datalog on top of KG. DS is defined in terms of Datalog rules, and it exploits the fine-grained representation of the DDIs generated by FALCON. The third method (Literature) proposed by Bougiatiotis et al. [8] predicts DDIs based on the Scholarly DE. This method analyses the paths connecting interacting and non-interacting drug pairs in this DE Knowledge Graph and trains a machine learning algorithm (Random Forest) to discriminate between those two classes. Based on the trained model, we then apply predictions to all non-interacting pairs to identify potential DDIs that were not previously known based on the resulting prediction confidence scores.
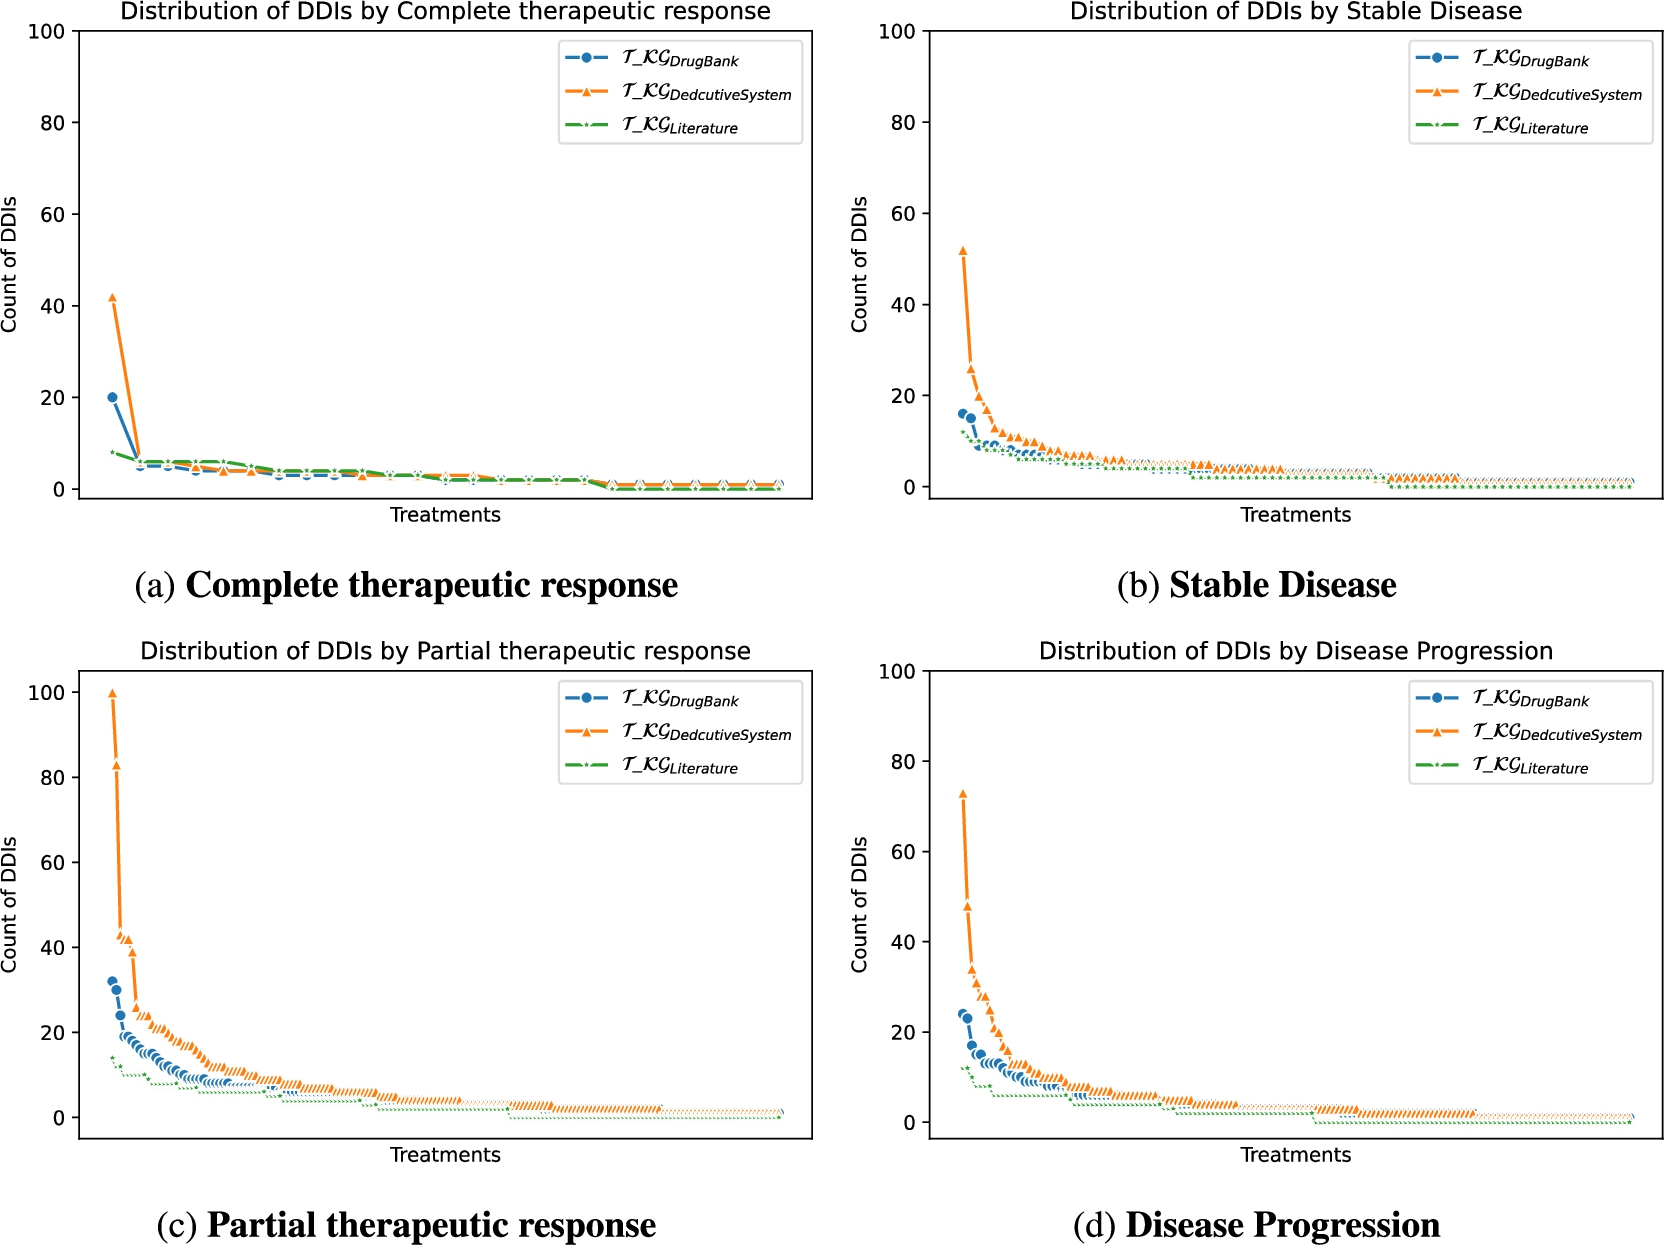
Toxicity analysis: We have selected the most frequent oncological treatments for analyzing their toxicities. The treatments in Fig. 9a, Fig. 9b, and Fig. 9c contain oncological and comorbidity drugs. Figure 9d and Fig. 9e show the same treatments as Fig. 9a and Fig. 9b without comorbidity drugs. The x-axes represent the toxicities of patients receiving the treatment, and the y-axes are the relative frequency of patients having toxicity. The treatment responses are evaluated in four categories: complete therapeutic response, stable disease, partial therapeutic response, and disease progression, where a complete therapeutic response is the desired response and disease progression is the worst expected response. We observed that oncology treatments without comorbidity drugs cause fewer toxicities in patients than oncology treatments together with comorbidity drugs. In addition, for patients taking the treatment represented in Fig. 9c without comorbidity drugs, no toxicity was caused. Furthermore, the patients with a complete therapeutic response have fewer toxicities than the other treatment response. DDIs analysis: We have extracted from DE4LungCancer KG the lung cancer treatments with their respective responses. Our purpose is to compute the distribution of DDIs for each treatment response. The hypothesis is that treatments with a complete therapeutic response or stable disease have fewer DDIs than treatments with partial therapeutic response and disease progression. To have the treatments in four disjoint sets of treatment responses, the data were processed. For treatments with different responses, the most frequent response is selected. Thus, each treatment is classified into a single response class. The DDIs for each treatment are computed based on the DDIs reported on DrugBank, and two computational methods. Figure 10 shows the distribution of DDIs by each treatment response. The x-axis represents each treatment, and the y-axis represents the count of DDIs in treatment. The three color lines on the plots represent the three methods employed to compute the DDIs. We observe that for the three methods used, the distribution of DDIs for treatments with a complete therapeutic response (Fig. 10a) or stable disease (Fig. 10b) have fewer DDIs than treatments with partial therapeutic response (Fig. 10c) and disease progression (Fig. 10d), corroborating our hypothesis.
Fig. 9.
Toxicity analysis of oncological treatments. Figure 9 shows five bar plots of the toxicities produced by treatments in lung cancer patients. The treatment responses are differentiated by color. The oncological treatments with comorbidity drugs generate more toxicities than those without comorbidity drugs.
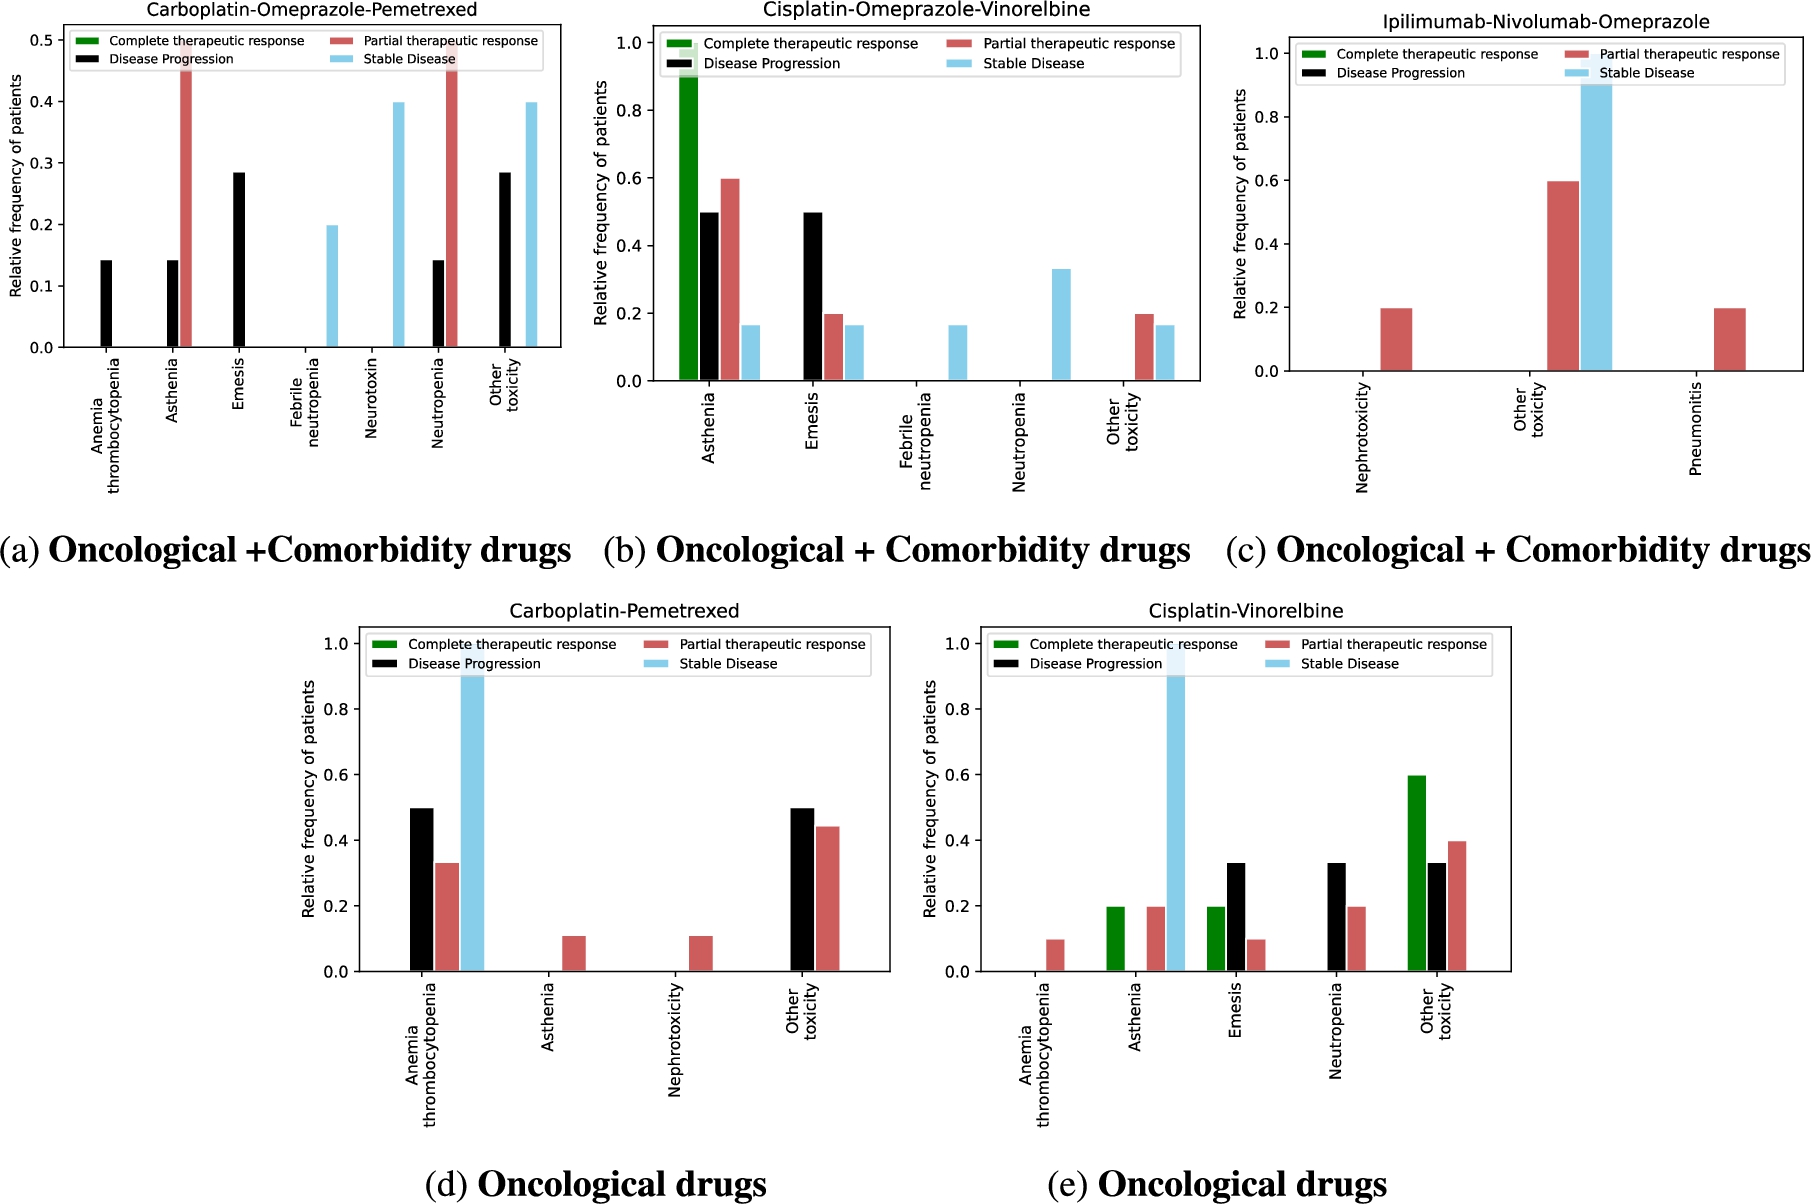
Fig. 10.
Distribution of DDIs by treatment response.
Correlation analysis between DDIs and treatment responses: We are interested in computing the correlation between a DDI in treatment and the number of patients with a specific response to the treatment. The treatment responses are evaluated in four categories: complete therapeutic response and stable disease are positive responses to treatment, while partial therapeutic response and disease progression are negative responses. Our hypothesis is to detect a negative correlation between DDIs in treatment and the number of patients with complete therapeutic response or stable disease. A negative correlation, in this case, means more patients with positive responses and fewer DDIs in the treatment. Moreover, we expect to identify a positive correlation between DDIs in treatment and the number of patients with a partial therapeutic response or disease progression. We have extracted the lung cancer treatments with their respective response from DE4LungCancer KG. Then, the number of DDIs for each treatment is computed based on the DDIs reported on DrugBank, and two computational methods, DS and Literature. Also, we compute the number of patients by treatment response for each treatment. Finally, we perform a Spearman’s Rho correlation analysis between the four therapeutic responses and the three computational methods for computing the DDIs. Table 5 shows the results of the correlation analysis based on the Spearman’s Rho metric. We can observe a negative correlation for all the combinations between treatment responses and DDI methods except for complete therapeutic response and DDIs based on Literature but with a high p-value. Considering the data on DE4LungCancer KG, we do not identify a positive correlation between the number of DDIs in treatment and the number of patients with a partial therapeutic response or disease progression.
Table 5
The Spearman’s Rho correlation coefficient analysis between DDIs and responses over DE4LungCancer KG
| Response | DrugBank | DS | Literature | |||
| correlation | p-value | correlation | p-value | correlation | p-value | |
| Complete therapeutic response | −0.31658 | 0.11509 | −0.30451 | 0.13041 | 0.18642 | 0.36187 |
| Stable disease | −0.20782 | 0.09150 | −0.21407 | 0.08194 | −0.09353 | 0.45156 |
| Partial therapeutic response | −0.33183 | 0.00027 | −0.32374 | 0.00039 | −0.29062 | 0.00155 |
| Disease progression | −0.38461 | 0.00018 | −0.39093 | 0.00014 | −0.25746 | 0.01429 |
Correlation analysis between drugs and DDIs in treatment: We analyze the correlation in lung cancer treatments between the number of drugs and the number of DDIs. The hypothesis is that increasing the number of drugs in a treatment increases the number of DDIs. Therefore, a positive correlation should be identified. We retrieved the lung cancer treatments from DE4LungCancer KG. Then, we counted the number of drugs by treatment. The number of DDIs for each treatment is computed based on the drug–drug interactions reported by the three following computational methods DrugBank, DS and Literature. Table 6 illustrates the strong positive correlation between the number of drugs and the number of DDIs in treatments, i.e., the higher the number of drugs in treatment, the higher the number of treatment interactions. Although the Spearman’s Rho correlation coefficient for the Literature method is low, it exhibits a positive correlation.
Table 6
The Spearman’s Rho correlation coefficient analysis between the number of drugs in a treatment and the number of DDIs among these drugs
| DrugBank | DS | Literature | |||
| correlation | p-value | correlation | p-value | correlation | p-value |
| 0.75418 | 1.89e−21 | 0.76469 | 2.44e−22 | 0.13050 | 0.24860 |
5.2.Exploring the DE4LungCancer KG
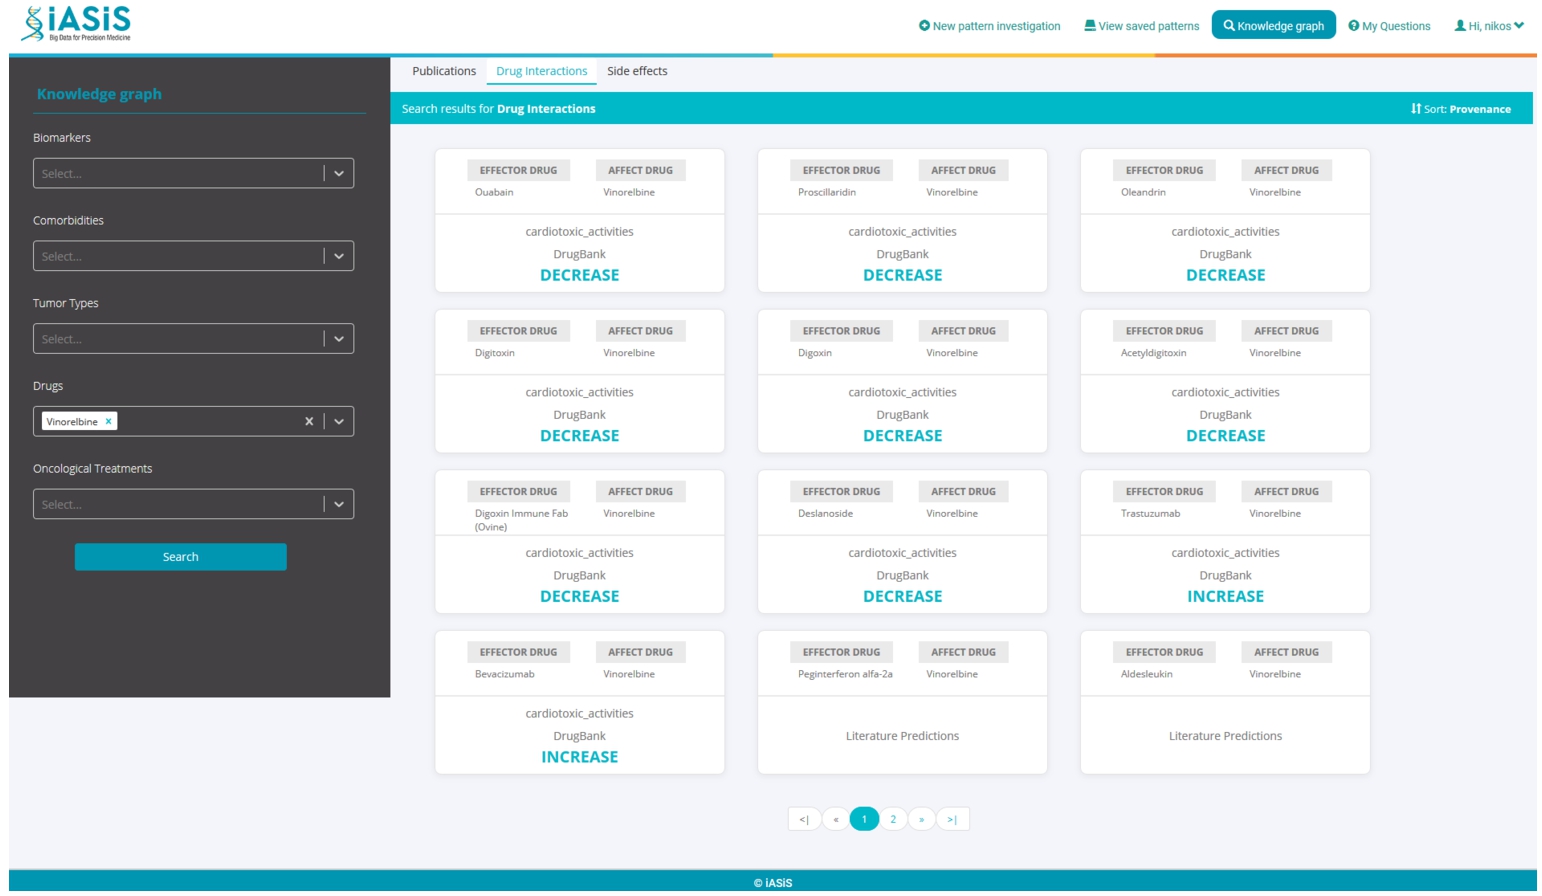
A dashboard makes the DE4LungCancer KG available to the clinical partners in the lung cancer pilots of iASiS, BigMedilytics, and CLARIFY, and in P4-LUCAT. Various services are provided to analyze the processed EHRs and the holistic profiles that integrate EHRs with the fine-grained representation of publications and scientific open data. Those services correspond to dedicated REST APIs that provide an integration point with various dashboard versions. The dashboards are available to the project oncologists via certificate-based authentication. The outcomes of the analytical tools provided by the DE4LungCancer KG services through a dashboard have established the basis for the implementation of clinical interventions for the lung cancer patients treated by the team of oncologists of the Puerta del Hierro University Hospital in Madrid. For example, Fig. 11 illustrates a specific example of results when a clinician queries patients’ length of hospital stay based on their gender. The BigMedilytics dashboard provides a statistical analysis of patient hospitalizations in the first three months, based on gender, retrieved from the corresponding DE4LungCancer KG API service. Figure 12 provides another example, exploring the DE4LungCancer KG through the iASiS dashboard. In that case, a clinician requests all possible drug–drug interactions related to a specific drug (documented in Drugbank, deduced, or predicted).
Fig. 11.
Clinical KPI results, illustrated through the BigMedilytics dashboard. This example is exploring the proportion of patient hospitalizations in the first three months, divided by gender.
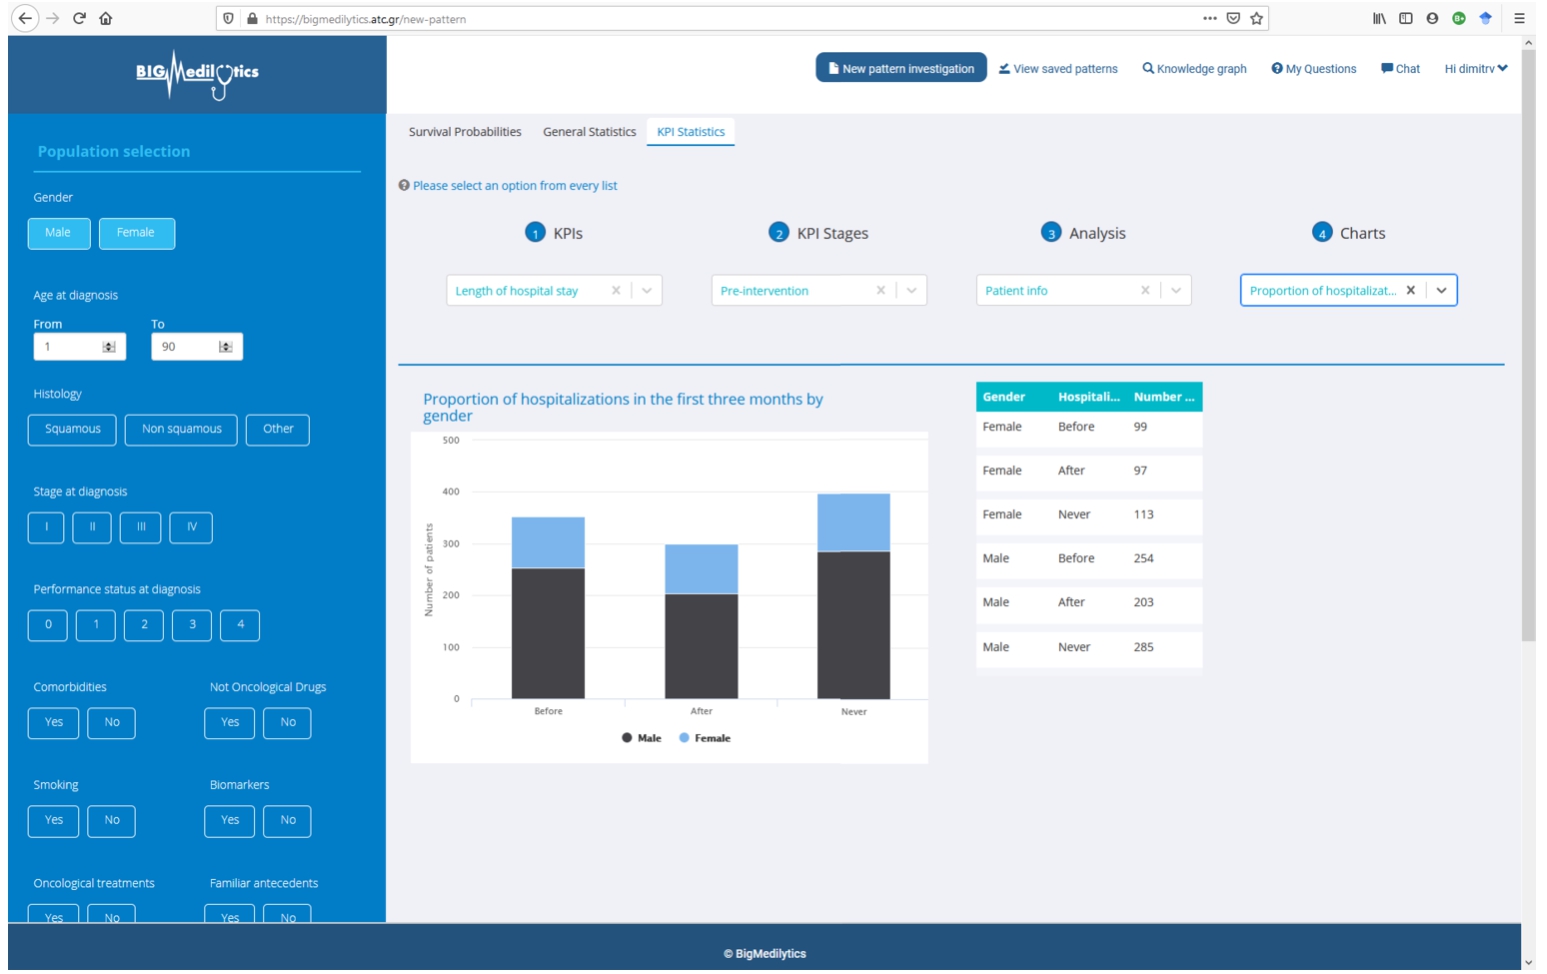
Fig. 12.
Knowledge graph exploration through the iASiS dashboard. This example is providing all documented, predicted and deduced drug interactions for Vinorelbine.
5.3.Quantitative analysis of the DE4LungCancer KG
The improvement of the diagnostic pathway and the reduction in the length of hospital stays and emergency rooms represent the essential clinical requirements identified as KPIs. With this aim, the DE4LungCancer KG can be traversed (e.g., through the BigMedilytics dashboard) to identify the most visited services by patients with a new diagnosis of lung cancer in the previous 15 months to diagnosis; in this analysis, four months before diagnosis to avoid consultations related to the diagnostic process strictly, such as medical oncology. Moreover, the services can be explored to identify the prescribed clinical tests.
To this end, we retrieved all the properties of 1,242 patients from the DE4LungCancer KG; 859 patients visited at least one first-attention service between the day of the diagnosis and 15 months before this date. 459 patients saw first-attention services four and 15 months before diagnosis; 331 were in stage III or IV of lung cancer. During the month before lung cancer diagnosis, which we used as our baseline, the most visited services were: Thoracic surgery, Pneumology, Medical Oncology, Internal Medicine, and Emergency Room. When analyzing 15 months ahead of lung cancer diagnosis, excluding the four months before diagnosis, the top-5 most visited services are General Emergencies, Primary Care, Cardiology, Pneumology, and General and Digestive Surgery. Additionally, we have observed that patients have increased the number of first-attention consultations during the 15 months before lung cancer diagnosis. Moreover, the visited services differ entirely from those seen during the month before a diagnosis of lung cancer. The number of tests is also increased during this period. The hospital services visited for the first time by lung cancer patients are grouped into six categories according to the number of months before the lung cancer diagnosis. These groups are denoted as X-Y indicating that the group includes all the health services visited, the first time, by a lung cancer patient during the months Y before the lung cancer diagnosis but excluding the period between the day of the diagnosis and the month X before the diagnosis; i.e., 0-1 includes all the health services a lung cancer patient visited during the month before the lung cancer diagnosis. Figure 13 shows the evolution of the top-10 most visited services in the periods 0-1, 0-4, 4-12, 4-13, 4-14, and 4-15. General Emergencies and Primary Care are the services more frequently visited in the periods 4-13, 4-14, and 4-15. The Spearman’s Rho (SR), a non-parametric test used to measure the correlation between two ordered sets, compares the services most visited in different periods before diagnosis. Figure 14a and Fig. 14b present heatmaps reporting on the Spearman’s Rho and p-value, respectively; the average value of the Spearman’s Rho is 0.64, and the average p-value is 0.097. These results suggest that 4-14 and 4-15 are the most stable periods in terms of frequency of patients visiting the hospital services as first attention (i.e., the Spearman’s Rho index value is 0.87 with a p-value of 0.0012).
Fig. 13.
Evolution of the top-10 hospital services most visited the first time by lung cancer patients prior to the lung cancer diagnosis. Blue indicates that the number of visits to the service increases, and it moves up in the list. Red shows that the number of visits of the service decreases, and it moves down in the list. White shows a service position stays the same with the respect to the previous reported period.
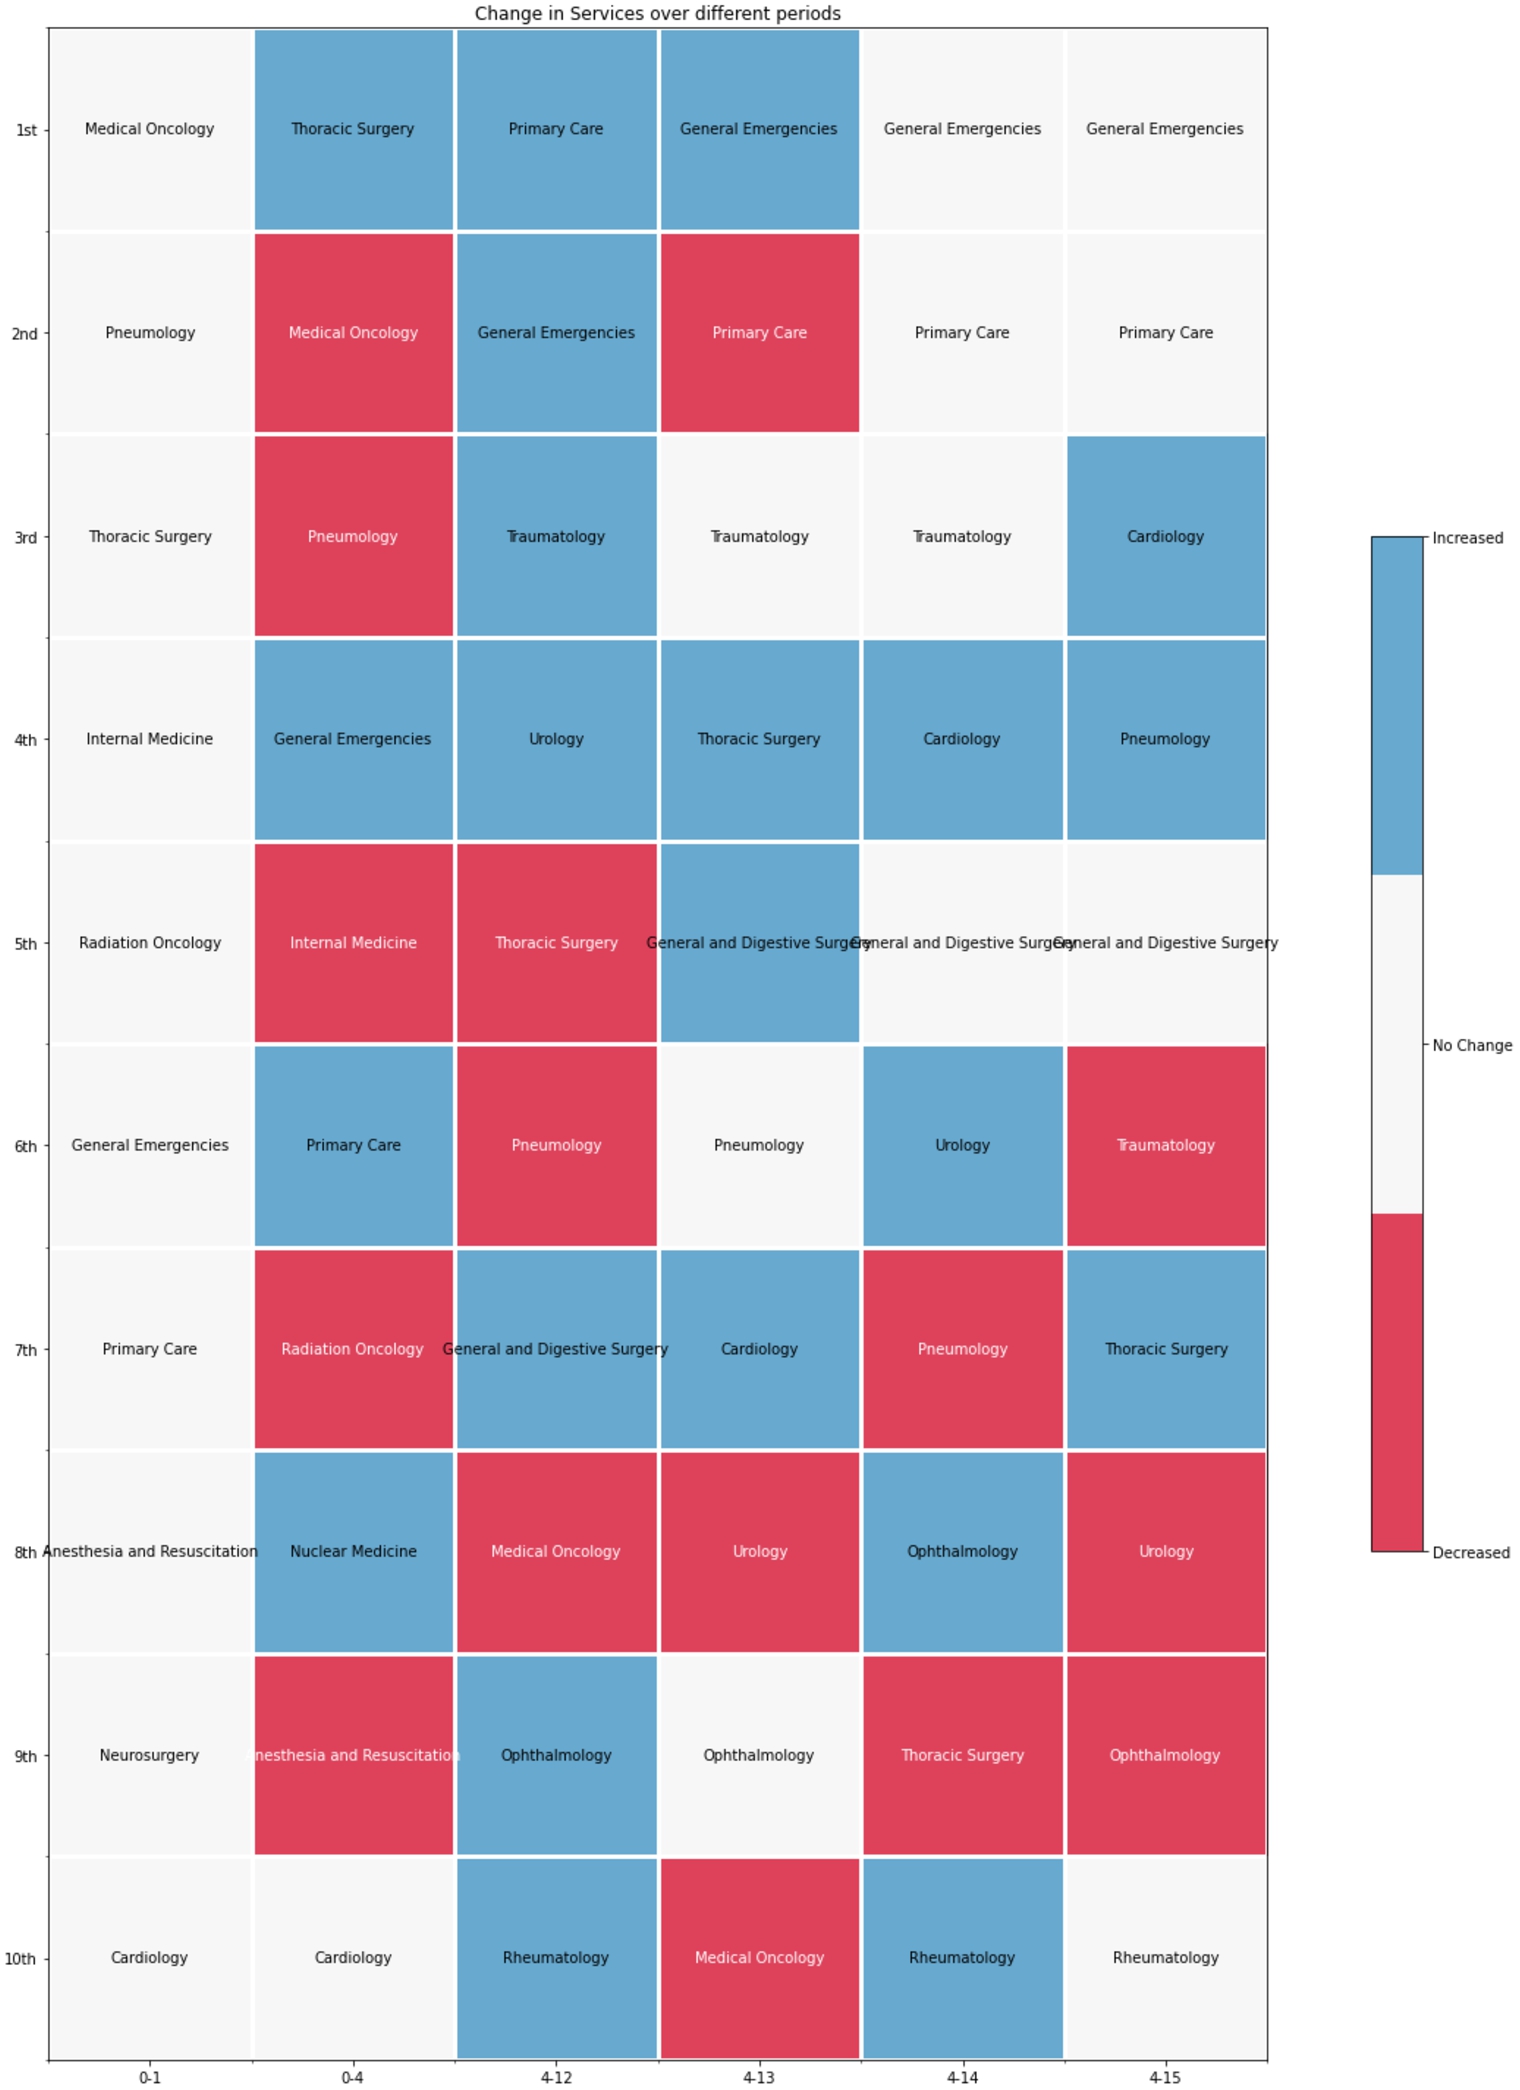
Fig. 14.
Comparison of the most visited hospital services in the periods 0-1, 0-4, 4-12, 4-13, 4-14, and 4-15.
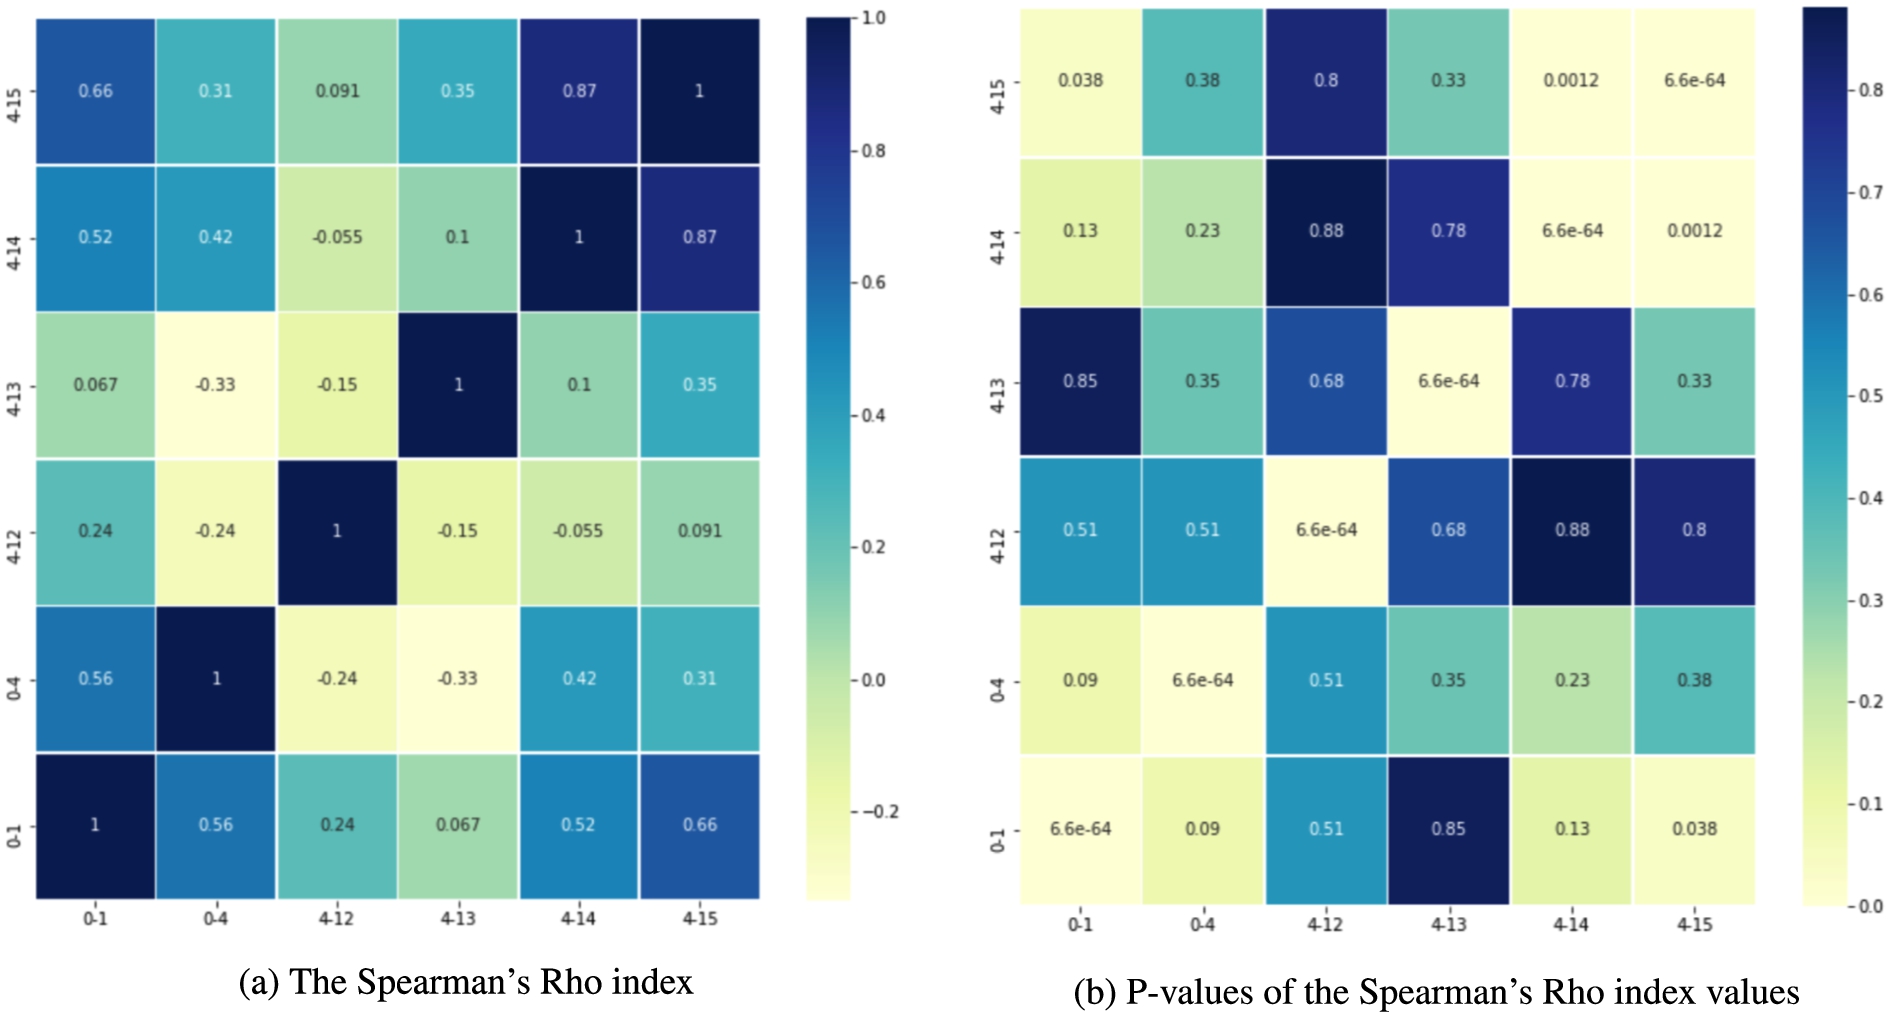
Fig. 15.
The Jaccard index values. Overlap of most visited hospital services in the periods 0-1, 0-4, 4-12, 4-13, 4-14, and 4-15.
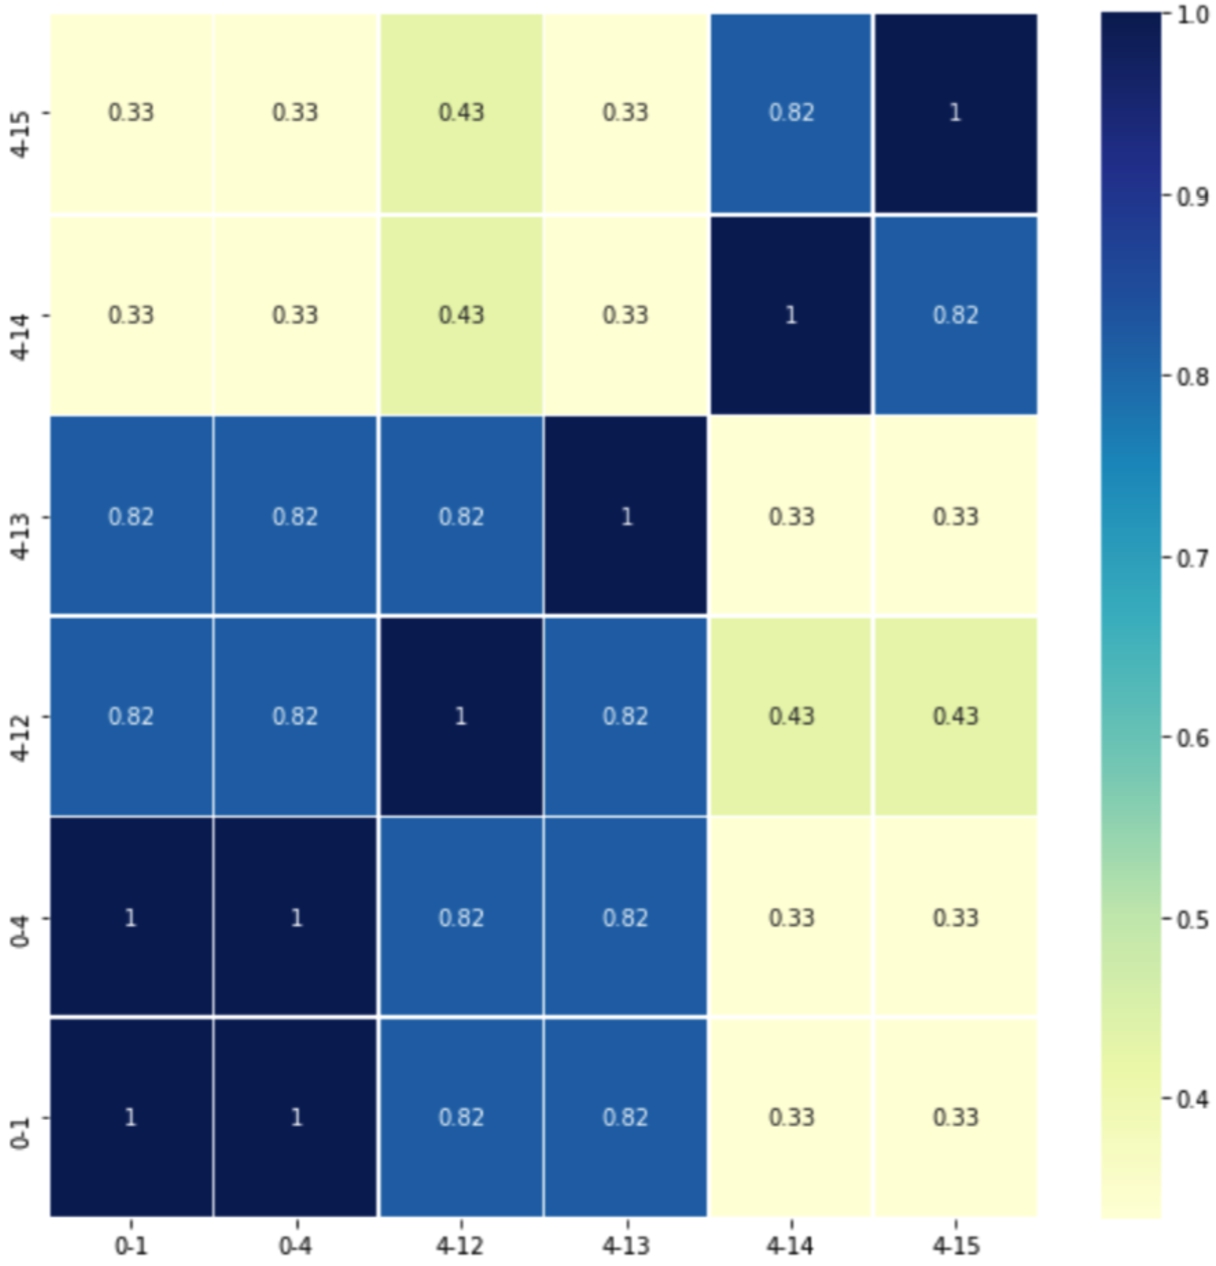
We also compute the Jaccard index to quantify the overlap between sets of services visited in distinct periods; Fig. 15 reports these results. The average Jaccard index is 0.62, indicating a relatively high overlap across the studied periods. In particular, corroborating the clinicians’ hypothesis, that the first attention services visited one and four months before the diagnosis are the same (i.e., Jaccard Index is 1.0) and they may be related to the lung cancer diagnosis. Further, the clinical observation that the first attention services should differ from the ones in 0-1 and 0-4 to posterior periods (i.e., 4-12, 4-13, 4-14, and 4-15) is supported by the Jaccard Index values which range from −0.33 to 0.31. Lastly, the statement that around 12 months before the diagnosis, the first attention services visited by the lately diagnosed lung cancer patients would remain the same, is supported in periods 4-14 and 4-15 (i.e., Jaccard Index is 0.82). These results are preliminary and further analysis is required. However, they have the potential of offering insights into the health of a patient who eventually will be diagnosed with lung cancer. If validated, they will allow clinicians to prescribe specific tests that may detect the disease in the asymptomatic phase, reducing complications, which usually increase the complexity of these patients and their outcome.
5.4.Addressing health data ecosystem requirements
DE4LungCancer attempts to address the various requirements (Data Management, Clinical, and Ethical) of Health Ecosystems, as introduced in Section 2.1. In the following paragraphs, we describe how DE4LungCancer tackles the requirements of each category.
5.4.1.Data management requirements
The data management techniques implemented in DE4LungCancer enable uncovering the data management requirements: DR1-Data variety; DR2-Integrity constraint satisfaction; DR3-Transparent data management; and DR4-Unified definition of heterogeneous data. Specifically, disparate data sources have been used in the DE4LungCancer (Requirement DR1), as explained in the previous Sections. As explained in the Nested DE4LungCancer Data Ecosystem, a set of integrity constraints has been expressed in terms of rules, which have been validated with the clinical partners to ensure completeness and soundness of the data collected (Requirement DR2).
Moreover, the definition of the DE4LungCancer unified schema (through the RDF data model) and the KG creation process using declarative languages (e.g., R2RML, RML, and FnO) for data integration brings significant benefits: They empower the reusability and modularity of the data integration process (Requirement DR4). More importantly, this process facilitates the traceability of the decisions made to integrate raw data into the KG entities, curate data quality issues, and enhance the interpretability of the detected data quality issues (Requirement DR3).
5.4.2.Clinical requirements
Based on the results of the quantitative analysis conducted on the DE4LungCancer, the clinical partners devised five interventions; with those, they attempted to assess the satisfaction of the DE4LungCancer clinical requirements KPI1, KPI2, KPI3, KPI4, and KPI5. These interventions aim at studying a lung cancer patient at various stages of the lung cancer pathway (KPI1, KPI5), i.e., a healthy person, a person with persistent medical conditions (KPI2), a sick person, a person in treatment, and a terminally-ill person (Fig. 16). They also analyze the patient admissions to General Emergencies (KPI3) and the related combinations of comorbidities and specific treatments to promote lung cancer patients to palliative care and alarm on potential toxicities (KPI4).
Fig. 16.
Lung cancer pathway and medical interventions.
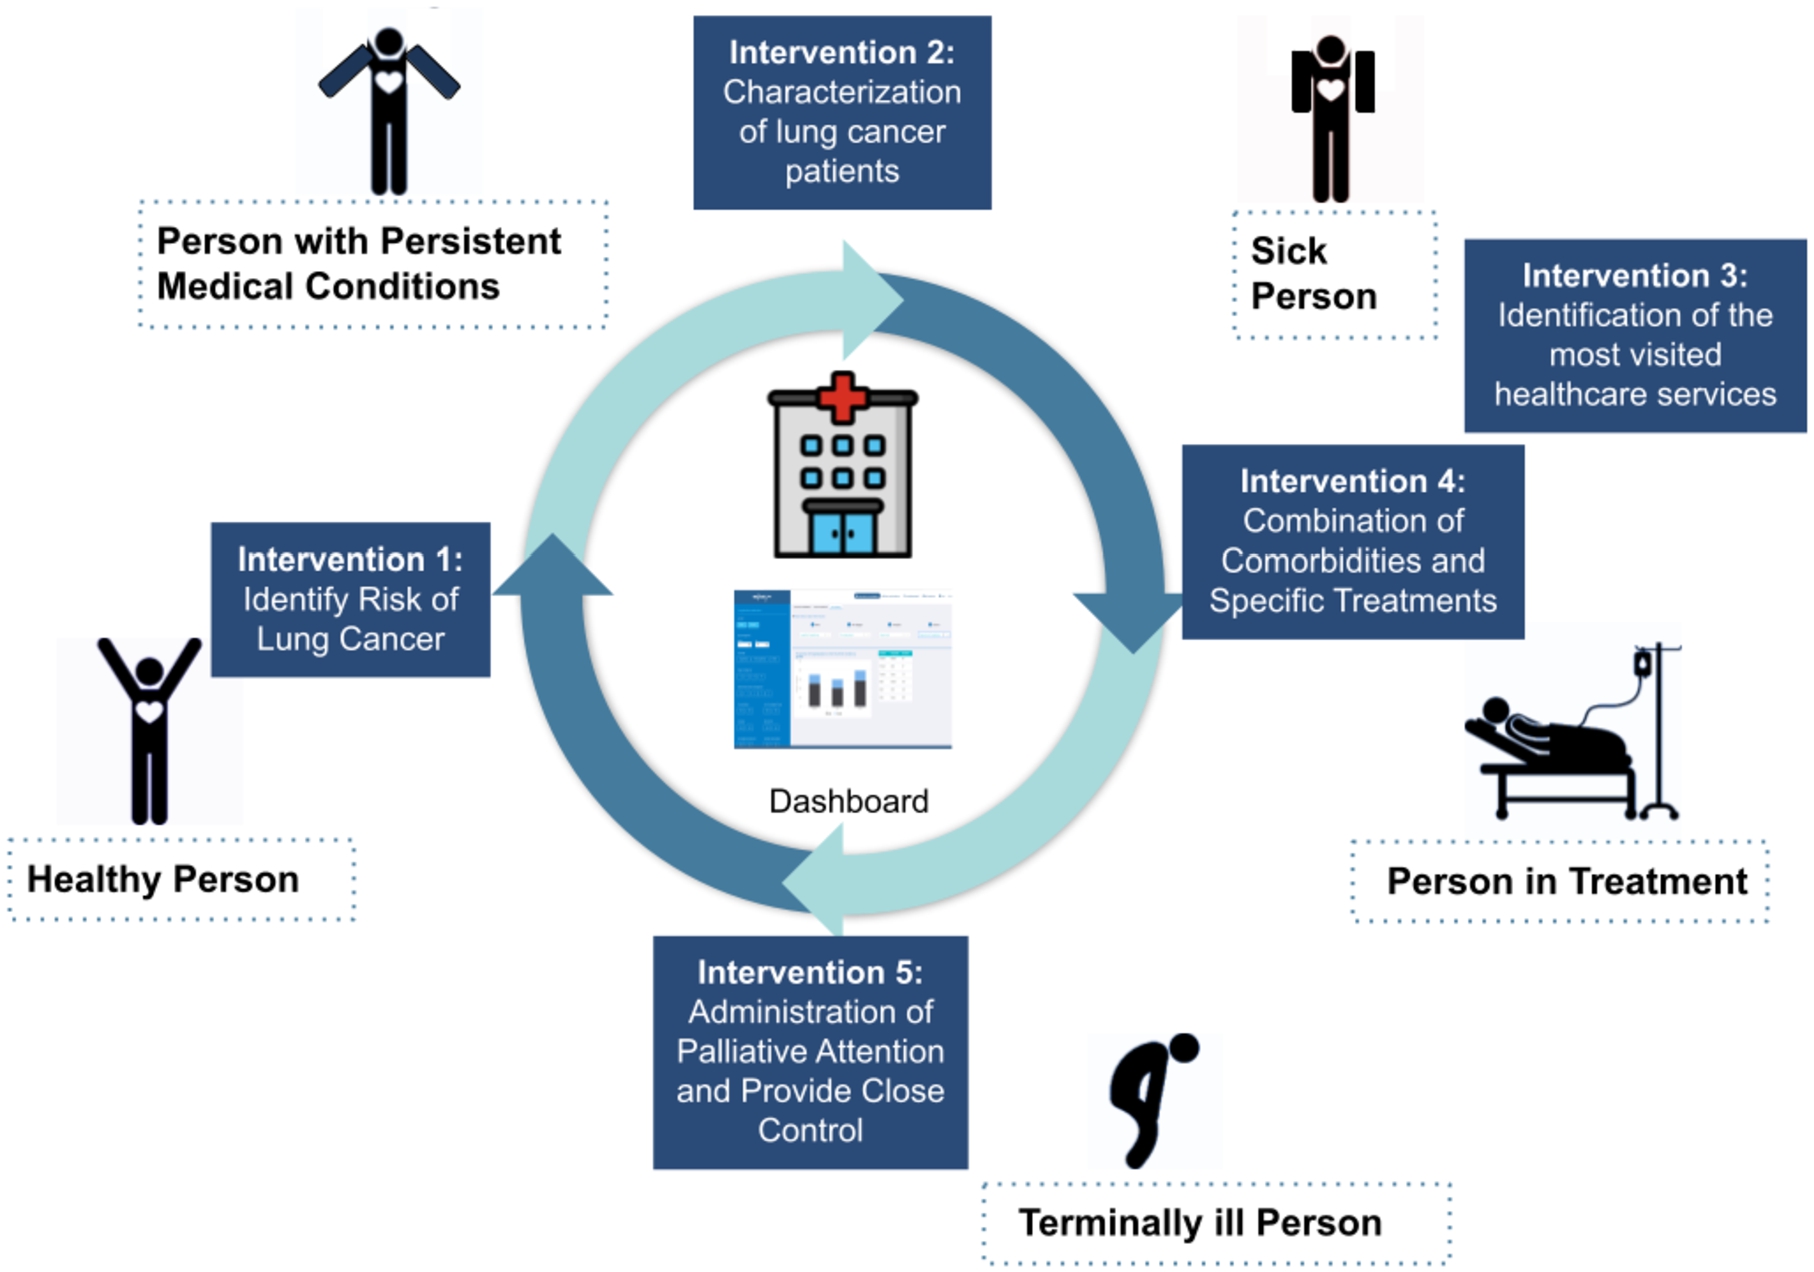
1st intervention- Characterization of the Lung Patients: | Based on the analysis results of the services most frequently visited by patients in the 15 months before diagnosis, first-attention visits to certain services (e.g., General Emergencies, Primary Care, Cardiology, and Pneumology) are considered relevant patterns. As a result, persons who follow these patterns are selected as patients, who may be in an asymptomatic stage and may have the potential risk of developing cancer. |
2nd intervention- Identification of people at risk of developinng lung cancer: | The goal is the identification of people at risk of developing lung cancer and a continuous assessment of a patient’s bypass channels. This intervention has been possible, speeding up appointments for diagnostic tests as well as consultation reviews when it comes to a patient with suspected cancer. |
3rd intervention- Administration of Palliative Attention and Provide Close Control: | The goal of the intervention is to administrate Palliative Care attention and provide close control in consultations before the next treatment cycle date in a treatment line. This study has allowed for measuring readmission and death at 28 days after discharge to determine the need for external early clinical control. Furthermore, the frequency of this event in advance or initial treatment lines has been assessed. This quantitative analysis indicates that 30% of the patients are over 70 years old; they also suffered from advanced stages of lung cancer and more than three comorbidities. Additionally, they have received more than three lines of oncological treatments. These results are considered as a pattern to promote lung cancer patients to palliative care. |
4th intervention- Study of Combination of Comorbidities and Specific Treatments: | This intervention is defined based on the analysis of the patients who attended General Emergencies and were readmitted, to a new hospital service, in a period of 28 days. The study aims at uncovering combinations of comorbidities and specific treatments that increase the risk of being readmitted to the emergency room. Based on the uncovered patterns, the Oncology Department processes inter-consultations with the departments of the most visited hospital services to identify potential side effects of the prescribed treatments. |
5th intervention- Identification of the Most Visited Hospital Services During Lung Cancer Followed-Up: | General Emergencies have been identified as the most visited medical service once a patient is under follow-up by the Oncology Department. Pain is one of the most common symptoms because pain often changes with disease progression. Despite the importance of pain assessment and management, it is uncovered that pain under treatment is common. Thus, this intervention aims at reinforcing the work of the nurses in assessing pain and favoring early referral to the Pain Unit. |
5.4.3.Ethical & legal requirements
Data sharing, management, and analysis in the DE4LungCancer DE have been conducted following the regulations imposed by Ethical protocol and the Ethical committee of the Puerta del Hierro University Hospital in Madrid. Thus, a legal framework to respect data privacy has been established (Requirement ER1). Following these regulations, pseudonymization techniques have been implemented at the hospital, and the DEs have only been conducted according to the patients’ consent. The consent is in a written document signed by each patient. It states the purpose of the research and the funding agency, the reasons to participate in the study, and the possible advantages and disadvantages of being part of the study. Taking into account national laws, the organizations that share and manage clinical data (raw and processed) have established the conditions to comply with the data protection requirements of the project in the areas of risk assessment, data protection impact assessment, data protection by design, security measures, privacy notice, data sharing and processing agreement, and record of processing activities. Sensitive attributes have been removed from the processed data integrated into the KG (Requirement ER2). These tasks have been evaluated and validated by the data protection officer of these institutions (Requirement ER3). Lastly, every detected ambiguity in the data that can be considered a data quality issue has been documented and verified with the clinical partners; all the decisions for data curation are documented (Requirement ER4).
5.5.User acceptance
An initial version of the aforementioned dashboard [33] has been provided to a group of relevant stakeholders to assess its quality and characteristics. Specifically, 44 evaluators have participated in dedicated training and evaluation sessions, running different scenarios, testing the dashboard functionalities, and querying to retrieve data and information of interest. They were then given a questionnaire, asking them to input general profile information and their motivation for utilizing the dashboard. An overview of the basic user groups that evaluated the dashboard can be seen in the results of Fig. 17. The evaluators justified the use of the system and data based on the following reasons:
– to analyze the characteristics of special populations for queries related to survival curve analysis;
– to learn how to use the platform and the various functionalities as a knowledge tool about lung cancer; and
– to identify some interesting publications and drug interactions
Fig. 17.
The initial question of the evaluation questionnaire, in order to identify the stakeholders’ groups that participated in the training and evaluation sessions.
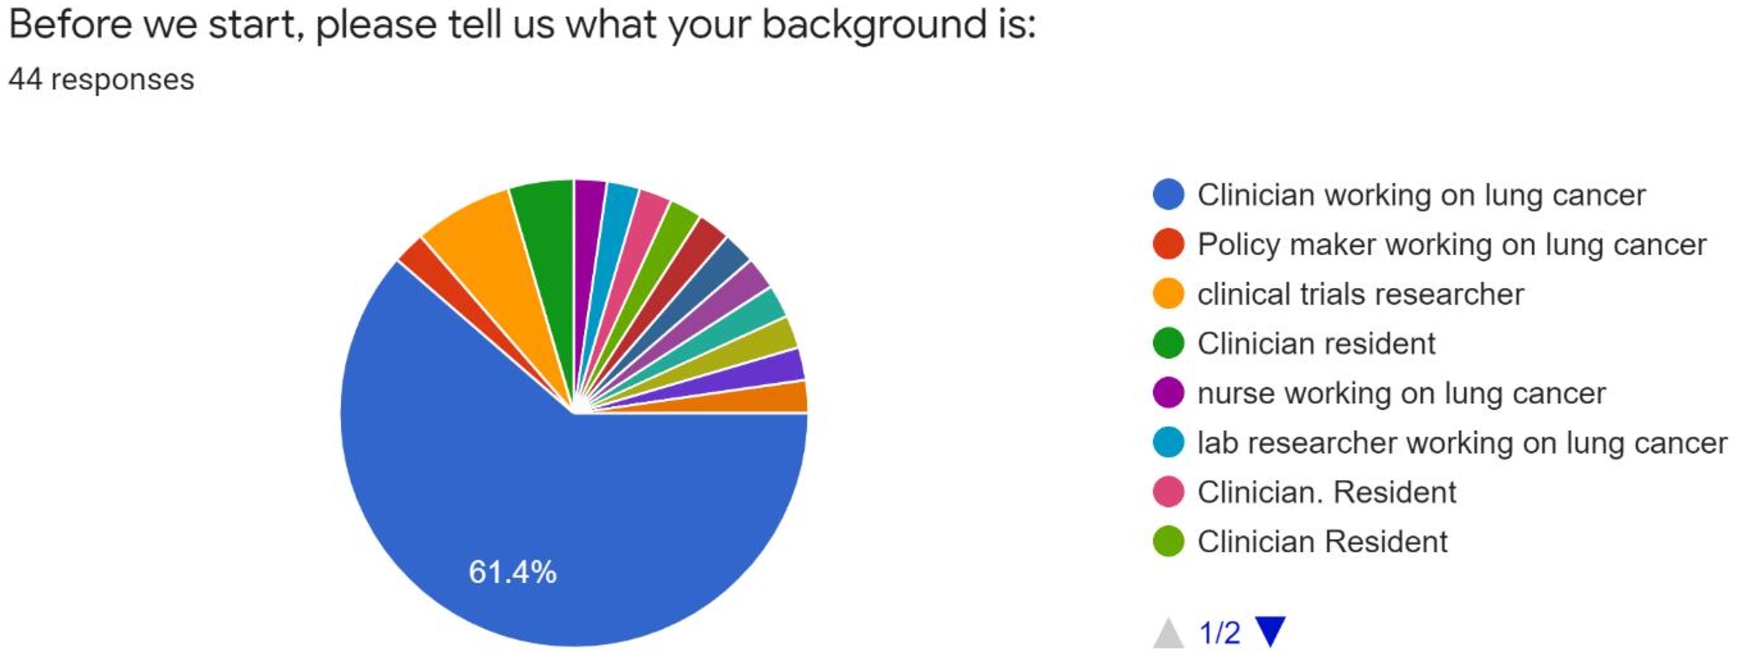
Fig. 18.
A general rating from the end-users, evaluating their overall experience with the dashboard.
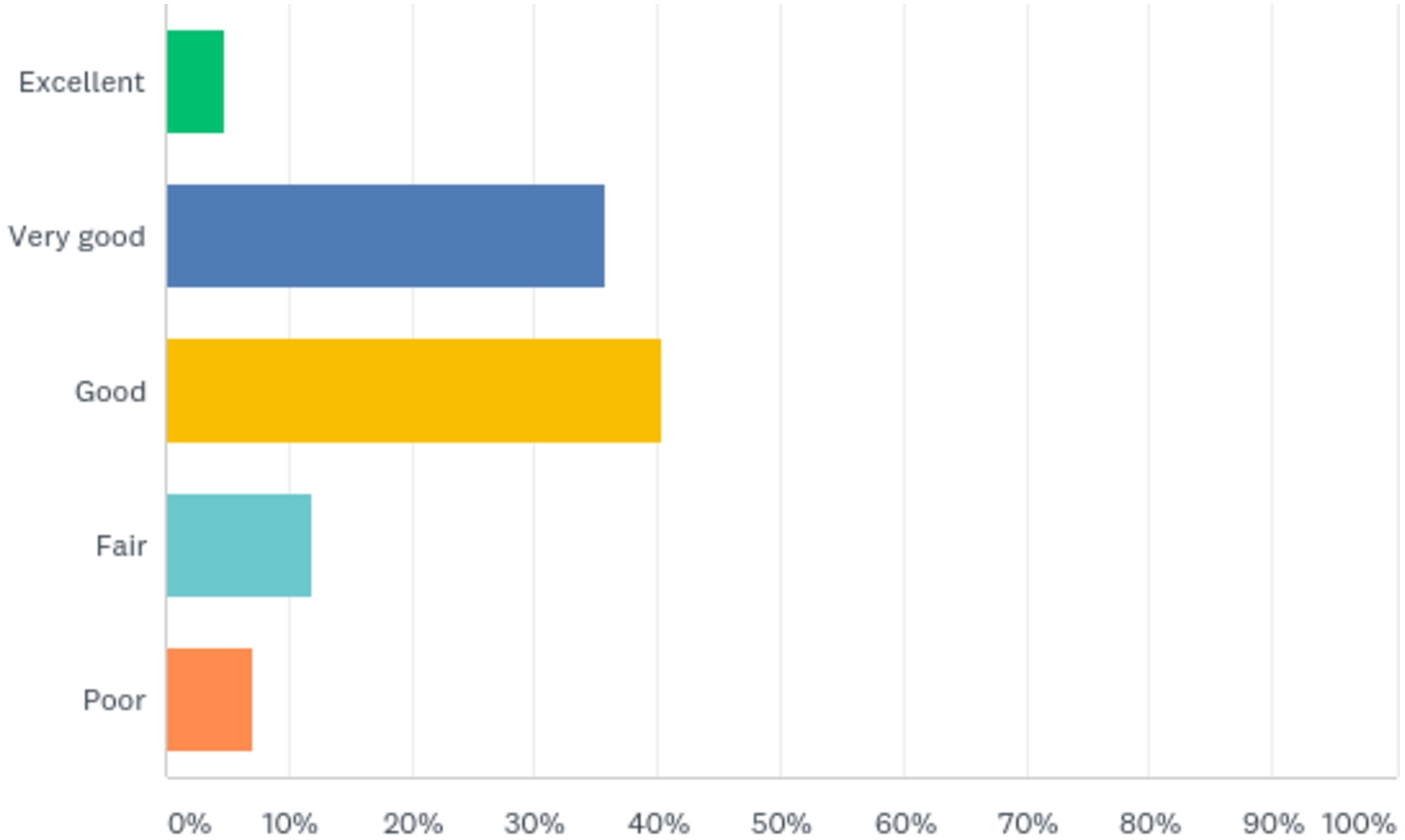
6.Related work
Health Data Management: Medical big data analyses suffer from various technical issues (missing values, dimensionality, etc.) and bias control [35]. Various initiatives aim to address the nexus of technical, legal, ethics-related, governance and data protection-related, and cultural challenges arising for health data ecosystems [36]. A first attempt to document and analyze all research, regulatory and ethical requirements stemming from the aggregation and analysis of clinical data from different health organizations was presented in [56], providing a solution architecture considering technical and organizational aspects. Other works [11,52] focus on the ethical and regulatory challenges surrounding AI in healthcare, analyzing the data protection and privacy requirements that will ensure fairness and transparency of related approaches. DE4LungCancer resorts to Semantic Web technologies (i.e., RML, FnO, SHACL, and UMLS) to enhance transparency during data integration and knowledge graph creation.
Big Data Ecosystems: A Data Ecosystem can be defined as a complex sociotechnical network, enabling collaboration between autonomous actors to explore and analyze big data [41]. Efficient, transparent, and ethical data management is an ultimate goal in such projects utilizing big data. This becomes more evident when dealing with biomedical or clinical data characterized by high sensitivity [1,39] and noisy entries [59]. DE4LungCancer is built on the knowledge-driven framework devised by Geisler and Vidal et al. [20] and makes available a network of nested data ecosystems able to exchange semantically described metadata. This knowledge enrichment empowers DE4LungCancer with transparency and facilitates data integration and analytics traceability.
Biomedical Knowledge Graphs: Knowledge graphs have gained attention as expressive data structures that enable the convergence of the data and knowledge using a graph data model [22]. They provide a common understanding of a domain while stating the meaning and properties of the domain’s entities. Specifically in Life Sciences, knowledge graphs can empower hypothesis driven-experimentation [25] with knowledge extracted from the integration of various data sources or collected from community-maintained knowledge graphs (e.g., DBpedia and Wikidata) [55]. In the context of biomedicine, several knowledge graphs have been created [17,27,40,44,53,55,58]. They represent exemplar frameworks that put the potential of knowledge graphs into perspective by providing the knowledge required to discover novel patterns, e.g., drug–drug interactions [40,53], cancer biomarkers [27], and cytokine levels as a biomarker [44]. Built on these results, we devise DE4LungCancer and develop a framework where stakeholders can share biomedical data sources which are integrated into the DE4LungCancer KG. Contrary to the previously mentioned approaches, DE4LungCancer relies on mapping languages, i.e., RML and FnO, to specify the knowledge graph process declaratively. DE4LungCancer provides Web services to traverse the DE4LungCancer mapping rules and the unified schema, enhancing, thus, the transparency of the data integration tasks. Although the DE4LungCancer KG integrates clinical data of lung cancer patients, the DE4LungCancer framework implements the query processing methods proposed by Endris et al. [14] and ensures that data privacy regulations are respected during the execution of queries against the DE4LungCancer KG.
Quality & Ethics-Aware Data Management: To ensure data validity and address ethical considerations and security risks of the Electronic Health Record use in such Ecosystems, the best practices have to be followed concerning data integrity, privacy, and security [6]. KnowLife [15] presents an annotation-based error analysis method to assess the quality of automatic construction of knowledge bases from unstructured online sources, such as the biomedical literature. Authors in [47] construct a diseases-symptoms KG from electronicist models and evaluate its quality by comparing it to the Google health KG. A most relevant and holistic approach is presented in [20], where authors analyze the data management, legal and ethical requirements posed in significant data ecosystems and illustrate a knowledge-driven architecture to fulfill those. Built on these results, DE4LungCancer implements data management principles and respects the guidelines stated in [20] to provide a high-quality and ethics-aware knowledge-driven framework capable of answering clinical research questions.
7.Conclusions and future work
This paper discusses knowledge-driven data ecosystems (DEs) and their prognostic role in enhancing transparency. DE4LungCancer has been presented as the computational framework to address the data management, clinical, ethical, and legal requirements of the lung cancer pilot of the H2020 EU projects iASiS, BigMedilytics, and CLARIFY, and in the EraMed project P4-LUCAT. DE4LungCancer is a nested framework that comprises three DEs that process and analyze the pilot datasets. DE4LungCancer offers a semantic layer composed of a unified schema, biomedical ontologies, and mapping languages; they provide the basis for transparent data integration into a KG. The hybrid approach that combines the multidisciplinary pilot team with computational tools to validate integrity constraints, the unified schema, and the mapping rules have enhanced the trustability of the outcomes of the analytical services. More importantly, the documentation of the whole process backs up the certification of the process by ethical committees and data protection officers. The project clinical partners can access the DE4LungCancer services through a dashboard. The outcome of the execution of the provided services has enhanced the understanding of the conditions of the hospital services visited by lung cancer patients. Based on the observed results, clinical interventions have been devised. We plan to develop analytical methods to analyze the interventions’ results toward improving the patients’ quality of life.
Notes
30 Note that an entity (e.g., a drug) may belong to various DE4LungCancer classes, this explains why the total numbers of links do not correspond to the sum of the number of links of each DE4LungCancer class.
Acknowledgements
This work has been supported by the EU H2020-funded projects iASiS (GA No. 727658), BigMedilytics (GA No. 780495), the EraMed project P4-LUCAT (GA No. 53000015), and the EU H2020 RIA project CLARIFY (GA No. 875160). Furthermore, Maria-Esther Vidal is partially supported by Leibniz Association in the program “Leibniz Best Minds: Programme for Women Professors”, project TrustKG-Transforming Data in Trustable Insights with grant P99/2020.
Appendices
Appendix A.
Appendix A.Queries to explore RML mapping rules of DE4LungCancer KG
Listing 1 presents a SPARQL query that collects the information about the mapping rules that define the class lc:LCPatient. The projected attributes include the data source from where the data is collected, and per a predicate of the class, the attribute(s) of the corresponding data source used to populate the predicate. These queries can be executed over the SPARQL endpoint27 that includes all the RML mappings that describe the whole process of creating the DE4LungCancer KG. Moreover, Listing 2 depicts a SPARQL query that retrieves the functions called from the mapping rules. The projected attributes include a function call, the function arguments, the action performed over the arguments, and the value of the argument.
Listing 1.
SPARQL query to retrieve RML mapping rules defining the class LCPatient

Listing 2.
SPARQL query to retrieve FnO functions called in mapping rules
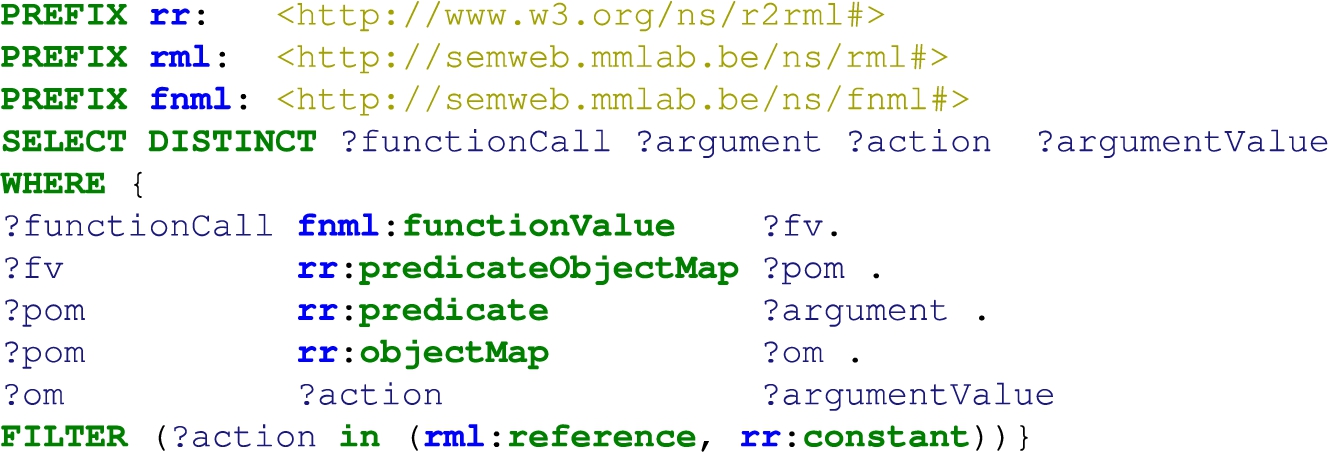
Appendix B.
Appendix B.Queries to explore the open DE4LungCancer KG
This appendix illustrates some exemplary queries to be executed over the version of the DE4LungCancer KG which is publicly accessible via the SPARQL endpoint.7 Query in Listing 3 retrieves the drugs that composed a given treatment and the DDIs among these drugs. Query in Listing 4 reports, per treatment, the number of DDIs extracted from DrugBank (?extensionalDDI) and the ones deduced using the deductive system (?intensionalDDI). Additionally, it retrieves the percentage of new interactions deduced by the system. Query in Listing 5 reports, per treatment, the number of DDIs extracted from DrugBank (?extensionalDDI) and the ones from literature (?intensionalDDI). Additionally, it retrieves the percentage of new interactions predicted by the literature. Query in Listing 6 retrieves per treatment the drugs that compose the treatment and the number of DDIs that have been reported in DrugBank for the drugs of the treatment. Query in Listing 7 compares the number of drugs per treatment, and the DDIs extracted from DrugBank and the ones inferred using our proposed deductive system. Query in Listing 8 retrieves the drugs that are more commonly used in the lung cancer treatments. We can observe that Omeprazole, Carboplatin, Atorvastatin, Enalapril, and Simvastatin are the top-5 most prescribed drugs in the therapies registered in the clinical data.
Listing 3.
DDIs identified in each of the lung cancer treatments
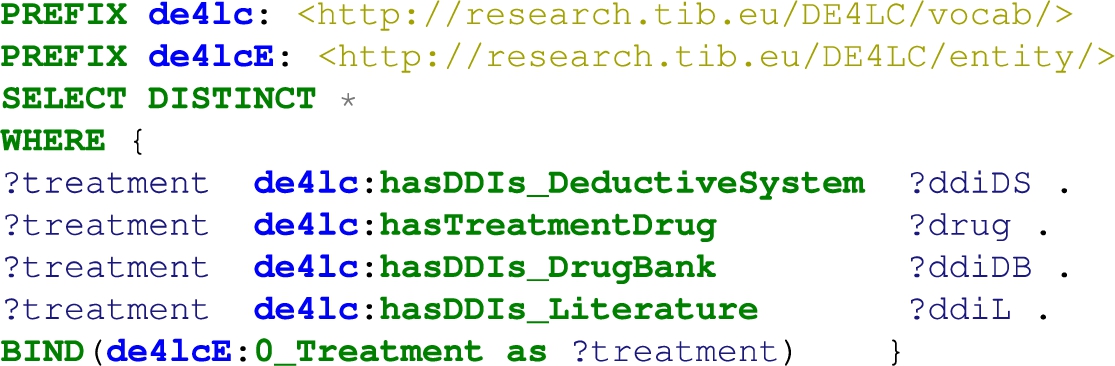
Listing 4.
Comparison of DDIs extracted from DrugBank versus the deduced DDIs
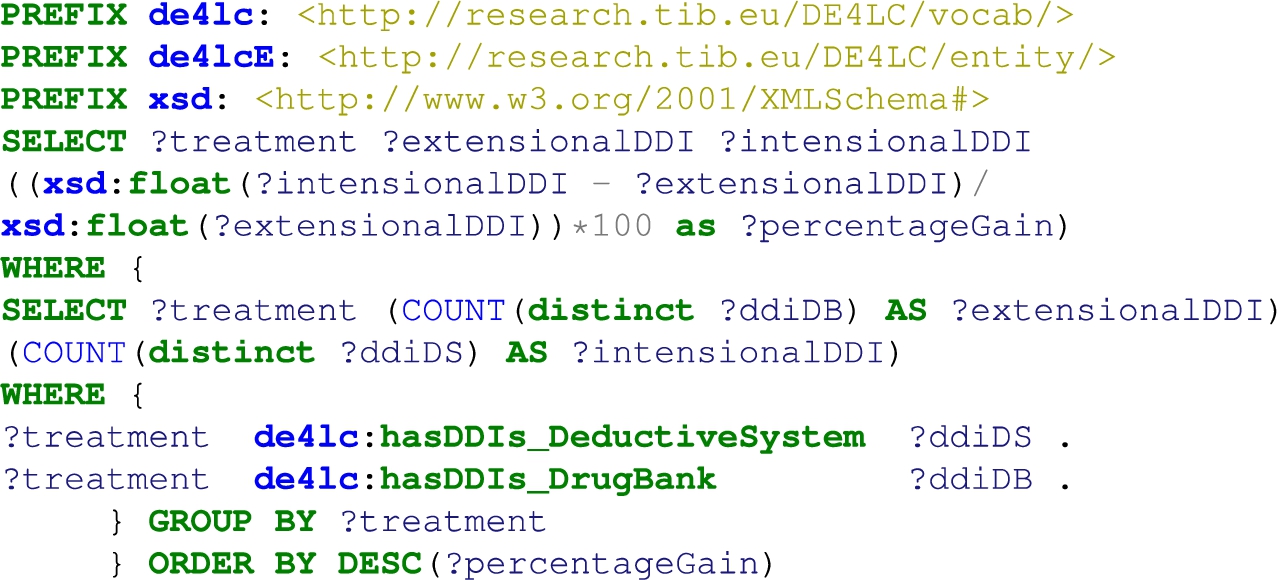
Listing 5.
Comparison of DDIs extracted from DrugBank versus the predicted DDIs using literature
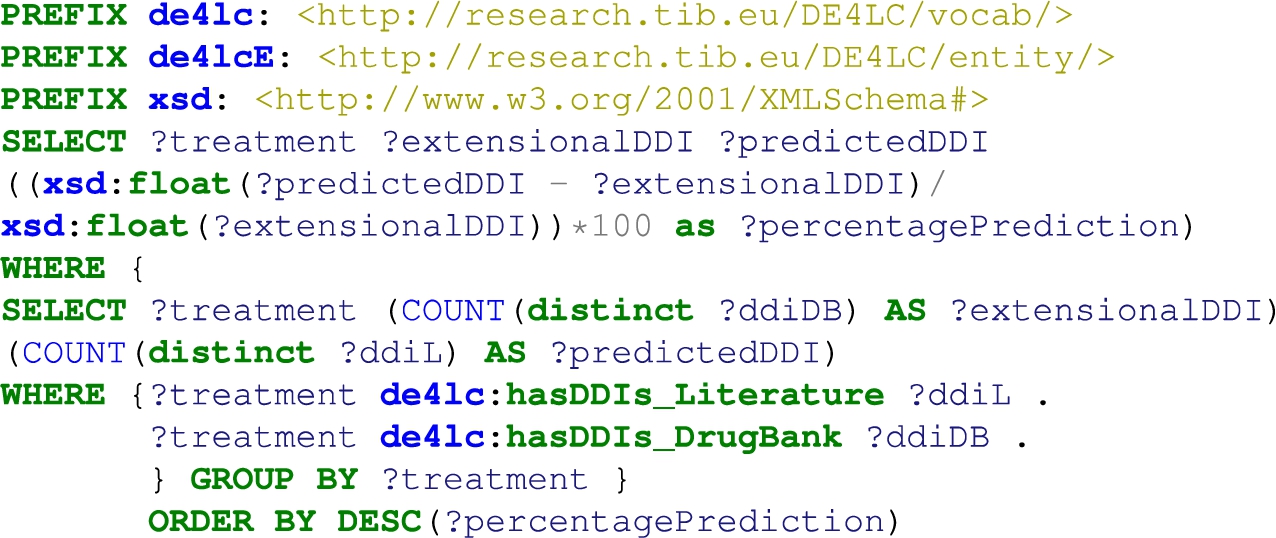
Listing 6.
Comparison of drugs and DDIs (extracted from DrugBank) per treatment
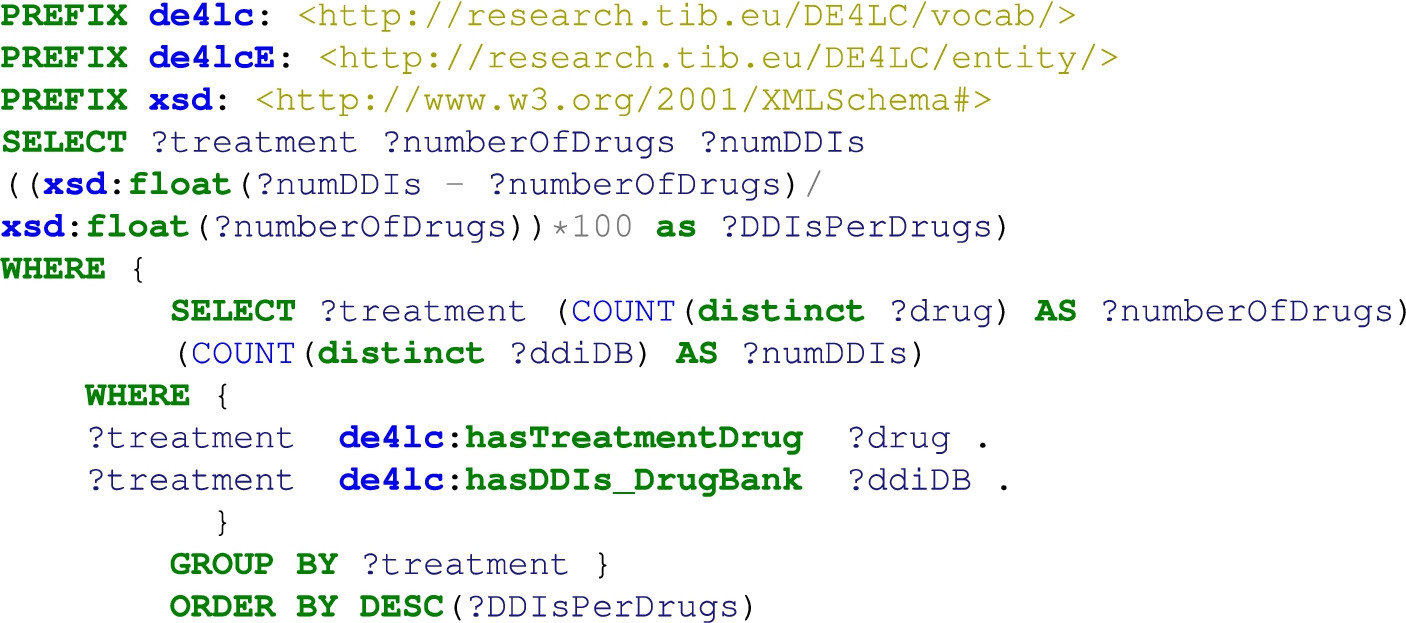
Listing 7.
Comparison of drugs and DDIs (extracted from DrugBank and deduced using DS) per treatment
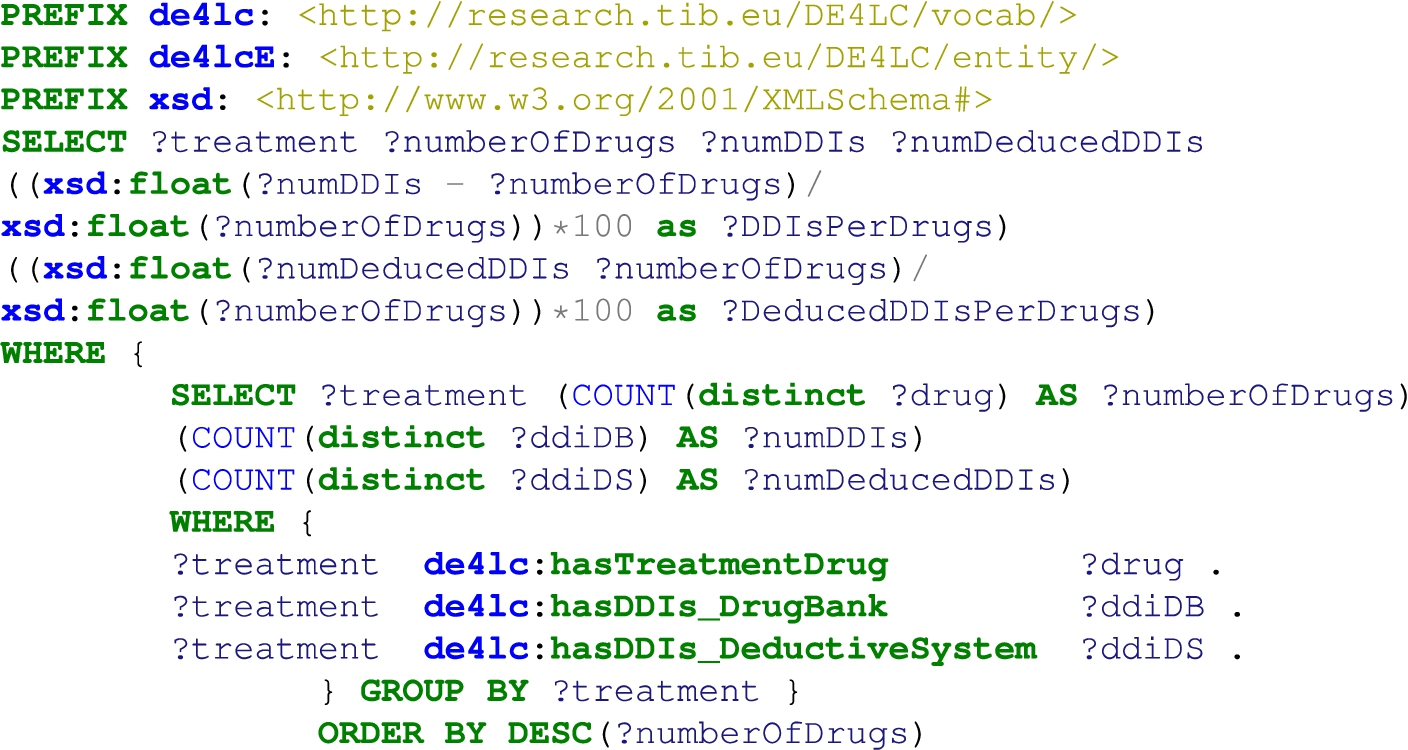
Listing 8.
The top 20 drugs that are most used in the treatments
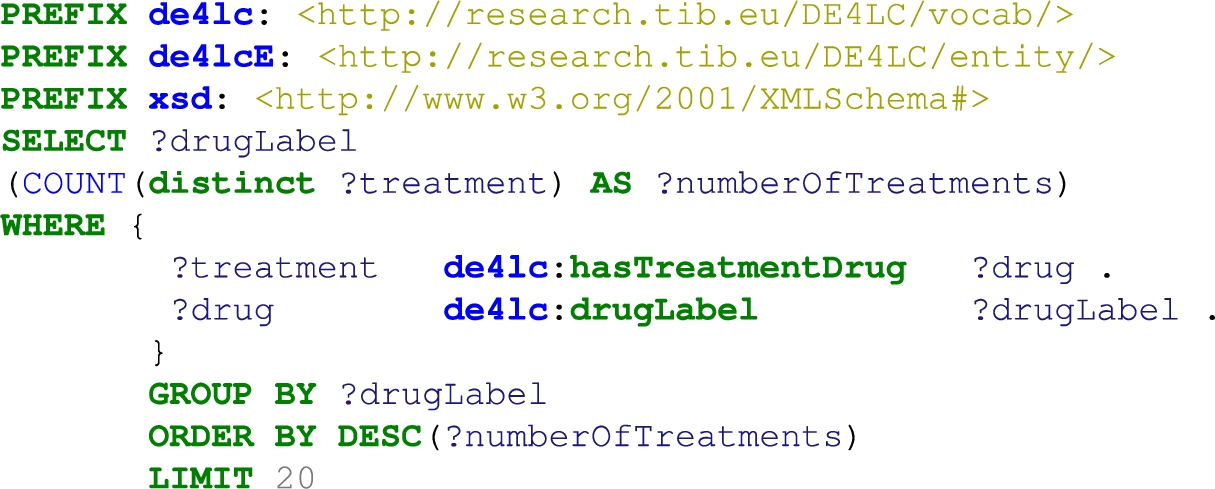
References
[1] | J. Aaen, J.A. Nielsen and A. Carugati, The dark side of data ecosystems: A longitudinal study of the damd project, European Journal of Information Systems ((2021) ), 1–25. |
[2] | H. Abraham, C. White and W. White, The comparative efficacy and safety of the angiotensin receptor blockers in the management of hypertension and other cardiovascular diseases, Drug Saf 38: ((2015) ), 33–54. doi:10.1007/s40264-014-0239-7. |
[3] | M. Acosta, E. Simperl, F. Flöck and M. Vidal, Enhancing answer completeness of SPARQL queries via crowdsourcing, J. Web Semant. 45: ((2017) ), 41–62. doi:10.1016/j.websem.2017.07.001. |
[4] | A.R. Aronson, Metamap: Mapping text to the umls metathesaurus. Bethesda, MD: NLM, NIH, DHHS, 1:26, 2006. |
[5] | S. Auer, C. Bizer, G. Kobilarov, J. Lehmann, R. Cyganiak and Z. Ives, Dbpedia: A nucleus for a web of open data, in: Proceedings of ISWC + ASWC, (2007) , pp. 722–735. |
[6] | E.A. Balas, M.M. Vernon, F. Magrabi, L.T. Gordon, J. Sexton et al., Big data clinical research: Validity, ethics, and regulation, in: MedInfo, (2015) , pp. 448–452. |
[7] | A. Bordes, N. Usunier, A. Garcia-Duran, J. Weston and O. Yakhnenko, Translating embeddings for modeling multi-relational data, in: Advances in Neural Information Processing Systems, Vol. 26: , (2013) . |
[8] | K. Bougiatiotis, F. Aisopos, A. Nentidis, A. Krithara and G. Paliouras, Drug–drug interaction prediction on a biomedical literature knowledge graph, in: International Conference on Artificial Intelligence in Medicine, Springer, (2020) , pp. 122–132. |
[9] | K. Bougiatiotis, R. Fasoulis, F. Aisopos, A. Nentidis and G. Paliouras, Guiding graph embeddings using path-ranking methods for error detection innoisy knowledge graphs, 2020, arXiv preprint arXiv:2002.08762. |
[10] | À. Bravo Serrano, J. Piñero González, N. Queralt Rosinach, M. Rautschka and L.I. Furlong, Extraction of relations between genes and diseases from text and large-scale data analysis: Implications for translational research, BMC Bioinformatics 16: (1) ((2015) ), 55. |
[11] | D.S. Char, N.H. Shah and D. Magnus, Implementing machine learning in health care – addressing ethical challenges, The New England Journal of Medicine 378: (11) ((2018) ), 981. doi:10.1056/NEJMp1714229. |
[12] | H. Chen, S.S. Fuller, C. Friedman and W. Hersh, Knowledge management, data mining, and text mining in medical informatics, in: Medical Informatics, Springer, (2005) , pp. 3–33. doi:10.1007/0-387-25739-X_1. |
[13] | A. Dimou, M.V. Sande, P. Colpaert, R. Verborgh, E. Mannens and R.V. de Walle, RML: A generic language for integrated RDF mappings of heterogeneous data, in: Proceedings of the Workshop on Linked Data on the Web Co-Located with WWW, (2014) . |
[14] | K.M. Endris, Z. Almhithawi, I. Lytra, M. Vidal and S. Auer, BOUNCER: Privacy-aware query processing over federations of RDF datasets, in: Database and Expert Systems Applications – 29th International Conference, DEXA 2018, Regensburg, Germany, September 3–6, 2018, Proceedings, Part I, S. Hartmann, H. Ma, A. Hameurlain, G. Pernul and R.R. Wagner, eds, Lecture Notes in Computer Science, Vol. 11029: , Springer, (2018) , pp. 69–84. |
[15] | P. Ernst, A. Siu and G. Weikum, Knowlife: A versatile approach for constructing a large knowledge graph for biomedical sciences, BMC Bioinformatics 16: (1) ((2015) ), 1–13. doi:10.1186/s12859-014-0430-y. |
[16] | Ethics guidelines for trustworthy AI, 2018, https://ec.europa.eu/digital-single-market/en/news/ethics-guidelines-trustworthy-ai. |
[17] | M. Färber and D. Lamprecht, The data set knowledge graph: Creating a linked open data source for data sets, Quantitative Science Studies 2: (4) ((2021) ), 1324–1355. doi:10.1162/qss_a_00161. |
[18] | M. Figuera, P.D. Rohde and M. Vidal, Trav-shacl: Efficiently validating networks of SHACL constraints, in: WWW ’21: The Web Conference 2021, Virtual Event / Ljubljana, Slovenia, April 19–23, 2021, (2021) , pp. 3337–3348. doi:10.1145/3442381.3449877. |
[19] | S.L. Freshour, S. Kiwala, K.C. Cotto, A.C. Coffman, J.F. McMichael, J.J. Song, M. Griffith, O.L. Griffith and A.H. Wagner, Integration of the drug–gene interaction database (dgidb 4.0) with open crowdsource efforts, Nucleic Acids Research 49: (D1) ((2021) ), D1144–D1151. |
[20] | S. Geisler, M. Vidal, C. Cappiello, B.F. Lóscio, A. Gal, M. Jarke, M. Lenzerini, P. Missier, B. Otto, E. Paja, B. Pernici and J. Rehof, Knowledge-driven data ecosystems toward data transparency, ACM J. Data Inf. Qual. 14: (1) ((2022) ), 3:1–3:12. |
[21] | P. Groth and M. Dumontier, Introduction – FAIR data, systems and analysis, Data Sci. 3: (1) ((2020) ), 1–2. |
[22] | C. Gutiérrez and J.F. Sequeda, Knowledge graphs, Commun. ACM 64: (3) ((2021) ), 96–104. doi:10.1145/3418294. |
[23] | L. Halilaj, N. Petersen, I. Grangel-González, C. Lange, S. Auer, G. Coskun and S. Lohmann, Vocol: An integrated environment to support version-controlled vocabulary development, in: Knowledge Engineering and Knowledge Management – 20th International Conference, EKAW 2016, Bologna, Italy, November 19–23, 2016, Proceedings, (2016) , pp. 303–319. |
[24] | S. Harris, A. Seaborne and E. Prud’hommeaux, Chloroquine or hydroxychloroquine and/or azithromycin, 2021. |
[25] | T. Hulsen, S.S. Jamuar, A.R. Moody, J.H. Karnes, O. Varga, S. Hedensted, R. Spreafico, D.A. Hafler and E.F. McKinney, From big data to precision medicine, Frontiers in Medicine 6: ((2019) ). |
[26] | E. Iglesias, S. Jozashoori, D. Chaves-Fraga, D. Collarana and M.-E. Vidal, Sdm-rdfizer: An rml interpreter for the efficient creation of rdf knowledge graphs, in: ACM International Conference on Information & Knowledge Management, (2020) . |
[27] | A. Jha, Y. Khan, M. Mehdi, M.R. Karim, Q. Mehmood, A. Zappa, D. Rebholz-Schuhmann and R. Sahay, Towards precision medicine: Discovering novel gynecological cancer biomarkers and pathways using linked data, J. Biomed. Semant. 8: (1) ((2017) ), 40:1–40:16. |
[28] | S. Jozashoori, D. Chaves-Fraga, E. Iglesias, M. Vidal and Ó. Corcho, Funmap: Efficient execution of functional mappings for knowledge graph creation, in: The Semantic Web – ISWC 2020 – 19th International Semantic Web Conference, (2020) . |
[29] | S. Jozashoori, A. Sakor, E. Iglesias and M. Vidal, Eablock: A declarative entity alignment block for knowledge graph creation pipelines, in: The ACM Symposium on Applied Computing, SAC, (2022) . |
[30] | M.T. Kabir et al., Combination drug therapy for the management of Alzheimer’s disease, International Journal of Molecular Sciences 21: (9) ((2020) ). |
[31] | H. Kilicoglu, D. Shin, M. Fiszman, G. Rosemblat and T.C. Rindflesch, Semmeddb: A pubmed-scale repository of biomedical semantic predications, Bioinformatics 28: (23) ((2012) ), 3158–3160. doi:10.1093/bioinformatics/bts591. |
[32] | H. Knublauch and D. Kontokostas, Shapes constraint language (shacl), W3C Recommendation, 2017. |
[33] | A. Krithara, F. Aisopos, V. Rentoumi, A. Nentidis, K. Bougatiotis, M.-E. Vidal, E. Menasalvas, A. Rodriguez-Gonzalez, E. Samaras, P. Garrard et al., Iasis: Towards heterogeneous big data analysis for personalized medicine, in: 2019 IEEE 32nd International Symposium on Computer-Based Medical Systems (CBMS), IEEE, (2019) , pp. 106–111. |
[34] | N. Lao and W.W. Cohen, Relational retrieval using a combination of path-constrained random walks, Machine Learning 81: (1) ((2010) ), 53–67. doi:10.1007/s10994-010-5205-8. |
[35] | C.H. Lee and H.-J. Yoon, Medical big data: Promise and challenges, Kidney Research and Clinical Practice 36: (1) ((2017) ), 3. |
[36] | S. Marjanovic, I. Ghiga, M. Yang and A. Knack, Understanding value in health data ecosystems: A review of current evidence and ways forward, Rand Health Quarterly 7: (2) ((2018) ). |
[37] | A. Melo and H. Paulheim, Detection of relation assertion errors in knowledge graphs, in: Proceedings of the Knowledge Capture Conference, (2017) , pp. 1–8. |
[38] | G.A. Mihaila, L. Raschid and M. Vidal, Using quality of data metadata for source selection and ranking, in: Proceedings of the Third International Workshop on the Web and Databases, WebDB 2000, Adam’s Mark Hotel, Dallas, Texas, USA, May 18–19, 2000, in Conjunction with ACM PODS/SIGMOD 2000. Informal Proceedings, (2000) , pp. 93–98. |
[39] | B.D. Mittelstadt and L. Floridi, The ethics of big data: Current and foreseeable issues in biomedical contexts, in: The Ethics of Biomedical Big Data, (2016) , pp. 445–480. doi:10.1007/978-3-319-33525-4_19. |
[40] | D.N. Nicholson and C.S. Greene, Constructing knowledge graphs and their biomedical applications, Computational and Structural Biotechnology Journal 18: ((2020) ), 1414–1428. doi:10.1016/j.csbj.2020.05.017. |
[41] | M.I.S. Oliveira, G.d.F.B. Lima and B.F. Lóscio, Investigations into data ecosystems: A systematic mapping study, Knowledge and Information Systems 61: (2) ((2019) ), 589–630. doi:10.1007/s10115-018-1323-6. |
[42] | M. Provencio et al., Neoadjuvant chemotherapy and nivolumab in resectable non-small-cell lung cancer (nadim): An open-label, multicentre, single-arm, phase 2 trial, The Lancet Oncology ((2020) ). |
[43] | E. Prud’hommeaux and A. Seaborne, Sparql query language for rdf, W3C Recommendation, 2008. |
[44] | N. Queralt-Rosinach, R. Kaliyaperumal and C.H. Bernabe et al., Applying the fair principles to data in a hospital: Challenges and opportunities in a pandemic, J Biomedical Semantics 13: (12) ((2022) ). |
[45] | T. Rindflesch and M. Fiszman, The interaction of domain knowledge and linguistic structure in natural language processing: Interpreting hypernymic propositions in biomedical text, Journal of Biomedical Informatics 36: (6) ((2003) ), 462–477. doi:10.1016/j.jbi.2003.11.003. |
[46] | A. Rivas and M.-E. Vidal, Capturing knowledge about drug–drug interactions to enhance treatment effectiveness, in: Proceedings of the 11th on Knowledge Capture Conference, K-CAP ’21, Association for Computing Machinery, New York, NY, USA, (2021) , pp. 33–40. doi:10.1145/3460210.3493560. |
[47] | M. Rotmensch, Y. Halpern, A. Tlimat, S. Horng and D. Sontag, Learning a health knowledge graph from electronic medical records, Scientific Reports 7: (1) ((2017) ), 1–11. doi:10.1038/s41598-016-0028-x. |
[48] | E. Ruckhaus, M. Vidal, S. Castillo, O. Burguillos and O. Baldizan, Analyzing linked data quality with liquate, in: The Semantic Web: ESWC 2014 Satellite Events – ESWC 2014 Satellite Events, Anissaras, Crete, Greece, May 25–29, 2014, Revised Selected Papers, (2014) , pp. 488–493. |
[49] | A. Sakor, I.O. Mulang, K. Singh, S. Shekarpour, M. Vidal, J. Lehmann and S. Auer, Old is gold: Linguistic driven approach for entity and relation linking of short text, in: Proceedings of the 2019 Conference of the North American Chapter of the Association for Computational Linguistics: Human Language Technologies, NAACL-HLT 2019, Minneapolis, MN, USA, June 2–7, 2019, Volume 1 (Long and Short Papers), (2019) , pp. 2336–2346. |
[50] | A. Sakor, K. Singh, A. Patel and M. Vidal, Falcon 2.0: An entity and relation linking tool over Wikidata, in: The 29th ACM International Conference on Information and Knowledge Management – CIKM, (2020) . |
[51] | M. Scurti, E.M. Ruiz, M. Vidal, M. Torrente, D. Vogiatzis, G. Paliouras, M. Provencio and A.R. González, A data-driven approach for analyzing healthcare services extracted from clinical records, in: 33rd IEEE International Symposium on Computer-Based Medical Systems, CBMS 2020, (2020) . |
[52] | E. Vayena, A. Blasimme and I.G. Cohen, Machine learning in medicine: Addressing ethical challenges, PLoS Medicine 15: (11) ((2018) ), e1002689. doi:10.1371/journal.pmed.1002689. |
[53] | M. Vidal, K.M. Endris, S. Jazashoori, A. Sakor and A. Rivas, Transforming heterogeneous data into knowledge for personalized treatments – a use case, Datenbank-Spektrum 19: (2) ((2019) ), 95–106. doi:10.1007/s13222-019-00312-z. |
[54] | D. Vrandecic and M. Krötzsch, Wikidata: A free collaborative knowledgebase, Commun. ACM 57: (10) ((2014) ), 78–85. doi:10.1145/2629489. |
[55] | A. Waagmeester et al., Science forum: Wikidata as a knowledge graph for the life sciences, eLife 9: ((2020) ), e52614. https://elifesciences.org/articles/52614. |
[56] | M. Wiesenauer, C. Johner and R. Röhrig, Secondary use of clinical data in healthcare providers – an overview on research, regulatory and ethical requirements, in: Quality of Life Through Quality of Information, (2012) , pp. 614–618. |
[57] | R. Wood and G. Taylor-Stokes, Cost burden associated with advanced non-small cell lung cancer in Europe and influence of disease stage, BMC Cancer 19: (1) ((2019) ). |
[58] | J. Yuan, Z. Jin, H. Guo, H. Jin, X. Zhang, T.H. Smith and J. Luo, Constructing biomedical domain-specific knowledge graph with minimum supervision, Knowl. Inf. Syst. 62: (1) ((2020) ), 317–336. doi:10.1007/s10115-019-01351-4. |
[59] | S. Zheng, J. Rao, Y. Song, J. Zhang, X. Xiao, E.F. Fang, Y. Yang and Z. Niu, Pharmkg: A dedicated knowledge graph benchmark for bomedical data mining, Briefings in Bioinformatics 22: (4) ((2021) ), bbaa344. |
[60] | Y. Zhou, Y. Zhang, X. Lian, F. Li, C. Wang, F. Zhu, Y. Qiu and Y. Chen, Therapeutic target database update 2022: Facilitating drug discovery with enriched comparative data of targeted agents, Nucleic Acids Research 50: (D1) ((2022) ), D1398–D1407. |

