


1. Introduction
Lead-210 is a member of the 238U decay family (Fig. 1). It may become air-borne as a far decay product of 222Rn which diffuses from the Earth’s crust into the atmosphere at an average rate of about 40 atoms min−1 cm−2 (Reference Eakins and MorrisonEakins and Morrison, 1976). The mean activity of 210Pb in the air of Fribourg (Switzerland) is found to be about 10−2 pCi m−3 (Gunten, 1973; Reference GäggelerGäggeler and others, 1976). After a mean residence time of a few days to a few weeks it is washed out from the atmosphere (Reference Eakins and MorrisonEakins and Morrison, 1976). The average activity of 210Pb in rain and snow amounts to 2 pCi 1−1 (4.4 dpm 1−1). In alpine and Arctic regions this precipitation is deposited as snow on the surface of glaciers. Due to radioactive decay the activity decreases with depth of the firn and ice. The time accessible for dating purposes with this method is mainly determined by the half-life of 210Pb of 22.3 years. Under favourable conditions it is possible to reach the beginning of the nineteenth century. However, accurate dating is only possible under the following assumptions: (i) The mean 210Pb activity in precipitations has remained constant during the last two centuries, (ii) the 226Ra concentrations within the firn/ice samples are negligible, (iii) no diffusion of air into the glacier occurs (bearing additional 222Rn) and (iv)210Pb remains at the initial place of deposition (no transportation by water from melting snow). Unfortunately, none of these assumptions is perfectly fulfilled.
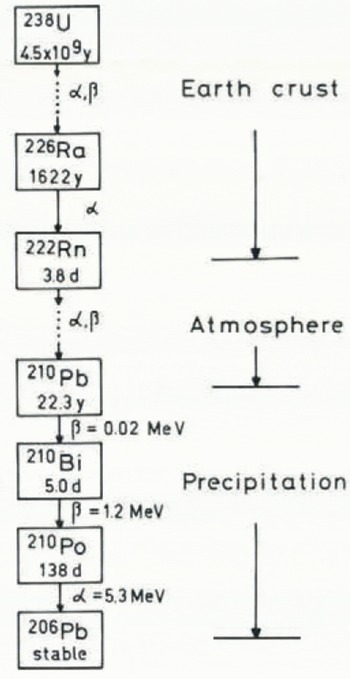
Fig. 1. Products in the decay chain of 238U of importance in the 210Pb dating method. 222Rn escapes from the Earth’s crust into the atmosphere, thereby producing air-borne 210Pb.
210Pb measurements in monthly air samples show fluctuations by more than a factor of two (Reference HuberHuber, 1974, p. 18). However, we found that annual mean values are quite constant [(1.2±0.1) × 10−2 pCi m−3 air] over the last eight years (1973–80). Assumption (ii) above is correlated with the amount of solid material, i.e. dirt and minerals, in the ice and their content of 226Ra. Assuming a homogeneous distribution of solids, a constant background activity of 210 Pb would result. Due to a lack of data it is difficult to estimate additional 210Pb originating from diffusion of air into the uppermost firn layers (assumption (iii)). This would result in too high an activity near the surface. But melting processes (assumption (iv)) could also disturb the primary deposition. An “ideal” glacier should, therefore, be very clean, compact, and cold.
The first attempts at dating firn or ice layers with the 210Pb method were made by Reference GoldbergGoldberg (1963), Reference PicciottoPicciotto and others (1964), Reference CrozazCrozaz and others (1964), Reference NezamiNezami and others (1964), Reference Crozaz and LangwayCrozaz and Langway (1966), and Reference CrozazCrozaz (unpublished) on firn samples from south Greenland and from the South Pole. The deduced accumulation rates were in fair agreement with results obtained by other methods. This encouraged Reference PicciottoPicciotto and others (1967) to use the 210 Pb method on firn cores originating from the accumulation zone of the temperate Kesselwandferner (Austria). The cores were taken at about 3 200 m altitude representing a time interval of about ten years. The measured 210Pb activities varied by about a factor of two from sample to sample around a mean value of 4.3 dpm kg−1 and showed no decrease with depth. This may be connected with the percolation of water from melting snow. Measurements of total beta activity on the same glacier clearly showed a correlation with summer ablation horizons (Reference AmbachAmbach and others, 1971[b]). A similar but more marked erratic behaviour was observed by Reference SchottererSchotterer and others (1977) in ice cores from Plaine Morte (Switzerland), a 15 km2 flat glacier at only 2 750 m altitude. At this low altitude years with positive and negative mass balance occur. Combined with melting processes this may strongly influence the initial distribution of the activity. In fact, the measured 210Pb concentrations showed very large fluctuations with maxima of up to 130 dpm kg−1 connected with dirt horizons. This indicates that 210Pb may be transported with water, thus preventing a meaningful dating of temperate glaciers with this nuclide.
Attempts to test the 210Pb method were also made with ice cores from the Jungfraujoch ice cap (Switzerland, 3 470 m altitude). The temperatures of the contact zone between rock and ice have been measured at this location (Reference Haefeli and KingeryHaefeli, 1963) to lie between −2 °C and −3.4 °C. Due to the very exposed location the accumulation is strongly influenced by wind erosion and varies over a wide range (Reference AmbachAmbach and others, 1971[b]), whereas the disturbance by water from melting snow plays a minor role. The measured 210Pb distribution within an 18 m core covering a time interval of about 20 years did not exhibit a clear decrease of the activity with depth (Reference SchottererSchotterer and others, 1977).
In order to further investigate the applicability of the 210Pb method on alpine glaciers we participated in the Colle Gnifetti project (Reference OeschgerOeschger and others, [1978]). In 1976 and 1977 two cores were drilled on the uppermost part of Grenzgletscher (Switzerland at 4 450 m altitude), reaching a depth of 65 m. The temperature in the firn and ice was measured to be −14 °C to −15°C, thus excluding melting processes which could disturb the annual layers.
The extensive project which is described by Reference OeschgerOeschger and others ([1978]) should result in an understanding of the history of this high-altitude glacier. It should also shed light on the conserved information on the environmental system.
In most of the 210Pb determinations performed so far in firn/ice samples lead was isolated and then counted for β-decay. Such a procedure requires a considerable effort for a quantitative separation from kilogramme amounts of material. The radiochemical purity of the final samples can only be checked by the growth or decay of the five-day daughter nuclide 210Bi, provided its activity is high enough to yield statistically significant results (e.g. Crozaz, unpublished). On the other hand, a direct spectroscopic determination of 210Pb by its 46.5 keV gamma-ray demands activities of about 5 pCi due to the high internal conversion of this gamma-ray and the relatively low counting efficiency of Ge detectors (Reference GäggelerGäggeler and others, 1976).
In this work 210Pb was determined through its daughter product 210Po (Fig. 1). The advantages of this method are: (i) higher counting efficiency of α-counters and a much lower background compared to β-measurements, thus allowing smaller samples (100–200 g), (ii) easy chemical separation of 210Po, and (iii) unequivocal attribution of the measured activity due to spectroscopy of the 5.3 MeV α-line of 210Po.
2. Experimental
The site of the core drilling is shown in Figure 2. Two cores were taken using an electromechanical drill developed at the Physikalisches Institut, Universität Bern, by Reference Rufli and SplettstoesserRufli and others ([c1976]). In July 1976 and August 1977 core depths of 32 m and 65 m were reached (Reference OeschgerOeschger and others, [1978]). The individual core samples (diameter 76 mm, length 70 to 100 cm) were transported in a freezer to the laboratory. Each of the firn or ice samples was cut into several pieces parallel to the drilling axis in order to permit different studies from the same core section. The amount of material used for the 210Pb determination varied between 100 g at the top of a core and about 250 g in the lower part. Each sample was melted having 5 ml conc. HCl per 100 g of ice present. SO2 gas was bubbled for 3 min through the solution at a temperature of 90–95 °C. 210Po was deposited on a silver disk (diameter 15 mm) which was suspended in the hot solution (Reference FigginsFiggins, 1961, p. 29–30). This disk, fixed on a wire, was coated on one side (Rutex Liquid Rubber, Belgium) in order to plate the activity onto the other side only. An almost quantitative deposition was achieved in approximately seven hours. The chemical efficiency was determined to be 90 ± 10% using 210Po tracer solutions. After drying, the samples were positioned in vacuum chambers at a distance of 1 mm from silicon surface barrier detectors (ORTEC, ruggedized, 300 mm2 and 450 mm2) having an α-energy resolution of about 23 keV full width at half maximum (FWHM) at 5.486 MeV. The efficiencies for the 5.3 MeV α-line of 210Po were determined to be 18 ± 2% and 28 ± 3%, respectively, for the two detectors.

Fig. 2. Colle Gnifetti region with the two locations of core drilling. • 1977 core, coordinates 633850/86620. ▪ 1976 core, approximate location. Reproduction authorized by Bundesamt für Landestopographie of Switzerland on 9 September 1981.
3. Results
The α-spectrum obtained from sample No. 1 of the 1976 core which is typical for these measurements is shown in Figure 3. It exhibits one single peak at an energy of 5.3 MeV with a resolution of about 25 keV (FWHM).

Fig. 3. α-spectrum of sample No. 1 from the 1976 core. The counting time was 258.850 s.
The 210Pb data from the 1976 and 1977 core are summarized in Tables I and II. Since the surface layers were disturbed by wind erosion and by the installation of the drilling tower, zero depth of the 1976 core is defined as the summer horizon of 1975 which is allocated by 3H measurements. The first sample of the 1977 core (100 to 165 cm) is marked by a Sahara dust layer representing snow of spring 1977. The 210Pb activities listed in Tables I and II are based on radiochemical equilibrium between the measured 210Po activity and its precursors 210Bi and 210Pb, and are corrected for chemical yield and counting efficiencies. Corrections for the decay of 210Po between the time of chemical separation and start of counting, for the decay of 210Pb between core drilling and chemical separation and for the small background at the position of the 5.3 MeV α-peak were also applied. The errors include counting statistics (1σ), uncertainties in the chemical yields (± 10%) and in the counting efficiency (± 10%). The absolute depth was converted into water equivalent (w.e.), using measured densities, which were obtained by weighing the samples in the field. The density curves for the 1976 and 1977 cores agree within experimental uncertainties. Updated density values for the 1976 core (Reference OeschgerOeschger and others. [1978]) were used.
Table 1. Experimental data of the 1976 ice core from Colle Gnifetti

Table II. Experimental data of the 1977 ice core from Colle Gnifetti

Two aliquots of samples No. 28 of core 1976, and No. 13 and No. 35 of core 1977 were measured. These duplicate determinations were reproducible. Sample No. 5 from the 1976 core was subdivided into 6 pieces (5a to 5f, Table I). The activity in these subsamples fluctuates by more than a factor of two. The mean value (3.7 dpm kg−1) obtained from the six samples, however, is in agreement with the integral determination of sample No. 5.
In Figures 4a and 5a the 210Pb activities of both cores are plotted versus w.e. depth. Large fluctuations are seen for these relatively small samples. If several samples are combined to 200 cm w.e. core sections (Figs 4b and 5b) a smoother decay of the 210Pb activity with depth is observed. These data were fitted using a least-squares method in order to calculate the mean accumulation rates of (37 ± 3) cm year−1 and (32 ± 2) cm year−1 for the 1976 and 1977 core, respectively. From the linear fit the surface activity is obtained to be (4.2 ± 0.2) dpm kg−1 and (4.1 ± 0.7) dpm kg−1, respectively.


4. Discussion
4.1. 210Pb activity at the surface of the firn
The surface activity of 210Pb at Colle Gnifetti of about 4 dpm kg−1 is comparable to that of other Alpine glaciers e.g. 4.3 dpm kg−1 for Kesselwandferner (Reference PicciottoPicciotto and others. 1967), (4.7 ± 0.3) dpm kg−1 at Plaine Morte and about 4 dpm kg−1 at Jungfraujoch (Reference SchottererSchotterer and others. 1977), indicating that the 210Pb activity in the precipitations must be rather independent of the location and altitude. The observed activities agree also with measurements in rain for the northern hemisphere (Reference Eakins and MorrisonEakins and Morrison, 1976). This suggests that the diffusion of 222Rn into the firn is negligible since this would increase the 210Pb concentration at the uppermost firn layers.
However, the values for Alpine regions are higher than surface activities of 2.7 dpm kg−1 and 1.6 dpm kg−1 observed on the South Greenland ice sheet and at the South Pole, respectively (Crozaz, unpublished). This may be caused by the huge areas of snow and ice covering the Earth’s crust in these regions, thereby inhibiting the release of 222Rn, and in addition by the depletion of 210Pb in the air over the oceans (see section 4.3).
4.2. Mean accumulation rates
The accumulation rates obtained for the cores of 1976 and 1977, of (37 ± 3) cm year−1 and (32 ± 2) cm year−1, respectively, are slightly different. If the different drilling position (Fig. 2) is neglected, the only obvious difference lies in the core depths which were 19.3 m w.e. in the 1976 core and 27.3 m w.e. in the 1977 core. If in the latter core only the section down to 20 m w.e. is analysed, a mean accumulation rate of (36 ± 4) cm year−1 is obtained. Our values of 30 to 40 cm w.e. per year approximate the results obtained by other techniques (Table III). These results indicate a small, but quite regular accumulation of snow at Colle Gnifetti.
Table III. Accumulation Rates for the Colle Gnifetti Cores 1976 and 1977 determined by different methods

The somewhat smaller accumulation rate obtained from the 210Pb measurements in the deeper 1977 ice core (Fig. 5) could be explained by an effect of decreasing annual ice layers with depth (Reference SchottererSchotterer and others, 1981):
From simple ice flow models a first approximation to the time scales can be obtained assuming a steady state of the glacier. Based on a constant horizontal velocity throughout the vertical profile. Reference HaefeliHaefeli (1961) developed a model which allows crude core dating according to

where t is the time in years, H the absolute ice thickness in m w.e., a the net annual accumulation rate in m w.e., and x the depth from the surface in m w.e.
Being purely kinematic, such a model does not include any ice flow law. In order to account for the changing strain-rates in deep layers. Reference Dansgaard and JohnsenDansgaard and Johnsen (1969) assumed a complex behaviour of the horizontal velocity as function of depth resulting in a more complex formula for the time scale. However, values obtained from Equation (1) are good approximations if applied to the upper core section only (depth ≤ 0.5 H, Reference HammerHammer and others, 1978). At the location of the 1977 core drilling a determination of the absolute ice thickness H has been performed by F. Thyssen and W. Blindow (private communication in 1979) using the electromagnetic reflection technique and resulting in values of about 90 m. This corresponds to about 70 m w.e.
Combining the time law of equation (1) with the radioactive decay of 210Pb, where the activity as function of depth is governed by the exponential expression
where A is the 210Pb activity, A 0 the 210Pb surface activity, and λ the decay constant of 210Pb = 3.11 × 10⁻² year−1 leads to

with

The variables in Equation (3) are now reduced to the surface firn activity A 0 and the annual accumulation rate a. In Figure 6 the experimental data of the 1977 core (Fig. 5b) are fitted to Equation (3) assuming H = 70 m w.e. This fit is better than with the simple exponential decay curve of Figure 5b. The corrected values for the surface firn activity and the accumulation rate amount to (3.8 ± 0.1) dpm kg−1 and (39 ± 2) cm year−1, respectively. The errors given represent the range covered by varying the absolute ice thickness H between 60 and 80 m w.e. This analysis indicates that thin-out effects play an increasing role at Colle Gnifetti at ice depths below 20 m w.e. In Table IV 210Pb data obtained with both methods are compared. For the only well-known time markers in the 1977 core (1958/59, 1962/63 nuclear weapon tests. 1936/37 and probably 1901 Sahara dust layers) the 210Pb ages are in better agreement if a thin-out effect is assumed. For extrapolation purposes the 210Pb dating has been extended beyond the yet analysed core section at 27.3 m w.e. For these deeper samples the concept of constant net accumulation becomes increasingly unrealistic. In 1977 the core was drilled down to 65 m or 48 m w.e., thus reaching probably back into the second half of the eighteenth century, i.e. covering more than 200 years (Table IV). This age of the lowest samples is considerably higher than the value of 140 years estimated earlier (Reference OeschgerOeschger and others, [1978]) for the same core. The lowest part of this core (41 to 65 m) is not yet analysed for two reasons: (i) drilling below 45 m became more and more difficult; the core partly broke into small chips leading to considerable losses and, furthermore, preventing it being cut into sections parallel to the drilling axis, and (ii) due to the low activity of 210Po which is of the order of 0.14 dpm kg−1 in the lowest measured samples (Table II), a continuation would only be worthwhile if considerably more material could be used. This would imply a modification in the chemical procedure, because a quantitative electrodeposition of 210Po on small silver disks is questionable for samples ≫ 200 g.

Fig. 6. The data of Fig. 5b but fitted according to Equation (3). (Thin-out effect).
Table IV. 210Pb-dating of the colle Gnifetti Core 1977

Table IV also contains thin-out values deduced from Equation (3) for annual accumulation layers at certain depths. It indicates that the thin-out effect seemingly reduces the accumulation rates at the lowest part of this core to about 30% of their original amount. In the last column the calculated averaged residual accumulation rates are tabulated.
However, more 210Pb data or results from other dating methods (e.g. 39Ar) are needed in order to confirm the applicability of a simple flow model as proposed by Reference HaefeliHaefeli (1961) and adapted to the 210Pb method in the present work.
4.3. Fluctuations in the 210Pb activity
As shown in Figures 4a and 5a large fluctuations exist in the 210Pb activity between adjacent core samples. The fluctuations almost disappear for 2 m w.e. core sections covering about five to six years. For the core of 1976 the amplitudes of the fluctuations are more pronounced. It is difficult to elucidate possible reasons for the observed structures. The data of both cores give at least evidence for two coinciding peaks: the maximum activities within the core of 1976 at about 9 and 14 m w.e. seem to correspond to similar higher values in the core of 1977 at about 11 and 15.5 m w.e. These peaks fall within the time periods 1945–50 and 1930–35, respectively. A series of very hot summers for the years 1945–50 (Reference SchüeppSchüepp, 1961) may possibly explain the first peaks by an increased release of Rn from the Earth’s crust. Such an assignment does not hold for the second maximum at about 1930–35. Here one might argue that the Sahara dust layer (Reference HaeberliHaeberli, [1978]) of 1936/37 found close to this peak (Table III) could have produced this local structure. However, gramme amounts of Sahara dust would be needed to produce the observed excess of 210Pb. This is far above the measured milligramme amounts of solid material found in kilogramme firn samples (Reference Wagenbach and SchottererWagenbach and Schotterer, in press). Possibly the observed structures. (c. 5–10 years) are caused by long-time fluctuations of air masses as between maritime and continental origin. 210Pb determinations in rainwater over the oceans showed that the mean activity is about 1 dpm 1−1 which corresponds to about one-fifth of that in rain over land (Reference TsunogaiTsunogai, 1975). Therefore, periods with preferentially maritime climate should lead to lower mean 210Pb deposition rates compared to periods which are mainly influenced by continental climate. If so. 210Pb measurements might be a useful indicator for long-time variations of air masses. However, many other parameters may cause the observed peaks. Unfortunately not enough experience exists concerning the behaviour of 210Pb in the environment.
The detailed measurements on subsections for one sample also clearly exhibit local structures: In sample No. 5 from the core of 1976 (Table I) two peaks and one minimum are observed. The length covered by sample No. 5 is 69 cm w.e., i.e. about two years. Thus the observed fluctuations for the subcores may be attributed to seasonal variations. Such a behaviour is in agreement with observed seasonal fluctuations of the 210Pb content in air (Reference HuberHuber, 1974, p. 18; Reference GäggelerGäggeler and others, 1976). From the 210 Pb measurements performed so far it can be concluded that more detailed data are needed in order to understand the observed structures ranging from seasonal variations (samples 5a to 5f of Table I) to fluctuations covering several years.
Summary
210Pb dating has been performed on two ice cores from a glacier near Colle Gnifetti. They were drilled at an altitude of 4 450 m in July 1976 and August 1977 down to depths of 32 m and 65 m respectively. The investigated samples, each typically 70 to 100 cm in length and 100 to 250 g in weight, have been worked up for 210Po which was assayed by α-spectroscopy. Even though the 210Po (indicating 210Pb) activities exhibit large fluctuations from sample to sample a decay with depth is observed (Figs 4 and 5). The surface activity obtained is about 4 dpm kg−1 which is in agreement with data from other Alpine glaciers. The mean accumulation rates deduced from an exponential fit of the data are (37 ± 3) cm year−1 and (32 ± 2) cm year−1 w.e. for the first and second core, respectively. If thin-out effects for the second core are taken into account, a net annual accumulation rate of (39 ± 2) cm is obtained (Fig. 6). These values between 30 to 40 cm year−1 from the 210Pb analyses are compatible with accumulation rates based on nuclear weapon horizons (tritium, 90Sr/137Cs) and ice or Sahara dust layers found by visual stratigraphy (Table III).
This work proves for the first time that the 210Pb method is a useful tool for dating cold high-altitude alpine glaciers. However, more measurements of 210Pb in the environment are needed to understand local fluctuations for small core sections corresponding to about five years.
Acknowledgement
Part of the work was supported by the Swiss National Science Foundation.


