


Introduction
Sea ice alters the exchanges of energy, momentum and gas between the atmosphere and the ocean (Reference Worby, Jeffries, Weeks, Morris and JañaWorby and others, 1996). As such, it has an appreciable effect on local meteorology and, over longer time-scales and large spatial scales, on climate. It also has significant océanographie influence due to the release of relatively dense brine during freezing and low-salinity water as the sea ice melts, and this, together with its capacity to inhibit light and carbon-dioxide exchange, means that sea ice has a pronounced biological influence (Reference Carter, Bradford-Williams, C. Howard-Williams and StantonCarter and others, 1997). Especially for the Southern Ocean, where the sea ice occupies some 20 x 106 km2 at maximum extent (September-October) but only 3 x 10⁶ km2 in February, the extreme variability is responsible for many attributes of Southern Hemisphere climate, for features relating to ocean structure and for biological community distribution in time and space. When present, sea ice is described by its type, by its thickness and roughness, by the amount of sea surface occupied by ice, namely, concentration, and by the distribution of ice-floe sizes. The cumulative effect of these details has wide significance.
The intense ocean-wave fields associated with the Southern Ocean penetrate deep into the sea-ice marginal ice zone (MIZ), causing changes in the concentration, the lloe-size distribution and, particularly near the ice edge, the distribution of thicknesses (Squire and others, 1995). Concentration, besides reacting quickly to changes in currents and wind, is altered by the lateral pressure that waves exert on floes, which leads to differential drift and causes them to aggregate into belts of similar-sized floes or bands. Floe-size distribution is under the direct control of waves. in this case, the waves break up floes that are too big, causing a gradual conversion from one floe-size distribution to another thai depends on the relationship between floe size and the dominant wavelengths of the incoming swell, and on wave height. While wave-induced changes to ice thickness are more esoteric, they can and do occur. Here the process is one of rafting and ridge-building, which is common near the ice edge, and of the piling-up of frazil ice during freezing periods at the beginning of the pancake-ice cycle as reported by Reference Wadhams, Lange and AckleyWadhams and others (1987). Notwithstanding the importance of atmospheric and oceanic forcing, by these agencies ocean waves exert a material influence on pack ice that has been overlooked in most MIZ studies to date.
With regard to the propagation of ocean waves through fields of sea ice, Reference Meylan and SquireMeylan and Squire (1993, Reference Meylan and Squire1996) have devised an accurate model for the response of a single floe moving under the action of waves that allows the floe to bend and, under sufficiently high seas, to break. For a land-fast ice sheet or vast floes, Fox and Squire (1990, 1991, 1994) have shown that it is necessary to include the complete set of wave modes in the open-water region and beneath the sea ice if the reflection and transmission of ocean waves at the boundary is to be understood and modelled accurately. By including viscosity, Squire (1993) found that, although also weakly affected by wave period, the position of the maximum strain experienced by the ice sheet is strongly dependent on the ice thickness, being more distant from the ice edge in the case of thicker sea ice. A hypothetical wave-induced breakup is described, where in the ultimate destruction of a sheet of sea ice proceeds by the systematic formation of fractures at a prescribed separation dictated mainly by sea-ice thick-ness. As each crack opens, a new ice edge is formed and the remaining ice sheet is subjected to the same wave-forcing. Thus the entire ice sheet breaks into floes of similar size. It is possible that the photograph in Figure 1 has captured this process taking place in nature.
Because of its importance to the form of the MIZ and through this to climate, ocean structure and biology, we focus in this paper on the way in which ocean waves fracture sea ice. in particular, we consider flow large floes and land-fast ice are broken up, the latter providing a supply of floes for the MIZ. Notable in the present study is the inclusion of field data concerned with flow sea ice fatigues when it is cyclically stressed. The effect is to cause the ice to fracture and break up at stresses well below its flexural strength when it is subjected to the repeated bending associated with waves. The break-up phenomenon is consequently quite different from that when fatigue is not included, as in the study of Reference Crocker and WadhamsCrocker and Wadhams (1989). When the stresses induced by the waves are less than the endurance limit, which is found to be about 60% of the flexural strength of the sea ice, no failure will occur. But when the induced stresses are above this value, then the fast ice or floe will always fail if the number of flexural cycles induced by the passing sea and swell is large enough. As the stresses induced become greater, the requisite number of cycles becomes less.

Fig. 1. The break-up of sea ice photographed at Cape Rqyds, Antarctica, in 1995. Photograph by kind permission of Antarctica New Zealand.
Experimental Measurements
The fatigue and wave experiments were carried out on the first-year, land-fast ice of McMurdo Sound, Antarctica, during the austral springs of 1992,1994 and 1996. Additional wave experiments were performed in 1995. Unfortunately, it was not practical to carry out fatigue and wave experiments simultaneously. The fatigue measurements took place on the colder, thicker sea ice of early spring, while wave measurements were carried out in late spring when the sea ice in the Sound might be expected to break out. Practical considerations also dictated the difference in locations of the experiments, the fatigue experiments being carried out an average of 30 km from the ambient ice edge, while wave monitoring occurred in the vicinity of this edge. tables 1 and 2 compare the sea-ice properties and locations associated with the two experimental datasets.
Fatigue behaviour
When subjected to repeated bending, many materials fail at stresses well below the flexural strength that is associated with the monotonic increase in stress to failure. Such processes are termed fatigue. The fatigue behaviour of the sea ice was investigated by subjecting in situ cantilever beams to repeated bending with zero mean stress (Haskell and others, 1996). The beams were nominally 10 m long by 1 m wide, the ice thickness being approximately 2 m. One end of the beam was driven by a force actuator with a period of 8s, this being a prevalent wave period in the McMurdo Sound region. The stress of major interest here is the bending stress occurring across the fixed end of the beam. This stress has been calculated assuming a homogeneous beam with the neutral plane located midway through the sea-ice thickness, since allowing for the vertical displacement of this plane because of the vertical distribution of sea-ice properties gives a change of, at most, 6% in the normalised surface stress.
The results of a fatigue test are frequently summarised by plotting the applied stress amplitude vs the number of cycles required to fail the sample al that stress amplitude. This relationship is called the S-N curve. The S-N data for 1992,1994 and 1996 fast-ice data are shown in Figure 2, where the stress amplitude, σ₀ has been normalized by the flexural strength, σF of the sea ice. The solid curve is a power-law fit to the data of the form
where Ν is the number of cycles to failure, and A0 and n are constants. in some materials a stress exists below which the material will maintain its integrity even if subjected to an infinite number of load cycles. This stress is termed the endurance limit. For the present data the endurance limit is approximately 60% of the flexural strength.
Sea-ice properties
Average properties of the sea-ice sheet are shown in Table 1. The procedures used to determine the physical properties of the sea ice during the fatigue experiments have been described previously, for example in Langhorne and Haskell (1996). Salinity and density measurements have also been measured close to the location of the wave experiments at the ice edge. An estimate of the temperature conditions
Table 1. Summary of average ice properties during fatigue experiments

Table 2. Probable ice-edge characteristics at time rif break-up

during break-up therefore allows us to estimate an appropriate brine fraction for the ice-edge conditions during breakup. Expressions exist in the literature which then relate the sea ice sheet brine fraction to flexural strength (Reference Timco and O'BrienTimco and O'Brien, 1994) and partially relaxed modulus (Reference SinhaSinha, 1978; Reference Cox and WeeksCox and Weeks, 1988). As we shall demonstrate in the next section, it is the ratio of the flexural strength, σF, to the partially relaxed modulus, E, which is of interest here. This ratio is the following function of brine fraction,![]()

where A, B and C are constants.
In the case of the fatigue data, the flexural strength and elastic modulus quoted in Table 1 for each year are the averages of a number of measured values from in situ cantilever-beam experiments. However, although the moduli agree with values predicted from brine volume (following Sinha (1978) and Cox and Weeks (1988) as described in Langhorne and Haskell, 1996), the flexural strengths are lower than the values predicted from the measured average brine volumes using the compilation of data due to Timco and O'Brien (1994). Timco and O'Brien's correlation is therefore scaled to fit our measured values, and this scaled correlation used to estimate the unknown flexural strength al the ice edge.
Modelling
In the subsequent text the following values are used for the various parameters: Ε = 6 G Pa; Poissons ratio of sea ice = 0.3; water depth = deep; ice thickness = lm; density of sea water = 1025 kgm−3; and density of ice = 922.5 kg m −3.
The monochromatic wave
To investigate the effect of ice fatigue, wc lirst propagate a monochromatic ocean wave of 8 s period into a sheet of 1 m thick fast ice. Mathematical detail can be found in Fox and Squire (1991), but for completeness we briefly describe qualitatively flow this problem is solved here. It is assumed that open water occupies the negative half-plane ![]() where H is the water depth, and the sea-ice plate, modelled as a floating, semi-infinite, thin, perfectly elastic sheet, occupies the surface of the positive half-plane
where H is the water depth, and the sea-ice plate, modelled as a floating, semi-infinite, thin, perfectly elastic sheet, occupies the surface of the positive half-plane ![]() The water is assumed to be invis-cid. A train of surface waves enters the ice edge al x = 0 from x = —∞, where it is partially reflected and partially transmitted. The problem reduces to matching velocity potentials across x = 0 where certain boundary conditions must be satisfied, but this is not trivial as the dispersion relation on either side of x = 0 has imaginary roots corresponding to evanescent waves, as well as real roots that correspond to the propagating wave. A pair of complex conjugate roois also furnishes two damped propagating waves when x > 0. The matching proceeds by framing the problem variationally, allowing an error term to be minimised by the conjugate gradient method. This proves to be very efficient and makes the problem solvable for a variety of physically meaningful situations.
The water is assumed to be invis-cid. A train of surface waves enters the ice edge al x = 0 from x = —∞, where it is partially reflected and partially transmitted. The problem reduces to matching velocity potentials across x = 0 where certain boundary conditions must be satisfied, but this is not trivial as the dispersion relation on either side of x = 0 has imaginary roots corresponding to evanescent waves, as well as real roots that correspond to the propagating wave. A pair of complex conjugate roois also furnishes two damped propagating waves when x > 0. The matching proceeds by framing the problem variationally, allowing an error term to be minimised by the conjugate gradient method. This proves to be very efficient and makes the problem solvable for a variety of physically meaningful situations.
The presence of the evanescent waves causes the normalised strain induced by the monochromatic wave to increase from zero at the ice edge, which is a consequence of the boundary conditions at x = 0, to a maximum of 6.8 x 10⁻⁴ at a penetration of 55 m. Because the problem formulated is linear, this value of strain will be decreased in proportion when a wave amplitude other than 1 rn is used.
To assess the effect of these wave-induced strains on the sea-ice sheet, we must convert the S-N diagram to one showing the dependence of the number of cycles to failure on strain amplitude. With the assumption that the shape of the S-N curve in Equation ![]() is invariant to a change in brine fraction, then the strain amplitude, ϵ₀, experienced by the sea ice is
is invariant to a change in brine fraction, then the strain amplitude, ϵ₀, experienced by the sea ice is
Inserting the dependence of σF/Ε on brine fraction from Equation (2), we may predict the number of cycles to failure for a fixed strain amplitude in the sea-ice sheet. Estimates are given in figure 3a at two brine fractions. These strains may then be related to the open-water wave amplitude at the ice edge, giving us a prediction of the length of time an ice sheet will maintain its integrity in the presence of waves of a particular amplitude (see fig. 3b). The strain maximum and the location of fracture is 55 m from the ice edge for these conditions.
The wave packet
The sea is rarely, if ever, composed of waves ofa single frequency, and a considerable amount of experimental work has been done to establish an empirical form for open-ocean-wave power spectra under fetch- or duration-limited conditions (Reference PhillipsPhillips, 1977). A typical time series of ocean-wave data is amplitude-modulated, i.e. it is composed of a succession of packets of wave energy caused by the beating together of waves that are close in frequency. in terms of the distribution of energy density between frequencies, the Pierson-Moskowitz spectrum is often used. Information about phase is more problematical, however, as the relative phases between the frequencies that are present are not generally random.
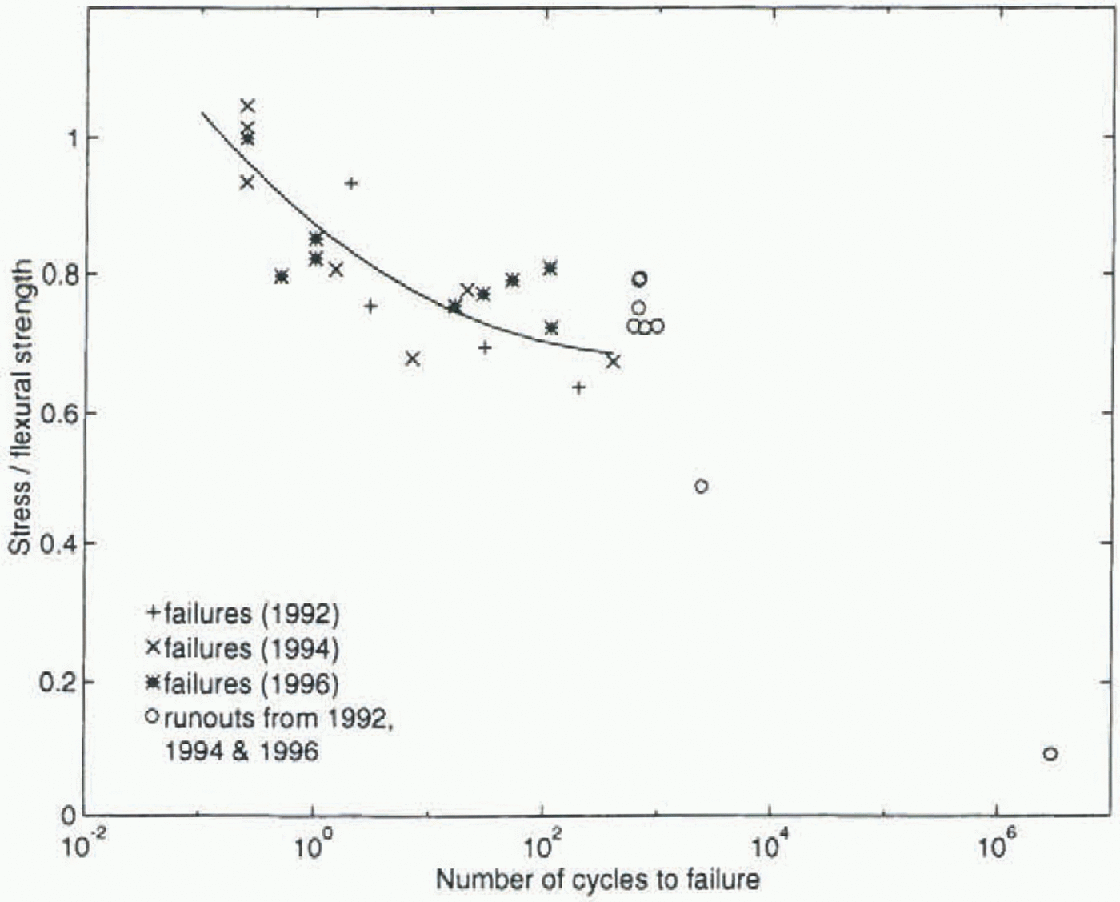
Fig. 2. Normalised S-N data for 1992, 1994 and 1996 field seasons. Stress amplitude has been normalised by fexural strength. The circles represent runouts, i.e. experiments during which the ice did not fail. The runout at 3 x 10⁶ cycles acknowledges the 6 month survival of a sea-ice sheet while subjected to ocean-wave amplitudes of the order of 50 kPa.

Fig. 3.
(a) Strain amplitude vs number of cycles to failure. Data scaled assuming a brinefraction of 0.05 are shown by a circle and fitted with a solid line. Data scaled assuming a brine fraction of O.1 are shown by a plus sign andfitted with a dashed line, (b) Open-water wave amplitude at the ice edge vs the time required to fail the ice sheet due to fatiguing br monochromatic waves of 8 s period. The curves are based on the strains calculated with in the sea-ice sheet with Ε = 6GPa; Poissons ratio = 0.3; water depth = deep; ice thickness = 1 m; density of sea water = 1025 kg m−3; density of ice = 922.5 kg m−3. These conditions produce a strain maximum at 55 m from the ice edge. The solid curve is appropriate to a brine fraction of 0.05, the dashed curve to a brine fraction of 0.1, and the dashed-dotted curve to Ε = 6GPa; and ![]() .
.
To simulate a more realistic sea entering a sheet of land-fast sea ice, a single wave packet has been constructed based on a Gaussian approximation to the Pierson Moskowitz spectrum, with peak period at 8 s and a rool-mean-square wave amplitude of 0.1 m. The goal is to generalise the work on monochromatic forcing done earlier to examine the effect of individual wave packets on a pristine ice sheet. The basis for this approximation is that the appearance of the sea surface is mostly dependent on energy near the peak in the wave spectrum and this is reproduced quite well by the Gaussian form. A quadratic expression has been used to define phase, aiming to reproduce the appearance of pack-els in the example of ice-coupled wave data illustrated in Figure I. Because the packet will disperse, the respective phases will change in space as the wave progresses across the surface of the open water into the sea ice, and will change differently with in the sea ice where it disperses differently. The modulation is clear in the time scries shown in Figure 4, which was collected using a strain gauge located on the ice surface 100 m back from an abrupt change in thickness in the McMurdo Sound ice sheet, that had earlier corresponded to the ice edge. Subsequently, weaker sea ice had formed seaward of this transition, but it had cracked along the transition again prior to the experiment.
The progress of a single wave packet of character similar to those of Figure 4 is shown in figure 5a d at 10, 20, 50 and 100 m from the ice edge, using a procedure identical to that for the monochromatic wave and invoking the superposition arguments of linearity. On entry to the ice, the strains are very small because the bending moment is zero at the ice edge. The wav e packet then increases in size until it reaches a maximum, whereupon the component waves within it will continue to disperse, causing a gradual broadening of its shape. The amplitudes of the component waves will gradually decay with penetration due to hysteresis in the ice, though this is not modelled here as we are interested only in effects local to the ice edge.
Let us consider the response of the sea ice to the wave packet at a penetration of 50 m, where the strains are approximately maximum. Consideration of the form of the normalised fatigue curve, ![]() suggests that if the peak strain at the centre of the packet is greater than 87% of the failure strain during rapid monotonie loading, then the ice will fracture when the packet maximum penetrates 50 m. If this peak strain is slightly less than 87%, then the sea ice will no longer fail as the peak of the wave packet passes through, but, because of material changes made to the ice sheet by the previous cycles, the ice will fail on the subsequent cycle of lower amplitude. A consequence of this demonstration is that, because of fatigue damage, it is not necessarily the case that an ice sheet which has survived the passing of a peak in stress will continue to maintain its integrity when subjected to smaller strains.
suggests that if the peak strain at the centre of the packet is greater than 87% of the failure strain during rapid monotonie loading, then the ice will fracture when the packet maximum penetrates 50 m. If this peak strain is slightly less than 87%, then the sea ice will no longer fail as the peak of the wave packet passes through, but, because of material changes made to the ice sheet by the previous cycles, the ice will fail on the subsequent cycle of lower amplitude. A consequence of this demonstration is that, because of fatigue damage, it is not necessarily the case that an ice sheet which has survived the passing of a peak in stress will continue to maintain its integrity when subjected to smaller strains.
It is important to point out deficiencies in the analysis used in this paper. The Erst and most serious approximation is the extrapolation of an elastic model to stresses and strains close to those required for fracture, where the sea-ice behaviour will not be elastiC. Accordingly, the predictions should be used in the spirit in which they are proposed: as a prefatory foray to modelling a very complex phenomenon. Second, because of the considerable effort needed to prevent the cantilever beams from refrcezing into the ice sheet, the fatigue investigation is limited to low cycle fatigue (10 cycles and less). It would be advantageous to confirm the deduced endurance limit by performing in situ fatigue experiments over a greater number of cycles.

Fig. 4. Typical wave data recorded in November 1996 on in thick sea ice near the ice edge in McMurdo Sound. Antarctica.

Fig. 5. Strain response of a lm thick land fast ice sheet to a Gaussian approximation of the Pierson Moskowitz spectrum with peak period at 8s and a root-mean-square wave amplitude of 0.1 m. Strain shown at (a) 10 m, (b) 20 m, (c) 50 m and (d) 100 m from the ice edge.
Conclusions
In this paper we have considered the most important factors involved in the wave-induced break-up of sea ice. Using recent fatigue and wave data, we propose a simple model to assess 1 he response of the sea-ice edge to both a monochromatic wave and a wave packet entering the sheet. We estimate conditions under which a land-fast ice sheet will succumb to the rigours of wave forcing and will fracture into an array of regularly-shaped ice floes. The principal result of our study is that, on account of the progressive nature of fatigue damage, a sea-ice sheet thai endures the severity of the peak strain in a wave group will not necessarily maintain its integrity when stressed by lesser, succeeding strains. Taken at face value, this suggests that predicting whether sea ice will break up under the action of ocean waves of a prescribed height will be difficult, as the fatigue history of the sheet must be accommodated.
Acknowledgements
The authors are grateful for the support of the New Zealand Foundation for Research, Science and Technology, the Universities of Otago and Auckland and the New Zealand Institute of Industrial Research and Development. The work could not have gone ahead without the professionalism of Antarctica New Zealand.


