

The improvements in healthcare system with the developments in innovation will decrease mortality rates in a country and promote to reach a long living population level with a higher LEB and healthy labour force enhancing productivity and economic growth in a country not in short term but in a time period. Economic growth not only increases income but also promotes technological investments in healthcare system as well.
Since the capital is a scarce input in developing countries labour force is the first and main determinant of the economic development especially in low- and middle-income countries. At the first stages of industrialization labour force is the key determinant of economic growth at the initial level of development for emerging countries. An improvement in health status of labour force increases the productivity resulting in an economic growth and enhancing IPC in a country.
The development of preventive and therapeutic methods against diseases will not only increase the citizens’ LEB but the productivity of labour force in the country as well. Healthy labour force will cause increase in gross national income and IPC. IPC growth will also affect a healthy LEB positively. This positive feedback will last as the IPC increases continuously.
The relationship between LEB and IPC and vice versa of 56 developing countries was tested within the study empirically. A literature review of the subject summarizing some important previous studies theoretically and empirically was also conducted at the beginning of the study. The relationship between LEB on IPC was investigated by Cross Section and Panel Data Models using data gathered from the World Bank, Sesric (Organisation of Islamic Countries, Statistical, Economic and Social Research and Training Centre for Islamic Countries, UNDP (United Nations Development Programme) and IMF (International Monetary Fund).
In this study, totally 56 developing countries have been investigated by cross section and panel data analyses. The relationship between LEB and IPC for 56 developing countries has been tested with both Cross-sectional Data Method for the year 2015 and Panel Data Method for 26 periods starting from 1990 ending 2015. By giving priority to healthcare of the population productivity should be increased via getting a better health care and having long life and feeling well-being.
Granger causality test is also applied to test the direction of causality between LEB and IPC.
The Human Development Report which is regularly published annually by the United Nations, seems to have put people at the centre of the development. In the Human Development Indices and Indicators Report,1 countries were divided into four groups as the very high human development (59 countries according to the report), the high human development (53 countries according to the report), the medium human development (39 countries according to the report) and the low human development (38 countries according to the report). In the Human Development Report 20162 the number of the countries which have got very high human development were 51 whereas it was 49 in the Human Development Report 2015.3 It seems there is an improvement in human development from 2015 to 2018. In the Human Development Reports, the countries are classified with the help of the human development index consisting of 3 sub-indices. The life expectancy sub-index that is defined as a dimension of long and healthy life where the LEB is an indicator of the sub-index. The education sub-index which tells knowledge dimension is another sub-index defined as a combination of mean years of schooling and expected years of schooling indicators. Gross National Income (GNI) in purchasing power parity which simply means decent standard of living is forming the third sub-index.
Table 1 consists of the basic studies investigating and analysing the relationship between LEB and IPC. It is generated by the authors.
METHODS
Analysis of the relationship between LEB and IPC
Country and data selection
In the study panel data observation with the random and fixed effects models with 26 time periods between 1990 and 2015 and cross section data observation for the year 2015 of 56 developing countries were applied. The 56 developing countries are members of the OIC. The LEB data was collected from the World Bank and UNDP whereas IPC from the World Bank, Sesric and IMF.
An improvement in health status of citizens increases economic growth rate resulting with a boost in IPC and enhancing productivity in a country. Higher IPC means better access to health services those are provided by public or private sectors. Good health service which lowers mortality rates promote a country to reach a long living population with a higher LEB and healthy labour force.
Following the existing literature on the relationship between IPC and LEB, the estimated models in the study can be described as follows:
ln(Yit) = f (Xit), ln: natural logarithm, Yit: IPC, Xit: LEB
ln(Yit) = f (Xit), ln: natural logarithm, Yit: LEB, Xit: IPC
ln(Yit) = α+β×Xit+ υt, i= 1,2,3 … 56 (countries), t = 2015 for cross-section data, Yit: IPC or LEB, Xit: LEB or IPC
ln(Yit) = α+β×Xit+ υt, i= 1,2,3 … 56 (countries), t = 1990-2015 (26 periods) for panel data, Yit: IPC or LEB, Xit: LEB or IPC
IPC as an indicator of economic growth and LEB as an indicator of long and healthy life were used in the study. For the variables, natural logarithms of the values are used.
For panel data analysis 26 periods starting from 1990 and ending 2015 and for cross-section data analysis 2015 year were studied for 56 developing countries. α is the constant coefficient (intercept) and β is the regression coefficient (independent variable coefficient/ slope). υt is the disturbance (error) term that represents the changes in IPC or LEB (increase / decrease) is not defined by LEB or IPC at time t. υt is a random variable with well-defined probability properties and is υt ∼Normally and Independently Distributed (NID) (0, σ2) where υt has zero (0) mean and common variance (σ2) for all countries according to the Classical Normal Linear Regression and is normally and independently distributed according to time and countries.14
RESULTS
The development of IPC during the period 1990-2015
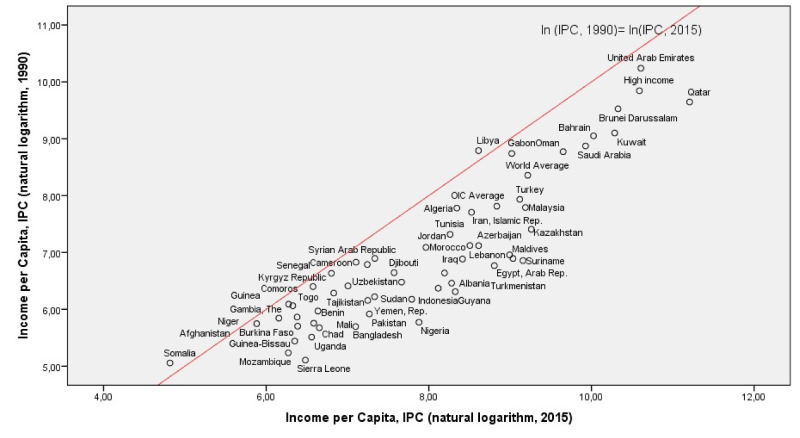
Considering the development of IPC during the period 1995-2015 in the study, Qatar is the country which has got the highest IPC among 56 developing countries in 2015 (Figure 1). United Arab Emirates, Brunei Darussalam, Kuwait and Bahrain are the followers of Qatar in this indicator. Guinea, Mozambique, Gambia, Niger and Somalia are the countries who have lowest IPC. With a nearly US$ 9.126 IPC which is more than 56 developing countries average amount of US$ 6.871 but less than world average amount of US$ 10.058, Turkey is ranked as 11th country with high IPC in 2015. In the figure the upward line tells that IPC doesn’t change from 1990 to 2015 and the countries below the line mean that the countries has got a progress in IPC where the countries upper the line mean a recession in IPC. It seems Suriname has got the best performance in increasing the IPC during the period 1990-2015 where Somalia has got the worst performance with a decrease in IPC.
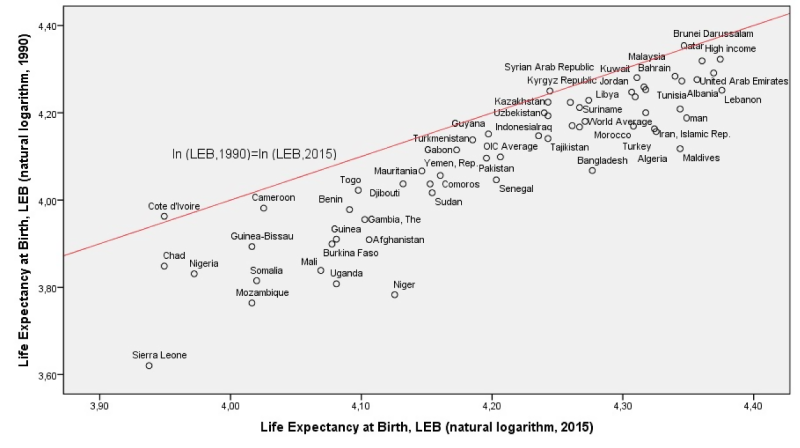
The development of LEB during the period 1990-2015
For the period 1990-2015 only Cote d’Ivoire and Syria have a negative change rate in LEB among 56 developing countries. It can be obviously said that Turkey has ranked 13th best performance in this indicator. Niger has got a nearly 40.8% of change rate for the period 1990-2015 ranking top where Turkey has got a 17.5% change rate in LEB. For the same period, Côte d’Ivoire has been the lowest change rate in LEB with a 1.3% decreasing rate. The world average is 9.5% growth and 56 developing countries’ average is 11.4% in the same period. Turkey has got a tremendous increasing LEB performance after 1990 (Table 2).
In the Figure 2 below considering LEB development during the period 1990-2015, Lebanon has got the highest LEB among 56 developing countries in 2015. Brunei Darussalam, Qatar, Albania and United Arab Emirates are the followers of Lebanon in this indicator. Cot’ d’Ivoire and Sierra Leone are the countries who have lowest LEB among 56 developing countries where Turkey has ranked as 10th country with 75.2 years LEB. In the figure the upward line tells that LEB doesn’t change from 1990 to 2015 and the countries below the line mean that the countries has got a progress in LEB where the countries upper the line mean a recession in LEB. It seems Niger has got the best performance in increasing the LEB during the period 1990-2015 where Cote d’Ivoire has got the worst performance with a lower increase in LEB performance.

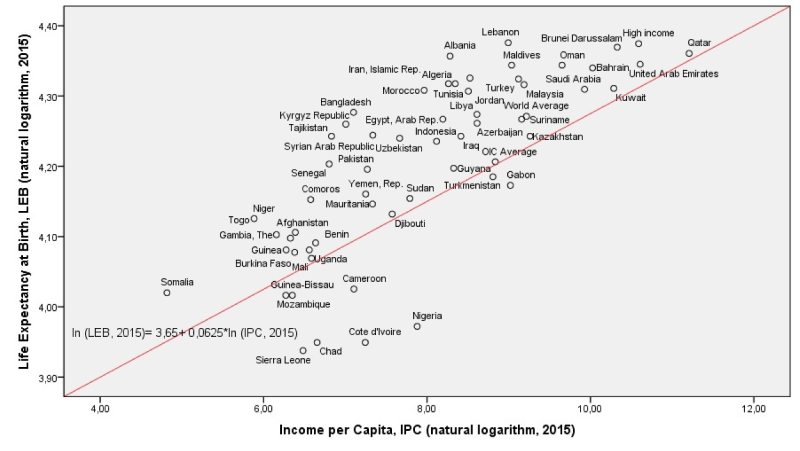
The relationship between LEB and IPC with Cross-section Data Method for 2015
The Figure 3 which was estimated by SPSS software (IBM, Armonk, NY, USA) below shows the relationship between natural logarithm values of LEB and IPC for the year 2015. The positive relationship can be seen obviously between two variables with the line equation. The countries on the equation line indicates the countries where the natural logarithm values of LEB and IPC are equal. The equation tells us one unit increase in natural logarithm of IPC causes approximately 6.25% increase in natural logarithm of LEB which means nearly 4.09 years increase in LEB in 56 OIC’s average.

In 2015, Lebanon is the leader country where Brunei Darussalam and Qatar are the following countries in LEB where Qatar is the leader in the IPC, United Arab Emirates as the second and Brunei Darussalam is the third country where Somalia seems as the country which has the lowest IPC in 56 developing countries.
If the relationship between natural logarithm values of LEB and IPC in Figure 3 is wanted to be expressed as a regression for 56 developing countries, the following equation is obtained. The relationship between the natural logarithm values of LEB and IPC is estimated with the cross-section data by the EViews 9 software (QMS, Emeryville, California, United States) (Table 3). The equation tells us that one year increase in natural logarithm value of IPC causes approximately 7% increase in natural logarithm value of LEB which means nearly US$ 8.108 increase in IPC for 56 developing countries in average causes 4.51 years increase in LEB in 56 OIC’s average.
ln(LEB)2015 =3.66+0.07×ln(IPC)2015 ln: natural logarithm
Nearly 57.8% of the changes in LEB are expressed by IPC in the equation. The statistical values of the coefficients of the regression are statistically significant (P<0.05 and the absolute values of the coefficients t are outside the threshold values of the t distribution).
The relationship between LEB and IPC with Random Effects Model (REM, 1990-2015)
The following estimated equation tells the relationship between the natural logarithm values of LEB and IPC by REM regression with panel data.
ln (LEB)1995-2015 = 3.77+0.05×ln(IPC) 1995- 2015
One unit increase in IPC causes an increase of nearly 0.05 units in LEB of the 56 developing countries. It means that nearly 8.108 USD increase in IPC for 56 developing countries in average causes nearly 3.27 years increase in LEB in average. If the regression is wanted to be obtained by pooled ordinary least squares method it would be as; ln (LEB)1995-2015 = 3.55+0.08×ln (IPC)1995- 2015.
The relationship between the natural logarithm values of LEB and IPC in a REM regression with the panel data for the 56 developing countries by the EViews 9 software can be seen as below (Table 4).
The regression above shows that about 29% of the changes in the LEB is expressed by the IPC values of the 56 developing countries. When the statistical values of the coefficients of the regression are examined; IPC coefficient (slope) and the constant coefficient are statistically significant (P<0.05 and the absolute values of the coefficients’ t are outside the threshold values of the t distribution). Considering the relationship between the LEB and the IPC values of the 56 developing countries according to the regression results obtained in previous section by using the Cross-sectional Data Method is also confirmed by the regression results obtained using the Panel Data Method.
To test the validity of the REM which shows the relationship between LEB and IPC obtained with the EViews 9 software above with the Hausman Test:
H0: REM can be applied
H1: Fixed Effects Model (FEM) can be applied.
The following Hausman test (Table 5) also shows that null hypothesis indicating REM can be applied may be rejected, since with 1 df (degree of freedom) and X2 (chi-square) value is statistically significant.
Since the null hypothesis is rejected, the alternative one which tells us FEM can be applied for the relationship should be accepted. The regression estimated by FEM should be as below.
ln (LEB)1995-2015 = 3.78+0.0486×ln (IPC)1995- 2015
It means that nearly 8.108 USD increase in IPC for 56 developing countries in average causes nearly 3.16 years increase in LEB in average. The regression above shows that about 92.2% of the changes in the LEB is expressed by the IPC values of the 56 developing countries.
The relationship between IPC and LEB with Cross-section Data Method for 2015
The Figure 4 which was estimated by SPSS software (IBM, Armonk, New York, United States) below shows the relationship between natural logarithm values of IPC and LEB for the year 2015. The positive relationship can be seen obviously between two variables with the line equation. The countries on the equation line indicates the countries where the natural logarithm values of IPC and LEB are equal.
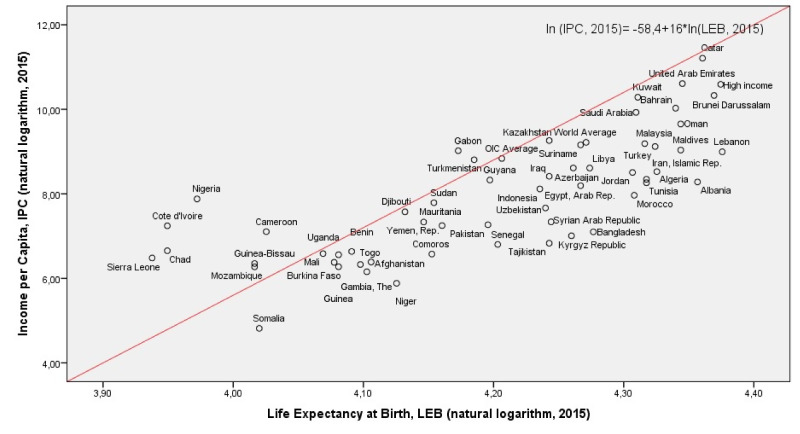
If the relationship between the natural logarithm values of IPC and LEB in Figure 4 is wanted to be expressed as a regression, the following equation is obtained. The relationship between the natural logarithm values of IPC and LEB is estimated with the cross-section data by the EViews 9 software (QMS, Emeryville, California, United States) (Table 6). The equation tells us that one year increase in natural logarithm value of LEB causes approximately 8.4% increase in natural logarithm value of IPC.
ln(IPC2015) =-27.44+8.41×ln(LEB)2015 ln: natural logarithm
In the equation, nearly 57.8% of the changes in IPC are expressed by LEB. The statistical values of the coefficients of the regression are statistically significant (p <0.05 and the absolute values of the coefficients t are outside the threshold values of the t distribution).
The relationship between IPC and LEB with Random Effects Model (REM, 1990-2015)
The following estimated equation tells the relationship between the natural logarithm values of IPC and LEB by REM regression with panel data. One unit increase in LEB causes an increase of nearly 5.78 units in IPC of the 56 developing countries.
ln (IPC)1995-2015 = -16.64+5.78×ln(LEB) 1995- 2015
The regression of the relationship between natural logarithm values of IPC and LEB values for the 56 developing countries obtained by the REM Panel Data covering the 26 years using the EViews 9 software can be seen as below (Table 7).
The regression above shows that about 29.5% of the changes in the IPC is expressed by the LEB values of the 56 developing countries. When the statistical values of the coefficients of the regression are examined; LEB (slope) and the constant coefficient are statistically significant (P <0.05 and the absolute values of the coefficients’ t are outside the threshold values of the t distribution). Considering the relationship between the IPC and LEB values of the 56 developing countries according to the regression results obtained in previous section by using the Cross-sectional Data Method is also confirmed by the regression results obtained using the Panel Data Method. If the regression is wanted to be obtained by Pooled Ordinary Least Squares Method it would be as; ln (IPC)1995-2015 = -21.3+6.91×ln(LEB)1995- 2015.
To test the validity of the REM, which shows the relationship between natural logarithm values of IPC and LEB obtained with the EViews 9 software above with the Hausman Test:
H0: REM can be applied,
H1: FEM can be applied.
The following Hausman test also shows that we cannot reject the null hypothesis indicating REM can be applied since with 1 df (degree of freedom) and X2 (chi-square) value is not statistically significant (Table 8).
If the null hypothesis is rejected, the alternative one which tells us FEM can be applied for the relationship should be accepted and the regression estimated by FEM should be as below.
ln (IPC)1995-2015 = -16.098+5.65×ln(LEB)1995- 2015
The regression above shows that about 89.4% of the changes in the IPC is expressed by the LEB values of the 56 developing countries.
Granger causality tests
The Granger Causality tests may be approved for both panel and cross-section data sets to show the direction of the causality between LEB and IPC and vice versa.
To test LEB causes IPC:
ln (IPC)it = αİ+ βİ ×ln(LEB)it +υit
H0: LEB does not Granger cause IPC
H1: LEB Granger causes IPC
To test IPC causes LEB:
ln (LEB)it = αİ+ βİ ×ln(IPC)it +ωit
H0: IPC does not Granger cause LEB
H1: IPC Granger causes LEB
i= 1,2,3 … 56, t=1990-2015 (26 periods) for panel data and t=2015 for cross-section data and the disturbances υit and ωit are uncorrelated.
According to the Table 9 results computed F values exceed the critical F value and P<0.05 level of significance so we reject both null hypotheses and accept that LEB Granger causes IPC and vice versa for panel data model.
According to the Table 10 results computed F values do not exceed the critical F value and P>0.05 level of significance so we are not able to reject both null hypotheses which imply that LEB Granger does not cause IPC and vice versa for cross-section model.
DISCUSSION
Analysis of the results of Cross Section Model estimation shows that the equation ln(LEB)2015 =3.66+0.07×ln(IPC)2015 ln: natural logarithm, tells us one percent increase in natural logarithm value of IPC causes approximately 7% increase in natural logarithm value of LEB which means nearly 8.108 USD increase in IPC for 56 developing countries in average causes 4.51 years increase in LEB in 56 OIC’s average. In the equation about 57.8% of the changes in LEB are expressed by IPC.
When the relationship between natural logarithm value of LEB and natural logarithm value of IPC is wanted to be expressed by REM regression the equation is, ln (LEB)1995-2015 = 3.77+0.05×ln(IPC) 1995- 2015 is estimated. It means that nearly 8.108 USD increase in IPC for 56 developing countries in average causes nearly 3.27 years increase in LEB in average.
Since the Hausman test results indicate that FEM is appropriate rather than REM, the equation should be as, ln (LEB)1995-2015 = 3.782+0.0486×ln(IPC) 1995- 2015.The regression of the relationship between natural logarithm values of LEB and IPC for the 56 developing countries obtained by the FEM panel data covering the 26 years obtained using the EViews 9 software (QMS, Emeryville, California, United States) shows that about 92.2% of the changes in the LEB of the 56 developing countries is expressed by IPC values of the countries. And the regression also means that nearly 8.108 USD increase in IPC for 56 developing countries in average causes nearly 3.16 years increases in LEB in average. Analysis of the results of Cross Section Model estimation shows that the equation ln(IPC)2015 =-27.44+8.41×ln(LEB)2015 ln: natural logarithm tells us one percent increase in natural logarithm value of LEB causes approximately 8.4% increase in natural logarithm value of IPC. In the equation about 57.8% of the changes in IPC are expressed by LEB.
When the relationship between natural logarithm value of IPC and natural logarithm value of LEB was expressed by random effects model (REM) regression the equation ln (IPC)1995-2015 = -16.64+5.78×ln(LEB) 1995- 2015 is estimated. In the equation about 29.5% of the changes in IPC are expressed by LEB. The Hausman test results indicate that REM is appropriate rather than FEM.
The results reveal that LEB has significantly positive effect on IPC of a country hence economic growth. Also, an increase in IPC enhances LEB. UNDP’S Human Development Index has also involved “The Life Expectancy Index” that is defined as a dimension of long and healthy life where LEB is an indicator of this sub-index. UN also puts the LEB in the centre of the human development with the gross national income. After testing the direction of causality between LEB and IPC of the countries in the study by the Granger causality test, it is seen that LEB Granger causes IPC for panel data. For cross-section data analysis there is no proved correlation between LEB and IPC.
Azomahoo et al.,4 Husain,10 Ecevit,11 Ngangue and Manfred8 have found positive relationship between LEB and economic growth and Cervellati and Sunde12 have found positive relationship between LEB and economic growth after demographic transition analysing many countries together in their studies. Erdoğan and Bozkurt13, Akintunde et al.6 and Mahyar7, have found positive relationship between LEB and economic growth analysing a single country in their studies.
On the other hand, Acemoğlu and Johnson5 have found no relationship between LEB and economic growth analysing many countries together whereas Bowser9 has found no relationship between LEB and economic growth analysing a single country in their studies.
The improvements in healthcare system with the developments in innovation will decrease mortality rates in a country and promote to reach a long living population level with a higher LEB and healthy labour force enhancing productivity and economic growth in a country. This development occurs not at once but in time period as in the study our results show that economic growth Granger causes LEB increase only for panel data not for cross-section data. The data for LEB and IPC could not be retrieved easily. We used different international data sources to obtain the data for 56 developing countries analysed in the study.
C – constant, LN_IPC – natural logarithm of IPC; LN_LEB – natural logarithm of LEB, LEB – life expectancy at birth, IPC – economic growth, S.E. – standard error, S.D. – standard deviation, R-squared – statistical measure that represents the proportion of the variance for a dependent variable that’s explained by an independent variable, F-statistic – the test statistic for testing the statistical significance of the model
C – constant, EGLS – Estimated Generalized Least Squares, LN_IPC – natural logarithm of IPC, LN_LEB – natural logarithm of LEB, LEB – life expectancy at birth, IPC – economic growth, S.E. – standard error, S.D. – standard deviation, R-squared – statistical measure that represents the proportion of the variance for a dependent variable that’s explained by an independent variable, F-statistic – the test statistic for testing the statistical significance of the model
C – constant, EGLS – Estimated Generalized Least Squares, LN_IPC – natural logarithm of IPC, LN_LEB – natural logarithm of LEB, LEB – life expectancy at birth, IPC – economic growth, S.E. – standard error, S.D. – standard deviation, R-squared – statistical measure that represents the proportion of the variance for a dependent variable that’s explained by an independent variable, F-statistic – the test statistic for testing the statistical significance of the model
C – constant, EGLS – Estimated Generalized Least Squares, LN_IPC – natural logarithm of IPC, LN_LEB – natural logarithm of LEB, LEB – life expectancy at birth, IPC – economic growth, S.E. – standard error, S.D. – standard deviation, R-squared – statistical measure that represents the proportion of the variance for a dependent variable that’s explained by an independent variable, F-statistic – the test statistic for testing the statistical significance of the model
C – constant, EGLS – Estimated Generalized Least Squares, LN_IPC – natural logarithm of IPC, LN_LEB – natural logarithm of LEB, LEB – life expectancy at birth, IPC – economic growth, S.E. – standard error, S.D. – standard deviation, R-squared – statistical measure that represents the proportion of the variance for a dependent variable that’s explained by an independent variable, F-statistic – the test statistic for testing the statistical significance of the model
C – constant, EGLS – Estimated Generalized Least Squares, LN_IPC – natural logarithm of IPC, LN_LEB – natural logarithm of LEB, LEB – life expectancy at birth, IPC – economic growth, S.E. – standard error, S.D. – standard deviation, R-squared – statistical measure that represents the proportion of the variance for a dependent variable that’s explained by an independent variable, F-statistic – the test statistic for testing the statistical significance of the model
LN_IPC – natural logarithm of IPC, LN_LEB – natural logarithm of LEB, LEB – life expectancy at birth, IPC – economic growth
LN_IPC – natural logarithm of IPC, LN_LEB –natural logarithm of LEB, LEB – life expectancy at birth, IPC – economic growth
Correspondence to:
Metin Gürler, MA, PhD
Uluslararası Rekabet Araştırmaları Kurumu (URAK)
Ünalan Mah. Ayazma Cad. Çamlıca İş Merkezi
A Blok Kat:3, 34700
Üsküdar/Istanbul
Turkey
[email protected]