For nearly two decades the Afghan Health System has been taking steps toward improving health outcome indicators. As a developing country, Afghanistan still suffers from high maternal and child mortality. Access to primary health care service for the total population in Afghanistan increased from 9% in 2002 to 87% in 2014, considering access to health services within a two-hour distance.1 During this period two main packages of health care services, namely the Basic Package of Health service (BPHS) for primary health care, and later the Essential Package of Health Service (EPHS) for hospital care, were developed in 2003 and 2005. BPHS focuses on provision of primary health care service, mainly maternal and newborn care, child health, and immunization, along with other basic services mentioned in the BPHS document, throughout primary health care centers.2 EPHS is mainly structured to standardize the hospital service provision in the country.
Afghanistan still suffers from high maternal and child mortality rates. While the national reproductive, maternal, newborn, child and adolescent health (RMNCAH) strategy 2017-2021 suggests a decline in the maternal mortality ratio (MMR) during the last 15 years, a slight increase in MMR has occurred since 2010. Despite a huge difference between the 2010 Afghanistan Mortality Survey (AMS), which showed an MMR of 327 maternal deaths per 100,000 live births,3 and the 2015 Afghanistan Demographic and Health Survey (AFDHS), which showed an MMR of 1,291 maternal deaths per 100,000 live births,4 the Ministry of Public Health suggested an MMR of 661 women per 100,000 live births.
The RMNCAH strategy 2017-2021, through its monitoring and evaluation framework, sets 12 indicators to measures the progress of its stated objectives. By 2021 the Ministry of Public Health aims to increase the coverage of modern contraceptives by 30% and to reduce unmet need for family planning by 15%. The AFDHS showed that the prevalence of any method of contraceptive use in Afghanistan was low, at 23% in 2015, compared with other countries in the region, such as Tajikistan (28%), Pakistan (35%), India (54%), Turkmenistan (62%), and Bangladesh (62%). In contrast, the unmet need for family planning in Afghanistan is 25%, relatively higher compared with regional countries such as Bangladesh (12%), India (13%), Pakistan (20%), Tajikistan (23%), and Turkmenistan (13%).5
Family planning allows people to attain the number of children they desire and to have better management for spacing pregnancies, which can be achieved by use of various contraceptive methods.6 Despite many debates about the pros and cons of contraceptive use in different societies in the world, it has been accepted that family planning has a crucial role to avoid unintended pregnancies, ensure physical and emotional health of women, and reduce maternal and newborn mortality. In Afghanistan, provision of contraceptive methods as one of the subcomponents of maternal health with the BPHS has been almost institutionalized in all types of health facilities for family planning.7 One of the challenges in Afghanistan is perception about desired family size, because married women, husbands, and mothers-in-law perceive that they will be happier and that more children will contribute to family economic wellbeing, taking care of parents, and compensating for possible loss due to war and illness.8 In addition, people have perceived modern contraceptive methods as dangerous, leading to numerous side effects such as pain, bleeding, weight change, mood change, and so forth.8
Many studies have been done to analyze factors associated with contraceptive use and unmet need, but most have focused on countries in sub-Saharan Africa, and South and Southeast Asia. These studies discussed associations between demographic and socioeconomic factors and contraceptive use. Among the very few studies conducted in Afghanistan, a study found that factors such as age, place of residence, media exposure, parity, education, wealth index, and antenatal care (ANC) visits in last two years were significantly associated with contraceptive use.9 A study in Pakistan concluded that, despite a growing family planning program over time, a gap remained in use of family planning by socioeconomic factors linked to the poor and illiterate groups.10 A study in West Bengal, India, revealed a positive association between the level of media exposure and the use of modern contraceptive methods among all age cohorts.11
Furthermore, a study conducted in Benin Republic found that women’s education, discussion about family planning, number of living children, fertility preference, marital status, household wealth index, sex of household head, religious membership, and place of residence were significant covariates of modern contraceptive use.12 Similarly, a study in Ethiopia found that respondents’ and parents’ education, ethnicity, urbanization, and women’s employment status were significant factors for family planning use.13 In Uganda a study conducted to determine trends and patterns of modern contraceptive use from 1995-2011 indicated that women with post-primary education, women in urban areas, women in a higher wealth quintile, and women with more living children had higher odds of using contraception compared with the reference categories.14 Moreover, another study in Namibia found that young women with at least secondary education were more likely to use contraceptives than those with no schooling.15 With respect to economic status, the study in Uganda14 found that along with women’s education, the wealth index has been one of the highest predictors of modern contraceptive use.
As with contraceptive use, many factors have been shown to affect unmet need for family planning. A study in Ethiopia that assessed factors that influence unmet need for family planning showed that unmet need for spacing is higher than for limiting births.16 A study based on a review of 51 surveys conducted from 2006 to 2013 in Asian, African, Latin American, and Caribbean countries cited two major reasons for unmet need—infrequent sex and concerns about side effects or health risks of contraceptive use.17 In addition, another analytical study from Kenya using DHS data among rural women found that factors such as marital status, level of education, number of living children, wealth index, employment status, and exposure to media were significantly related to unmet need.18
Afghanistan has a higher proportion of unmet need for family planning, while the prevalence of any method of contraceptive use is lower compared with neighboring and regional countries. Still, little is known about the factors that may be associated with both contraceptive use and unmet need for family planning in Afghanistan. This study examined socio-demographic factors already tested in other countries in order to provide evidence for further policy formulation related to contraceptive use and unmet need for family planning.
METHODS
Research objective
The current study aimed to estimate the socioeconomic factors associated with methods of contraceptive use and unmet need for family planning.
Research questions
This study answers the following research questions:
-
What are the demographic and socioeconomic factors that are associated with contraceptive use among non-pregnant married women aged 15-49 in Afghanistan?
-
Do the demographic and socioeconomic factors have any effect on unmet need for family planning among women aged 15-49?
Conceptual framework
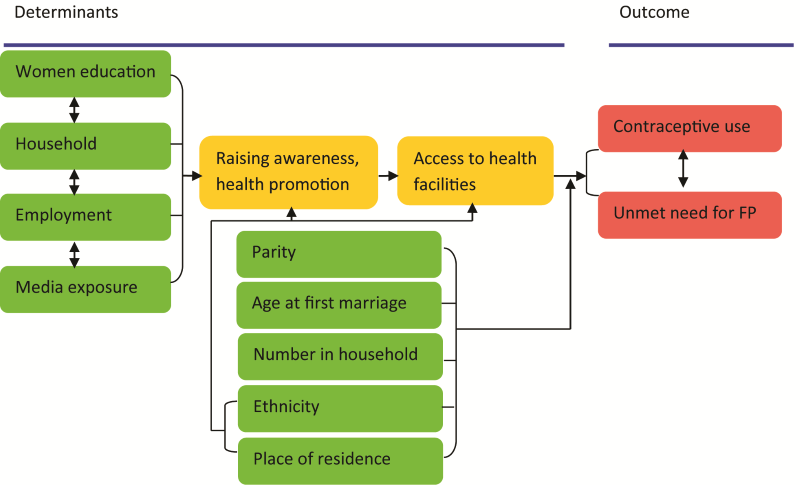
Based on the wide range of studies from other countries, we drew a conceptual framework depicted in Figure 1 describing the different demographic and socioeconomic variables. These variables come from relevant research, mostly based on DHS surveys, on contraceptive use and unmet need for family planning. As presented in the framework, there are two sets of variables: general, e.g. parity, age at first marriage, number of households, and ethnicity; and socioeconomic, such as women’s education, household wealth quintile, and media exposure, as found in the literature review. For example, in Afghanistan, Osmani found that as the number of household members increased the proportion of women using contraception also increased.9 This pattern was more significant in the age group 20-39.11 However, there is no consensus on the link between age at first marriage and contraceptive use. For example, a study in Ethiopia found that early marriage is associated with longer first birth interval,19 while evidence from three rounds of Bangladesh DHS surveys, in 1994, 2004, and 2014, consistently found that women who married at age 18 or above were less likely to use contraception compared with those who married below age 18.20

Moreover, ethnicity and place of residence are other important factors that could be associated with contraceptive use. We assume that some ethnic groups may not access health facilities as frequently as others, or may have different socioeconomic characteristics. Similarly to ethnicity, place of residence is also a key covariate that could play a role in contraceptive use in different ways—for example, by having direct links to access to health facilities, education, employment, and media exposure. Findings from Afghanistan suggest that women who live in urban areas are more likely to use contraceptive methods than rural women.9 Many other studies have been consistent with the same pattern.
In addition to the general independent factors, studies have suggested that some socioeconomic variables are predictors for contraceptive use, such as women’s education, household wealth, employment status, and media exposure. We assume that there are some underlying factors, e.g., that access to school and higher education may result in better understanding of contraceptive use. These may in turn depend on place of residence and ethnicity that could ultimately result in differences in contraceptive use due to being either hard-to-reach geographically, insecure, or linked to beliefs about family planning.
We realize that there is a negative association suggested between contraceptive use and unmet need for family planning—as the coverage of one goes up, the coverage of the other may go down. We assume that the covariates for contraceptive use mentioned above may also be linked to unmet need for family planning in the reverse direction.
DATA AND METHODS
Data source
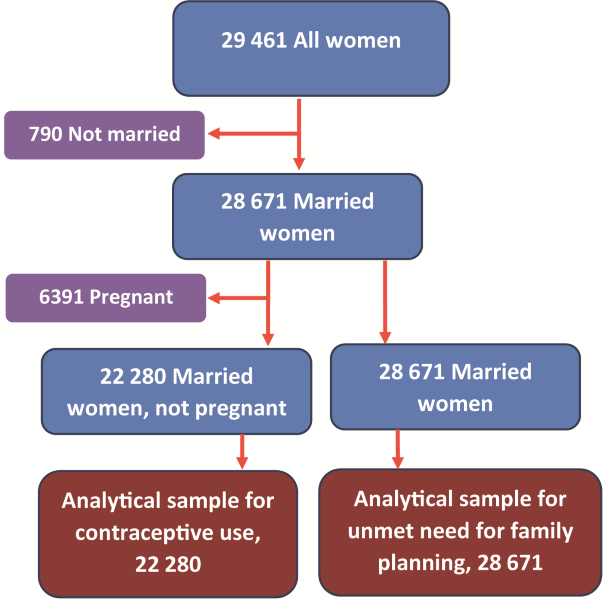
The current study used data from the 2015 AFDHS (Figure 2). The sampling frame used for the 2015 AFDHS was provided by the Central Statistics Organization (CSO). The sampling frame had information on 25,974 enumeration areas (EAs). The 2015 AFDHS followed a stratified two-stage sample design and was intended to allow estimates of key indicators at the national level, for urban and rural areas, and for each of the 34 provinces of Afghanistan. Zabul province was excluded due to security reasons, and data were only collected from seven urban EAs.

In the first stage, 950 clusters were selected, 260 in urban areas and 690 in rural areas. Overall, the survey was successfully carried out in 956 clusters. The second stage involved systematic sampling of households. A household listing operation was undertaken in all of the selected clusters, and a fixed number of 27 households per cluster was selected through an equal probability systematic selection process, for a total sample size of 25,650 households.4
Data for this study came from the individual recode file, which includes data on women aged 15-49. In total, 29,461 women aged 15-49 completed interviews. For this study, we have used data only on married women. Among all women who completed interviews, 790 were not married and therefore we assume that sexual activity is nearly nonexistent among them (to comply with norms and laws) and thus they have no need for contraception. Furthermore, if a woman is pregnant, there is no reason to use contraception, so in the second step, in the analysis of contraceptive use we also excluded 6,391 women who were pregnant at the time of the interview. As a result, 22,280 women who were currently married and not pregnant form the analytic sample for examining contraceptive use, while for analysis of unmet need for family planning a total of 28,671 women who were married make up the sample.
Description of Variables
Outcome variables
Contraceptive methods: The DHS questionnaire asks about contraceptive use—“Are you currently doing something or using any method to delay or avoid getting pregnant?” Possible responses are categorized as no use, traditional methods, or modern methods. Women who replied that they currently are using either male or female sterilization, injectables, intrauterine devices (IUDs), contraceptive pills, implants, male condoms, or the lactational amenorrhea method (LAM) are classified as modern method users. If they mentioned rhythm method, withdrawal, or another traditional method, they are categorized as traditional method users.
Unmet need for family planning: Based on the standard definition, women who are not postpartum amenorrheic, are considered to be fecund and want to postpone their next birth for at least two years, or want to stop childbearing but are not using any method of contraception, are considered to have an unmet need for family planning.21
Independent variables
Parity: Parity is defined among women who have live children; therefore, women who do not have a living child are considered as no parity. Among women with children there are three categories: women who have one to three children; women who have four to six children; and women who have more than six children.
Age at first marriage: Age at first marriage is divided into four categories: women who married before age 15; women who married at age 15-19; women who married at age 20-24; and women who married at age 25 or older.
Ethnicity: Afghanistan, like other countries, has multiple ethnic groups. We categorized the ethnic groups into five categories: Pashtun, Tajik, Hazara, Uzbek, and other ethnic groups.
Number of household members: This refers to the total number of individuals who are living in the same house and share meals. We divided this into four categories: households with 7 individuals or fewer; households with 8 to 10 individuals; households with 11 to 15 individuals; and households with more than 15 individuals.
Education attainment: Education is divided into four categories: women who have no formal or informal education and are not able to read and write; women who have completed primary level education; women who have a secondary level education; and women with higher education.
Household wealth quintile: The five wealth quintiles are defined as: poorest, poorer, middle, richer, and richest.
Women’s employment status: The employment status of women is considered in two categories, yes, or no. Women who did not have a current job or a job in the last year are classified in the “no” category, while women who were currently working and who have a job but were on leave in the last seven days are classified in the “yes” category.
Exposure to media: Women who responded that they have heard about family planning in the last few months from radio, television, or newspapers or magazines are categorized as having exposure to media; if they have not heard about family planning from any media source, they categorized as having no media exposure.
Statistical analysis
Since the study aims to identify the associations of demographic and socioeconomic factors with contraceptive use and unmet need for family planning, a separate statistical analysis was executed for each outcome. The analysis was adjusted for the effect of complex design by applying svy commands.
Our analytical approach was stepwise. In the first step we ran frequency distribution for all socio-demographic variables accompanied by their relative percentage. In the next step we used descriptive statistics by cross-tabulating contraceptive use and unmet need for family planning with all independent variables to assess the bivariate associations between the two outcomes and each of the independent variables using Pearson’s chi-square test. In the third step we applied logistic regression for contraceptive use and unmet need for the independent variables that have a significant bivariate association with the outcome variable.
To identify the magnitude of association between contraceptive use and the independent variables, a multinomial logistic regression was used. Relative risk ratio (RRR) with 95% confidence interval (CI) and P-value were considered to describe the relation between contraceptive method use and its explanatory factors. For unmet need, a binary logistic regression was used to assess its association with the independent variables. Odds ratio (OR) and 95% CI considering P-value were reported.
All statistical analysis was conducted with STATA version 15 (Stata Corp, College Station, TX, USA).
RESULTS
Overall, women in both analytic samples have several children, first married before age 19, are either Pashtun (about 4 in every 10) or Tajik (about one-third), live in rural areas, have no education, are not employed, and lack any exposure to media messages on family planning Table 1. They are most likely to live in households with 1-7 members (about 4 in every 10) or with 8-10 members (about one-third). Women are relatively evenly distributed across wealth quintiles.
There are few differences between the two analytic samples, and the differences that do appear are small. For example, compared with the study sample for unmet need for family planning, there are slightly higher percentages of women in the sample group for contraceptive use in the richest wealth quintile (21% versus 19%), in urban areas (26% versus 23%), and of Tajik ethnicity (34% versus 32%). The percentage of Pashtun women in the contraceptive use sample is slightly smaller compared with the unmet need sample (38% versus 40%). A smaller percentage of women in the contraceptive use sample have no children compared with the unmet need sample (8% versus 10%), while a larger percentage have more than six children (20% versus 17%).
Brief description of outcome variables
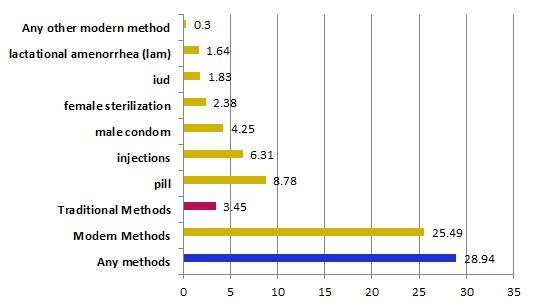
The study found that 29% of married non-pregnant women aged 15-49 currently use a contraceptive method (25.5% modern method and 3.5% traditional). Among the modern methods, pills are most commonly used, at 9%, followed by injection (6%), and male condom (Figure 3).

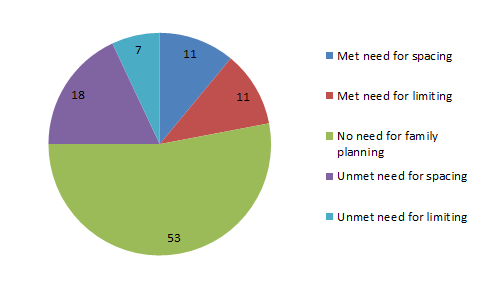
The study also found that among the sample population overall, 25% of current married women had an unmet need for family planning—18% for spacing and 7% for limiting births (Figure 4).

Bivariate analysis of socio-demographic characteristics by outcomes
Table 2 presents the bivariate analysis for contraceptive use. As shown above in Figure 3, 29% of women are current contraceptive users, and most of them use modern methods. Contraceptive use is significantly associated with nearly all covariates we examined. Contraceptive use is associated with a higher parity. While 1% of women without children use a modern contraceptive method, 30% of those with 4-6 children and 32% with more than 6 children use a modern method. A similar pattern was observed for traditional method use. The study found an association of age at first marriage with use of contraceptive methods. Women who married before age 20 are relatively more likely to use modern methods compared with women who married at age 25 or older (26% versus 18%).
Ethnicity is another factor found to be associated with use of contraceptive methods. While Tajik and Pashtun women share 31% and 27% of modern contraceptive use respectively, 22% of Hazara women, 16% of Uzbek women, and 14% of other ethnic women use modern contraceptive methods, indicating the variation between ethnic groups in contraceptive use. We found an association between number of household members and use of both traditional and modern methods. Place of residence is another factor that has an association with use of modern and traditional contraceptive methods. While 34% of urban dwellers use modern contraceptives, 23% of women in rural area use them. We found that 7% of women in urban areas use traditional methods compared with only 2% of women in rural areas. Our study also suggests that women’s level of education has an association with contraceptive use. Both traditional and modern method use exhibits a similar pattern—that increasing level of education is also associated with increasing use of both modern and traditional contraceptive methods (Table 2). Wealth index is found to be associated with contraceptive use. Among the richest and richer quintiles, 36% and 28% of women, respectively, used modern methods, while among women in the poorer and poorest quintiles, 22% and 20% used modern methods. A similar pattern was observed for the traditional methods. Finally, the study indicates that media exposure is associated with contraceptive use. Among women exposed to family planning messages in the media, 34% use modern contraceptives and 5% use traditional methods, while among women with no exposure to media, 20% use modern contraceptives and only 3% use traditional methods. There was no difference found in contraceptive use by women’s employment status.
Table 3 presents the cross-tabulation of different socio-demographic characteristics of respondents by their unmet need for family planning. The overall unmet need for family planning is estimated to be 25%.
Unmet need for family planning is significantly associated with six of the nine covariates we examined. The study indicates that parity is a factor that could be associated with unmet need for family planning. Among women who have more than six children, 27% have unmet need for family planning, while only 10% of women who have no children have unmet need for family planning. Our study indicates a relationship between age at first marriage and unmet need for family planning. While 23% and 24% of Pashtun and Tajik women, respectively, have unmet need for family planning, the levels are somewhat higher among Hazara, Uzbek, and other ethnic group women, at 27%, 28%, and 29%, respectively. Analysis of the number of household member variables shows that 22% of women who have up to seven household members and 27% of women who have more than 16 individuals in their household have unmet need for family planning, suggesting a variation between the number of household members and unmet need for family planning. Furthermore, the wealth index indicator suggests a variation between different quintiles. Among women in the poorest wealth index quintile, 27% have unmet need for family planning compared with 21% for the richest quintile. Among women exposed to the media, 23% have unmet need for family planning compared with 25% among women with no media exposure to family planning messages. The findings suggest that there is no association between women’s place of residence, level of education, or employment status and unmet need for family planning.
Multinomial logistic regression analysis of contraceptive use
Table 4 summarizes the results of multinomial logistic regression of factors associated with use of contraceptive methods. After controlling other factors, users of modern and traditional methods of contraception are compared with nonusers by different socio-demographic characteristics, and weighted relative risk ratios and confidence intervals are presented.
Among all factors significantly associated with both traditional and modern methods in bivariate analysis, four of them—parity, ethnicity, level of education, and wealth index—show an association with use of both traditional and modern methods. Media exposure was found to be associated with use of modern methods only, while place of residence was found to be associated only with traditional method use. Finally, this model did not provide evidence to support an association of age at first marriage and women’s employment status with use of contraception.
As parity had significant statistical differences for the both methods of contraception, the logistic regression found the relative risk ratio of 0.05 and 0.02 for using traditional and modern contraceptive methods respectively for women who had no children compared with those with more than six children. The relative risk ratio for using traditional methods was found to be lower for Hazara (0.4), Uzbek (0.22), and other ethnic groups (0.43) relative to Pashtun ethnic group, while the relative risk for using modern methods was lower only for Uzbek (0.52) and other ethnic groups (0.48) compared with Pashtun ethnic group. No relative risk difference was observed for either traditional or modern contraceptive methods between Tajik and Pashtun ethnic groups. The relative risk for using any contraception was higher by any level of women’s education relative to women with no education (RRR=2.4 for primary education, 2.66 for secondary, and 4.95 for higher education), but the relative risk for use of modern contraceptive methods was 52% higher compared with women with no education. The relative risks for using traditional methods were higher for women in the poorer, middle, richer, and richest quintiles compared with the poorest quintile, while for modern contraceptive use the relative risk for the richer quintile was 42% higher, and for the richest quintile it was 77% higher compared with women in the poorest wealth quintile.
While bivariate analysis found significant statistical associations of place of residence and media exposure with contraceptive use, the multinomial regression found 38% lower relative risks for using a traditional method for women in rural areas compared with women in urban settings. The study found no risk difference with respect to modern contraceptive use. In contrast, the study found no risk difference of traditional methods between women who were exposed to the media and those who were not exposed, while for women who used modern contraceptive methods, the study found 71% higher relative risk for women who were exposed to the media compared with those who were not exposed. No risk difference for either traditional or modern contraceptive method use was observed for age at first marriage and number of household members.
Binary logistic regression analysis of unmet need for family planning
Table 5 summarizes results of the adjusted binary logistic regression of unmet need for family planning on different socio-demographic characteristics.
The odds ratio of having unmet need for family planning is higher among women who have at least one child compared with those who do not have any children. In contrast with lower relative risks for traditional methods for Hazara, Uzbek and other ethnic groups, this study found a higher odds ratio for same ethnic groups compared with Pashtuns. Compared with women who married before age 15, women who married at age 15-19 had lower odds of unmet need for family planning. The difference was not significant for the other two age groups. There were higher odds for unmet need among women who had at least eight household members compared with women who had fewer than seven members. On average, the odds for unmet need are 30% lower among rural women compared with urban women (OR=0.7). While the odds ratio for unmet need for family planning is 40% lower among the richest wealth quintile compared with the poorest quintile of women, the other three wealth quintiles do not have a significant association with unmet need for family planning. No significant difference for unmet need was found for women’s education, employment status, and media exposure.
DISCUSSION
This study explored the demographic and socioeconomic factors that are associated with contraceptive use and unmet need for family planning among currently married women of reproductive age. Caution should be taken in extrapolating results because the study was based on data from a cross-sectional survey, and thus is not suitable for establishing cause and effect.
The study found that every factor except rural residence that is positively associated with contraceptive use is also negatively associated with unmet need, and vice versa. Because increased contraceptive use reduces unmet need, it is not surprising that those factors that are associated with more contraceptive use are also associated with less unmet need. If we could invest more in improving the level of contraceptive use, then the level of unmet for family planning would decrease.
To be more specific, evidence from this study suggests that parity, ethnicity, and wealth index are key predictors that have an effect on use of contraceptive methods and also on unmet need for family planning. As the number of women’s living children increases, Uzbek and other minority ethnic groups are less likely used either modern or traditional methods of contraception. In contrast, these groups have higher levels of unmet need for family planning. Ethnic diversity may be linked to other factors e.g., religious and perception about contraceptive methods. As Shafiqullah et al. found, some religious leaders have argued that contraception is a sinful act in Islam.8 A study in India found that Muslim women were 56% less likely to use contraception methods compared with other religious group.22 Furthermore, low levels of contraceptive use among Uzbek and other minority groups might be associated with some religious tenet, or it could be other factors. Again, evidence from a study in Afghanistan indicates that women who have a fear of various side effects and have doubts about a method’s effectiveness due to irregular supply found it to be a challenge to use contraceptive methods.8 A study in Ethiopia reported, “people’s attitudes concerning family planning can be rooted in individual experiences; however several societal factors have a strong impact in shaping one’s decision to use modern contraceptive methods”.16 Therefore, it would be worth investing in affecting individual attitudes toward modern contraceptive use.
Evidence from global studies suggests that economic status is a key determinant of contraceptive use. Our finding also suggests that an increasing level of household wealth is positively associated with use of both traditional and contraceptive methods, and is negatively associated with unmet need for family planning. While a study found higher levels of unmet need for family planning in a few selected Asian countries among poor women,23 the current study indicates no significant difference across the different wealth quintiles, except for the richest quintile. It is worth considering the complexity of measurement based on the wealth index in order to assess the comparability of data.
Interestingly, we did not find an association for employment status and either outcome—contraceptive use or unmet need for family planning—while most studies have found a potential relationship. For example, Gizachew Balew et al. found employment status to be a significant factor for contraceptive use13; Solanke found that the odds ratio for unmet need for family planning was 24% lower among women who had a job compared with those who did not have a job.24 Considering reasons for not using contraception, Sedgh found infrequent sexual activity and concerns regarding side effects and health risks associated with contraceptive methods to be the most common reasons for nonuse. We believe further investigation may provide details on the potential relationship of employment status and contraceptive use and unmet need for family planning.
Media exposure played a crucial role in improving health indicators. The level of media exposure has been found to have a positive association with modern contraceptive use.9,11 The current study found that women who were exposed to media were more likely to use modern contraceptive methods, while no association was found for traditional contraceptive use and unmet need for family planning. It is worth mentioning that around 60% of Afghan women still do not have any exposure to media messages on family planning. If we could improve exposure to the media, it could increase the proportion of women using modern contraceptive methods.
There was no association between women’s place of residence and either contraceptive use or unmet need for family planning, while the logistic regression analysis found that women who are rural residents are less likely to use traditional methods and less likely to have unmet need for family planning. As every survey has its limitations, caution should be used in interpreting this result. One important point to be considered is the cross-sectional design, which can be used for association but not for causality. However, findings in other countries have shown that unmet need among women in rural areas can be lower compared with women in urban areas.24
CONCLUSIONS AND POLICY IMPLICATIONS
Our findings show that key determinants for contraceptive use and unmet need for family planning in Afghanistan are parity, women’s level of education, ethnicity, and media exposure. The findings of this research show that there is still space to increase contraceptive use among women of reproductive age that consequently could decrease the proportion of unmet need for family planning.
The policy impact of this study could be to once again redirect the focus on changing women’s behavior toward family planning and use of contraception to control birth spacing and to limit childbearing, as the study finds that women, particularly in rural areas, have less unmet need. By proper media campaigns and counseling on the benefits of longer birth intervals using modern contraceptive methods, we may achieve the goal of increasing the proportion of women using contraception. An assessment of ethnic diversity may be helpful to formulate policy focusing on the areas with minority ethnic groups in order to provide family planning, which could help them access services and decrease unmet need. Meanwhile, considering the role of other factors, a multisectoral effort is still required to improve women’s education, economic situation, and behavioral changes.
In Afghanistan, the Ministry of Public Health can consider the result of this study in shaping policies to address those factors that have significant association with contraceptive use and unmet need. Meanwhile, the successful lessons learned over the last one and a half decades, along with other countries’ success strategies, will be helpful to change family planning behavior, particularly with regard to the institutionalization of family planning measures and interventions. We hope the result of this study can help the program managers of the reproductive health directorate to conduct further analysis and to review their policy and strategy accordingly to ensure improvement and future success.
Acknowledgements
The authors of this working paper are extremely thankful to USAID through ICF for providing the opportunity for two rounds of workshop and sharing lessons from different countries. We appreciate the support of facilitators Wenjuan Wang and Shireen Assaf, and co-facilitators Ehab Sakr and Henock Yebyo, who made it possible to write this paper in a systematic way. It is equally important to thank Kerry MacQuarrie, who also provided constructive comments on presenting data. Furthermore, we extend our gratitude to all 2018 DHS Fellows for their comments and discussion while presenting methods and results. Finally, we also wish to extend our thanks to the Kabul University of Medical Science, which supported us to attend both workshops and played a stewardship role in capacity development for lecturers and students. Editor: Bryant Robey. Document Production: Joan Wardell
Disclaimer
The views expressed are those of the authors and do not necessarily reflect the views of USAID or the United States Government.
Funding
This study was carried out with support provided by the United States Agency for International Development (USAID) through The DHS Program (#AID-OAA-C-13-00095).
Competing interests
The authors completed the Unified Competing Interest form at http://www.icmje.org/coi_disclosure.pdf (available upon request from the corresponding author), and declare no conflict of interest.
Correspondence to:
Behzad Ajmal
Department of Behavioral Science
Faculty of Public Health
Kabul University of Medical Science
Kabul, Afghanistan
[email protected]