Introduction
In sports such as baseball, handball, javelin throwing and tennis, the velocity of overhead throwing is fundamental to success (Ertugrul et al., 2012; Van den Tillaar, 2004). In this context, Szymanski (2013) suggests that throwing technique must be taught from childhood and that, regardless of the loads used, the velocity of execution must always be high (Szymanski, 2013). In order to increase the performance of overhead throws, various strength and power training methodologies have been implemented (Zaras et al., 2014), which include sessions with dynamic exercises (Esformes et al., 2011) and plyometric training (Ertugrul et al., 2012). Post-activation potentiation (PAP) (Sale, 2004) allows for an increase in acute muscle power peaks after a contraction with sub-maximum intensities (Seitz and Haff, 2016; Tillin and Bishop, 2009).
Post-activation potentiation has been attributed mainly to two sources. The first of these is the phosphorylation of the light regulatory chains during the previous contraction. This phosphorylation alters the structure of the myosin fibres present in the muscle, modifying the state of the crossed bridge of actin-myosin and producing greater sensitivity to the release of Ca2+ to the sarcoplasmic reticulum (Ertugrul et al., 2012; Miyamoto et al., 2011). The other explanation is neurological: it has been observed that motor neurons have an increase in excitability during the contraction produced by PAP. Therefore, the subsequent recruitment of the motor units in that muscle sharply increases power levels (Esformes et al., 2011). The effectiveness of exercise in producing PAP depends on the relationship between fatigue and potentiation produced (Kobal et al., 2019; Seitz and Haff, 2016; Wilson et al., 2013). This relationship has been studied from multiple perspectives, among them the number of muscular contractions, the intensity of these contractions (Fukutani et al., 2014), the rest between the activity and the next potentiation (Crewther et al., 2011), the angle of the joints (Miyamoto et al., 2010) and the type of contraction (Ertugrul et al., 2012). Although these methodologies do not report a decrease in the manifestation of strength, and most of the results support a significant improvement in these variables, there are controversies about the size of the effect in different populations and sports disciplines (Seitz and Haff, 2016).
In turn, some investigations have studied different types of contractions considering the efficacy of PAP production, comparing isometric (Esformes et al., 2011), concentric (Ojeda et al., 2016), eccentric (Esformes et al., 2011; Golas et al., 2016) and isokinetic (Miyamoto et al., 2011) pre-activation methods. These studies suggest that isometric exercises allow for optimal and more lasting results in the increase of muscle strength and power associated with PAP (Seitz and Haff, 2016; Tillin and Bishop, 2009). However, most of the isometric methods used to trigger PAP have only been tested in men, in the lower extremities and with non-specific movement patterns (Fukutani et al., 2014; Kabešová et al., 2019; Lim and Kong, 2013; Miyamoto et al., 2011; Sanchez-Sanchez et al., 2018).
In contrast, the quantification of strength and power in gestural velocity, both in men and women, has been a problem for both researchers and coaches (Chamorro et al., 2017). While studying this, Chelly et al. (2014) concluded that after eight weeks of plyometric training, there was an increase in throwing velocity among elite handball players, but they also mention that the application of all training methods should be tested in all populations, determining the real effect that occurs within each group of subjects, especially in women (Chelly et al., 2014). Additionally, it is known that the torque produced during internal and external rotation movements of the shoulder, evaluated through isokinetic instruments, correlates significantly with throwing velocity in water polo players (Olivier and Daussin, 2018), and it must be taken into account. Since isokinetic movements do not resemble the reality of sports, it is necessary to implement evaluations and training that allow sports movements to be controlled in a natural way. Currently, there are functional electromechanical dynamometric devices that allow the evaluation of sports movements and techniques, accurately quantifying training loads and variables associated with strength (Chamorro et al., 2017, 2018). Unfortunately, these devices have not yet been proven to effectively evaluate overhead throws.
Based on the existing literature, the pre-activation methodologies, with isometric loads and variable intra-repetition resistance (VIR-R), necessary to trigger PAP in sports movements in a natural way have not yet been fully defined, nor has the effect of isometric methods (ISO) on PAP production in women been quantified. Therefore, the main objective of this study was to determine the acute effect of pre-activation with VIR-R and isometry on overhead throwing velocity in handball players.
Methods
Participants
As shown in Table 1, fourteen Spanish Women's Silver Honour Division handball players took part in the study (age: 21.2 ± 2.7 years, body height: 167.6 ± 6.5 cm, body mass: 70.3 ± 9.5 kg, experience: 10.9 ± 3.5 years). Players were informed about the experimental procedures and the possible risks and benefits of the experiment and gave written consent to participate in the study. Both the study and the informed consent forms were approved by the Human Research Committee of the University of Granada, Spain (Registration 454 / CEIH / 2017), in agreement with the ethical standards established in the Declaration of Helsinki. Health status was considered as an inclusion criterion (the players should not present any type of musculoskeletal injury), another criterion was a minimum of eight years of experience in handball.
Table 1
Participants’ Characteristics.
Measures
The baseline consisted of three overhead throws at maximum velocity (Vb). For both the baseline and the two experimental conditions, the throws were made standing five meters from a wall with the opposite foot forward to the executing arm. The average of the three baseline throws and of each set was considered for both experimental conditions. The projectile thrown was a Size 2 handball, with a circumference of 54– 56 cm and a weight of 325–400 g, while the maximum velocity of the throws was measured using a Stalkers ATS radar gun (Stalker Radar, Plano, TX, USA) with accuracy of 0.1 km·h-1, a velocity range of 1–480 km·h-1 and a target acquisition time of 0.01 s.
Design and Procedures
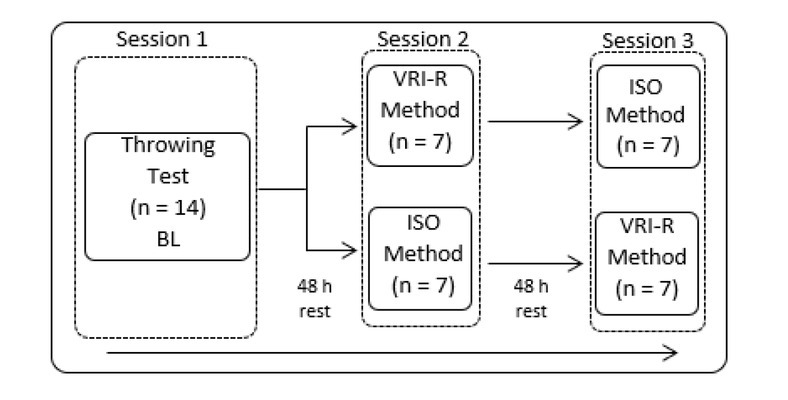
The study had an intra-subject crossover design. All handball players had 48 hours of rest before each intervention. Players were asked not to ingest caffeine or any other substance that would increase the metabolism, during any phase of the experiment. The experiment lasted five days. Day 1 was the baseline for the entire sample, followed by a 48-hour recovery. On Day 2 of the intervention, 50% of the sample (n = 7) performed the experimental pre-activation condition through VIR-R, while the other 50% of the sample (n = 7) performed the experimental pre-activation condition through the isometric method (ISO), followed by another 48-hour recovery. On Day 3 of the intervention, each group performed the pre-activation with the previous method (Figure 1). The first evaluation included anthropometric measurements using the Rowenta Premiss BS1060 digital scale, with a maximum weight of ≤ 150 kg with a graduation of 100 grams, and the HM200D Digital Height Meter, with a measuring range of 120 to 200 cm with a graduation of 1 mm. Before the baseline and the two experimental conditions (VIR-R and ISO), participants performed a standardised warm-up consisting of a five-minute jog, followed by five minutes of general and specific shoulder mobility exercises (ballistic movements and the overhead throw gesture).
Figure 1
Experimental Design of pre-activation with VRI-R and ISO. VRI-R: variable resistance intra-repetition; ISO: isometry; BL: baseline.
The first experimental condition was a pre-activation using the VIR-R method. This pre-activation consisted of a set of five repetitions at an initial velocity of 0.6 m·s-1 and a final velocity of 0.9 m·s-1 in a "unilateral chest press" with the dominant arm while standing, using the Functional Electromechanical Dynamometer DYNASystem, Symotech, Granada (force: 0.5– 2000 N, velocity: 0.005–2.00 m·s-1 and distance: 0.03–500 cm). The starting position was similar to the evaluation of the throwing velocity, the opposite foot forward to the executor arm, while the range of movement was individualised and measured before performing the set in the initial position of 90º with respect to the forearm until the complete extension of the elbow (Figure 2A). After the pre-activation, participants immediately (min 0) performed a set of three throws at maximum velocity. This set of three pitches was repeated at the 1st (min 1), 2nd (min 2) and 10th (min 10) minute of recovery (Miyamoto et al., 2011). The evaluation of the velocity of each throw was made using the Stalkers ATS radar gun. For the statistical analysis, the average value of the three throws was considered.
Figure 2
A) Isometric exercise position. B) Variable Resistance Intra-Repetition Exercise (a. initial position; b. end position)
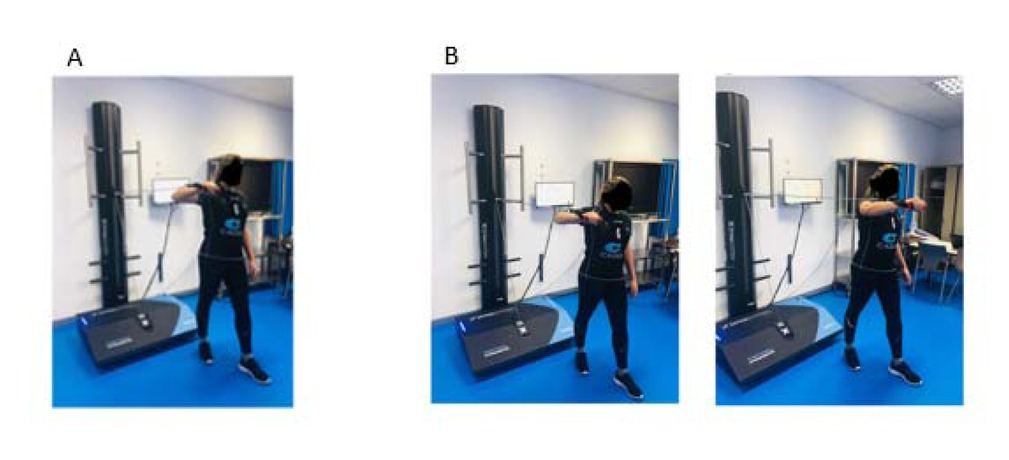
The second experimental condition was a pre-activation using the ISO method. This pre-activation consisted of performing a set of five-second voluntary maximum isometric contraction in a "unilateral chest press" with the dominant arm in a standing position, using the Functional Electromechanical Dynamometer. Unlike other isokinetic devices which generate angular velocities, this device (DynaSystem, Model Research, Granada, Spain) generates linear isokinetic speeds between other dynamic modes (tonic, kinetic, elastic, inertial, conical) to static (isometric, vibratory) allowing to evaluate and train through resistance/velocity constant and variable. The starting position was similar to the evaluation of the throwing velocity, the opposite foot forward to the executor arm, while the angle of the elbow was 90º with respect to the forearm (Figure 2B). As in the VIR-R method, following the pre-activation, participants immediately (min 0) performed a set of three throws at maximum velocity. This set of three pitches was repeated at the 1st (min 1), 2nd (min 2) and 10th (min 10) minute of recovery (Miyamoto et al., 2011). The evaluation of the velocity of each throw was made using the Stalkers ATS radar gun. For statistical analysis, the average value of the three throws was considered.
Statistical Analysis
The mean values of baseline throwing velocities and both pre-activation methods were subjected to the Shapiro-Wilk normality test. A repeated measures ANOVA was used to examine the effect of pre-activation with the VIR-R and ISO methods. For this analysis, the baseline (LB), min 0, the 1st, 2nd and 10th minute of both methods were considered. The effect size (ES) for both cases was calculated using the Eta Square Partial test. The individual responses for both pre-activation methods were analysed using the mean values, standard deviations (SD), deltas and percentages of variation between the baseline and the different sets of throws. Excel 2013® software and statistical software SPSS version 19® were used for data tabulation and analysis. For all the comparisons, a value of significance p ≤ 0.05 was accepted.
Results
Pre-activation with VIR-R
The means and SD are presented in Table 2. ANOVA did not show any significant differences for the 0, 1st, 2nd and 10th minutes (F = 1.56, p = 0.194, ES = 0.088) (Table 2). Regarding the individual responses, the analysis showed that 6 of 14 players (43%) increased the throwing speed in all experimental sets (0, 1st, 2nd and 10th min), while12 of 14 players (86%) increased the launching speed in some of the experimental sets, and only 2 of 14 players (14%) did not experience any changes after pre-activation through the VIR-R method (Table 3).
Table 2
Pre- and post-activation performance with RVI-R and ISO methods on throwing velocity.
Table 3
Differences between pre- and post-activation with the VRI-R method on throwing velocity.
Pre-activation with ISO
The means and SD are presented in Table 2. ANOVA did not show any significant differences between the scores taken at 0, 1st, 2nd and 10th min (F = 0.69, p = 0.596, ES = 0.041) (Table 2). In relation to the individual responses, the analysis showed that 4 of 14 players (29%) increased their throwing velocity in all the experimental sets (0, 1st, 2nd and 10th min), while 13 of 14 players (93%) increased throwing velocity in some of the experimental sets, and only 1 of 14 players (7%) did not experience any changes following pre-activation with the ISO method (Table 4).
Table 4
Differences between pre- and post-activation with the ISO method on throwing velocity.
Discussion
Considering that the effects of different methodologies and training loads on PAP have not yet been fully described (Seitz and Haff, 2016), and because the existing literature lacks coherence in some performance variables (Dobbs et al., 2018), it was necessary to determine the acute effect of two pre-activation protocols (VIR-R and ISO) targeting muscles of the dominant upper extremity on Bv in female handball players. In relation to the main objective of this investigation, the results showed a non-significant difference for both pre-activation protocols between baseline and 0, 1st, 2nd and 10th min of recovery (p > 0.05). Perhaps a deficit of strength in the upper limbs of handball players could affect the average effect of pre-activation on Vb, as it has been shown that stronger individuals have a greater possibility of producing PAP (Seitz and Haff, 2016). Likewise, and directly associated with Vb, it has been observed that more highly trained subjects have greater possibilities of generating PAP after a pre-activation in a bench press on a throw (Ojeda et al., 2016). Along these lines, Smilios et al. (2016) suggest that PAP is manifested to a greater degree in athletes with high relative strength. Therefore, well-trained individuals with higher levels of strength may have a greater capacity for empowerment compared to the less trained population.
Another variable to consider in the PAP protocols is the rest interval between pre-activation and subsequent explosive activities (Dobbs et al., 2018; Golas et al., 2016; Tillin and Bishop, 2009). In this sense, Tillin and Bishop (2009) indicated that the balance between PAP and fatigue was fundamental to determining the effect of pre-activation on a subsequent explosive activity. In turn, Dobbs et al. (2018) recommended that untrained subjects rested seven to ten minutes between pre-activation and subsequent explosive activity. Similarly, Seitz and Haff (2016) concluded that weaker subjects responded better to longer recovery intervals. Despite these studies, and in the present study, PAP protocols with recovery times of less than one minute have been tested, with significant differences between pre-activation and subsequent muscular activities (Miyamoto et al., 2010). Also, Smilios et al. (2016) showed that gender could influence rest times, associating the lower muscle mass presented by women with a greater possibility of fatigue after pre-activation. Consequently, one of the variables to be considered in the PAP protocols is the strength and performance level of the subjects, since this will influence and determine the rest interval between the pre-activation and the subsequent explosive activities (Seitz and Haff, 2016).
Taking into consideration the effect of gender over PAP, results of this study are in line with data from Wilson et al. (2013); in that study women achieved post-activation effects, but with a lesser effect size (ES) than men (male = 0.42 ES, female = 0.20 ES). In addition, Ojeda et al. (2019) obtained similar results, where the effects of PAP on female athletes had to be reviewed individually due to the variation of results. However, due to the few studies conducted with female athletes, there is no consensus as to why these gender differences exist. According to Tillin and Bishop (2009), these differences may be due to lower muscle strength for the same level of competition in female atletes. This would lead to such differences occurring between the genders.
In relation to the different types of contraction and intensities needed to produce PAP, it has been demonstrated that maximum or submaximal contractions, whether dynamic or isometric, trigger PAP (Tillin and Bishop, 2009). However, Tillin and Bishop (2009) suggest isometric contractions to increase strength acutely (PAP), and although these types of muscle contractions generate higher levels of fatigue, they are also able to recruit more motor units that have thresholds of higher activation, thus increasing the chances of triggering PAP. In this sense, in an investigation conducted by Gilmore et al. (2018), the effect of high intensity isometry was evaluated over 5 s. At the end of the study, an increase in the batting velocity was observed in all time intervals except the 1st min post activation (2nd, 4th, 6th, 8th, 10th and 12th min) (Gilmore et al., 2018).
Similarly, there are studies that support the use of maximum dynamic movements to trigger PAP (Okuno et al., 2013), focusing on intensities ranging from 80 to 100% of 1RM (Gomez et al., 2011; Okuno et al., 2013; Zaras et al., 2013). In this regard, there is evidence that six weeks of strength training or ballistic power increase performance in pitchers (from 7.0 to 13.5% in strength and 6.0 to 11.5% in ballistic power). On the other hand, there are few studies that relate loads with variable resistances and PAP, specifically VIR-R with PAP (Ojeda et al., 2016). This created two opposite situations: on the one hand, an innovative methodology was investigated from the point of view of the control and quantification of the functional electromechanical dynamics of the movement; on the other hand, because there are no studies that have controlled and modified the velocity of movement in the repetition for each of the study subjects (initial velocity of 0.6 m·s-1 and final velocity of 0.9 m·s-1 in each repetition), it was difficult to compare the results found in the present investigation. The latter led to the testing of a broad spectrum of time and PAP alternatives in the present study, from 0 to 10 minutes post activation (Miyamoto et al., 2011). It is also important to mention that there are PAP investigations that analyse individual responses more than the average results, suggesting that women should have more rest than men between pre-activation and subsequent exercises (Ojeda et al., 2019; Seitz and Haff, 2016).
Some limitations during data collection should be noted. First, the experimental sample is not large enough to extrapolate the data obtained to the entire population. These handball players had not previously trained with the proposed stimuli, both isometric contractions and pleokinetic contractions. Therefore, their fatigue could be increased by this lack of adaptation. Due to this, more research should be done with female subjects who are more familiar with the proposed stimuli. It could help better define which type of training produces the desired PAP effect. This could lead to an improvement in performance of female athletes. They would obtain a qualitative leap in both the preparation for matches as well as in the planning of their training program.
In conclusion, considering that after the pre-activation through the VIR-R method, 86% of the players increased the throwing velocity in some of the experimental sets, and 93% showed improvements with the ISO method, we believe that the methodology used is applicable for handball players. However, if pre-activation is to be used with both the VIR-R and ISO methods, individual responses should be checked, considering longer rest intervals between the pre-activation and the subsequent exercise (Seitz and Haff, 2016), as the results obtained may have been influenced by the short rest interval between the pre-activation and the experimental sets (Tillin and Bishop, 2009; Kobal et al., 2019).
This study did not show statistically significant improvements in overhead throwing velocity in handball players (0, 1st, 2nd and 10th min) after the application of pre-activation protocols with VIR-R and ISO. However, large individual variations were observed after pre-activation with the RVI-R and ISO methods. Therefore, pre-activation with a set of five maximum repetitions at an initial velocity of 0.6 m·s-1 and a final velocity of 0.9 m·s-1 (VIR-R), or a set of five seconds of maximum voluntary isometric contraction (ISO) in a "unilateral chest press" with the dominant arm in a standing position, using a functional electromechanical dynamometer, generated PAP in the vast majority of handball players. Consequently, coaches who consider the use of this pre-activation protocol to generate PAP should explore its effectiveness individually. Factors such as power levels, the type of contraction or intensity of the pre-activation protocol to generate PAP, and above all, the recovery interval between pre-activation and subsequent motor activity, need further investigation before successful implementation of PAP.