


The endocannabinoid system has been suspected to contribute to the association of visceral fat accumulation with metabolic diseases. We determined whether circulating endocannabinoids are related to visceral adipose tissue mass in lean, subcutaneous obese, and visceral obese subjects (10 men and 10 women in each group). We further measured expression of the cannabinoid type 1 (CB1) receptor and fatty acid amide hydrolase (FAAH) genes in paired samples of subcutaneous and visceral adipose tissue in all 60 subjects. Circulating 2-arachidonoyl glycerol (2-AG) was significantly correlated with body fat (r = 0.45, P = 0.03), visceral fat mass (r = 0.44, P = 0.003), and fasting plasma insulin concentrations (r = 0.41, P = 0.001) but negatively correlated to glucose infusion rate during clamp (r = 0.39, P = 0.009). In visceral adipose tissue, CB1 mRNA expression was negatively correlated with visceral fat mass (r = 0.32, P = 0.01), fasting insulin (r = 0.48, P < 0.001), and circulating 2-AG (r = 0.5, P < 0.001), whereas FAAH gene expression was negatively correlated with visceral fat mass (r = 0.39, P = 0.01) and circulating 2-AG (r = 0.77, P < 0.001). Our findings suggest that abdominal fat accumulation is a critical correlate of the dysregulation of the peripheral endocannabinoid system in human obesity. Thus, the endocannabinoid system may represent a primary target for the treatment of abdominal obesity and associated metabolic changes.
Endocannabinoids are lipid mediators derived from membrane phospholipids or triglycerides with complex effects on body weight and metabolic regulation (1,2). Several enzymes are involved in the synthesis and degradation of the two most important endocannabinoids, anandamide and 2-arachidonoyl glycerol (2-AG). At least two G-protein–coupled cannabinoid receptors (CB1 and CB2) have been identified (3,4). Activation of central CB1 receptors clearly promotes food intake and weight gain (5–7). However, pharmacological blockade with rimonabant (SR141716) or genetic knockout of the CB1 receptor demonstrated that weight reduction under these conditions is only partly promoted by decreased food intake (8–10). These findings prompted the search for peripheral metabolic effects of endocannabinoids. CB1 receptors have now been identified in rodent liver (11), skeletal muscle (12), adipocytes (9,13), and pancreas (14). The potential role of peripheral CB1 receptors for metabolic regulation is further promoted by statistical analyses of clinical trials, suggesting that the influence of CB1 receptor blockade on adiponectin levels, lipids, and glucose homeostasis goes beyond the effect of weight loss alone (15–17).
In general, endocannabinoid formation and signaling is dependent on external stimuli such as cellular stress, tissue damage, or metabolic challenges (3,4). However, recent findings point to profound changes in the regulation of the endocannabinoid system in obesity. Experimental data suggest that the endocannabinoid system is chronically activated in obesity or after high-fat feeding, both in the brain and in peripheral organs (18–20). Increased dietary supply of fatty acids, serving as endocannabinoid precursors, may be a possible mechanism, but decreased enzymatic degradation by the fatty acid amide hydrolase (FAAH) has been described in the liver of diet-induced obese mice (11). Recently, increased circulating levels of endocannabinoids and downregulation of subcutaneous adipose CB1 and FAAH gene expression in obese postmenopausal women were described (21). To better define the changes of endocannabinoid system regulation in human obesity, we determined whether elevated circulating endocannabinoids are related to visceral adipose tissue accumulation in 60 men and women with a wide range of obesity, fat distribution, insulin sensitivity, and glucose tolerance. We also measured expression of the CB1 and FAAH genes in paired samples of subcutaneous and visceral adipose tissue.
RESEARCH DESIGN AND METHODS
Paired samples of visceral and subcutaneous adipose tissue were obtained from 60 Caucasian men (n = 30) and women (n = 30) who underwent open abdominal surgery for gastric banding, cholecystectomy, appendectomy, abdominal injuries, or explorative laparotomy and were immediately frozen in liquid nitrogen after explantation. Type 2 diabetes and severe conditions including generalized inflammation or end-stage malignant diseases were exclusion criteria. Fourteen subjects (3 in the lean, 5 in the subcutaneous obese, and 6 in the visceral obese group) were treated with statins for dyslipidemia. Fifteen subjects (8 in the subcutaneous obese and 7 in the visceral obese group) received β-blockers (n = 7), ACE inhibitors (n = 8), diuretics (n = 8), or angiotensin-1 receptor blockers (n = 4) either as single or combination therapy for the treatment of hypertension. Dyslipidemic or hypertensive patients had to be on stable medication for at least 2 months before inclusion. All subjects had a stable weight with fluctuations <2% of the body weight for at least 3 months before surgery. The study was approved by the ethics committee of the University of Leipzig. All subjects gave written informed consent before taking part in the study.
BMI was calculated as weight in kilograms divided by the square of height in meters. Waist circumference was measured in the standing position in the midline between the iliac crest and the lowest rib. Percentage body fat was measured by dual X-ray absorptiometry. To determine visceral and subcutaneous abdominal adipose tissue areas, computed tomography scans were taken at the L4–L5 level of the lumbar spine with an attenuation range of −30 to −190 Hounsfield units. Using a combination of BMI and the visceral fat–to–subcutaneous fat ratio, we stratified the participants into one lean (BMI <25 kg/m2; n = 20) and two obese (BMI >30 kg/m2) groups, with predominant visceral (n = 20) or subcutaneous adipose (n = 20) tissue accumulation.
Patients were allowed 10–12 weeks to recover from surgery before metabolic evaluation. Inflammatory parameters such as white blood cell count and C-reactive protein had to be normal for participation. The oral glucose tolerance test (OGTT) was performed according to the criteria of the American Diabetes Association (22). Three days before the OGTT, the patients documented a high-carbohydrate diet. The OGTT was performed after an overnight fast with 75 g standardized glucose solution (Glucodex Solution 75 g; Merieux, Montreal, Canada). Venous blood samples were taken at 0, 60, and 120 min for measurements of plasma glucose concentrations. Insulin sensitivity was assessed by euglycemic-hyperinsulinemic clamp (23), and the cutoff for insulin resistance was arbitrarily chosen from results of >120 individuals with the same population background who underwent the same euglycemic-hyperinsulinemic clamp protocol (24).
Analytical methods.
Anandamide, 2-AG, oleoylethanolamide, and arachidonic acid were quantified by liquid chromatography/in-line mass spectrometry, as previously described in detail (25). Basal blood samples were taken after an overnight fast to determine glucose, insulin, and standard laboratory parameters. Plasma insulin was measured with a two-site chemiluminescent enzyme immunometric assay for the IMMULITE automated analyzer (Diagnostic Products, Los Angeles, CA). For the quantification of serum free fatty acids, an in vitro enzymatic colorimetric method was used (NEFA C; Wako Chemicals, Neuss, Germany). Plasma cholesterol and triglyceride concentrations were measured as previously described (24). Total RNA was extracted from adipose tissue samples using Qiagen RNeasy MiniKit (including the RNase-free DNase set; Qiagen, Hilden, Germany), and 1 μg RNA was reversed transcribed with standard reagents (Life Technologies, Grand Island, NY). Human CB1 and FAAH mRNA expression was measured with premixed assays-on-demand for human CB1, FAAH, and 18S rRNA (PE Biosystems, Weiterstadt, Germany). Gene expression was measured using an ABI 7000 sequence detection system for real-time PCR (Applied Biosystems, Darmstadt, Germany) with the standard curve method. Human CB1 and FAAH mRNA expression was calculated relative to 18S rRNA to normalize for differences in starting material and differing efficiency of cDNA synthesis between samples.
Statistical analyses.
Data are shown as means ± SE unless stated otherwise. Before statistical analysis, non-normally distributed parameters were logarithmically transformed to approximate a normal distribution. Expression differences between visceral and subcutaneous adipose tissue were assessed using the paired Student’s t test, and differences between more than two groups were analyzed by ANOVA and post hoc Bonferroni-Holm test. Linear relationships were assessed by least-squares regression analysis. Multivariate relationships were assessed by a general linear model. Statistical software from the SAS Institute (Cary, NC) was used. P values <0.05 were considered to be statistically significant.
RESULTS
Circulating 2-AG is increased in visceral obesity.
Clinical characteristics of the 60 men and women included in this study are given in Table 1. A lean control group was compared with two obese subgroups with predominantly visceral or subcutaneous adipose tissue accumulation based on computed tomography measurements of fat distribution. Circulating 2-AG levels were significantly increased in obese compared with lean subjects, which was essentially accounted for by visceral obese subjects (Fig. 1A). 2-AG levels were significantly correlated with BMI (r = 0.32, P = 0.03), percent body fat (r = 0.45, P = 0.03), and visceral fat area in both sexes (Fig. 1B) without significant sex differences. In contrast, plasma anandamide concentrations were higher in women compared with men but not different between lean and obese subgroups (Fig. 2). Interrelationships between anthropometric and metabolic parameters with the endocannabinoid system are shown in Table 2. The precursor for endocannabinoid biosynthesis, arachidonic acid, and an endocannabinoid-like molecule that does not activate endocannabinoid receptors, oleoylethanolamide, were not significantly related to obesity-associated measures.
CB1 and FAAH mRNA gene expression in adipose tissue depots.
Gene expression analysis of 60 paired samples of visceral and subcutaneous adipose tissue revealed that mRNA expression of both CB1 and FAAH was higher in the visceral than in the subcutaneous fat depot (Fig. 3). CB1 and FAAH gene expression was not different between men and women. CB1 and FAAH mRNA levels were significantly higher in adipose tissue of lean compared with obese subjects (Fig. 3) but not different between the two fat distribution phenotypes. Significant correlations were found between visceral and subcutaneous mRNA levels, for both CB1 and FAAH (Fig. 4). Correlations between endocannabinoid system gene expression and anthropometric and metabolic parameters are shown in Table 2. These correlations were further analyzed by multivariate linear regression models, including age, sex, percent body fat, fasting plasma insulin, and plasma 2-AG levels as independent variables. These models revealed percent body fat and 2-AG as determinants of visceral CB1 gene expression and only circulating 2-AG as a predictor of visceral FAAH gene expression (Table 3). Percent body fat and circulating 2-AG levels were also identified as the strongest predictors of subcutaneous CB1 and FAAH mRNA expression (data not shown).
Relationship of circulating endocannabinoids with metabolic parameters.
Circulating 2-AG correlates with measures of insulin sensitivity, including increased fasting plasma insulin concentrations and decreased glucose infusion rate during the steady state of the euglycemic-hyperinsulinemic clamp (Table 2 and Fig. 5). The negative correlation between glucose infusion rate and 2-AG was still significant after adjusting the glucose infusion rate for visceral fat area, BMI, or percent body fat. However, multivariate regression analysis revealed that only visceral abdominal adipose tissue areas are determinants of glucose infusion rate during the clamp and fasting plasma insulin concentrations (Table 4). In addition, 2-AG levels were positively correlated with serum triglycerides (r = 0.3, P = 0.03) and free fatty acids (r = 0.41, P = 0.001) but negatively correlated with HDL cholesterol (r = −0.42, P = 0.001), which was still significant after adjustment for adiponectin plasma concentrations. No significant correlation exists between adiponectin and 2-AG concentrations (r = −0.18, P = 0.2). Anandamide was not correlated with these metabolic parameters, including adiponectin. Since genetic deletion of CB1 receptors was shown to be associated with decreased hepatic expression of the lipogenic transcription factor sterol regulatory element–binding protein 1c (SREBP-1c), we examined whether a similar relationship existed for adipose CB1 expression. In the visceral adipose tissue depot, CB1 receptor mRNA was positively correlated with gene expression of SREBP-1c (Fig. 6).
DISCUSSION
The endocannabinoid system plays a well-known role in the central control of appetite, food intake, and energy balance. All these effects are mediated by CB1 receptors (26). CB1−/− mice are lean and resistant to diet-induced obesity (10). However, the lean phenotype is associated with decreased food intake only in young animals. Pair-fed older wild-type mice are heavier than the CB1 gene-deleted animals (9), thus suggesting an additional, most likely peripheral, mechanism. Similar findings were obtained by treatment of diet-induced obese mice with the selective CB1 receptor antagonist rimonabant. Again, reduced food intake was only observed during the 1st week of treatment, whereas decreased body weight was sustained over the complete 5-week treatment period (8). These surprising observations led to the discovery of CB1 receptors first on rodent adipocytes (9,13) and later to the identification of CB1 receptors on human adipocytes (21,27). Both, the CB1−/− genotype and rimonabant treatment are associated with a similar gene expression profile in mouse adipose tissue (28). Besides actions on adipocytes, the endocannabinoid system might control metabolic functions by acting on peripheral tissues, including hepatocytes, the gastrointestinal tract, skeletal muscle, endothelial cells, and possibly also the pancreas (11,12,14,29,30). The clinical importance of the endocannabinoid system is further supported by studies showing that pharmacological blockade of the system is a promising therapeutic approach in the treatment of various components of the metabolic syndrome (15–17,31,32).
Visceral fat accumulation, typically referred to as abdominal obesity, might represent a key pathophysiologic mechanism for the clustering of metabolic abnormalities (33). Here, we studied the regulation of the endocannabinoid system in human visceral obesity. On the systemic level, we found that the key endocannabinoid 2-AG is markedly increased in obese compared with lean subjects. Specifically, 2-AG levels were predominantly increased in subjects with abdominal obesity, and a significant correlation was found between circulating 2-AG and visceral fat mass. The significant negative relationship between 2-AG levels and measures of insulin sensitivity was independent of the effects of body fat mass, suggesting additional peripheral effects of the endocannabinoid system. Increased circulating 2-AG levels confirm previous findings in postmenopausal women with a less well-characterized obese phenotype (21). Both 2-AG and anandamide are also increased in blood of patients with type 2 diabetes (14). A selective upregulation of 2-AG, but not anandamide, content has recently been described in visceral adipose tissue of obese patients (14), but the reverse situation was described for endocannabinoids in the liver of diet-induced mice (11). Both, hypothalamic and uterine levels of endocannabinoids are increased in genetically obese animals presenting with either leptin deficiency (ob/ob mice) or impaired leptin signaling (db/db mice and fa/fa rats). These findings, however, appear to be related to interactions between leptin and endocannabinoids, rather than reflecting obesity-associated changes (18,20). Taken together, these findings suggest a complex regulation of circulating and tissue concentrations of endocannabinoids. Several aspects, e.g., clinical condition, concomitant medication, fasting/nonfasting state, and possibly also sex differences, need to be considered. Furthermore, some methodological precautions must be followed to avoid artificially increased anandamide levels in blood (34).
To further elucidate the regulation of the endocannabinoid system in adipose tissue, we measured expression of CB1 receptor and FAAH mRNA in paired samples of subcutaneous and visceral adipose tissue. Increased systemic 2-AG concentrations in visceral obese subjects were associated with decreased CB1 receptor gene expression in adipose tissue, suggesting a negative-feedback loop regulation. Moreover, multivariate regression models identified 2-AG plasma concentrations, in addition to body fat mass, as significant predictors of CB1 gene expression. We further found that CB1 gene expression in visceral and subcutaneous depots were closely correlated, indicating that CB1 gene expression in subcutaneous adipose tissue (21) may be an acceptable surrogate for CB1 gene expression in visceral adipose tissue. Interestingly, visceral CB1 expression levels were higher than subcutaneous levels in all fat distribution groups. The regulation of CB1 receptors in obesity also appears to be complex. CB1 gene expression is increased in adipose tissue of obese Zucker rats (fa/fa) (13), in liver of diet-induced obese mice (11), and in skeletal muscle (12) but unchanged in the uterus of ob/ob mice (20). However, studies on diet-induced obesity in the rat showed that CB1 density was unchanged in the hypothalamus and decreased in extrahypothalamic brain regions (19). Although these authors also speculate on a negative-feedback loop for CB1 receptor regulation, central endocannabinoid levels were not determined in that particular study.
Genetic deletion of CB1 receptors protects mice from the development of a fatty liver in response to high-fat feeding (11). The mechanism appears to be a decreased rate of fatty acid synthesis due to downregulation of the lipogenic transcription factor SREBP-1c, as subsequently confirmed by in intro studies with isolated hepatocytes. In wild-type mice, high-fat feeding rapidly increased intrahepatic endocannabinoid levels, which promoted lipogenesis even before the onset of diet-induced obesity (11). Lipogenic activity of endocannabinoids has also been suggested in rat adipocytes, as lipoprotein lipase activity was increased by CB1 receptor activation (9). In accordance with that, we found a significant correlation between CB1 receptor and SREBP-1c mRNA expression in visceral adipose tissue. A detailed investigation of lipogenic enzymes and triglyceride synthesis rates, however, is needed in human adipocytes to clearly establish this role of endocannabinoids. CB1/2 receptor–mediated changes in intracellular cAMP levels, as recently shown in human adipocytes, may be an important mechanism to influence metabolic enzymes (27).
A role of endocannabinoids for adiponectin dysregulation in obesity has been suggested in rodent and human adipocytes (13,14,35). If this hypothesis holds true, the calculated weight loss–independent effect of rimonabant treatment on circulating adiponectin levels could be explained on the adipocyte level (16). We did not see a significant correlation between circulating 2-AG levels and adiponectin levels in our patients. This finding, however, does not necessarily speak against a regulatory role of endocannabinoids or, more precisely, CB1 blockade on the adipocyte level. Clearly, detailed studies are needed in the future that directly compare in vitro and in vivo approaches in humans to elucidate effects of endocannabinoids and CB1 blockade on metabolic regulation and adipose tissue, liver, skeletal muscle, and pancreatic physiology and pathophysiology (14,35,36). Then, the pleiotropic effects of CB1-receptor blockade by rimonabant may be easier to explain (15–17,31,32). However, these effects are in part mediated by a predominant effect on visceral adipose tissue, as the dysregulation of the endocannabinoid system is more pronounced in subjects with abdominal obesity.
Which mechanisms lead to increased endocannabinoid levels in abdominal obesity? One possibility is the increased supply of precursors for endocannabinoid biosynthesis and/or increased activity of enzymes involved in endocannabinoid synthesis (18). When studying circulating levels of the precursor arachidonic acid and of oleoylethanolamide, a molecule with endocannabinoid structure and synthesized by the same enzymes that do not activate CB receptors, we did not find any significant correlation with measures of adiposity.
Thus, decreased endocannabinoid degradation must be considered as a second possibility. Given the overwhelming mass of adipose tissue compared with other organs, a contribution of adipocytes to endocannabinoid inactivation, which may be disturbed in visceral obese subjects, is an attractive hypothesis. Endocannabinoid action is limited by intracellular enzymatic degradation. One of the major catabolizing enzymes is FAAH, and a marked downregulation of FAAH gene expression in adipose tissue of obese compared with lean subjects was recognized, with the lowest levels in visceral obese subjects. Downregulation of FAAH activity in the liver with high-fat feeding was associated with increased anandamide levels in the liver (11). Another degrading enzyme, monoacylglycerol lipase, has been found in human adipose tissue, but the expression is apparently not influenced by obesity (14). A role of FAAH in human obesity has recently also been proposed by a strong association of a FAAH missense mutation that leads to decreased enzymatic activity with human obesity (37). On the other hand, FAAH does not play an important role in vivo for the degradation of 2-AG in knockout mice (38,39). Interactions between leptin and the endocannabinoid system have been demonstrated in different in vivo and in vitro systems (14,18,40). The mechanisms that contribute to changes in the regulation of the endocannabinoid system in human abdominal obesity has to be elucidated in the future.
Our study is relatively small, given the fact that each phenotypic group is represented by both sexes. Also, the examination of surgical patients introduces some variation in age and concomitant medication, which may interfere with parameters of the endocannabinoid system. The influence of variables such as age, sex, hormonal status, and concomitant medication on components of the endocannabinoid system have not been studied at present in humans. On the other hand, our data for the most part confirm the findings from our first study in women with unknown fat distribution phenotypes but with no concomitant medications, with the same hormonal status, and with only small variation in age (21).
In conclusion, extending previous observations that the peripheral endocannabinoid system may be activated in human obesity (21), we demonstrate here that visceral fat accumulation is an important correlate of an activated peripheral endocannabinoid system. In addition, strong expression of CB1 receptors in visceral adipose tissue could represent a primary target for the beneficial effects of CB1 blockade on different components of the metabolic syndrome.

Circulating 2-AG concentrations in lean and obese subjects. Circulating 2-AG concentrations were measured in one lean control group (BMI <25 kg/m2, n = 20) and in two obese groups (BMI >30 kg/m2) with different fat distribution phenotypes. Fat distribution was determined by measurement of abdominal adipose tissue areas using computed tomography. Subjects were divided in visceral (vis) obese (n = 20) or subcutaneous (SC) obese (n = 20) groups. A: 2-AG is clearly increased in subjects with visceral obesity. No sex differences were found for plasma 2-AG concentrations in the three groups. B: In both men and women, circulating 2-AG concentrations correlate with abdominal visceral fat area as measured by computed tomography scans. Data are means ± SE. *P < 0.05, **P < 0.01 by ANOVA.
Circulating 2-AG concentrations in lean and obese subjects. Circulating 2-AG concentrations were measured in one lean control group (BMI <25 kg/m2, n = 20) and in two obese groups (BMI >30 kg/m2) with different fat distribution phenotypes. Fat distribution was determined by measurement of abdominal adipose tissue areas using computed tomography. Subjects were divided in visceral (vis) obese (n = 20) or subcutaneous (SC) obese (n = 20) groups. A: 2-AG is clearly increased in subjects with visceral obesity. No sex differences were found for plasma 2-AG concentrations in the three groups. B: In both men and women, circulating 2-AG concentrations correlate with abdominal visceral fat area as measured by computed tomography scans. Data are means ± SE. *P < 0.05, **P < 0.01 by ANOVA.

Circulating anandamide concentrations in lean and obese subjects. Circulating anandamide concentrations were measured in one lean control group (BMI <25 kg/m2, n = 20) and in two obese groups (BMI >30 kg/m2) with different fat distribution phenotypes. Fat distribution was determined by measurement of abdominal adipose tissue areas using computed tomography. Subjects were divided in visceral (vis) obese (n = 20) or subcutaneous (SC) obese groups (n = 20). A: Anandamide (AEA) plasma concentrations differed between men and women. Anandamide levels are not significantly changed by obesity in women (B) and men (C). Data are means ± SE. *P < 0.05, **P < 0.01 by ANOVA.
Circulating anandamide concentrations in lean and obese subjects. Circulating anandamide concentrations were measured in one lean control group (BMI <25 kg/m2, n = 20) and in two obese groups (BMI >30 kg/m2) with different fat distribution phenotypes. Fat distribution was determined by measurement of abdominal adipose tissue areas using computed tomography. Subjects were divided in visceral (vis) obese (n = 20) or subcutaneous (SC) obese groups (n = 20). A: Anandamide (AEA) plasma concentrations differed between men and women. Anandamide levels are not significantly changed by obesity in women (B) and men (C). Data are means ± SE. *P < 0.05, **P < 0.01 by ANOVA.

CB1 and FAAH mRNA expression in lean and obese subjects. Gene expression was determined by real-time RT-PCR in paired samples of subcutaneous (SC) and visceral (vis) adipose tissue in all 60 subjects. A: In all groups, CB1 mRNA expression was higher in visceral compared with subcutaneous adipose tissue (P < 0.05). Subjects in the lean group had significantly higher CB1 mRNA expression than obese subjects, with no effect of the fat distribution phenotypes. B: In all groups, visceral FAAH mRNA levels were significantly higher than in subcutaneous adipose tissue. FAAH expression was highest in lean subjects and lowest in subjects with visceral obesity. Data are means ± SE. Group comparisons by ANOVA and t test for paired samples. *P < 0.05 for visceral vs. subcutaneous expression; #P < 0.05 between groups.
CB1 and FAAH mRNA expression in lean and obese subjects. Gene expression was determined by real-time RT-PCR in paired samples of subcutaneous (SC) and visceral (vis) adipose tissue in all 60 subjects. A: In all groups, CB1 mRNA expression was higher in visceral compared with subcutaneous adipose tissue (P < 0.05). Subjects in the lean group had significantly higher CB1 mRNA expression than obese subjects, with no effect of the fat distribution phenotypes. B: In all groups, visceral FAAH mRNA levels were significantly higher than in subcutaneous adipose tissue. FAAH expression was highest in lean subjects and lowest in subjects with visceral obesity. Data are means ± SE. Group comparisons by ANOVA and t test for paired samples. *P < 0.05 for visceral vs. subcutaneous expression; #P < 0.05 between groups.

Correlation between visceral and subcutaneous adipose tissue gene expression of CB1 receptor (A) and FAAH (B) genes. Linear regression analysis with log-transformed data (1 AU = 1ag target gene/100 ng total RNA). Paired samples from visceral and subcutaneous adipose tissue were obtained from 60 Caucasian men (n = 30) and women (n = 30) and analyzed by real-time RT-PCR.
Correlation between visceral and subcutaneous adipose tissue gene expression of CB1 receptor (A) and FAAH (B) genes. Linear regression analysis with log-transformed data (1 AU = 1ag target gene/100 ng total RNA). Paired samples from visceral and subcutaneous adipose tissue were obtained from 60 Caucasian men (n = 30) and women (n = 30) and analyzed by real-time RT-PCR.

Correlation between 2-AG plasma concentrations and insulin sensitivity. We found a significant correlation between 2-AG plasma concentrations and glucose infusion rate during the steady state of an euglycemic-hyperinsulinemic clamp. The correlation remained significant after adjusting for total body fat content. Data were log transformed to achieve normal distribution. % BF, percent body fat.
Correlation between 2-AG plasma concentrations and insulin sensitivity. We found a significant correlation between 2-AG plasma concentrations and glucose infusion rate during the steady state of an euglycemic-hyperinsulinemic clamp. The correlation remained significant after adjusting for total body fat content. Data were log transformed to achieve normal distribution. % BF, percent body fat.
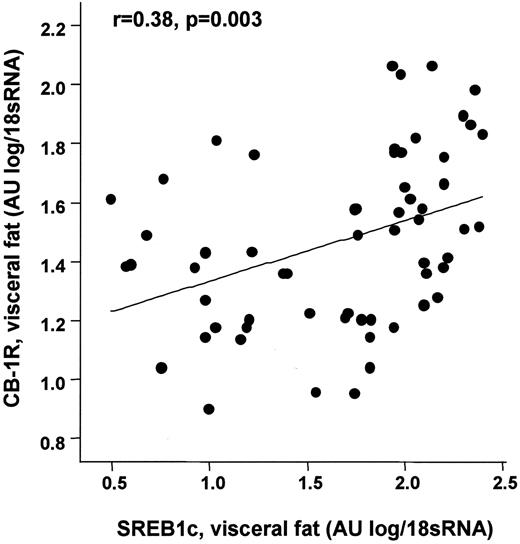
Correlation between visceral CB1 mRNA levels and SREBP-1c gene expression in visceral adipose tissue. Linear regression analysis with log transformed. Total RNA from visceral adipose tissue was obtained from 60 Caucasian men (n = 30) and women (n = 30) and analyzed by real-time RT-PCR.
Correlation between visceral CB1 mRNA levels and SREBP-1c gene expression in visceral adipose tissue. Linear regression analysis with log transformed. Total RNA from visceral adipose tissue was obtained from 60 Caucasian men (n = 30) and women (n = 30) and analyzed by real-time RT-PCR.
Clinical and biochemical characteristics of the study group (n = 60)
| Lean | Subcutaneous obese | Visceral obese | |||||||
|---|---|---|---|---|---|---|---|---|---|
| Male | Female | Male | Female | Male | Female | ||||
| n | 10 | 10 | 10 | 10 | 10 | 10 | |||
| Age (years) | 48 ± 13 | 43 ± 14 | 58 ± 11 | 53 ± 15* | 55 ± 7† | 69 ± 13‡ | |||
| BMI (kg/m2) | 25 ± 2§ | 24 ± 1§ | 36 ± 7 | 34 ± 8 | 35 ± 7‡ | 34 ± 7‡ | |||
| Waist circumference (cm) | 87 ± 1.3† | 69.5 ± 3.1§ | 140 ± 5.6 | 132.3 ± 4.9 | 138.4 ± 5.4‡ | 129.4 ± 4.5‡ | |||
| Body fat (%) | 22 ± 4§ | 23 ± 3§ | 43 ± 10 | 41 ± 9 | 35 ± 6‡ | 33 ± 7‡ | |||
| HbA1c (%) | 5.2 ± 0.1§ | 5.3 ± 0.2§ | 5.5 ± 0.2 | 6.0 ± 0.8 | 6.0 ± 0.7‡ | 5.8 ± 0.5‡ | |||
| Subcutaneous abdominal fat area (cm2) | 78.7 ± 9.5†§ | 46.8 ± 11.1†§ | 1,020 ± 103.7 | 525 ± 42.7 | 512 ± 33.1‡ | 334 ± 41.7‡ | |||
| Visceral abdominal fat area (cm2) | 62.4 ± 9.5†§ | 39.3 ± 7.4†§ | 178 ± 28.5 | 128 ± 19.3 | 331 ± 41.9‡ | 248 ± 27.6‡ | |||
| fasting plasma glucose (mmol/l) | 5.3 ± 0.3 | 5.4 ± 0.4 | 5.2 ± 0.6 | 6.6 ± 2.4 | 5.9 ± 1.2 | 5.6 ± 0.8 | |||
| Fasting plasma insulin (pmol/l) | 27 ± 8§ | 25 ± 12 | 108 ± 115† | 227 ± 88 | 185 ± 103‡ | 166 ± 115‡ | |||
| 2-h OGTT plasma glucose (mmol/l) | 6.1 ± 0.7 | 6.0 ± 0.5 | 6.6 ± 1.5 | 7.6 ± 3.4 | 7.4 ± 1.9 | 7.9 ± 2.7 | |||
| GIR (ml/h) | 94 ± 8 | 93 ± 14§ | 87 ± 9*† | 40 ± 21 | 42 ± 22 | 48 ± 29‡ | |||
| Free fatty acid (mmol/l) | 0.38 ± 0.21 | 0.33 ± 0.13 | 0.45 ± 0.32 | 0.64 ± 0.27 | 0.73 ± 0.31‡ | 0.67 ± 0.15‡ | |||
| Total cholesterol (mg/dl) | 200 ± 30 | 221 ± 56 | 189 ± 26* | 203 ± 29 | 219 ± 34 | 225 ± 30 | |||
| HDL cholesterol (mg/dl) | 55 ± 9 | 64 ± 17 | 50 ± 12 | 56 ± 14 | 45 ± 11 | 54 ± 8 | |||
| Triglycerides (mg/dl) | 221.4 ± 12.5 | 205.5 ± 15.3 | 250.8 ± 19.2 | 195.6 ± 24.9 | 246.9 ± 31.5 | 248.6 ± 18.1 | |||
| Total-to-HDL cholesterol ratio | 3.49 ± 0.7 | 3.38 ± 0.4 | 3.81 ± 0.35 | 3.53 ± 0.24 | 4.88 ± 0.44 | 4.21 ± 0.38 | |||
| Adiponectin (μg/dl) | 8.7 ± 3.4 | 9.0 ± 4.2 | 6.5 ± 2.4* | 5.3 ± 2.7 | 3.5 ± 2.0‡ | 5.6 ± 3.8 | |||
| Leptin (pmol/l) | 2.3 ± 1.3†§ | 11.8 ± 4.9§ | 19.4 ± 8.8† | 35.0 ± 12.8 | 18.8 ± 10.9†‡ | 32.8 ± 8.5‡ | |||
| Interleukin-6 (pg/ml) | 0.45 ± 0.12 | 0.61 ± 0.33§ | 2.22 ± 1.78* | 3.87 ± 1.91 | 2.94 ± 1.96 | 4.67 ± 2.02‡ | |||
Data are means ± SE. Group comparisons by Studentś t test.
P < 0.05 for visceral obese vs. subcutaneous obese group;
P < 0.05 between males and females in each group;
P < 0.05 for visceral obese vs. lean group;
P < 0.05 for subcutaneous obese group vs. lean group (all comparison in the same sex only). GIR, glucose infusion rate during the steady state of a euglycemic-hyperinsulinemic clamp.
Correlations between anthropometric and metabolic parameters with measures of the peripheral endocannabinoid system
| Male | Female | |||||||||||||
|---|---|---|---|---|---|---|---|---|---|---|---|---|---|---|
| CB1 receptor visceral mRNA | FAAH visceral mRNA | 2-AG | Anandamide | CB1 receptor visceral mRNA | FAAH mRNA | 2-AG | Anandamide | |||||||
| Age | 0.003 | 0.08 | −0.01 | −0.15 | −0.43* | −0.45* | 0.41* | −0.1 | ||||||
| BMI | −0.5† | −0.35 | 0.55† | 0.26 | −0.65† | −0.64† | 0.64† | 0.21 | ||||||
| Visceral abdominal adipose tissue area | −0.53† | −0.38* | 0.52† | 0.31 | −0.64† | −0.56† | 0.65† | 0.23 | ||||||
| Percent body fat | −0.49† | −0.19 | 0.3 | 0.15 | −0.62† | −0.43* | 0.5† | 0.14 | ||||||
| Fasting plasma glucose | −0.003 | −0.37* | 0.23 | 0.22 | −0.14 | 0.25 | −0.06 | 0.18 | ||||||
| Fasting insulin | −0.4* | −0.4* | 0.41* | 0.2 | −0.58† | −0.3 | 0.42* | 0.15 | ||||||
| GIR | 0.4 | 0.58† | −0.5* | −0.2 | 0.3 | 0.06 | −0.32 | −0.11 | ||||||
| Free fatty acid | −0.02 | −0.04 | 0.15 | 0.1 | −0.49† | −0.3 | 0.4* | 0.1 | ||||||
GIR, glucose infusion rate during the steady state of an euglycemic-hyperinsulinemic clamp.
P < 0.05;
P < 0.01.
Multivariate regression analyses to identify determinants of CB1 receptor and FAAH mRNA expression in visceral adipose tissue (n = 60)
| Dependent variable | Visceral CB1 receptor mRNA | Visceral FAAH mRNA |
|---|---|---|
| Model 1 | ||
| Age | −0.250 (0.056) | −0.231 (0.078) |
| Sex | 0.107 (0.408) | −0.045 (0.729) |
| Model 2 | ||
| Age | −0.113 (0.334) | −0.165 (0.213) |
| Sex | 0.073 (0.514) | −0.061 (0.632) |
| Percent body fat | −0.505 (<0.001) | −0.244 (0.068) |
| Model 3 | ||
| Age | −0.085 (0.463) | −0.145 (0.280) |
| Sex | 0.102 (0.368) | −0.040 (0.756) |
| Percent body fat | −0.451 (<0.001) | −0.203 (0.143) |
| Fasting insulin | −0.186 (0.125) | −0.139 (0.315) |
| Model 4 | ||
| Age | −0.023 (0.833) | −0.044 (0.684) |
| Sex | 0.132 (0.202) | 0.009 (0.934) |
| Percent body fat | −0.343 (0.004) | −0.031 (0.787) |
| Fasting insulin | −0.152 (0.168) | −0.085 (0.446) |
| 2-AG (pmol/ml) | −0.385 (0.001) | −0.614 (<0.001) |
Data are β (P value). Significant differences are indicated in bold.
Multivariate regression analyses to identify independent association between plasma 2-AG concentrations and measures of insulin sensitivity (n = 60)
| GIR clamp | Fasting plasma insulin | |
|---|---|---|
| Model 1 | ||
| 2-AG | −0.364 (0.012) | 0.228 (0.080) |
| Model 2 | ||
| Percent body fat | −0.113 (0.453) | 0.279 (0.040) |
| 2-AG | −0.325 (0.034) | 0.131 (0.392) |
| Model 3 | ||
| Visceral fat area | −0.480 (0.002) | 0.430 (0.005) |
| Percent body fat | −0.006 (0.963) | 0.156 (0.239) |
| 2-AG | −0.132 (0.376) | −0.056 (0.689) |
Data are β (P value). GIR, glucose infusion rate during the steady state of an euglycemic-hyperinsulinemic clamp. Significant differences are indicated in bold.
M.B. and S.E. contributed equally to this work.
The costs of publication of this article were defrayed in part by the payment of page charges. This article must therefore be hereby marked “advertisement” in accordance with 18 U.S.C. Section 1734 solely to indicate this fact.
Article Information
This study was supported by grants from the Deutsche Forschungsgemeinschaft (BL 580/3-1 [to M.B.], STU 192/6-1 [to M.S.], and FA 376/3-1 [to M.F.]) and the Bundesministerium für Bildung und Forschung (0313027B Nutrigenomik [to S.E.]).
We thank Judy Harvey-White for excellent technical help in measuring endocannabinoid levels.