


ISSN: 0973-7510
E-ISSN: 2581-690X
Access to safe drinking water is the key to promoting good health. At Karwar, the primary source of drinking water is well, but heavy rain, and deficiencies in underground drainage systems result in well water contamination. However, water handling practices followed at the point of consumption act as a better predictor of water contamination. To assess and compare the bacteriological quality of household water at the source and point of consumption. A prospective cross-sectional study was conducted at Karwar. Households owning private wells were selected by Simple Random Sampling. Semi-structured questionnaires were used to interview the households regarding socioeconomic status (SES), chlorination of well, purification method, and water handling practices. Presumptive coliform count and the differential coliform count were determined. Data thus obtained were analyzed using a Microsoft Excel. c2-test was used to see the association between variables. The present study included 30 households. All the samples taken from the well revealed contamination with E. coli. 80% of samples from the point of consumption revealed coliforms, among which 47% were confirmed with E. coli. RO/RO+UV were found to be relatively better performing than the filtration and boiling methods. Contamination of water at the point of consumption had a significant association with both purification and water retrieval methods. The samples taken from the point of consumption reflect better quality of water sampling than source water. The present study revealed post-collection contamination as major reason for compromising water quality despite improved water cleaning and purification techniques.
Coliforms, drinking water, water contamination, water analysis, chlorination
Sustainable Development Goals-6 targets to provide universal access to safe and drinking water to all by 2030 and to improve the sustainability of water resources.1 Clean water plays a vital role in determining the health, food securities, and livelihoods of families. Globally, 785 million people lack even a basic drinking-water service.2 Transmission of many diseases like diarrhea, dysentery, hepatitis-A, polio, typhoid, and cholera are attributed to contaminated water and unsafe sanitation. Diarrhea is the most common disease linked with contaminated water. Globally, 829,000 annual deaths are estimated from diarrhea due to unsafe drinking water and improper sanitation.1 In India, 6.75 million diarrhea disability-adjusted life year (DALYs) was estimated, of which 140,000 deaths were reported in 2016.3
The first step towards curbing avoidable diarrheal deaths is providing safe-drinking water.4 Fecal contamination of drinking water can be detected by identifying fecal indicator organisms in water.5 These indicator organisms include Escherichia coli, fecal coliforms, fecal streptococci, and Clostridium perfringens.5,6 Several studies have been undertaken in India and neighbouring countries to assess the microbiological quality of water at its sources and point of consumption. A study conducted at Amritsar from various water sources showed 42.9% water unfit for human consumption.7 At Kathmandu valley, Nepal 92.4% of water from source was unfit for drinking, with 238 enteric bacterial isolates and E. coli (26.4%) was the most common organism.8 Another study conducted at Udupi taluk also revealed 92.5% contamination of well water with coliforms.9 Another study conducted at west Tripura among households revealed heavy and moderate contamination of water sources in 8% and 11% of the households, respectively.10 The reduction in fecal contamination of drinking water cannot be achieved by simply finding bacteria. In addition, other household hygiene and water handling practices will have to be complemented. These methods include chlorination of well, purification of drinking water at the point of consumption, and appropriate storage and handling practices of purified potable water.
The different methods of water purification widely followed includes reverse osmosis (RO), reverse osmosis with ultraviolet radiation (RO+UV), candle filters, and boiling. RO and RO+UV operates on the difference in pressure across a permeable membrane, that can remove many types of dissolved and suspended chemical and biological species by using nanofilters. However, the system is expensive and the maintenance of these systems also play crucial role in its effectiveness. The use of ceramic materials for filtration of drinking water is one of the oldest water treatment method. Nowadays, ceramic candle filter and colloidal silver filter are most widely used. They are simple, cost-effective, easy to clean and maintain. However, it does not remove all pathogens and are not effective against highly turbid or iron-containing water. This may result in plugging of the candle pores. Boiling of water is known to be effective against enteric bacteria, protozoa, and viruses.11 However, boiling involves high cost use of energy and does not provide any residual protection.
Post filtration and/boiling, the drinking water will have to be appropriately stored in clean storage vessels before consumption. In addition, improper handling, or cleaning practices may negate the effectiveness of purification methods. Hence, the point of consumption (POC) also plays a major role in determining water quality. The results from various studies also show that samples taken from drinking water storage vessels better reflect the quality of water consumed than source samples.12 As per the 2011 Census, the coastal district of Uttara Kannada has 14,37,169 total population (sex ratio 979), among which 1,50, 115 are children (sex ratio of 955).13 Among the Karwar City Municipal Council population, where the present study was conducted, 71.3% of people use water from wells for drinking purposes.14 Potential sources of well water contamination at Karwar include repeated floods, heavy rains, seepage from septic tanks, and improper underground drainage system.15,16 An extensive review of the literature revealed no studies were undertaken at Karwar to assess the microbiological quality of potable water. Hence, the present study was conducted to assess the microbiological quality of water collected from the source and point of consumption in the households of Karwar. The improvement of water quality control strategies with hygiene and sanitation practices can positively impact the health of the community.
A prospective cross-sectional study was conducted at Karwar for two months after obtaining approval from the Institutional Ethical Committee of Karwar Institute of Medical Sciences, Karwar. Karwar is the district headquarters of Uttara Kannada district in the state of Karnataka, India having an area of 685.41 km2 and a total population of 91,458. The urban area has a population of 17,787 with a geopgraphical area of 10.18 km2.17 Karwar has a total households of 23,961 of which 4,564 households fall under the Karwar city municipal council limits that had 441 covered wells.
The total number of samples for this study is estimated as 30 using Cochran’s formula at a 95% confidence level with a 92.5% prevalence of contaminated well by coliforms.9 These samples were distributed among the five major residential areas of Karwar city that included Kajubag, KHB colony, Kodibag, Nandangadda, and Sankriwada. From these areas, a survey was carried out to find out the houses having private wells. Among these households, 30 wells were randomly chosen. Two samples were collected from each household, one from a well and another from the point of consumption. Any private well from which water was not consumed, households unwilling to participate & houses which were found to be locked during the visits were excluded from the study.
Samples were collected in sterilized 200 ml glass bottles. For the well water sampling, the sample bottle was tied with weights at the bottom and released into the well using a wheel pulley attachmed to the well. The sample bottle was carefully immersed in the well water such that there was no contact with the walls of the well and also made sure that the bottle did not disturb the sediment settled at the bottom of the well. The bottle was completely immersed in water and was retrieved back and stoppered.
At the households, the well water was subjected to different purification methods before consumption for drinking/cooking and the purified water was stored in vessels. The water from the storage vessels was mainly retrieved by using a tap, tilting the drinking water storage vessel, or by dipping a glass in to the drinking water storage vessel. These points act as POC and the samples were taken by mimicking these methods as followed by their respective households.
These bottles contained 0.1ml of 1.8% sodium thiosulfate solution to neutralize the bactericidal effect of chlorine present in water. At least 100ml of water was collected in each bottle. The bottles were stoppered, labeled with full details of their source, time, and date of collection, and was delivered by the principal investigator to the department of Microbiology at Karwar Institute of Medical Sciences, Karwar within 6 hours.6 The principal investigator administered survey questions to the head of the house using a semi-structured questionnaire regarding socio-demographic details of the households, chlorination of well water, purification of water before consumption, storage of purified water, and retrieval of water for consumption.
Various methods are available for water analysis in the literature, but the multiple tube fermentation (MTF) method expressed in terms of most probable number (MPN) was followed as the sensitivity was higher than other methods.5,18 Moreover, MTF method is useful even when water samples are very turbid,5 which is commonly seen at Karwar. In the present study, detection and enumeration of coliforms were done by the MTF method. Further, confirmation of E. coli was done by differential coliform test and biochemical tests.
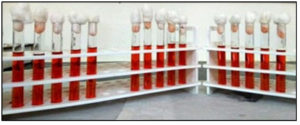
Fig. 1. Uninoculated media for the presumptive coliform count and differential coliform count.
The collected water samples were added to MacConkey broth in volumes of 10ml, 1ml, and 0.1ml, as seen in Fig. 1. The inoculated bottles were incubated at 37°C and examined after 24-48 hours. If there was any turbidity, color change, or gas production, it was taken as coliforms (Fig. 2). The MPN of coliforms per 100 ml was recorded from probability tables of McCrady. Samples with <10 MPN/100mL were reported as satisfactory and >10 MPN/100mL as unsatisfactory.6
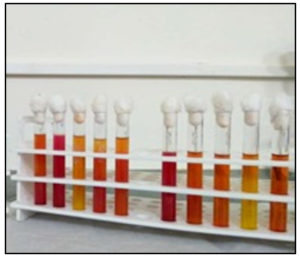
Fig. 2. Positive for presumptive coliforms – Tubes showing turbidity, colour change, or gas formation in Durham’s tube after incubating for 24-48 hours at 37°C.
Following the presumptive test, subcultures were made from bottles showing turbidity, color change or gas, into fresh tubes of single strength MacConkey Broth. These tubes were incubated at 44°C and examined after 24-48 hours. Production of gas indicated the presence of E. coli (Fig. 3) which was further confirmed by testing for indole production and citrate utilization.6
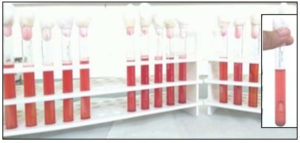
Fig. 3. Positive for the differential coliform count – Test tubes showing gas formation in Durham’s tube after 24-48 hours of incubation at 44°C.
The data obtained were analyzed using a Microsoft Excel spreadsheet, and results were summarized in frequencies and proportions. c2 test was used to see the association among variables including socioeconomic status, community, chlorination of wells, purification method, well-water contamination, contamination at POC, and frequency of cleaning drinking water storage containers. The association was considered significant if the p-value was less than 0.05 at 95% confidence level.
Samples from 30 households were collected from wells and points of consumption. The samples were taken from various areas of Karwar, including Nandangadda (n=7; 23.3%), Kajubagh (n=6; 20%), KHB colony (n=6; 20%), Kodibagh (n=6; 20%), and Sankriwada (n=5; 16.7%). These households were classified into four groups based on their socioeconomic status; Class-I, Class-II, Class-III, and Class-IV comprised of 60%, 23.3%, 3.3%, and 13.3% of the samples respectively. The different socioeconomic classes were determined based on the B. G. Prasad SES scale 2021 which takes into account per capita income of a family.19 The data regarding the socioeconomic status, chlorination of well, and practices regarding water storage and handling were recorded.
Well water sampling
Samples were collected from 30 household wells and the contamination with total coliforms showed values ranging from 15 to 200 MPN index/100ml at 95% confidence. All the 30 samples had more than 10 MPN/100ml, hence unsatisfactory and unfit for drinking 20 as seen in Table 1. Further analysis with differential count and biochemical reaction revealed all the well water samples were contaminated with E. coli. All the well water samples taken from 30 households belonging to different communities revealed contamination with coliforms and E. coli irrespective of their socioeconomic status as seen in Table 1. All the households chlorinated their wells, but the frequency of chlorination differed. The well water contamination was seen in all the households irrespective of the community and SES. Among the 18 households belonging to class-I, 4 households (22.2%) chlorinated their wells every 6 months and 14 households (77.8%) chlorinated their wells once in a year. Of the 6 households belonging to class-II, 4 of them (66.7%) chlorinated their wells once in a year and the remaining 2 households chlorinated their wells once in 2-5 years. 4 of the 5 households (80%) belonging to class-IV and the one household belonging to class-III chlorinated their wells once in 2-5 years. Among the various communities, households of Sankriwada and KHB colony frequently chlorinated their wells followed by Nandangadda; and the least frequency of chlorination was seen in the households of Kajubag and Kodibag.
Table (1):
Contamination of water samples taken at source and point of consumption among different communities belonging to various SES.
| Community | SES | Well-water contamination | Contamination at the point of Consumption | ||
|---|---|---|---|---|---|
| Yes | No | Yes | No | ||
| Kajubag (n = 6) |
Class-I | 2 | 0 | 0 | 2 |
| Class-II | 0 | 0 | 0 | 0 | |
| Class-III | 0 | 0 | 0 | 0 | |
| Class-IV | 4 | 0 | 4 | 0 | |
| Total | 6 | 0 | 4 | 2 | |
| KHB Colony (n = 6) |
Class-I | 5 | 0 | 2 | 3 |
| Class-II | 1 | 0 | 1 | 0 | |
| Class-III | 0 | 0 | 0 | 0 | |
| Class-IV | 0 | 0 | 0 | 0 | |
| Total | 6 | 0 | 3 | 3 | |
| Kodibag (n = 6) |
Class-I | 3 | 0 | 1 | 2 |
| Class-II | 1 | 0 | 1 | 0 | |
| Class-III | 1 | 0 | 1 | 0 | |
| Class-IV | 1 | 0 | 1 | 0 | |
| Total | 6 | 0 | 4 | 2 | |
| Nandangadda (n = 7) |
Class-I | 4 | 0 | 1 | 3 |
| Class-II | 3 | 0 | 2 | 1 | |
| Class-III | 0 | 0 | 0 | 0 | |
| Class-IV | 0 | 0 | 0 | 0 | |
| Total | 7 | 0 | 3 | 4 | |
| Sankriwada (n = 5) |
Class-I | 4 | 0 | 0 | 4 |
| Class-II | 1 | 0 | 0 | 1 | |
| Class-III | 0 | 0 | 0 | 0 | |
| Class-IV | 0 | 0 | 0 | 0 | |
| Total | 5 | 0 | 0 | 5 | |
| Grand Total | 30 | 0 | 14 | 16 | |
Sampling from the point of consumption (POC)
Three methods were followed by the 30 households to retrieve water for drinking from POC – (i) by using a tap, (ii) by tilting the drinking water storage vessel, and (iii) by dipping a glass in to the drinking water storage vessel. The samples were taken from POC by mimicking these methods as followed by their respective households. These samples were tested for presumptive and differential counts. The contamination of total coliforms showed a value that varied from 6 to 150 MPN index/100ml at 95% confidence. A total of 24 samples had more than 10 MPN/ 100ml suggesting 80% of samples from POC were unsatisfactory and unfit for drinking (Table 1). Further analysis with differential count and biochemical reaction revealed 47% of samples were contaminated with E. coli.
Table (2):
Frequency of chlorination of well followed by various communities belonging to different SES.
| Community | Socio-economic status | Frequency of chlorination | Contaminated wells | ||
|---|---|---|---|---|---|
| Once in 6 months | Once in a year | Once in 2-5 years | |||
| Kajubag (n = 6) |
Class-I | – | 2 | – | 2 |
| Class-II | – | – | – | – | |
| Class-III | – | – | – | – | |
| Class-IV | – | 1 | 3 | 4 | |
| Total | 0 | 3 | 3 | 6 | |
| KHB Colony (n = 6) |
Class-I | 1 | 4 | – | 5 |
| Class-II | – | 1 | – | 1 | |
| Class-III | – | – | – | – | |
| Class-IV | – | – | – | – | |
| Total | 1 | 5 | 0 | 6 | |
| Kodibag (n = 6) |
Class-I | – | 3 | – | 3 |
| Class-II | – | – | 1 | 1 | |
| Class-III | – | – | 1 | 1 | |
| Class-IV | – | – | 1 | 1 | |
| Total | 0 | 3 | 3 | 6 | |
| Nandangadda (n = 7) |
Class-I | 1 | 3 | – | 4 |
| Class-II | – | 2 | 1 | 3 | |
| Class-III | – | – | – | – | |
| Class-IV | – | – | – | – | |
| Total | 1 | 5 | 1 | 7 | |
| Sankriwada (n = 5) |
Class-I | 2 | 2 | – | 4 |
| Class-II | – | 1 | – | 1 | |
| Class-III | – | – | – | – | |
| Class-IV | – | – | – | – | |
| Total | 2 | 3 | 0 | 5 | |
| Grand Total | 4 | 19 | 7 | 30 | |
The rate of contamination was also assessed among different classes of socioeconomic status. All the households belonging to Class-III and Class-IV showed contamination at POC with coliforms and E. coli. Households of Class-I showed the least contamination at POC (72.2% coliforms, among which 22.2% confirmed with E. coli). Among various communities, no contamination at POC was seen among the households belonging to Sankriwada; and the highest contamination (66.7%) was seen among the households of both Kajubag and Kodibag.
Out of 30 households, 29 of them practiced at least one method of water purification for drinking. The one household that did not practice any purification method belonged to class-IV. The different treatment methods followed by the 29 households include boiling, filtration, Reverse Osmosis (RO), and Reverse Osmosis with Ultraviolet radiation (RO+UV). The majority of the households had an RO system installed (53.3%), and boiling was the least practiced method (6.7%). Among the 18 households belonging to Class-I, 10 households (55.5%) treated their water before consumption by RO+UV and the remaining 8 households used RO (44.5%). All the 6 households belonging to class-II treated the drinking water with RO. Among 5 households belonging to Class-IV, none of them had either RO or RO+UV systems installed. 2 households followed boiling method, 2 households used filtration method, and one of the household did not practice any drinking water purification method. The households belonging to KHB colony, Nandangadda, and Sankriwada had either installed RO or RO+UV for drinking water purification. However, the majority (3 out of 6 households) of Kajubag followed boiling and filtration as their water purification method. All the households that followed filtration and boiling methods showed contamination with coliforms and E. coli. The least contamination was seen with the RO+UV method (coliforms in 75%, among which E. coli is 37.5%).
All the households stored the treated water before consumption. 24 households installed with RO and RO + UV systems had an in-built covered plastic container for storing water, and water was retrieved by tap. The households that followed the filtration method stored the water either in plastic bottle or steel vessel with a lid and retrieved water by tilting the container. One household that followed only the boiling method stored water in an earthen pot with a lid and retrieved water by dipping a steel glass into the pot. 76% of the taps revealed contamination with coliforms, among which 36% confirmed with E. coli. The tilting and dipping method revealed 100% contamination with coliforms and E. coli. The data revealed that dipping was the only method followed among the Class-lV socioeconomic group as seen in Table 3. The Table 3 also shows that all the households from KHB colony, Nandangadda, and Sankriwada retrieved the drinking water from a tap. Tilting and dipping methods were seen in households belonging to Kajubag and Kodibag.
Table (3):
Drinking water purification methods followed by various communities belonging to different SES.
| Community | Socio-economic status | Drinking water purification method | Method of water retrieval | |||||||
|---|---|---|---|---|---|---|---|---|---|---|
| RO | RO + UV | Boiling | Filtration | None | Tap | Tilting | Dipping | |||
| Kajubag (n = 6) |
Class-I | 2 | – | – | – | – | 2 | – | – | |
| Class-II | – | – | – | – | – | – | – | – | ||
| Class-III | – | – | – | – | – | – | – | – | ||
| Class-IV | – | – | 2 | 1 | 1 | 1 | 2 | 1 | ||
| Total | 2 | 0 | 2 | 1 | 1 | 3 | 2 | 1 | ||
| KHB Colony (n = 6) |
Class-I | 2 | 3 | – | – | – | 5 | – | – | |
| Class-II | 1 | – | – | – | – | 1 | – | – | ||
| Class-III | – | – | – | – | – | – | – | – | ||
| Class-IV | – | – | – | – | – | – | – | – | ||
| Total | 3 | 3 | 0 | 0 | 0 | 6 | 0 | 0 | ||
| Kodibag (n = 6) |
Class-I | 3 | – | – | – | – | 3 | – | – | |
| Class-II | 1 | – | – | – | – | 1 | – | – | ||
| Class-III | – | – | – | 1 | – | – | 1 | – | ||
| Class-IV | – | – | – | 1 | – | – | 1 | – | ||
| Total | 4 | 0 | 0 | 2 | 0 | 4 | 2 | 0 | ||
| Nandangadda (n = 7) |
Class-I | 1 | 3 | – | – | – | 4 | – | – | |
| Class-II | 3 | – | – | – | – | 3 | – | – | ||
| Class-III | – | – | – | – | – | – | – | – | ||
| Class-IV | – | – | – | – | – | – | – | – | ||
| Total | 4 | 3 | 0 | 0 | 0 | 7 | 0 | 0 | ||
| Sankriwada (n = 5) |
Class-I | 2 | 2 | – | – | – | 4 | – | – | |
| Class-II | 1 | – | – | – | – | 1 | – | – | ||
| Class-III | – | – | – | – | – | – | – | – | ||
| Class-IV | – | – | – | – | – | – | – | – | ||
| Total | 3 | 2 | 0 | 0 | 0 | 5 | 0 | 0 | ||
| Grand Total | 16 | 8 | 2 | 3 | 1 | 25 | 4 | 1 | ||
All the households cleaned their water storage container; however, the frequency varied. 15 households who cleaned the container once in 6 months had 86.7% of coliforms, among which 46.7% confirmed with E. coli. Monthly cleaning was seen among 12 households (75% coliforms, among which 41.6% with E. coli), and weekly cleaning was followed by the remaining 3 households (66.7% coliforms and E. coli). 53.3% of the households showed no contamination at the point of consumption and had either installed RO or RO+UV, that showed better performance for water purification. Despite this fact, 8 households that had installed one of these two methods still revealed contamination at the point of consumption.
Well water sampling
Bacteriological analysis of well water
All the well water samples from 30 households were contaminated with coliforms and E. coli. The findings are similar to those conducted at Kathmandu valley and Udupi, where well water contamination was 94.7%8 and 92.5%9 with coliforms, including E. coli. This is in contrast with the studies from Tripura and Amritsar, where the contamination with coliforms was 77.8%10 and 25.7%,7 respectively. The highest rate of contamination noted in the present study could be due to repeated floods, heavy rains, improper sewerage systems, and seepage from septic tanks that are common in this area. Further, as most of the wells are open wells, bird droppings could also have been attributed to the contamination.
Chlorination of well water
In the present study, frequency of chlorination had no role on the contamination of well water. Statistical analysis also showed no significant association between frequency of chlorination and well water contamination, suggesting that water from the well was getting contaminated even when repeated chlorination was practiced. The findings from this study contrast with various other studies where the beneficial effect of chlorination of water was noted with reduction of fecal coliforms.21-23 The difference in the results could be due to faulty methods of chlorination, contamination of water post chlorination treatment, or high levels of contamination following heavy rains and floods during the study duration. The well water contamination was seen in all the households irrespective of the community and SES. The least frequency of well water chlorination was noted among class-IV households that belonged to Kajubag and Kodibag. Further statistical analysis revealed a significant association between the frequency of chlorination and socioeconomic status (p = 0.01), suggesting that socioeconomic status plays an important role in deciding the frequency of chlorination. This could be attributed to the financial constraints of the lower socioeconomic groups.
Sampling from the point of consumption (POC)
Bacteriological analysis of water at POC
80% of samples from POC were contaminated with coliforms among which 47% of samples revealed E. coli. The findings were in contrast with few studies where contamination with E. coli varied from 3.5% to 30%.24-26 The higher contamination rate found in the present study could be due to improper water treatment methods, unhygienic storage, and handling practices.
Highest rate of contamination at POC was seen among class-III and class-IV. Further statistical analysis revealed a significant association (p = 0.01) between contamination of water at POC and socioeconomic status, suggesting that socioeconomic status plays an important role in determining the water contamination at the household storage level. This could be attributed to poor education levels, poor sanitation practices followed among lower socioeconomic groups.
Various treatment methods followed before water consumption
Majority of the households belonging to class-I were residing at KHB colony, Nandangadda, or Sankriwada where RO or RO+UV systems was used for water purification showed the least contamination at POC. All the class-III and class-IV households belong to Kajubag and Kodibag areas. These households mainly followed boiling and filtration methods for drinking water purification and all of their samples showed contamination with coliforms and E. coli. Statistical analysis revealed a significant association (p = 0.03) between methods of purification and contamination at POC, suggesting that the purification method is key for maintaining water quality. Boiling the water at 100°C at atmospheric saturation pressure and use of candle filters are known to inhibit pathogens. However, the contrast findings in this study could be due to inadequate boiling, improper maintenance of filters, and faulty techniques followed for storage and handling post water treatment.
Water storage and handling practices
The tilting and dipping method revealed 100% contamination with coliforms and E. coli, which was mainly followed among the class-lV socioeconomic group. Statistical analysis supported the data by showing a significant association (p = 0.001) between the water retrieval method and SES. The contamination noted in this study for tilting and dipping methods among lower socioeconomic groups could be attributed to hand contamination while handling water. Further statistical analysis also showed a significant association (p = 0.03) between the method of water retrieval and contamination, suggesting that methods used for water retrieval have a significant effect in determining water quality. This suggests that a quantitative connection between microbial hand contamination and microbial stored water quality would be a better predictor, which is beyond the scope of this study.
Cleaning practices followed at POC
The frequency of cleaning the drinking water storage vessels in the present study had no role on the contamination of water at POC. Statistical analysis also revealed no association between the frequency of cleaning containers and contamination. Similar findings on post-collection contamination was also found in the study carried out by Wright et al., suggesting a compromise in water quality despite improved water cleaning and purification techniques. 12
53.3% of the households showed no contamination at the point of consumption and had either installed RO or RO+UV, that showed better performance for water purification. Despite this fact, 8 households that had installed one of these two methods still revealed contamination at the point of consumption. This may have occurred due to (i) Improper maintenance of the purification system, (ii) Improper cleaning of the retrieval point (tap), or (iii) Retrieval of water using contaminated hands. Hence, even if the frequency of cleaning the storage container was more, one of these reasons could have compromised the quality of clean, potable water.
Microbial contamination of drinking water from the source (well) and point of consumption was assessed. All the samples taken from the well revealed contamination with coliforms and E. coli. 80% of samples from the point of consumption revealed coliforms, among which 47% were confirmed with E. coli. The frequency of chlorination played no role on well water contamination. Among the various methods followed for water purification, filtration and boiling showed the highest contamination with coliforms, and E. coli and RO+UV showed the least contamination for E. coli. Contamination of water at the point of consumption had a significant association with both purification and water retrieval methods. Although RO/RO+UV were found to be relatively better performing, contamination was still observed despite increased cleaning frequency that suggests post-collection contamination. This necessitates policies that monitors water contamination not only at the source water but also at the point of consumption.
ACKNOWLEDGMENTS
The authors would like to thank the Indian Council of Medical Research (ICMR) for funding this project. The authors also thank all the staff, Department of Microbiology, KIMS, Karwar for their support.
CONFLICT OF INTEREST
The authors declare that there is no conflict of interest.
AUTHORS’ CONTRIBUTION
SKF conceptulize the study. SNS did the investigation and arranged the resources. MR, NG, SK did the formal analysis. MR, NG completed the data curation process. SKF, SG validated the results. SKF wrote the original draft. SG supervised, wrote, reviewed and edited the final manuscript. All authors listed have made a substantial, direct and intellectual contribution to the work, and approved it for publication
FUNDING
This project was supported by the Indian Council of Medical Research (ICMR) vide reference no. STS-2019-03584.
ETHICS STATEMENT
The study was approved by the Institutional Ethical Committee, Karwar Institute of Medical Sciences, Karwar, India.
AVAILABILITY OF DATA
The datasets generated and/or analysed during the current study are available from the corresponding author on reasonable request.
- United Nations. Goal 6: Ensure access to water and sanitation for all. United Nations. 2021. https://www.un.org/sustainabledevelopment/water-and-sanitation/. Accessed September 5, 2021.
- World Health Organization. Drinking-Water Factsheet.; 2019. https://www.who.int/news-room/fact-sheets/detail/drinking-water. Accessed date on 30-August-2021
- World Health Organization. Global Health Observatory Data Repository – Burden of Disease from Inadequate Water in Low- and Middle-Income Countries.; 2018. https://apps.who.int/gho/data/view.main.INADEQUATEWATERv?lang=en. Accessed date on 30-August-2021
- World Health Organization. Diarrhoeal Disease Factsheet.; 2017. https://www.who.int/news-room/fact-sheets/detail/diarrhoeal-disease. Accessed date on 1-September-2021
- World Health Organization. Guidelines for Drinking-Water Quality: Fourth Edition Incorporating the First Addendum.; 2017. Accessed date on 30-August-2021
- Collee JG, Duguid JP, Fraser AG, et al, eds. Mackie and McCartney, Practical Medical Microbiology. 14th ed. Churchill Livingstone Inc; 2012:883-921.
- Malhotra S, Sidhu SK, Devi P. Assessment of bacteriological quality of drinking water from various sources in Amritsar district of northern India. J Infect Dev Ctries. 2015;9(08):844-848.
Crossref - Prasai T, Lekhak B, Joshi DR, Baral MP. Microbiological Analysis of Drinking Water of Kathmandu Valley. Sci World. 2010;5(5):112-114.
Crossref - Mukhopadhyay C, Vishwanath S, Eshwara VK, Shankaranarayana SA, Sagir A. Microbial quality of well water from rural and urban households in Karnataka, India: A cross-sectional study. J Infect Public Health. 2012;5(3):257-262.
Crossref - Bhattacharjya H, Das SK, Majumder T, Mukhopadhyay BB, Baidya S, Debbarman DK. Bacteriological quality of water and diarrhoea among ethnic and non-ethnic communities of rural area of West Tripura, India. Int J Res Med Sci. 2017;5(4):1275-1281.
Crossref - World Health Organization. Boil Water. 2015. https://apps.who.int/iris/handle/10665/155821. Accessed date on 25-September-2021
- Wright J, Gundry S, Conroy R. Household drinking water in developing countries: a systematic review of microbiological contamination between source and point-of-use. Trop Med Int Heal. 2004;9(1):106-117.
Crossref - Census Population 2021. Uttara Kannada (North Canara) District : Population 2011-2021 Data – Corona Virus | Covid 19 Data.; 2021. https://www.census2011.co.in/census/district/269-uttara-kannada.html. Accessed date on 2-September-2021
- Office of the Registrar General & Census Commissioner India. Houselisting and Housing Census Data – 2011.
- Paniyadi GA. After deluge, Karwar thirsts for drinking water. Deccan Chronicle. 2019. https://www.deccanchronicle.com/nation/current-affairs/290819/after-deluge-karwar-thirsts-for-drinking-water.html. Accessed date on 4-September-2021
- Shirodkar VR, Marathe LL, Faldessai PD, Velip KK, Kalmo PP. Proposed Rural Water Supply and Sanitation System for Angadi Village, District Karwar, Karnataka. Int J Res Appl Sci Eng Technol. 2019;7(6):1142-1146.
Crossref - Directorate of Census Operations – Karnataka. District Census Handbook Uttara Kannada – Village And Town Wise Primary Census Abstract (PCA).; 2011. Accessed date on 25-September-2021
- Macy JT, Dunne EF, Luby SP, et al. Comparison of two methods for evaluating the quality of stored drinking water in Abidjan, Cote d’Ivoire, and review of other comparisons in the literature. J Water Health. 2005;3(3):221-228.
Crossref - Khairnar M, Kumar P, Kusumakar A. Updated BG prasad socioeconomic status classification for the year 2021. J Indian Assoc Public Heal Dent. 2021;19(2):154-155.
Crossref - Sastry A, Bhat S. Essentials of Medical Microbiology. 3rd ed. Jaypee Brothers Medical Publishers; 2021.
- Mengistie B, Berhane Y, Worku A. Household Water Chlorination Reduces Incidence of Diarrhea among Under-Five Children in Rural Ethiopia: A Cluster Randomized Controlled Trial. PLoS One. 2013;8(10):e77887.
Crossref - Ahmad MR, Ahmad AF, Sharma HK. Assessment of microbiological quality of drinking water treated with chlorine in the Gwalior city of Madhya Pradesh, India. African J Environ Sci Technol. 2015;9(5):396-401.
Crossref - Jain S, Sahanoon OK, Blanton E, et al. Sodium Dichloroisocyanurate Tablets for Routine Treatment of Household Drinking Water in Periurban Ghana: A Randomized Controlled Trial. Am Soc Trop Med Hyg. 2010, 82(1):16-22.
Crossref - Agensi A, Tibyangye J, Tamale A, Agwu E, Amongi C. Contamination Potentials of Household Water Handling and Storage Practices in Kirundo Subcounty, Kisoro District, Uganda. J Environ Public Health. 2019;2019:7932193.
Crossref - Lavanya V, Ravichandran S. Microbial contamination of drinking water at the source and household storage level in the peri-urban area of southern Chennai and its implication on health, India. J Public Health (Bangkok). 2013;21(5):481-488.
Crossref - Seino K, Takano T, Quang NKL, Watanabe M, Inose T, Nakamura K. Bacterial quality of drinking water stored in containers by boat households in Hue City, Vietnam. Environ Health Prev Med. 2008;13(4):198-206.
Crossref
© The Author(s) 2021. Open Access. This article is distributed under the terms of the Creative Commons Attribution 4.0 International License which permits unrestricted use, sharing, distribution, and reproduction in any medium, provided you give appropriate credit to the original author(s) and the source, provide a link to the Creative Commons license, and indicate if changes were made.