Abstract
Photovoltaic generation systems can automatically track the angle of sunlight. The system consists of four photovoltaic (PV) panels which can adjust pitch angle and azimuth angle according to the sunlight. The variation of the wind coefficient and wind load characteristics of the PV panels with the pitch angle and azimuth angle is obtained through the wind tunnel simulation based on FLUENT to determine the flow characteristics around the PV panels.
Highlights
- Use FLUENT to simulate the wind load of the photovoltaic panels.
- The variation of the wind coefficient and wind load characteristics of the photovoltaic panels with the pitch angle and azimuth angle is obtained.
- The best wind shelter attitude of photovoltaic panels can be obtained after obtaining wind load characteristics.
1. Introduction
With the rapid development of modern society and economy, traditional fossil fuels have been consumed in large quantities, and the increasing use of traditional fuels has also led to the increase of greenhouse gas emissions, the earth's ecological environment is facing a huge challenge. Solar energy has attracted the attention of all countries because of its wide distribution, clean and harmless [1].
The photovoltaic power generation system usually consists of one PV panel. In this paper the photovoltaic power generation system consists of four solar PV panels, which can increase the effective area of absorbing sunlight and improve the utilization rate of solar energy.
As an important part of the photovoltaic power generation system, the PV panels are usually suffered from higher wind loads and potential damage, wind load is the most important factor affecting the structure deformation of the photovoltaic power generation system. In this paper, the variation of the wind coefficient and wind load characteristics of the PV panels with the pitch angle and azimuth angle is obtained through the wind tunnel simulation based on FLUENT to determine the flow characteristics around the PV panels. This paper aims to find out the best wind shelter attitude of photovoltaic panels after obtaining wind load characteristics. When the wind speed is too high, solar photovoltaic panels can be adjusted to the best wind shelter attitude to resist excessive wind speed.
Due to the difficulties in determining wind force, there are few studies on wind load characteristics of the PV panels at present, and this study lays a foundation for future studies on the influence of fluctuating wind on solar photovoltaic panels.
2. Model and simulation method
2.1. Physical geometry and mesh
In this paper, the photovoltaic power generation system consists of four PV panels, the PV panels are 0.05 m long, 2 m wide and 2 m thick. The model of the PV panels is shown in Fig. 1.
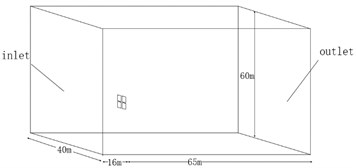
In order to ensure the full development of air in the fluid domain, the fluid domain should be large enough to ensure a certain distance between the boundary of the fluid domain and the PV panels, which can avoid the boundary of fluid domain to affect the reliability of simulation results. In order to judge better whether the size of the calculated field is reasonable, F. Baetke et al. proposed the concept of blocking rate [2]. When 3 %, the calculated field is considered to meet the requirement:
where is the effective windward area, is the cross-sectional area of the fluid domain. In this paper 16 m2, in order to ensure 3 %, 533.4 m2. The of the fluid domain selected based on experience are shown in Table 1.
Table 1The L×W×H of the fluid domain
Length / m | Width / m | Height / m | The cross-sectional area of inlet / m2 |
81 | 40 | 60 | 2400 |
The geometry of fluid domain is shown in Fig. 2.
Fig. 1Geometry of PV panels
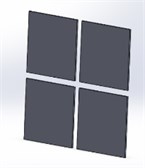
Fig. 2Geometry of fluid domain
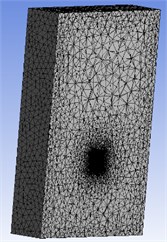
The geometry of fluid domain is imported into ANSYS Workbench and to be meshed, choosing mesh type as tetrahedron the generated mesh is shown in Fig. 3. The statistical result is that the number of nodes is 134932 and the number of elements is 740275. The average element quality is 0.84 > 0.8, which proves the element quality meets the requirement.
Fig. 3The mesh model of fluid domain
2.2. Boundary conditions and model settings
2.2.1. Inlet boundary condition
In the simulation, the velocity inlet is used as the boundary condition. Import a field function by velocity inlet to simulate wind profiles in different geomorphology and variations of wind speed. The incoming flow velocity is given by an exponential wind profile, varies with the vertical height , and the expression is:
where the , , , , are the average wind speed, the referenced wind speed, the referenced height, the calculated height, and the surface roughness index [3]. In this paper, 0.15, 20 m/s, 18 m.
2.2.2. Outlet boundary
Outlet boundary use outflow, which satisfies any physical quantity of a flow field with a normal gradient of zero along outflow surfaces.
2.2.3. Wall boundary
The upper and lower surfaces and ground surfaces of PV panels adopt wall boundary, which means that the airflow velocity at these walls is always 0.
The eddy viscosity model used in this paper is the standard - model. The standard - model has a small amount of computation and fast convergence, and is suitable for boundary layer flow, around flow and engineering problem with partial backflow. Therefore, the standard - model is chosen as the preferred model [4].
In the standard - model, when the flow is incompressible and factors such as buoyancy are not taken into consider, the transport equation of two unknowns and is:
where, is the term of caused by average velocity gradient, and is the term of caused by buoyancy. For incompressible fluid, ; is the contribution of pulsating expansion in compressible turbulence. For incompressible fluid, ; , , and are empirical constants; and are the Prandtl Numbers corresponding to k and. According to the experimental verification, the values of 1.44, 1.92, 0, 1.3, 1.0.
3. Results of analysis
Analyze the results in three aspects as follows:
– Analyze the variation of the wind flow around the PV panels with the pitch angle and azimuth angle;
– Analyze the variation of the wind coefficient and wind load characteristics of the PV panels with the pitch angle and azimuth angle through the wind tunnel simulation;
– According to the results the best shelter position of the PV panels can be determined.
3.1. Characteristics of wind flow around PV panels
It is known that the photovoltaic power generation system can change automatically change the pitch angle and azimuth angle with the change of the sunlight. In this paper, the working conditions of the photovoltaic power generation system can be divided into 5×8 = 40 types. Using different codes to represent different working conditions of the PV panels, the coeds are shown as Table 2.
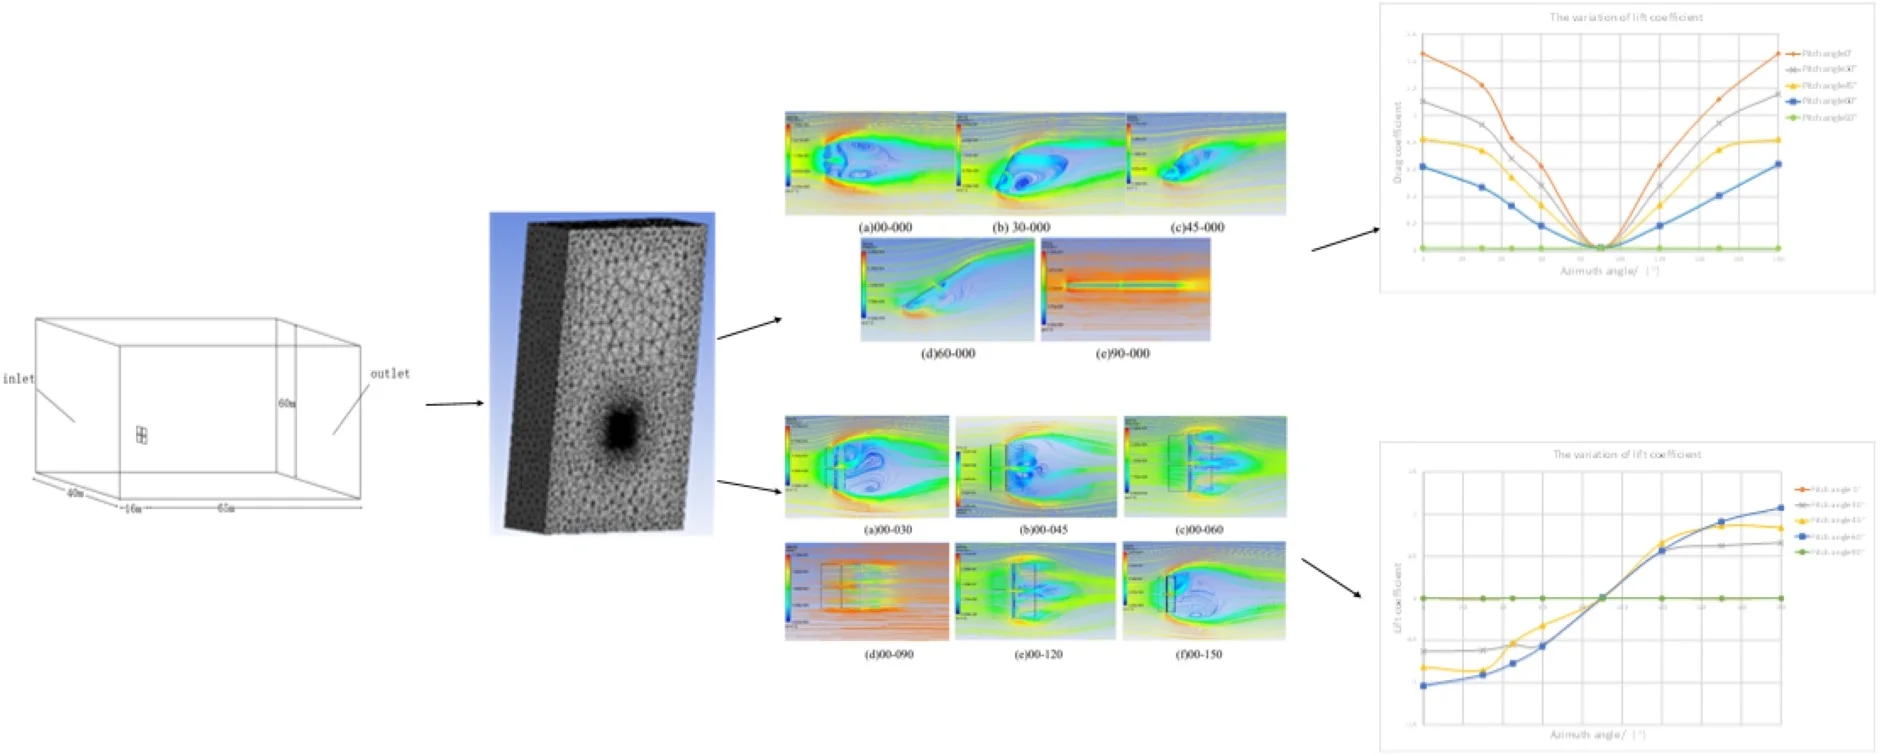
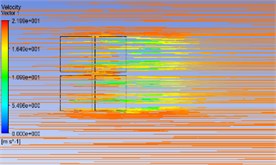
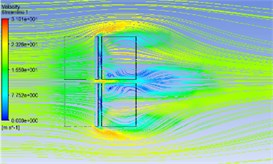
Firstly, the wind flow characteristics of PV panels with the same azimuth angle and different pitch angles are analyzed. The wind flow characteristics of PV plates with different angles are shown in Fig. 4 and Fig. 5.
Table 2The different codes of PV panels in different working conditions
Azimuth angle | Pitch angle | ||||
0° | 30° | 45° | 60° | 90° | |
0° | 00-000 | 30-000 | 45-000 | 60-000 | 90-000 |
30° | 00-030 | 30-030 | 45-030 | 60-030 | 90-030 |
45° | 00-045 | 30-045 | 45-045 | 60-045 | 90-045 |
60° | 00-060 | 30-060 | 45-060 | 60-060 | 90-060 |
90° | 00-090 | 30-090 | 45-090 | 60-090 | 90-090 |
120° | 00-120 | 30-120 | 45-120 | 60-120 | 90-120 |
150° | 00-150 | 30-150 | 45-150 | 60-150 | 90-150 |
180° | 00-180 | 30-180 | 45-180 | 60-180 | 90-180 |
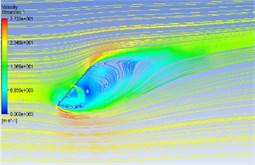
Fig. 4Wind flow streamline in different pitch angles
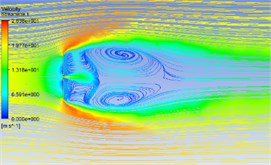
a) 00-000
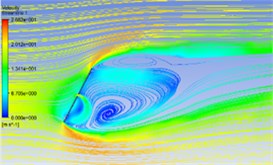
b) 30-000
c) 45-000
d) 60-000
e) 90-000
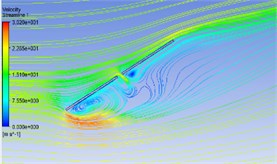
Fig. 5Wind flow streamline in different azimuth angles
a) 00-030
b) 00-045
c) 00-060
d) 00-090
e) 00-120
f) 00-150
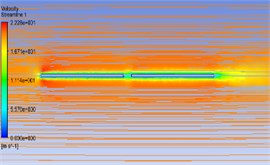
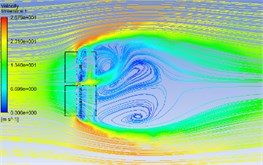
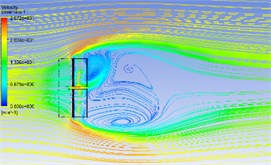
The Fig. 4 shows the wind flow distribution at the 19.6 m section of the PV panels with a pitch angle of 0° and different azimuth angles. The figure shows that in the 00-000 working condition the wind direction of the streamline vertical to the PV panels, the airflow will be blocked when it meets the PV panels, a variety of complex characteristics such as vortex shedding, backflow collision and airflow reattachment will occur on its edge and windward surface, so there are two symmetrical vortices on the back of a solar photovoltaic panel, and because of the gaps between the PV panels, the flow will form jets between the gaps, that is where the maximum wind speed will appear in the center gaps. The wind velocity between the bottom edge of the PV panels and the ground will increases due to “slit effect” which forms a large adverse pressure gradient specially in the condition of 30° pitch angle. With the increase of the pitch angle, the vortex scale and its influence range will decrease gradually. When the pitch angle increases 90°, the vortex has disappeared.
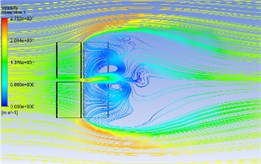
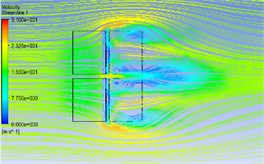
The Fig. 5 shows the wind flow distribution at the 19.6 m section of the PV panels with azimuth angle of 0° and different pitch angles. The figure shows that in the 00-030 working condition as there are gaps between PV panels, three asymmetric vortices are formed on the back of PV panels; one of the vortex is formed on the jet flow due to its fast speed, and two vortices are formed on the edges of the panels due to the "slit effect". When the azimuth angle is 60°, 90° and 120°, the wind flow in these azimuth conditions does not separate after obvious airflow impact at the windward front due to the significant reduction of the windward area. The average wind speed distribution is relatively gentle. The vortex distribution in the 00-150 condition is similar to that in the 00-030 condition.
3.2. The variation of wind coefficient of PV panels
The lift force and the drag force can be obtained through FLUENT numerical simulation. The lift force and the drag force are two main factors that will influence the strength of the PV panels.
Wind force is related to fluid density , wind speed , fluid viscosity and feature sizes , the function expression can be written as follows:
where is proportional to the area, is Reynolds number, , is wind coefficient [5]:
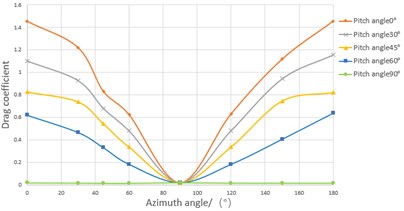
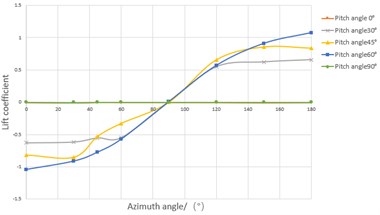
where represents the direction of the wind force. In this paper is the drag coefficient, is the lift coefficient. The variation of drag coefficient and lift coefficient with the pitch angle and azimuth angle of the PV panel is shown in Fig. 5.
Fig. 6The variation of wind coefficient with the pitch angle and azimuth angle
a)
b)
It can be seen from the figure that the drag coefficient presents an approximately symmetric distribution. The drag coefficient decreases gradually with the increase of azimuth angle when azimuth angle between 0° to 90° then increases gradually with the increase of azimuth angle when azimuth angle between 90° to 180°. The variation of lift coefficient at different azimuth angles is complicated. When the pitch angle is 0° and 90°, the lift coefficient doesn’t change significantly with the azimuth angle, and the lift coefficient is close to 0. When the pitch angle is 30°, 45° and 60°, the lift coefficient increases with the increase of azimuth angle when the azimuth angle between 0° to 90°. When the azimuth angle is greater than 90°, the sign of the lift coefficient changes that means the direction of lift force has been changed.
The results show that when the effective windward area decreases, the drag coefficient of photovoltaic panels will be decreased. Therefore, when the wind speed is too high, the drag force can be reduced by changing azimuth angle and pitch angle. It can be seen the lift coefficient and the drag coefficient are smallest in the 90-090 condition.
4. Conclusions
According to the result of the analysis, there are three conclusions as follows:
1) With the increase of the pitch angle, the vortex scale and its influence range will decrease gradually. When the pitch angle increases to 90°, the vortex has disappeared. When the azimuth angle is 60°, 90° and 120°, the wind flow in these azimuth conditions the average wind speed distribution is relatively gentle.
2) The drag coefficient presents an approximately symmetric distribution. When the azimuth angle is greater than 90°, the sign of the lift coefficient changes that means the direction of lift force has been changed.
3) It can be seen the lift coefficient and the drag coefficient are smallest in the 90-090 condition. The best shelter position of the PV panels is the 90-090 condition.
References
-
Kumar Saha Proshit, Akihito Yoshida, Rei Okada, Yukio Tamura Reduction of mean wind forces on photovoltaic system using aerodynamic appendages. KSCE Journal of Civil Engineering, Vol. 22, 2018, p. 3395-3400.
-
Arzhanov Kirill V. Tracking autonomous photovoltaic installations for sun under action of wind load. International Ural Conference on Electrical Power Engineering, 2019, p. 143-147.
-
Jubayer Chowdhury Mohammad, Hangan Horia Numerical simulation of wind effects on a stand-alone ground mounted Photovoltaic (PV) system. Journal of Wind Engineering and Industrial Aerodynamics, Vol. 134, 2015, p. 56-64.
-
Bender W., Waytuck D., Wang S., Reed D. A. In situ measurement of wind pressure loadings on pedestal style rooftop photovoltaic panels. Engineering Structures, Vol. 163, 2018, p. 281-293.
-
Gibbons Mike, Gamble Scott, Browne Matthew T. L., Brooks Albert, Xypnitou Eleni Determining wind loads on solar arrays using boundary layer wind tunnel testing. Proceedings, Annual Conference – Canadian Society for Civil Engineering. Canadian Society for Civil Engineering, Vol. 3, 2015, p. 1750-1759.
About this article

