Mesenchymal Stem Cell Culture and EV Isolation
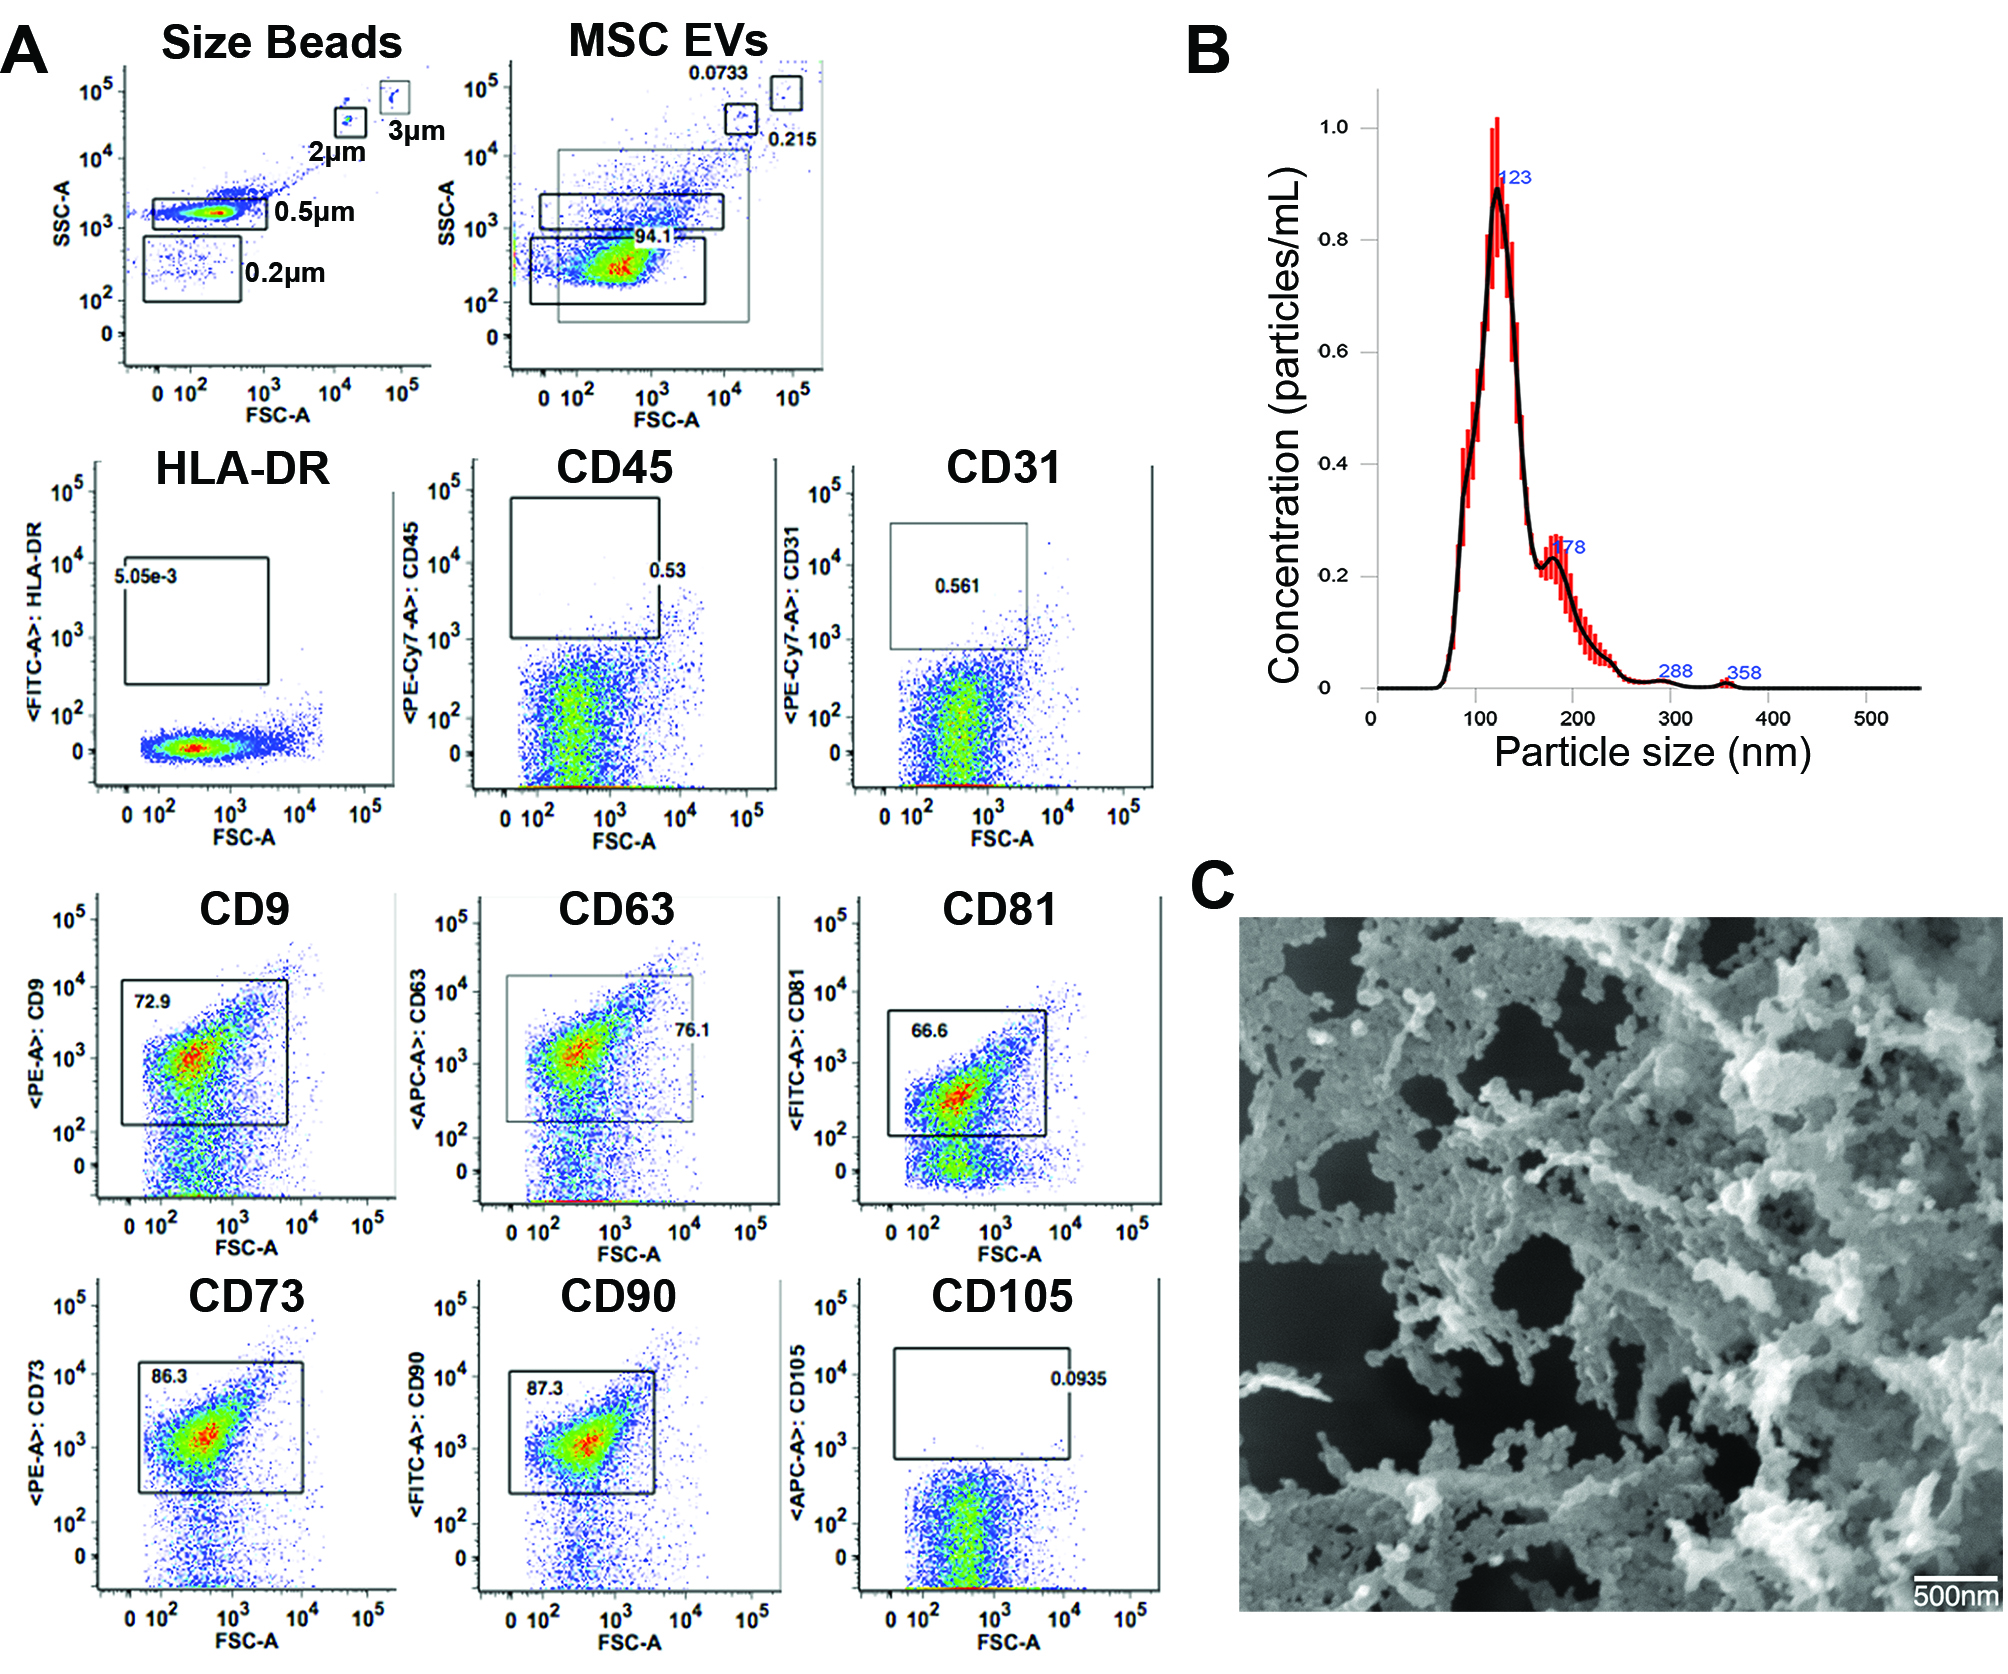
Human bone marrow-derived MSCs (passage 1) were obtained from Rooster Bio Inc. (Frederick, MD) and expanded initially on a Terumo Quantum Device (Terumo, Lakewood, CO) to generate passage 2 cells that were used in all studies. MSCs were grown in Mesenchymal Stem Cell Growth Medium 2 (PromoCell, Heidelberg, Germany) and maintained at 37°C and 5% CO2 in a humidified incubator. To isolate MSC EVs, the MSCs were grown to 80% confluence, then serum-starved for 48 hours. The MSC conditioned media (CM) was collected and centrifuged at 1500g x 10 minutes to remove cellular debris, then filtered using a 0.22μm filter. EVs were isolated from the MSC CM using a Tangential Flow Filtration System with the Pellicon® XL50 Cassette with Biomax® 500 kDa Membrane (MilliporeSigma, Burlington, MA). A subset of the isolated EVs were further concentrated using an Amicon Ultra-2 Centrifugal Filter 3K Device (MilliporeSigma) according to manufacturer instructions for use in the in vitro experiments. Aliquots of isolated EVs were stored at -80°C. The MSC EVs used in this study were previously characterized by flow cytometry, nanoparticle tracking analysis, and spectrophotometry as previously described,12 and scanning electron microscopy images were also captured for this study (Supplemental Figure 1).
Pulmonary Endothelial Cell (PEC) and Caco-2 Intestinal Epithelial Cell Culture
Human pulmonary microvascular endothelial cells (PECs) were obtained from PromoCell and grown in Endothelial Cell Growth Medium MV2 (PromoCell). Passages 3-7 were used in all experiments. Caco-2 human intestinal epithelial cells were obtained from American Type Culture Collection (ATCC, Manassas, VA) and were grown in Eagle’s Minimum Essential Medium (ATCC) supplemented with 20% Fetal Bovine Serum and 1% penicillin/streptomycin. Passages 2-5 were used in all experiments. Both cell lines were maintained at 37°C and 5% CO2 in a humidified incubator
In Vitro Pulmonary Endothelial Cell (PEC) Monolayer Barrier Integrity and Intercellular Junction Immunostaining
Pulmonary endothelial cell (PEC) monolayer barrier integrity was measured in vitro using an electric cell-substrate impedance sensing system (ECIS 1600, Applied BioPhysics, Troy, NY). To evaluate the PEC monolayer, PECs (50,000 cells per well) were seeded onto a 96-well plate containing electrodes that had been pre-treated with L-cysteine and were grown to confluence. The PEC monolayers were serum-starved for one hour and once resistances had stabilized were then pre-treated with MSC control media (10% or 20% v/v), MSC CM (10% or 20% v/v), or MSC EVs (10 or 30 μg/ml). After 30 minutes the PEC monolayers were challenged with thrombin at 0.2u/ml to induce paracellular permeability. Resistances were measured in 5-minute intervals at 4000 Hz. Data were normalized to the mean resistance of the monolayers before the treatments. Resistance tracings and area under the curve (AUC) plots were generated for each treatment group to compare monolayer integrity.
To evaluate intercellular junction integrity of the PEC monolayer, PECs were separately grown on cover slips (coated with collagen type 1) in 24-well plates (50,000 cells per well). The wells were pre-treated with MSC control media (10% or 20% v/v), MSC CM (10% or 20% v/v) or MSC EVs (30 μg/ml) for 30 minutes then challenged with thrombin 0.2u/ml. 5 min after the addition of thrombin, the cells were washed three times with PBS then fixed with 4% PFA. Immunostaining was then performed using antibodies against VE-cadherin (Cell Signaling, Danvers, MA) and Zonula Occludens-1 (ZO-1, Abcam, Burlingame, CA). F-actin was detected with Texas Red Phalloidin (Cell Signaling). Representative images were captured using a Nikon Eclipse 80i microscope (Nikon, Melville, NY) with an RT-scmos camera (SPOT Imaging, Sterling Heights, MI).
In Vitro Caco-2 Intestinal Epithelial Cell Monolayer Barrier Integrity and Intercellular Junction Immunostaining
To evaluate the Caco-2 intestinal epithelial monolayer, Caco-2 cells (25,000 cells per well) were seeded onto a 96-well plate for ECIS as above and grown to confluence. The Caco-2 monolayers were serum-starved for 2 hours and once resistances had stabilized were then pre-treated with MSC control media (10% or 25% v/v), MSC CM (10% or 25% v/v), or MSC EVs (10, 30, or 50 μg/ml). After 30 minutes the Caco-2 cell monolayers were challenged with hydrogen peroxide (H2O2) at 2.5mM to cause oxidative stress; this dose was chosen based on preliminary studies in the lab showing decreased resistance across the monolayer in this model. Resistances were measured in 4-minute intervals at 1000 Hz. Data normalization, resistance tracings, and AUC plot generation were conducted as above.
To evaluate intercellular junction integrity of the Caco-2 monolayer, Caco-2 cells were separately seeded on to 24-well plates (80,000 cells per well). The cells were pre-treated with MSC control media (10% or 25% v/v), MSC CM (10% or 25% v/v) or MSC EVs (30 μg/ml) for 30 minutes then challenged with H2O2 2.5mM. 2.5 hours after exposure to H2O2, the cells were washed three times with PBS then fixed with 4% PFA. Immunostaining was then performed using antibody against ZO-1 (Abcam), and F-actin was detected using Texas Red Phalloidin (Cell Signaling). Representative images were captured using a Revolve microscope (Echo Inc., San Diego, CA).
Animal Studies
Animal studies were performed with approval of the Institutional Animal Care and Use Committee (IACUC) at UCSF. The experiments were conducted in compliance with the ARRIVE guidelines for animal models and the National Institutes of Health (NIH) guidelines on the use of laboratory animals. All animals were house in a room with access to food and water ad libitum, controlled temperature, and 12:12-hour light-dark cycles.
Mouse Model of Hemorrhagic Shock and Trauma
Male C57BL6 mice, 8-12 weeks old, were obtained from The Jackson Laboratory (Sacramento, CA) (N=20 total). Mice underwent an established model of HS/T.12,20,21 Briefly, the mice were anesthetized with isoflurane and maintained at a body temperature between 35°C and 37°C using a heating plank. The bilateral femoral arteries were cannulated with heparinized catheters, one for continuous blood pressure monitoring (PowerLab 7, AD Instruments, Dunedin, New Zealand), and the other for blood withdrawal and resuscitation. A 2cm midline laparotomy was also performed to induce additional trauma. Mice were subsequently bled to a mean arterial pressure (MAP) of 35mmHg for 90 minutes and then resuscitated with a 200μL fluid bolus containing 1) lactated Ringer’s (LR), 2) 1 x 10⁶ MSCs in LR, or 3) MSC EVs (30μg) in PBS. These doses were chosen based on previous work demonstrating efficacy of MSC and MSC EVs in this model.12,21 Sham mice underwent cannulation without laparotomy or hemorrhage. Mice were monitored hemodynamically for an additional 30 minutes after resuscitation. Two hours post-resuscitation, the mice were re-anesthetized with isoflurane. Blood was collected via cardiac puncture and the mice were perfused with 10mL of ice-cold PBS. Sodium citrate 3.2% was added to the blood in a 1:9 ratio prior to centrifugation at 3000g for 10 minutes to isolate the plasma fraction, which was stored at -80oC. The lungs and a segment of small intestine were harvested and flash-frozen in isopentane and stored at -80oC.
Intercellular Junction Immunostaining of the Small Intestine and Lungs
The lungs and small intestine from N=5 mice per group were sectioned at 10μm thickness. The sections were fixed in ice-cold 95% EtOH for 20 minutes then 100% acetone for 1 minutes. Immunostaining was then performed using antibodies against the adherens junction protein VE-cadherin (R&D Systems, Minneapolis, MN) and the tight junction proteins ZO-1 (Abcam, Burlingame, CA) and claudin-4 (Thermo Fisher, Waltham, MA). Sections were imaged in a blinded fashion with a Nikon Eclipse 80i microscope (Nikon) with an RT-scmos camera (SPOT Imaging), and representative images were selected from each animal for qualitative comparison.
Plasma Inflammatory Biomarker Analysis
Mouse plasma samples (N=5 per group) were analyzed using a custom multiplex Luminex® Discovery Assay Kit (R&D Systems, Minneapolis, MN) according to the manufacturer’s protocol. The following analytes were included: Angiopoietin-2 (Ang-2), C-X-C Motif Chemokine Ligand 10 (CXCL10), CXCL12, Intercellular Adhesion Molecule-1 (ICAM-1), Interferon gamma (IFN-γ), Interleukin-1beta (IL-1β), IL-2, IL-4, IL-6, IL-6 receptor alpha (IL-6Ra), IL-10, Matrix Metalloproteinase-8 (MMP8), MMP9, Syndecan-1, Tumor Necrosis Factor alpha (TNFα), TNF Receptor Superfamily Member 1a (TNFRSF1a), TNFRSF1b, TNF Superfamily Member 13b (TNFSF13b), and Vascular Endothelial Growth Factor (VEGF). Plasma samples were thawed and centrifuged at 16,000g for 4 min prior to use. Samples were then diluted 1:2 and 1:10 in appropriate diluent and pipetted onto a 96-well plate, mixed with magnetic beads coated with antibodies, and incubated for 2 hrs at room temperature on a horizontal orbital microplate shaker at 800rpm. Three washes with wash buffer were performed, then the beads were incubated with the biotinylated antibody cocktail for 1 hr at room temperature on the orbital shaker at 800rpm. After another three washes, the beads were incubated with streptavidin-PE for 30 minutes on the shaker. The beads were washed a final three times then resuspended in wash buffer prior to being read on a MAGPIX System (Luminex Corp., Austin, TX). xPONENT 4.2 software (Luminex Corp.) was used for data acquisition.
Statistical Analysis
Area under the curve values for the in vitro experiments were compared using one-way ANOVA with Tukey’s post hoc tests. Mean arterial pressures (MAPs) were compared using repeated measures two-way ANOVA with Tukey’s multiple comparisons test. For the plasma biomarker analysis, first outliers were removed using the ROUT method in Prism 9.0 (GraphPad Inc., San Diego, CA) and data were assessed for normality using the Shapiro-Wilk test. One-way ANOVA with post-hoc Tukey’s test was used for normally distributed data, and Kruskal-Wallis testing with Dunn’s multiple comparisons test was used for data that did not pass the normality testing. P<.05 was considered significant. All analyses were performed using Prism 9.0. Data in this manuscript are presented as mean ± SD.