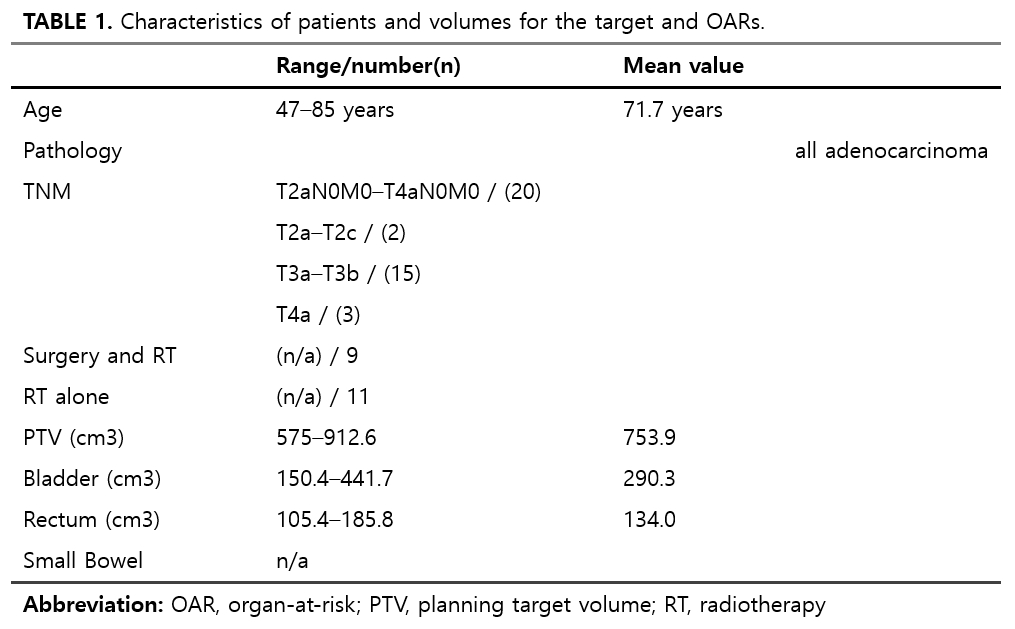
Table 1 presents the characteristics of patients and volumes for the target areas and OARs. The age range of the participating patients was between 47 and 85 years, with an average age of 71.7 years. All patients were diagnosed with adenocarcinoma. According to the TNM classification, 20 patients were in the range of T2aN0M0 to T4aN0M0, 2 were between T2a and T2c, 15 were between T3a and T3b, and 3 were diagnosed with T4a. 9 patients underwent both radiotherapy and surgery, while 11 patients received radiotherapy alone. The PTV ranged from 575 cm³ to 912.6 cm³ with an average of 753.9 cm³, the bladder volume varied from 150.4 cm³ to 441.7 cm³ with an average of 290.3 cm³, and the rectum volume was between 105.4 cm³ and 185.8 cm³, averaging 134.0 cm³. Specific data regarding the small bowel was not provided.
Table 1. Characteristics of patients and volumes for the target and OARs.
In this investigation, individualized treatment plans were developed for each of the 20 patients, incorporating diverse CRAs. Subsequently, the resulting CN and HI underwent a thorough multivariate analysis.
The statistical assessment, utilizing t-test, aimed to detect any noteworthy variations in treatment outcomes associated with different CRAs. However, the obtained p-values for the multivariate tests exceeded the significance threshold of 0.05.
This suggests that the selected CRAs did not induce statistically significant differences in CN and HI within the patient cohort. Upon scrutinizing the mean values and standard deviations provided in Table 2, it is evident that, notwithstanding the diversity in CRAs, the overall conformity and homogeneity of the dose distribution in the PTV were not significantly impacted by the chosen rotation angles.
These findings suggest that, within the confines of this study, adjustments to the CRA did not yield substantial variations in the conformity and homogeneity of the administered radiation dose to the target volume.
Consequently, the selection of CRA may not emerge as a pivotal factor influencing treatment efficacy in terms of PTV dose distribution for the examined patient population.
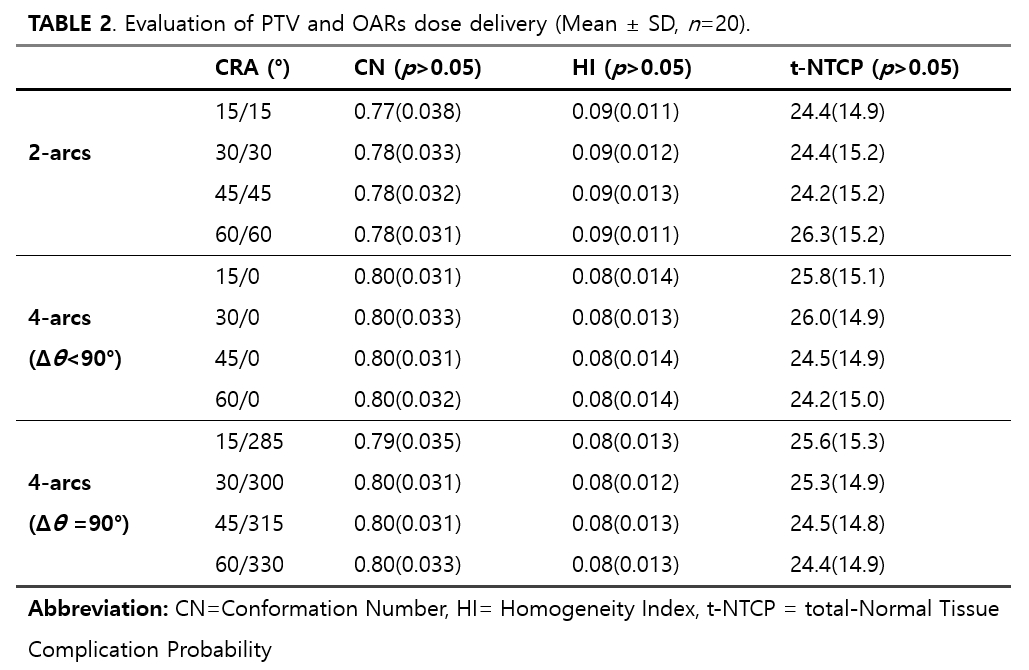
Table 2. Evaluation of PTV and OARs dose delivery (Mean ± SD, n = 20).
Table 2 presents an evaluation of dose delivery to PTV and OARs under different CRAs in 2-arcs and 4-arcs configurations. In terms of CN, the 2-arcs setup shows values ranging between 0.77 and 0.78, while the 4-arcs setup maintains a more consistent level around 0.80 in most cases. This suggests that the 4-arcs setup may have slightly better radiation conformity to the target volume compared to the 2-arcs setup, although the difference is not substantially significant.
Regarding the HI, both the 2-arcs and 4-arcs setups maintain similar ranges, predominantly between 0.08 and 0.09. This indicates that both configurations achieve a comparable level of dose uniformity within the PTV.
In the context of total-NTCP (t-NTCP), the 2-arcs setup generally varies from 24.4 to 26.3, whereas the 4-arcs setup exhibits values between 24.2 and 26.0. These figures demonstrate that there is no significant difference in overall treatment toxicity between the two configurations. Additionally, within the 4-arcs setting, there is little variation in t-NTCP values between configurations with Δθ < 90° and Δθ = 90°.
Overall, while the 4-arcs setup shows a slight advantage in radiation conformity to the PTV over the 2-arcs setup, both configurations offer stable treatment toxicity profiles, as evidenced by their t-NTCP values, without significant differences between them.
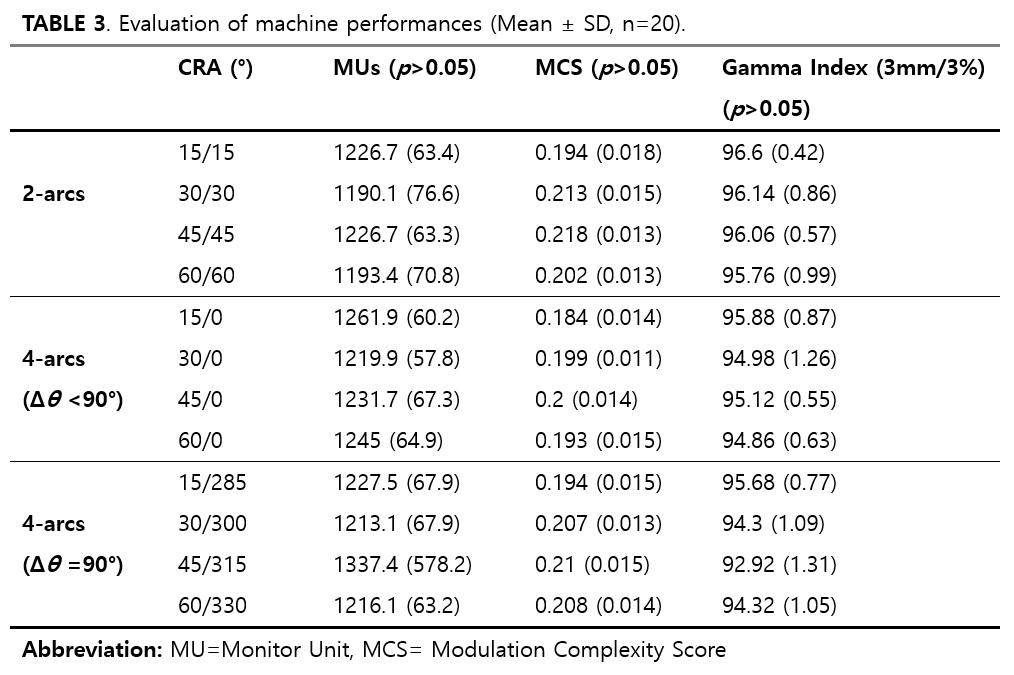
Table 3. Evaluation of machine performances (Mean ± SD, n = 20).
Table 3 presents an analysis of machine performance parameters, including Monitor Units (MUs), MCS, and Gamma Index, across various CRAs in both 2-arcs and 4-arcs configurations. In terms of MUs, the 2-arcs setup shows a slight variation across different angles, ranging from 1190.1 to 1226.7. In contrast, the 4-arcs setup demonstrates a broader range, with a notably higher MU value of 1337.4 at the 45°/315° CRA. This indicates increased beam complexity or intensity in the 4-arcs setting, especially at specific angles.
Regarding MCS, the values fluctuate across different angles for both configurations. However, there is no clear trend indicating a significant difference between the 2-arcs and 4-arcs setups in terms of complexity. The MCS values generally remain within a narrow range, suggesting a comparable level of complexity across the different settings.
The γ-index, a measure of treatment accuracy, varies slightly across different CRAs. In the 2-arcs configuration, the Gamma Index remains relatively high and consistent, indicating good treatment accuracy. The 4-arcs setup, particularly at Δθ = 90° angles (such as 45°/315°), shows a lower Gamma Index, suggesting a potential decrease in accuracy at specific angles.
Overall, the results in Table 3 illustrate that while there is some variation in machine performance parameters across different CRAs and configurations, the differences are not markedly substantial. However, specific angles in the 4-arcs setup, particularly at Δθ = 90°, may present challenges in terms of increased beam complexity and slightly reduced accuracy, as indicated by higher MUs and lower γ index values.
Figure 3. This heatmap illustrates the correlation coefficients between various pairs of collimator rotation angle and selected clinical variables.
Figure 3 illustrates the correlation analysis between various collimator rotation pairs and multiple variables in patient treatment plans. Notably, the MCS, γ-index values, and HI values exhibited higher correlations among these variables. Specifically, the MCS showed a notably positive correlation with certain CRAs, like 30°/30° and 45°/45°. The γ-index value, indicative of dose delivery accuracy, was more strongly correlated with 2-arcs than 4-arcs, demonstrating an enhanced association with lower angles, particularly at 15°/15°. Similarly, the Homogeneity Index, essential for uniform dose distribution within the target volume, displayed a higher correlation with 2-arcs and favored lower angles such as 15°/15°.
Contrastingly, the dose variables related to the bladder and rectum did not exhibit a consistent correlation pattern, suggesting that the protection of risk organs like the bladder and rectum is less impacted by variations in collimator rotation angles.
Figure 4. Machine learning analysis of variable impact on CRAs. (a) Presents the Mean Relative Error for different CRAs, showcasing the variability in the model's predictive accuracy with respect to different collimator rotation pairs. (b) Demonstrates the Feature Importances from a Random Forest algorithm, revealing the relative impact of various planning variables on the CRAs' predictions.
Figure 4(a) presents the percentages of mean relative error for various CRAs in the context of radiotherapy. These figures represent the accuracy of the predictive model, indicating how closely the model's predictions matched the actual clinical data. The lowest mean relative error is observed for the 15°/0° at 10.43%, indicating that the model's predictions were closest to the actual values for this collimator angle. This could represent a more consistent or predictable pattern of treatment outcomes at this angle. Conversely, the highest mean relative errors are observed for the 15°/285° and 45°/315° at 12.72% and 12.58%, respectively. The remaining CRAs exhibit mean relative errors ranging from 11.06–11.91%, indicating that specific angles do not significantly impact the performance of the model.
Figure 4(b) illustrates the feature importances derived from a Random Forest model. The MCS stands out with the highest importance, approximately 0.19, suggesting its predominant impact on the model's predictions. Following MCS, the γ- index shows significant importance at 0.07. Various dose levels received by the bladder and rectum (D15%, D25%, D35%, D50%), along with the mean doses to the bladder, rectum, and small bowel, exhibit importance values from 0.01 to 0.05. These values indicate the comparative influence of each feature within the model, with a higher value denoting greater contribution to the model's predictive capabilities.