The raw material
Fenugreek seed samples were acquired from the local Hail market in 2023. The samples were collected from the retailer's store to prevent contamination from dust and dirt and to preserve the spices' flavor and color, which can be affected by direct sunlight exposure.
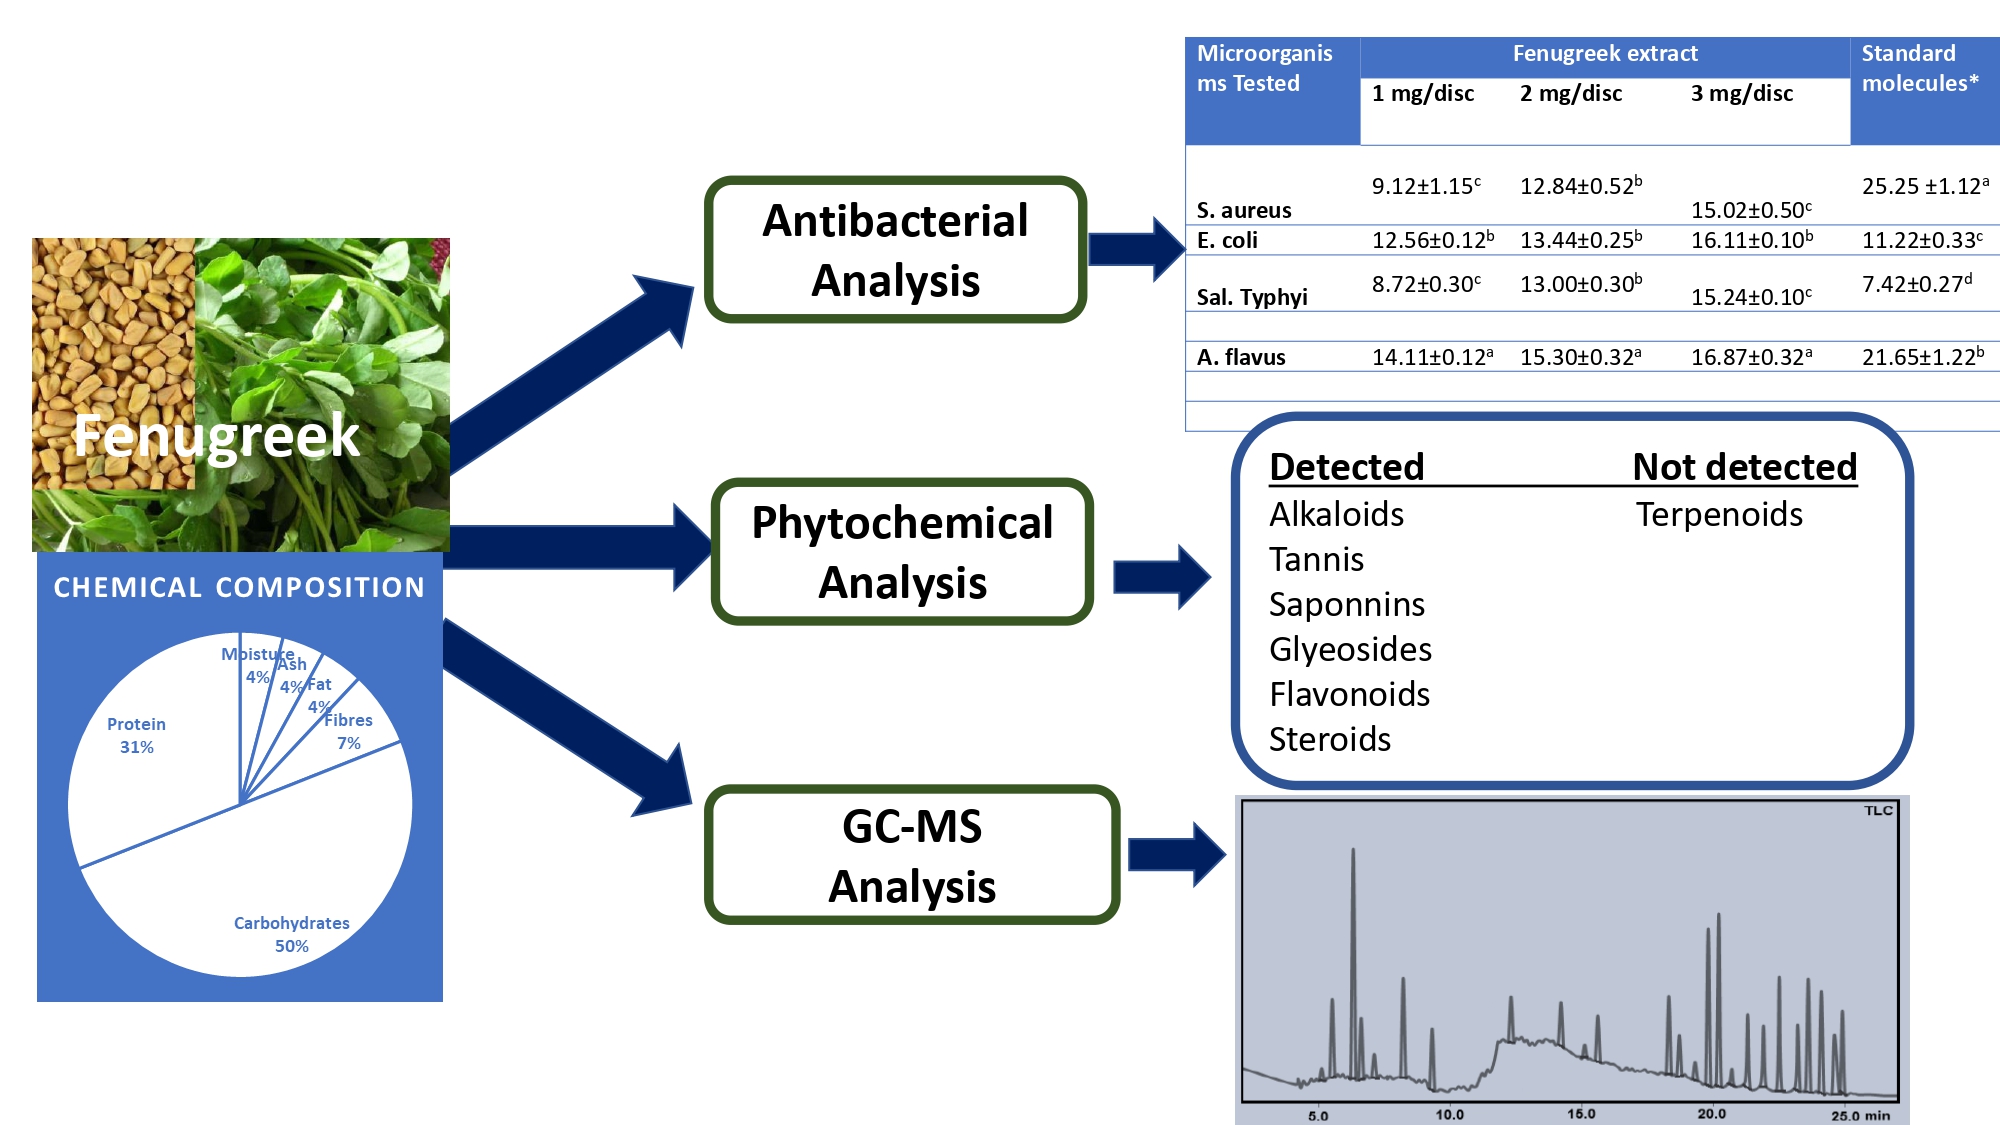
Proximate analysis
Proximate analysis examines and evaluates a substance or material's essential components or constituents.
The moisture, protein, fiber, ash, and fat contents of the dried fenugreek seed samples were determined using the AOAC (2010) procedures. The carbohydrate content was computed by subtracting the combined percentages of moisture, protein, fiber, ash, and fat from 100. The trials were conducted in triplicates, and subsequently, the means were computed.
Extraction of fenugreek seed oil and estimation of its physicochemical properties
Fenugreek seed oil was extracted using n-hexane, following the AOCS (1971) method, utilizing the Soxhlet apparatus. The experiment was repeated multiple times until enough data was collected for further analysis.
The physicochemical examination of fenugreek seed oil was conducted by the Standard Methods for Examination of Fats, Oils, and Derivatives (1979). The analysis involved the acid value, saponification number (expressed in milligrams of potassium hydroxide per gram of oil), ester value, free fatty acids (measured as oleic acid per 100 grams of oil), and the refractive index at a temperature of 37°C. The essential oils were extracted from fenugreek seeds using hydro-distillation utilizing a Clevenger-type apparatus for 3 hours. The essential oil was dried using anhydrous Na2SO4 and then stored in a sealed vial in a dark place at a temperature of 4°C. The essential oil yield was determined using the gravimetric approach by calculating the dry weight (Benhammou et al., 2017).
Preparation of Microbial specimens
The efficacy of fenugreek oil was evaluated against a single strain of gram-positive bacterium, S. aureus, and two strains of gram-negative bacteria, E. coli and Sal. typhimurium, and one strain of mold, A. flavus. The bacteria used in the experiment were acquired from the Food Microbiology Laboratory at the University of Gezira.
Cultivation of the test organisms
The surface viable counting technique determined the average concentration of viable organisms per milliliter (mL) in the stock suspensions. For each trial, a new stock suspension was prepared, ensuring that the experimental settings remained consistent. This allowed us to obtain suspensions with remarkably similar viable counts. The A. flavus fungal culture was cultivated on Saboraud dextrose agar and incubated at 25ºC for four days. The mycelium was collected and rinsed with sterile isotonic saline solution, then resuspended in 100 mL of sterile isotonic saline solution. The resulting suspension was refrigerated for future use.
Testing of plant extract for antimicrobial activities
The antibacterial and antifungal properties of the plant extract were assessed using the agar well diffusion method, as demonstrated by Daoud et al. (2019) and Abdel-Rahim & Abdel Moneim (2010). A volume of 1 ml of a recently cultivated bacterial or fungal culture was transferred using a pipette and placed at the center of a sterile Petri dish. Subsequently, the inoculum was combined with molten cooled Muller Hinton agar (MHA) for bacteria strains or Potato dextrose agar (PDA) for fungi in a Petri plate, ensuring thorough mixing. After the agar plates containing inoculums solidified, wells were created using a sterile cork borer with a diameter of 6 mm.
The plates were incubated at 37°C for 24 to 48 hours. The fenugreek seed extract was applied on sterile discs using three different dosages (1 mg, 2 mg, and 3 mg per disc). Every concentration was evaluated three times against the target species. The growth inhibition diameter zones were recorded together with the average and the mean values after incubation. Ampicillin and amphotericin B were used as reference molecules.
Phytochemical profiles
Following Raaman (2006) and Banso and Adeyemo (2006) procedures, phenols, tannins, alkaloids, flavonoids, terpenoids, sterols, cardiac glycosides, and saponins were found in fenugreek seeds.
Phenols
Ten ml ethanol extract was added to 3 drops of 5% FeCl3. A bluish-black color implies phenolic chemicals.
Alkaloids
There were two ways to detect alkaloids:
In Dragendorff's test, 500 µl of Dragendorff's reagent was added to 5 ml of ethanol extract along the test tube side after adding 2 ml MeOH and 2 ml 1% HCl. Orange or orange reddish-brown precipitate indicated a positive result. The extract was tested with two drops of Mayer's reagent in 1 ml. White or creamy precipitate indicates alkaloids.
Flavonoids
Adding 2 ml NaOH 2% to 5 ml extract made it intensely yellow. The hue disappears when diluted HCl is added, indicating flavonoids.
Salkowski-tested terpenes
Mixing 5 ml extract with 2 ml chloroform. Then 3 ml conc. H2SO4 was added. A reddish-brown colour implies terpenoids.
Steroids
Five ml extract with two ml H2SO4 received two ml glacial acetic anhydride. Colour changes from violet to blue or green suggest steroids.
Keller-Kiliani glycosides
Three drops of 5% FeCl3 and one millilitre of glacial acetic acid were added to 2.5 millilitres of extract. On the side of the test tube was put 0.5 ml of concentrated H2SO4. Cards containing cardiac glycosides will be coloured green or blue.
Saponins
We added 10 ml distilled water to 3 g seed powder. Five minutes were spent shaking the solution. Stable foam indicates saponins.
Tannins
Three drops of 5% FeCl3 solution were added to 2 ml of diluted extract. The green, black, or blue colour indicated tannins.
G.C.–M.S. analysis
The GC-MS study used a Perkin Elmer Clarus 600 GC System with an Rtx 5MS capillary column (30 m 0.25 mm i.e. 0.25 m film thickness; max. temp. 350 ◦C) and Clarus 600C MS. The carrier gas was ultra-high-purity helium (99.9999%) flowing at 1.0 mL/min. Ion source, transfer line, and injector temperatures were 280, 270, and 270 ◦C. This gas ionized at 70 eV. The EM voltage was estimated using autotune. Every data came from full-scan mass spectra between 40 and 550 amu.
Analysis conditions
The split ratio of 1 L injected sample was 10:1. The oven was programmed to maintain 280°C for 25 minutes at 80°C each minute from 60°C. Conditions for G.C.–M.S. leaf oil analysis: As noted, G MS detected FAME molecules. The helium flow was 0.7 mL/min. The ion source, transfer, and injector were heated to 250, 250, and 220°C. After starting at 50°C (kept for 1 minute), the oven was heated to 250°C at 40°C per minute. All data was collected by obtaining full-scan mass spectra from 35 to 500 amu. Spectra were compared to mass spectral libraries to identify compounds (Idriss et al., 2022). We used manufacturing conditions to determine the system's calibration and minimal detection limits (Al-Huqail et al., 2018).
In-silico Study
The antimicrobial and antioxidant activities of the fenugreek seed oil were also assessed using silico modeling and interaction assay. For this purpose, the TyrRS from S. aureus (1JIJ), the aspartic proteinase from C. albicans (2QZW), and human peroxiredoxin 5 (PRDX5, 1H2D) have been retrieved from RCSB data bank. Then, the active sites of these receptors were targeted to study the antibacterial, antifungal, and antioxidant effects, respectively. ChemDraw was used to draw the chemical structures of the fenugreek seed oil and identify phytochemicals if the compound did not exist on the PubChem website. The docking approach was carried out based on the CHARMm force field as previously published (Ben Saad et al., 2023; Rahmouni et al., 2024; Mhadhbi et al., 2023; Alreshidi et al., 2023) following the preparation of both ligands and receptors by removing water molecules and supplementing both polar hydrogens and Kollman charges... The assessment of binding scores bond categories were realized as previously reported Ben Saad et al., 2023; Mhadhbi et al., 2023; Alreshidi et al., 2023) 1JIJ, 2QZW, and 1H2D have been selected as they are commonly associated with the pathogenesis of infectious diseases, particularly from S. aureus and C. albicans and pro-antioxidant pathways (Ben Saad et al., 2023; Rahmouni et al., 2024; Mhadhbi et al., 2023; Idriss et al., 2022).
Bioavailability and pharmacokinetic properties of the fenugreek-identified phytochemicals have also been studied as previously described (Alreshidi et al., 2023; Rahmouni et al., 2022). The computational assessment of these parameters was based on the ADME/Tox measurements (for absorption, distribution, metabolism, excretion, and toxicity) (Othman et al., 2021; Bédoui et al., 2024)..
Statistical analyses
The statistical analysis was conducted using the GraphPad software program developed by SPSS Inc., based in Chicago, IL. The data are presented as the mean plus the standard error of the mean (SEM). The statistical analysis involves conducting a one-way analysis of variance (ANOVA) and subsequently applying the Newman-Keuls post hoc test. The statistical differences will be deemed significant if the p-value is more than 0.05.