3.1. Mass Loss Method
Equation (1) was used to obtain the inhibition ratios at temperatures between (25 and 45°C). According to the findings, values for the (P.cubebaOE) extract's CR and% IE were determined. Table 2 and Fig. 2 display the findings. The findings demonstrated that adding more (P.cubebaOE) extract raises the inhibition ratios, which were observed to decrease with rising temperature. This is because the plant extract occurs to desorb from the metal's surface. It was determined that the optimal concentration for the inhibition process was 300 ppm, which yielded the maximum inhibition rate of 96%. These findings allow us to draw the conclusion that this the high efficiency of this plant extract in the process of inhibiting corrosion C-steel in 1.0 M H2NSO3H solution.
Table 2
states several levels of prevention for 1 M H2NSO3H's aggressive effects on C-steel at different levels either together with and with no P.cubebaOE.
|
[conc.], ppm
|
θ
|
%IE
|
|
50
|
0.856
|
85.6
|
|
100
|
0.877
|
87.7
|
|
150
|
0.897
|
89.7
|
|
200
|
0.920
|
92.0
|
|
250
|
0.938
|
93.8
|
|
300
|
0.960
|
96.0
|
3.2 Adsorption Isotherm
The corrosion process is considered by thermal isotherms to be primarily dependent on the amount of surface coverage Ɵ, making it another component of IE, where Ɵ = IE/100. The Langmuir adsorption isotherm has been proven to be the best curve to characterize the inhibitory performance after numerous attempts to adopt a relationship between the degree of coverage Ɵ and the greatest concentration of the inhibitor at a specific temperature. For the plant extract (Fig. 3), The concept that the metallic surface has a certain amount of adsorption cores and that each center has a particular kind of adsorbent can be summed up in the equation [31]below.:
$$\frac{C}{Ɵ}=\frac{1}{{K}_{ads}}+C$$
2
The net energy Goads signifies were derived using the formula after the adsorption factor Kads' quantity had been established.:
$$K= \frac{1}{55.5} {exp}^{\frac{{-Δ G}_{ads}}{RT}}$$
3
The level of concentration of water on the metal surface is 55.5 in mol/L. The distributions of Gads as a reflection of temperature are shown in Table 4 at an average temperature around 298 & 318 K. As a direct consequence of the findings, we derived an association between Goads and T (Fig. 3), which means that Goads is strongly influenced on temp. This formula [32]can be used to compute the entropy (Sads) and enthalpy of Adsorption capacities (Hads):
$${Δ G^\circ }_{ads }= {Δ H}_{ads}^{^\circ }-T{Δ S}_{ads}^{^\circ }$$
4
The negative Gads values increased with the increase of %IE values, which confirm the stability of the adsorbent layer physical adsorption, can indicate the extract's spontaneous sorption on the outer layer that covers C-steel. We discover that as Gads increases, the values of the inhibition ratios rise as well, and as Hads has a sign that is negative, we infer that the adsorption of the extract on the surface of the C-steel is an exothermic operation., meaning that %IE decreases as temperature rises. On the other hand, the rise in solvent entropy when disorder develops at the metal/solution interface is what is responsible for the positive value of Soads. This is a result of P.cubebaOE molecules dislodging H2O molecules from the metal surface in the test medium.
Table 3
Data on P.cubebaOE adsorption at multiple temperatures on a C-steel outer layer in 1 M H2NSO3H
|
Temperature,oC
|
Kads x 10− 3
M− 1
|
-ΔGᵒads
kJ mol− 1
|
ΔHᵒads
kJ mol− 1
|
ΔSᵒads
J mol− 1
|
|
25
|
2.02
|
15.32
|
118.60
|
44.2
|
|
30
|
1.96
|
15.60
|
48.90
|
|
35
|
1.93
|
21.00
|
65.05
|
|
40
|
0.98
|
21.14
|
68.62
|
|
45
|
0.940
|
21.50
|
68.79
|
3.3 Potentiodynamic Polarization (PDP) tests
The usual curves that characterize the polarization of C-steel in a 1M H2NSO3H medium are shown in Fig. 4. The voltage and current have both increased in value until they have reached their highest peak without being inhibited, as seen by the curve of polarization[30, 33]. With the inhibitor, there was noticeably less cathodic and anodic current density as well. Additionally, the Ecorr value is altered by the presence of (P.cubebaOE). An inhibitor can be classified as cathodic or anodic if the Ecorr movement has a value higher than 85 mV; otherwise, if the displacement is lower than 85 mV, it can be classified as mixed. The present investigation's experimental inhibitor showed an optimal Ecorr shift value of 85 mV, indicating that it is a mixed-type inhibitor. Increased (P.cubebaOE) concentration prevents anodic corrosion of C-steel electrodes, as seen in Fig. 3. Additionally, (P.cubebaOE) suppresses the cathodic response less than the anodic reaction when it is present. As demonstrated in Table 6, (P.cubebaOE) elevates the values of ßa for (P.cubebaOE) above those obtained using a blank in the event that there is no of (P.cubebaOE). As a result, the oxidation mechanism is suppressed by the (P.cubebaOE), thus regulating the anodic processes on the metal's outermost layer. [34]
Table 4
illustrates the corrosive potential (Ecorr), corrosive density of current (icorr), the Tafel slopes (a, c), degree of surface coverage (θ ), and the inhibition effectiveness (%IE) of C-steel for P.cubebaOE in 1M H2NSO3H at 25oC.
|
Inhibitor
|
[conc.] ppm
|
-Ecorr Mv vs SCE
|
Icorrx10−4 µA cm-2
|
βa,
mV dec− 1
|
βc,
mV dec− 1
|
ϴ
|
%IE
|
|
Blank
|
0
|
867
|
301.0
|
366
|
390.0
|
0.0
|
0.0
|
|
P.cubebaOE
|
50
|
847
|
173.0
|
319
|
281
|
0.425
|
42.5
|
|
100
|
852
|
149.0
|
277
|
250
|
0.504
|
50.4
|
|
150
|
742
|
69.7
|
340
|
130
|
0.768
|
76.8
|
|
200
|
938
|
47.8
|
82
|
93
|
0.841
|
84.1
|
|
250
|
854
|
39.7
|
157
|
59
|
0.868
|
86.8
|
|
300
|
552
|
25.8
|
64
|
57
|
0.914
|
91.4
|
3.4 Electrochemical Impedance Spectroscopy (EIS) tests
We additionally utilized the EIS approach to assess the rusting behavior of C-steel in 1M sulphamic acid solution, as well as zero concentration and addition a variety of P.cubebaOE doses[35]. The hard exterior of the C-steel electrode generated unfinished circular shapes with a time variable to appear on Nyquist plots. The capacitive ring's dimensions substantially increases when the inhibitor gets added to the 1M concentrations of H2NSO3H, and this growth strengthens as the inhibitor's level rises. The observations point to a shielding layer has formed and those inhibitory molecules are bound to the surface of C-steel. This layer substantially reduces the surface area that is actively oxidizing of C-steel, promotes its durability against corrosion, and diminishes rust start in due to the presence of a 1M H2NSO3H solution[36]. While the Rct value goes up as the inhibitor dosage rises, the impedance values shown in Table 5 demonstrates that the inhibitory action turns into more intense in acidic conditions. As a consequence of this, as C-steel disintegrates a barrier develops at the metal solution interface. This barrier implies that just a single charge transfer process utilized place, and that the connected molecule had no impact on this mechanism. As the inhibitor conc. rises the capacitance value of the double layer drops. The densities of the shielding layer and the electrical double layer varies. Both the weight loss and polarization procedures achieve comparable consequences in terms of IE adoption.
(CPEs), specifically CPEf and CPEdl, have been used in place of all capacitance elements in Fig. 4. Rs stands for the solution resistance, and CPEf for the capacitance of a passive film. Rf is equivalent to the ionic resistance in passive films. CPEdl stands for the capacitive action of the two-layer corroded region, while Rct symbolizes for the amount of charge transmit barrier. Furthermore demonstrated in Fig. 6 (a and b[37], Nyquist and Bode diagrams for C-steel rusting in 1M H2NSO3H solution are highlighted according to phase angle and frequency. Find the circuit's double-layer capacitance, Cdl, using the following equation.
$${C}_{dl}= {Y}_{O} \left({\omega }_{max}\right)n-1$$
5
where fmax is the resonance frequency at which the simulated portion of the impedance is full, Y0 is the absolute value of the CPE, max = 2fmax, and factor n a varies from 0.50 to 1.0[38]. The general curves' similarity (with or without an inhibitor) demonstrates that the corrosion mechanism remains unchanged. As additional proof, it was demonstrated that Bode plots prevented by a phase angle increase had a higher degree of phase angle. With a rise in phase angle values, shielded surfaces' morphology got better. Nyquist curve diameters and phase angle values in Bode plots increase when P.cubebaOE is concentrated (Fig. 6b).
Table 5
P. cubebaOE doses with and without respect to the kinetics of C-steel electrochemistry in H2NSO3H.
|
Inhibitor
|
inh ,ppm
|
Rct,Ω cm2
|
Cdl x10− 4,µFcm− 2
|
ϴ
|
% IE
|
|
Blank
|
0
|
110.5
|
9.77
|
0.0
|
0.0
|
|
P.cubebaOE
|
50
|
339.7
|
8.03
|
0.674
|
67.4
|
|
100
|
498.5
|
3.91
|
0.778
|
77.8
|
|
150
|
544.5
|
3.62
|
0.797
|
79.7
|
|
200
|
1219
|
0.231
|
0.909
|
90.9
|
|
250
|
1397
|
0.129
|
0.921
|
92.1
|
|
300
|
1492
|
0.112
|
0.926
|
92.6
|
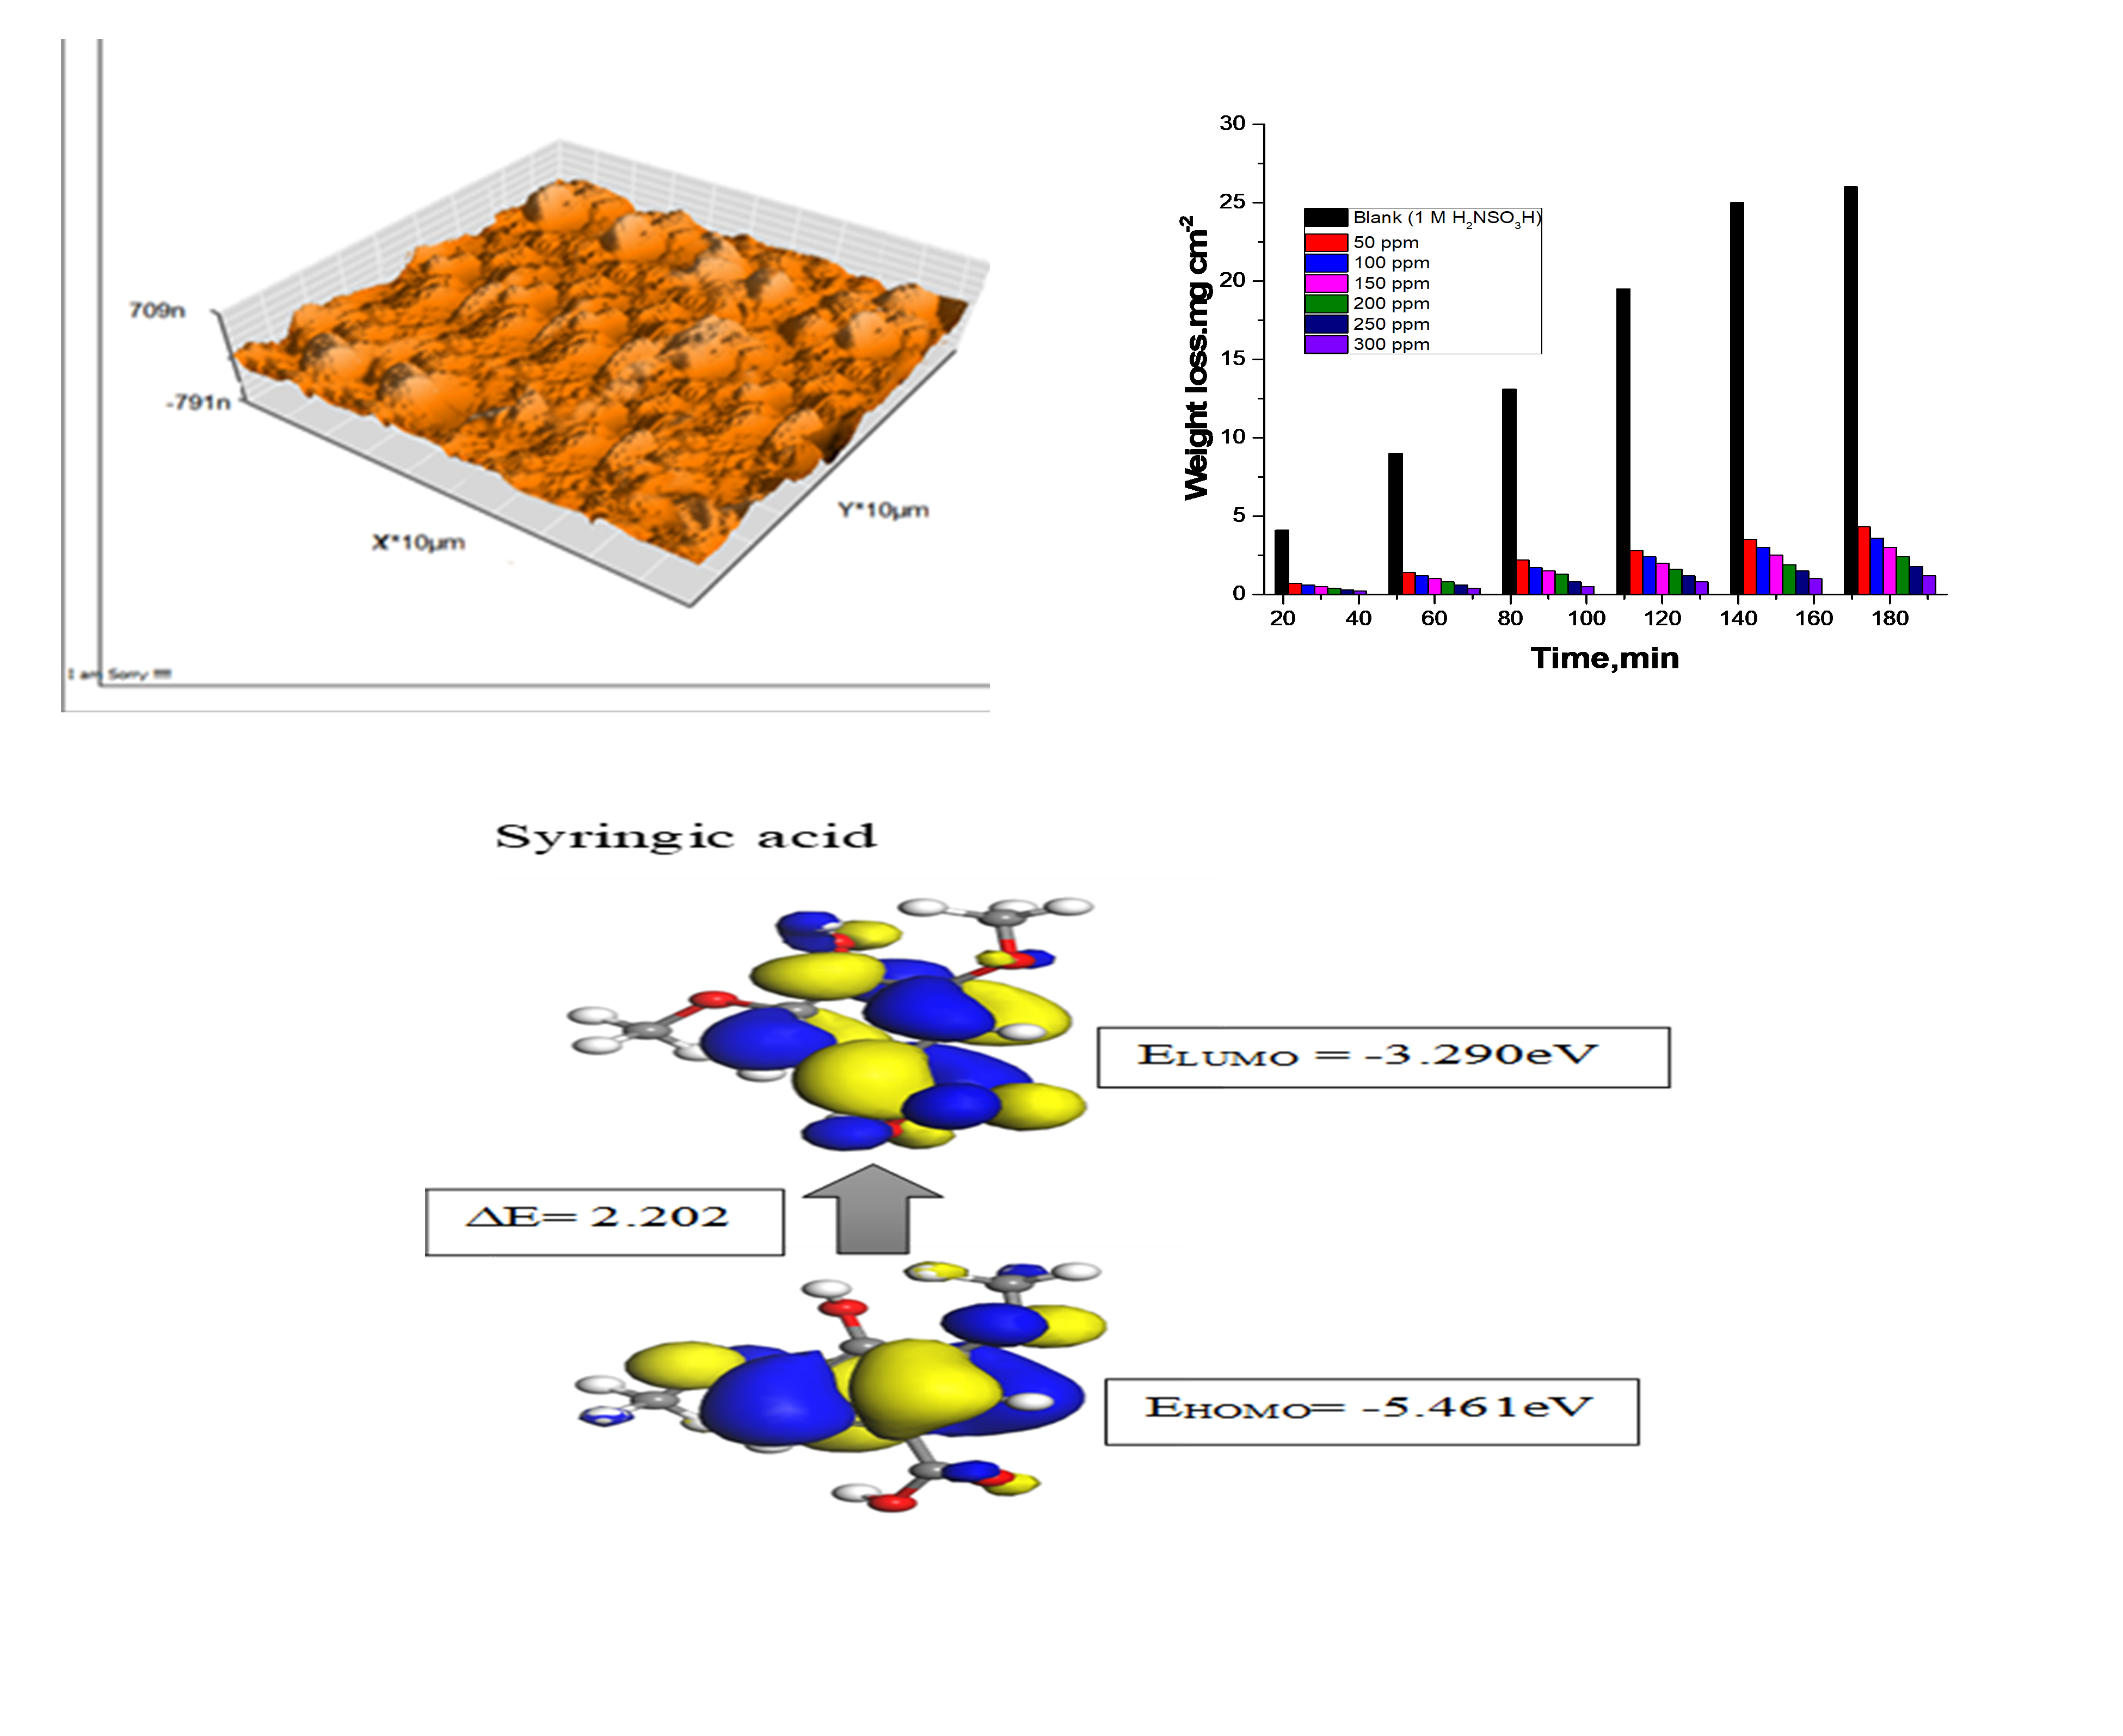
3.5 Molecular modelling
3.5.1 HOMO-LUMO molecule orbital
The LUMO and HOMO density profiles of the studied chemical in the aqueous phase are shown in Fig. 7. It demonstrates that whereas green has a low electron density, red has a high electron density. In situations where there is a high electron density, the metal surface can donate electrons. Electrons are attracted to the metal surface in the green region. Since resonance is primarily brought on by the bonds between the oxygen and nitrogen atoms on the benzene ring, the distribution of these two locations must be carefully considered. In the interim, the carbon atoms are the core of the LUMO. Improved inhibitory efficiency may be indicated by lower E values. The inhibitor molecule's reactivity to the metal atom can be evaluated using the E value. Lower E values may indicate improved inhibition efficiency. The E value can be used to assess the reactivity of the inhibitor molecule to the metal atom. The DFT simulations have shown that – (-) catechin (E = 2.79) is the most stable.
Table 6
Determined quantum for P.cubebaOE
|
Compound
|
EHOMO
|
ELUMO
|
ΔE = E LUMO- E HOMO
|
|
Rutin
|
-4.514eV
|
-3.486eV
|
1.028
|
|
Caffeic Acid
|
-5.223eV
|
-3.549eV
|
2.738
|
|
Ferulic Acid
|
-5.198eV
|
-3.490eV
|
1.708
|
|
Gallic Acid And
|
-5.575eV
|
-3.444eV
|
2.131
|
|
Syringic Acid
|
-5.461eV
|
-3.290eV
|
2.202
|
|
Catechin
|
-5.112eV
|
-2.322eV
|
2.79
|
3.5.2 2D maps of electrostatic potential
The distribution of electrons and, subsequently, where they are concentrated within each molecule can be seen using ESP maps. According to the electron density contour maps, oxygen atoms on the examined molecule inhibitor appear to be favorable interaction locations, which is in line with the different functions of oxygen and the other atoms. The contact regions that provide the bonding contacts between metal surfaces and inhibitor are surrounded by a dark red outline. The distribution of electrons and, subsequently, where they are concentrated within each molecule can be seen using ESP maps.
3.6 SEM examination
SEM research has verified the P.cubebaOE layer's adsorption on the surface of C-steel. Figures (9 a- c) depict SEM images of C-steel's surface before and after 48 hours of immersion in 1 M H2NSO3H with a dosage of 300 ppm of P.cubebaOE. Without having P.cubebaOE, H2NSO3H corrosion has clearly harmed the C-steel surface, but the metallic edge is still discernible (Fig. 9b). The metal surface, in variance with the material under assessment, appears not to rust (Fig. 9c). It was found that the extract created a slight film on the C-steel's outside that restricted corrosion.[39]
3.7 Atomic Force Microscope (AFM)
The metal surface of the C-steel without the investigated P.cubebaOE inhibitor has reportedly been repeatedly corroded by the corrosive attacks of the 1M sulphamic acid (Fig .10b), according to the 3D picture of the C-steel. The 3D images (Fig. 10c) that reveal smoother surfaces than the blank, however, show that the addition of an inhibitor lessens C-steel corrosion in the aggressive solution. Table 6 shows the mean roughness (Sa) and average RMS roughness (Sq) of the films generated on the Cu surface in accordance with the modular program Gwyddion. The RMS roughness and mean roughness of the blank are greater than those of the inhibitor under study and pure metal, as shown by the data in Table 6, demonstrating the effectiveness of the compound in shielding C-steel 's surface from corrosive medium. The AFM data add to the body of information supporting the sequence of inhibitory efficacy discovered by weight loss research and electrochemical tests.
Table 7
AFM parameters of P.cubebaOE compounds
|
Sample
|
RMS roughness (Sq), nm
|
Mean roughness (Sa), nm
|
|
a
|
22.97
|
17.64
|
|
b
|
1234.9
|
993.76
|
|
c
|
285.83
|
180.68
|
3.8 Fourier transforms infrared spectroscopy (FT-IR) studies
Figure 11confirms that "the -C = O stretching frequency occurs at 1640 cm− 1, with the acute one at 1608 cm− 1 referring to -C = C stretching, the O-H stretching has changed from 3225 cm− 1 to 3365 cm− 1, and the -C = C stretching frequency shifts from 1647 cm− 1 to 1640 cm− 1 in the film generated on the C-steel submerged in sulphamic acid."The alterations in the IR spectra hint that the bonding of P.cubebaOE with C-steel was accomplished through groups of functions that had already existed in it.
Rusty Inhibition Process
Some plant-based extracts have a restrictive acting characteristic that has been speculated to be attributed to the adsorption of the Phyto-chemical components found in the extract of leaves on the metal surface, which maintains the metal's outermost layer and stops the corrosion process from proceeding. How the inhibitor adsorbs is influenced by the chemical composition of the Phyto-components present, the charge on the metal surface, and the nature of the corrosive media. The inhibitor molecules in our work are electrostatically drawn to the metal surface because the C-steel surface bears a positive charge under acidic conditions. Due to the electrostatic interaction (physical adsorption), (SO3-) ion adsorption on the outermost layer of the metallic substance increases the amount of inhibitor molecules that can adsorb on the C-steel surface by generating an additional negative charge close to the corrosive solution. The chemisorption processes, on the other hand, are made possible by the donation of electron lone pairs on heteroatoms like N, O, and the aromatic ring contains electrons in order to attach to the open d-orbital of C-steel ions. The surface becomes more negatively charged when the surface is saturated with one electron[40]. The electron in C-steel's d-orbital is then moved (retro-donated) to the open -antibonding orbital of the inhibitor molecules in order to remove the extra electron from the surface[41, 42]. Thus, the C-steel's anodized and either cathodic process in the H2NSO3H medium are effectively inhibited by the formation of a durable barrier film. All of this leads us to the conclusion that a number of fundamental mechanisms that the high proportion of %IE is a consequence of chemicals adhering to the metal's surface[43, 44]. In Table 9, the percentage of P.cubebaOE in the current investigation is contrasted with values previously reported in the literature in acidic media[45, 46]. The P.cubebaOE clearly produced 96.0% IE at 300 ppm, indicating that it functions effectively as a sulphamic acid corrosion-preventing agent for C-steel[1].
Table 7
A comparison of P.cubebaOE with some other studied (%IE is reported at the maximum) extracts
|
Source of extract
|
Test medium
|
Metal/Alloy
|
% IE
|
References
|
|
Orange peels
|
HCl and H2SO4
|
Cu
|
43.0
|
[42]
|
|
Mangrove tannin
|
HCl
|
Cu
|
82.4
|
[44]
|
|
Myrtus communis
|
H2SO4
|
Cu
|
> 85.0
|
[47]
|
|
Alhagi Mauro rum plant extract
|
H2SO4
|
Cu
|
33.0–83.0
|
[43]
|
|
Egyptian licorice extract
|
HCl
|
Cu
|
55.0–89.0.0
|
[45]
|
|
Exudate gum from Dacryodes edulis
|
HCl
|
Al
|
42.0
|
[46]
|
|
Opuntia ficus indica
|
HCl
|
C-steel
|
70.0–91.0
|
[48]
|
|
Piper cubeba official extract
|
H2NSO3H
|
C-steel
|
96.0
|
Our results
|